An Overview of Agricultural Mechanization in Sub...
20
An Overview of Agricultural Mechanization in Sub Saharan Africa By: Geoffrey C. Mrema Department of Engineering Sciences & Technology College of Agriculture Sokoine University of Agriculture [SUA] MOROGORO, TANZANIA
Transcript of An Overview of Agricultural Mechanization in Sub...

An Overview of Agricultural
Mechanization in Sub Saharan
Africa
By: Geoffrey C. Mrema
Department of Engineering Sciences & Technology
College of Agriculture
Sokoine University of Agriculture [SUA]
MOROGORO, TANZANIA

Outline of the Presentation
• Introduction : The Agric. Mechanization Process
• Recap on the Evolution of Mechanization in SSA
• Current Status of Agric. Mechanization in SSA
• Some Observations and Lessons from the Past Experience
• Concluding Comments
Presentation to the Nairobi Consultative Meeting on New Models for SAM in SSA - 1st December, 2016

The Agricultural Mechanization Process - 2
• The role of farm power in increasing agricultural productivity globally first hypothesized in 1965 by Prof. Giles:
– Farm power with fertilizers, improved seeds[HYVs], irrigation and pesticides - are interdependent for growth in agricultural productivity and overall growth
– Success of the GR of 1970s in Asia attributed mostly to use of HYVs; fertilizers and irrigation and the role of farm power not factored in
• Mechanization experience from USA & Europe during 1925 –65:
– According to Smith(2000) the tractor was the “Unsung Hero” of 20th Century USA economic growth – replaced 24 million draft animals during 1925 to 1955.
– Similar developments occurred in Europe between 1945 and 1965 which were significantly assisted by the USA funded Marshall Plan
• At independence in 1960, the advent of mechanization in developing countries of Asia, Africa & LAC was then equated to ‘tractorization’ was taken for granted by most development experts & politicians
Presentation to the Nairobi Consultative Meeting on New Models for SAM in SSA - 1st December, 2016

The Agric. Mechanization Process - 3
• Assumed use of tractors would become widespread through
– Direct ownership of tractors by farmers
– Or through hire services owned by the public or private sectors
• Asia had several centuries experience of using draft animal technology [DAT] and the farm power debate was on:
– Replacement of draft animals in field operations
– Increasing use of electrical/diesel pumps in irrigation
– Post-harvest processing equipment – threshers etc.
• Sub Saharan Africa [SSA] situation was different:– Large parts of SSA tsetse infested – difficult to keep livestock except southern part or in
pastoral areas - crop production dominated by cutlass and hand hoe cultivation
– Debate was on whether SSA could leapfrog DAT stage and move directly to mechanical power e.g. tractors [Dummont, 1966; de Wilde, 1967; Kline et al 1969 & among others]
– Political desire for rapid mechanization supported throughout SSA
Presentation to the Nairobi Consultative Meeting on New Models for SAM in SSA - 1st December, 2016

Presentation to the Nairobi Consultative Meeting on New Models for SAM in SSA - 1st December, 2016
Sources of power for primary land preparation in SSA
Source: FAO 2001
50
54
70
85
32
21
22
11
17
25
8
4
0% 20% 40% 60% 80% 100%
Eastern Africa
Southern Africa
Western Africa
Central Africa
% cultivated area hand DAP tractors

Evolution of Agricultural Mechanization in SSA -1
• History of agricultural mechanization from Colonial period
1. Before 1930 – Largely hand tool technology – slash & burn and
introduction of Draft Animal Technology [DAT] in drier parts
2. 1930- 45: – Expansion of DAT use and introduction of cash crops –mostly perennial – coffee, sisal, tea and annual cotton with DAT.
3. 1945–60: – Four–wheel tractors introduced:
• Great Groundnut Scheme of 1945 to 51 – over 3 million acres mechanized production oilseeds in Tanganyika, Botswana; Ghana and Nigeria – FAILED
• Commercial farming by White settler farmers and African medium scale farmers: Kenya; Zimbabwe; Zambia; Tanganyika; Malawi
» Cultivation of cash crops and cereals; Subsidies provided
» Swynerton Plan in Kenya – consolidated surveyed small farms of about 10ha in Kenya Highlands – mechanization important
» Yoeman Farmers in parts of the colonies – medium commercial scale growing food and cash crops for the market
Presentation to the Nairobi Consultative Meeting on New Models for SAM in SSA - 1st December, 2016
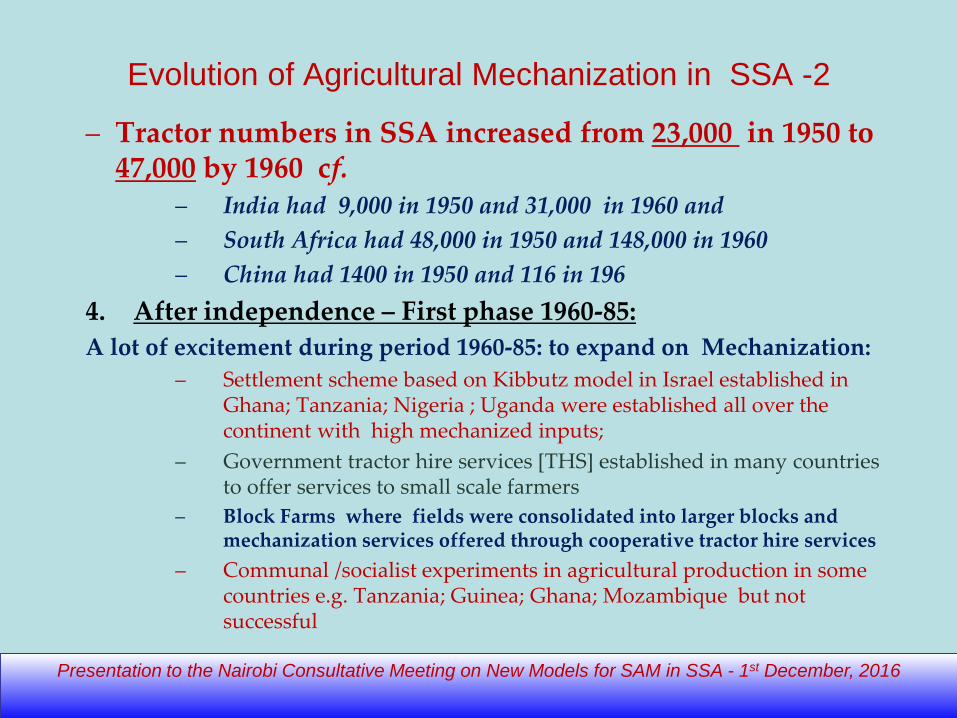
Evolution of Agricultural Mechanization in SSA -2
– Tractor numbers in SSA increased from 23,000 in 1950 to 47,000 by 1960 cf.
– India had 9,000 in 1950 and 31,000 in 1960 and
– South Africa had 48,000 in 1950 and 148,000 in 1960
– China had 1400 in 1950 and 116 in 196
4. After independence – First phase 1960-85:
A lot of excitement during period 1960-85: to expand on Mechanization:
– Settlement scheme based on Kibbutz model in Israel established in Ghana; Tanzania; Nigeria ; Uganda were established all over the continent with high mechanized inputs;
– Government tractor hire services [THS] established in many countries to offer services to small scale farmers
– Block Farms where fields were consolidated into larger blocks and mechanization services offered through cooperative tractor hire services
– Communal /socialist experiments in agricultural production in some countries e.g. Tanzania; Guinea; Ghana; Mozambique but not successful
Presentation to the Nairobi Consultative Meeting on New Models for SAM in SSA - 1st December, 2016

Evolution of Agricultural Mechanization in SSA - 3
• Manufacturing of tractors and farm implements established in some countries e.g. Nigeria; Tanzania etc. mostly in assembling of SKD parts
• DAT promoted in some countries especially drier areas but also in the humid zones focusing on cultivation of cash crops – success limited to drier parts
• Impact of these early efforts of first quarter century after independence [1960-85] include:
– No. of Tractors in use in SSA [excluding South Africa] increased from 47,000 in 1960 to 70,000 by 1970 and 112,000 by 1980 [cf. data for India for 1960, 1970 and 1980 were 31,000; 148,000 and 393,000 respectively]
– Land preparation by tractors in SSA by 1985 remained low about 10% while DAT was used in about 15% and hand-hoe on 75%
– Government operated tractor hire services [THS] failed although no of tractors under Government THS not more than 10% of total no. in use
– Graveyards of broken down machinery had significant impact on thinking on mechanization in the development community e.g. False Start in Africa by French Sociologist Rene Dumont quite influential
Presentation to the Nairobi Consultative Meeting on New Models for SAM in SSA - 1st December, 2016

Current Status of Agric. Mechanization in SSA - 1
• Other issues on current status both +ve & -ve:
– Importation of 4WT has increased since 2005 in many SSA countries. Not clear
whether replacing or adding on the 4WT numbers. Need for more accurate data on
this.
– Importation of 2WT accelerated since 2005. A new power source use of which is
not yet well researched documented
– Both 4WT and 2WT concentrated in a few regions in most countries with the same
trend observed for DAT. All these power sources used primarily for tillage and
transportation
– DAT has severe limitations in many countries – tsetse flies; lack of animal husbandry
tradition; increasing demand for livestock products; maintenance load during off-
season for feed, herding etc.
– Pan territorial & across country utilization of 4WT especially for tillage and also some
harvesting equipment is increasing & will have +ve effect on sustainability of the
business models for Tractor Hire Services [THS] and also harvesting equipment –
but more data required
– Period when 4WT and 2WT can be used for land preparation at any one place
limited to less than 40 days per rainy season – severely restricts utilization rates -
Need for off-farm utilization [in transportation etc.] is critical for business viability &
sustainability
Presentation to the Nairobi Consultative Meeting on New Models for SAM in SSA - 1st December, 2016

Share of cultivated area under cereals and roots/tubers
cultivation by region (2004)
Presentation to the Nairobi Consultative Meeting on New Models for SAM in SSA - 1st December, 2016
70%
98%
67%
83%
98%93% 96%
3% 2%
33%
17%
2% 7% 4%
0%
20%
40%
60%
80%
100%
120%
WestAfica
SouthernAfrica
CentralAfrica
EasternAfrica
NorthAfrica
LAC Asia
Cereal Roots and Tubers
Source: FAOSTAT/IFPRI -2014
Presentation to the Nairobi Consultative Meeting on New Models for SAM in SSA - 1st December, 2016
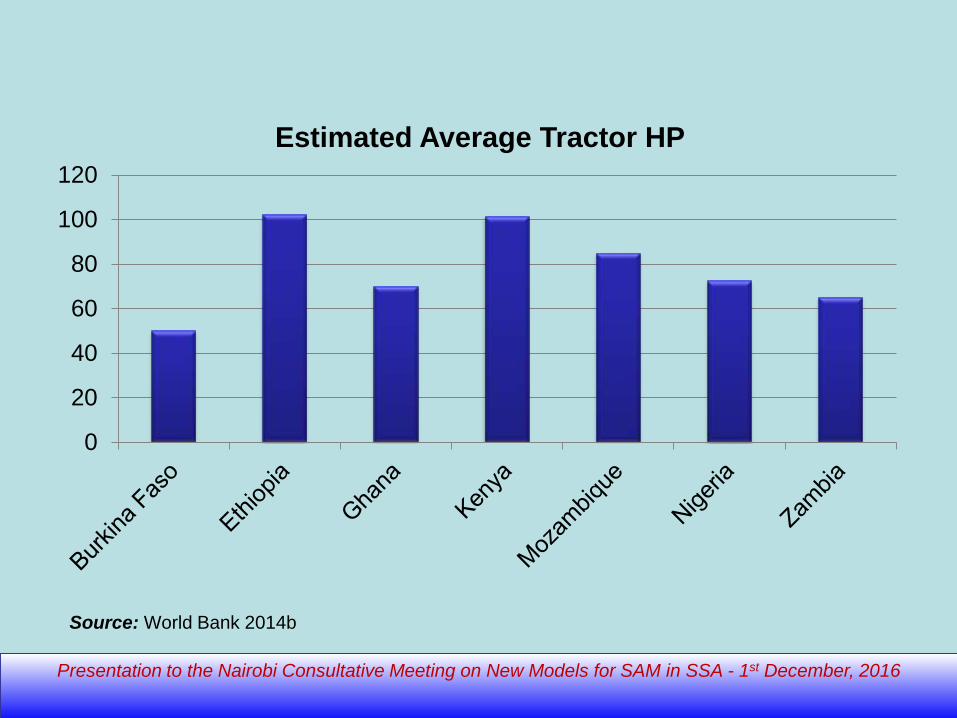
0
20
40
60
80
100
120
Estimated Average Tractor HP
Source: World Bank 2014b

Presentation to the Nairobi Consultative Meeting on New Models for SAM in SSA - 1st December, 2016
0
20000
40000
60000
80000
100000
120000
140000
CEMAC ECCAS EAC IGAD ECOWAS SADC
Number of 4WT in use [2005]
Source: FAOSTAT
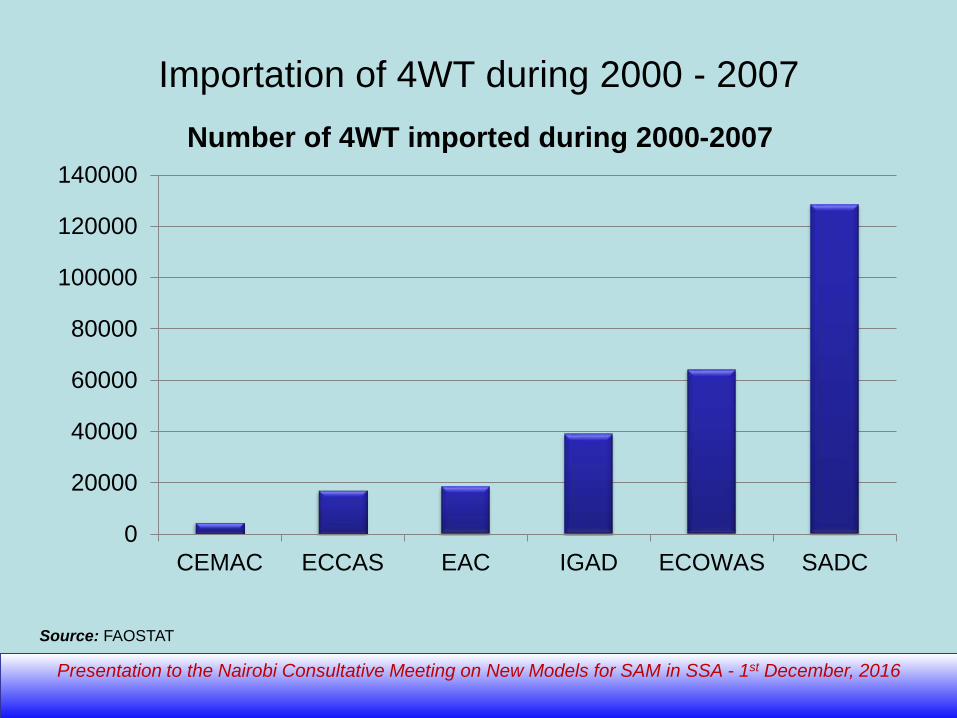
Importation of 4WT during 2000 - 2007
Presentation to the Nairobi Consultative Meeting on New Models for SAM in SSA - 1st December, 2016
0
20000
40000
60000
80000
100000
120000
140000
CEMAC ECCAS EAC IGAD ECOWAS SADC
Number of 4WT imported during 2000-2007
Source: FAOSTAT

Importation of 2WT
Presentation to the Nairobi Consultative Meeting on New Models for SAM in SSA - 1st December, 2016
0
2000
4000
6000
8000
10000
12000
14000
16000
CEMAC EAC ECOWAS IGAD ECCAS SADC
Number of 2WT imported during 2000-2007
Source: FAOSTAT
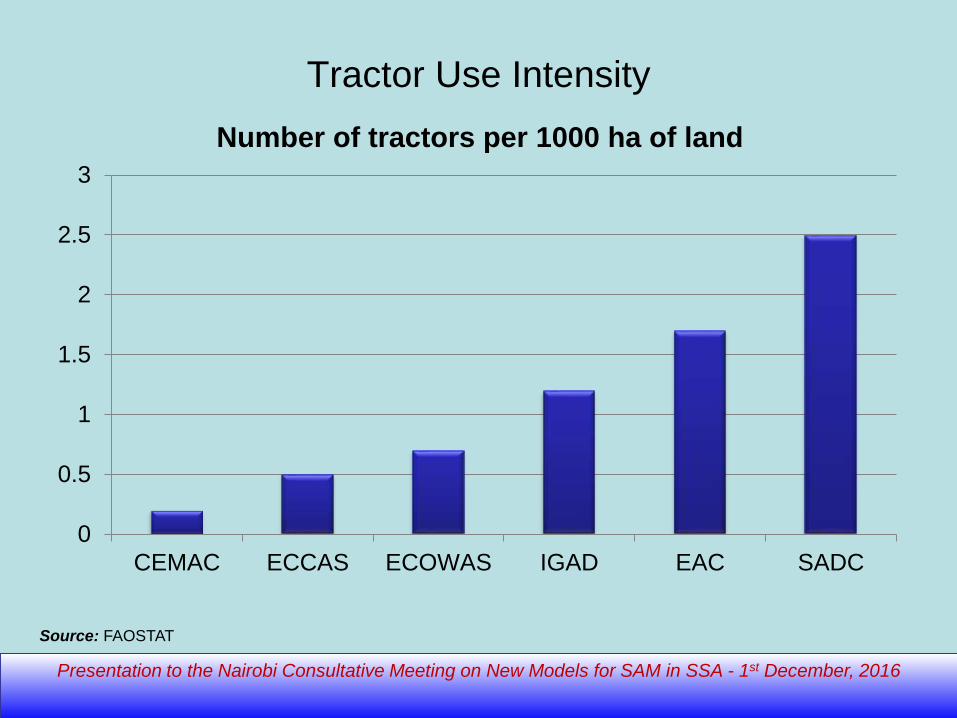
Tractor Use Intensity
Presentation to the Nairobi Consultative Meeting on New Models for SAM in SSA - 1st December, 2016
0
0.5
1
1.5
2
2.5
3
CEMAC ECCAS ECOWAS IGAD EAC SADC
Number of tractors per 1000 ha of land
Source: FAOSTAT

Ploughing Costs in Selected Countries
Presentation to the Nairobi Consultative Meeting on New Models for SAM in SSA - 1st December, 2016
0
20
40
60
80
100
120
140
160
180
Cost of Plowing 1 ha (USD) - 2014
Source: FAOSTAT/IFPRI-2014

• Need to view agricultural mechanization with a long term
perspective especially on Farm Power issues: – Asia is largely moving out of animate power for primary land preparation;
– Ethiopia has set a target of reducing DAP by 50% by 2035
– Tanzania is setting out a process of getting rid of the hand hoe by 2035
• Need to learn from our past experience both successful
and failed projects – too much repetition of past mistakes
• Need to learn from others especially where mechanization
has occurred in recent past and from other countries in SSA
• Agricultural mechanization is critical to the future of
agricultural development and food security in SSA
• Two concluding slides : from Fan & Pardey and UNFPA
Concluding Remarks
Presentation to the Consultations at FAO-SFE Addis 24th Oct. 2016Presentation to the Nairobi Consultative Meeting on New Models for SAM in SSA - 1st December, 2016

Accounting for Growth in Agricultural Output
in China 1965 - 89
Presentation to the Nairobi Consultative Meeting on New Models for SAM in SSA - 1st December, 2016
Factor % Contribution to growth
Land -0.9
Irrigation 3.3
Labour 3.4
Power 11.8
Institutional change 13.8
Research 19.8
Fertilizer 21.3
Other factors 27.6
Total 100%
Source: Fan & Pardey (1992)

Presentation to the Nairobi Consultative Meeting on New Models for SAM in SSA - 1st December, 2016
Concluding Remarks
0
100
200
300
400
500
600
700
1980 1990 2000 2010* 2020* 2030*
num
ber
of p
opul
atio
n (m
illio
ns)
Population in Sub-Saharan Africa
rural population
urban population
Source: FAOSTAT

THANK YOU!