An Overview i2e for Telecom - Scarsin · An Overview i2e for Telecom A more agile approach to...
4
BACKGROUND Similar to other large organizations, telecommunication providers are challenged with restructuring and implementing cost cutting measures in order to streamline processes, reduce redundancies and control costs. With increasing competition, operational executives are introducing new processes that will result in a more agile organization. This industry has moved from a product-centric to a customer-centric approach and the need for better customer service and enhanced insights into customer behavior is critical. Improving the customer experience and overall performance at all levels of the company is the key to competitive advantage as well as ensuring that front line workers are aligned with the company’s strategy. In order to achieve this, accurate, timely and detailed level data is required in a format that business stakeholders can consume, distribute and base important decisions on. An Overview i2e for Telecom A more agile approach to Telecom BI i2e provides one fully integrated platform delivering: SPEED AGILITY COST EFFECTIVENES
Transcript of An Overview i2e for Telecom - Scarsin · An Overview i2e for Telecom A more agile approach to...

B A C K G R O U N D
Similar to other large organizations, telecommunication providers are challenged with restructuring and implementing cost cutting measures in order to streamline processes, reduce redundancies and control costs. With increasing competition, operational executives are introducing new processes that will result in a more agile organization.
This industry has moved from a product-centric to a customer-centric approach and the need for better customer service and enhanced insights into customer behavior is critical. Improving the customer experience and overall performance at all levels of the company is the key to competitive advantage as well as ensuring that front line workers are aligned with the company’s strategy.
In order to achieve this, accurate, timely and detailed level data is required in a format that business stakeholders can consume, distribute and base important decisions on.
A n O v e r v i e w i 2 e f o r T e l e c o mA more agile approach to Telecom BI
2 Brock Street West, Suite 201 Uxbridge, Ontario, Canada L9P 1P2 Phone 1•905•852•0086 www.scarsin.com
A B O U T S C A R S I N Scarsin is a software development and service company specializing in enterprise-class Business Intelligence. Scarsin’s Integrated Insight Environment (i2e) platform supports global organizations’ critical business processes.
Scarsin’s team of experts has managed a diverse portfolio including Revenue programs, Planning/Implementation, Speech/Data Analytics, Budget Planning, and Performance Management, creating and implementing policy roadmap for 8000+ front-line agents and delivered a year over year revenue improvement.
i2e is an end-to-end BI platform designed to integrate all complex BI processes into a unified solution, with a focus on business friendly processes and direct integration with Microsoft Office.
business stakeholders can consume, distribute and base important decisions on.
i 2 e p r o v i d e s o n e f u l l y i n t e g r a t e d p l a t f o r m d e l i v e r i n g :
S P E E D
A G I L I T Y
C O S T E F F E C T I V E N E S
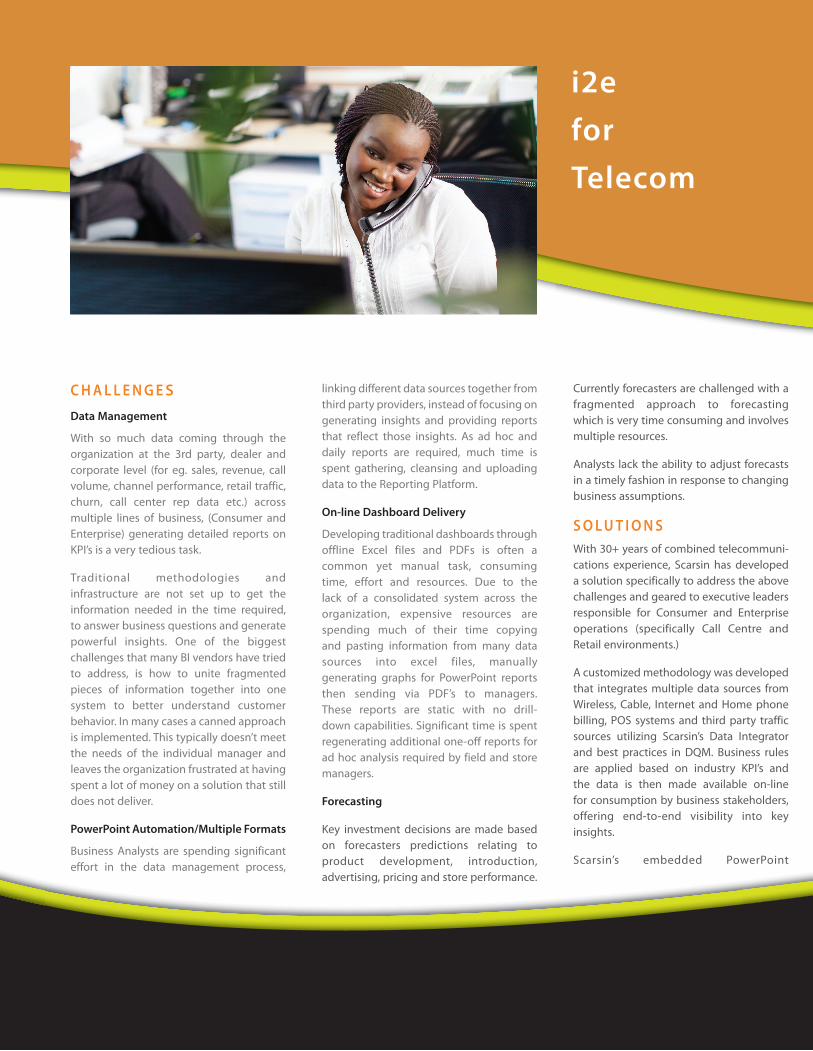
C H A L L E N G E S
Data Management
With so much data coming through the organization at the 3rd party, dealer and corporate level (for eg. sales, revenue, call volume, channel performance, retail traffic, churn, call center rep data etc.) across multiple lines of business, (Consumer and Enterprise) generating detailed reports on KPI’s is a very tedious task.
Traditional methodologies and infrastructure are not set up to get the information needed in the time required, to answer business questions and generate powerful insights. One of the biggest challenges that many BI vendors have tried to address, is how to unite fragmented pieces of information together into one system to better understand customer behavior. In many cases a canned approach is implemented. This typically doesn’t meet the needs of the individual manager and leaves the organization frustrated at having spent a lot of money on a solution that still does not deliver.
PowerPoint Automation/Multiple Formats
Business Analysts are spending significant effort in the data management process,
linking different data sources together from third party providers, instead of focusing on generating insights and providing reports that reflect those insights. As ad hoc and daily reports are required, much time is spent gathering, cleansing and uploading data to the Reporting Platform.
On-line Dashboard Delivery
Developing traditional dashboards through offline Excel files and PDFs is often a common yet manual task, consuming time, effort and resources. Due to the lack of a consolidated system across the organization, expensive resources are spending much of their time copying and pasting information from many data sources into excel files, manually generating graphs for PowerPoint reports then sending via PDF’s to managers. These reports are static with no drill-down capabilities. Significant time is spent regenerating additional one-off reports for ad hoc analysis required by field and store managers.
Forecasting
Key investment decisions are made based on forecasters predictions relating to product development, introduction, advertising, pricing and store performance.
Currently forecasters are challenged with a fragmented approach to forecasting which is very time consuming and involves multiple resources.
Analysts lack the ability to adjust forecasts in a timely fashion in response to changing business assumptions.
S O L U T I O N SWith 30+ years of combined telecommuni-cations experience, Scarsin has developed a solution specifically to address the above challenges and geared to executive leaders responsible for Consumer and Enterprise operations (specifically Call Centre and Retail environments.)
A customized methodology was developed that integrates multiple data sources from Wireless, Cable, Internet and Home phone billing, POS systems and third party traffic sources utilizing Scarsin’s Data Integrator and best practices in DQM. Business rules are applied based on industry KPI’s and the data is then made available on-line for consumption by business stakeholders, offering end-to-end visibility into key insights.
Scarsin’s embedded PowerPoint
automation enables managers on the go to automatically produce and update PowerPoint reports with drill down capabilities into key data and the ability to send via PPT, PDF or other formats.
Online interactive dashboards now provide 24/7 access and the ability to view results within minutes. Your executive team can connect and empower resources to understand the insights and have the ability to rapidly respond to business.
Forecasting
With an integrated approach to forecasting, analysts can quickly access new data and make changes to see the outcomes of various scenarios as well as compare those outcomes to previous forecasts. It is also simple to make changes that impact different departments and easily demonstrate the outcomes and report them to management. Thanks to a consolidated approach, forecasts from across the organization can be rolled up into a consolidated view, greatly improving
speed to insights and streamlining processes.
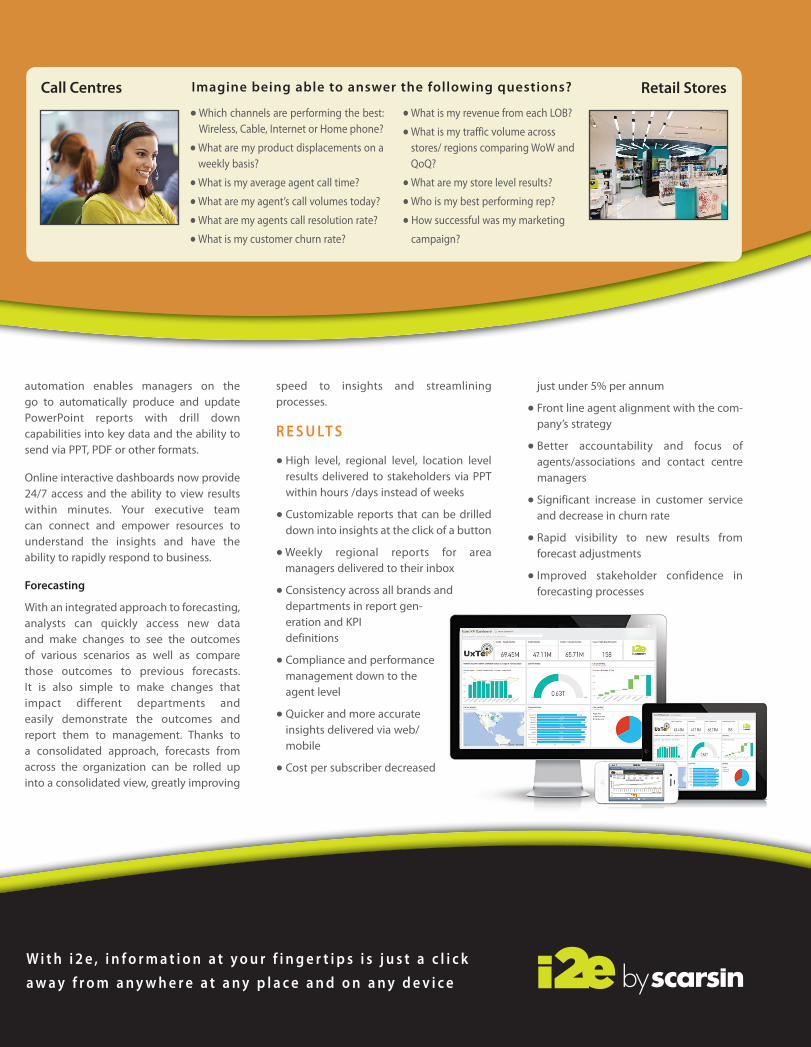
R E S U LT S
• High level, regional level, location level results delivered to stakeholders via PPT within hours /days instead of weeks
• Customizable reports that can be drilled down into insights at the click of a button
• Weekly regional reports for area managers delivered to their inbox
• Consistency across all brands and departments in report gen-eration and KPI definitions
• Compliance and performance management down to the agent level
• Quicker and more accurate insights delivered via web/mobile
• Cost per subscriber decreased
just under 5% per annum
• Front line agent alignment with the com-pany’s strategy
• Better accountability and focus of agents/associations and contact centre managers
• Significant increase in customer service and decrease in churn rate
• Rapid visibility to new results from forecast adjustments
• Improved stakeholder confidence in forecasting processes
W i t h i 2 e , i n f o r m a t i o n a t y o u r f i n g e r t i p s i s j u s t a c l i c k a w a y f r o m a n y w h e r e a t a n y p l a c e a n d o n a n y d e v i c e
• Which channels are performing the best: Wireless, Cable, Internet or Home phone?
• What are my product displacements on a weekly basis?
• What is my average agent call time?
• What are my agent’s call volumes today?
• What are my agents call resolution rate?
• What is my customer churn rate?
• What is my revenue from each LOB?
• What is my traffic volume across stores/ regions comparing WoW and QoQ?
• What are my store level results?
• Who is my best performing rep?
• How successful was my marketing
campaign?
Imagine being able to answer the following questions?Call Centres Retail Storesi2eforTelecom
C H A L L E N G E S
Data Management
With so much data coming through the organization at the 3rd party, dealer and corporate level (for eg. sales, revenue, call volume, channel performance, retail traffic, churn, call center rep data etc.) across multiple lines of business, (Consumer and Enterprise) generating detailed reports on KPI’s is a very tedious task.
Traditional methodologies and infrastructure are not set up to get the information needed in the time required, to answer business questions and generate powerful insights. One of the biggest challenges that many BI vendors have tried to address, is how to unite fragmented pieces of information together into one system to better understand customer behavior. In many cases a canned approach is implemented. This typically doesn’t meet the needs of the individual manager and leaves the organization frustrated at having spent a lot of money on a solution that still does not deliver.
PowerPoint Automation/Multiple Formats
Business Analysts are spending significant effort in the data management process,
linking different data sources together from third party providers, instead of focusing on generating insights and providing reports that reflect those insights. As ad hoc and daily reports are required, much time is spent gathering, cleansing and uploading data to the Reporting Platform.
On-line Dashboard Delivery
Developing traditional dashboards through offline Excel files and PDFs is often a common yet manual task, consuming time, effort and resources. Due to the lack of a consolidated system across the organization, expensive resources are spending much of their time copying and pasting information from many data sources into excel files, manually generating graphs for PowerPoint reports then sending via PDF’s to managers. These reports are static with no drill-down capabilities. Significant time is spent regenerating additional one-off reports for ad hoc analysis required by field and store managers.
Forecasting
Key investment decisions are made based on forecasters predictions relating to product development, introduction, advertising, pricing and store performance.
Currently forecasters are challenged with a fragmented approach to forecasting which is very time consuming and involves multiple resources.
Analysts lack the ability to adjust forecasts in a timely fashion in response to changing business assumptions.
S O L U T I O N SWith 30+ years of combined telecommuni-cations experience, Scarsin has developed a solution specifically to address the above challenges and geared to executive leaders responsible for Consumer and Enterprise operations (specifically Call Centre and Retail environments.)
A customized methodology was developed that integrates multiple data sources from Wireless, Cable, Internet and Home phone billing, POS systems and third party traffic sources utilizing Scarsin’s Data Integrator and best practices in DQM. Business rules are applied based on industry KPI’s and the data is then made available on-line for consumption by business stakeholders, offering end-to-end visibility into key insights.
Scarsin’s embedded PowerPoint
automation enables managers on the go to automatically produce and update PowerPoint reports with drill down capabilities into key data and the ability to send via PPT, PDF or other formats.
Online interactive dashboards now provide 24/7 access and the ability to view results within minutes. Your executive team can connect and empower resources to understand the insights and have the ability to rapidly respond to business.
Forecasting
With an integrated approach to forecasting, analysts can quickly access new data and make changes to see the outcomes of various scenarios as well as compare those outcomes to previous forecasts. It is also simple to make changes that impact different departments and easily demonstrate the outcomes and report them to management. Thanks to a consolidated approach, forecasts from across the organization can be rolled up into a consolidated view, greatly improving
speed to insights and streamlining processes.
R E S U LT S
• High level, regional level, location level results delivered to stakeholders via PPT within hours /days instead of weeks
• Customizable reports that can be drilled down into insights at the click of a button
• Weekly regional reports for area managers delivered to their inbox
• Consistency across all brands and departments in report gen-eration and KPI definitions
• Compliance and performance management down to the agent level
• Quicker and more accurate insights delivered via web/mobile
• Cost per subscriber decreased
just under 5% per annum
• Front line agent alignment with the com-pany’s strategy
• Better accountability and focus of agents/associations and contact centre managers
• Significant increase in customer service and decrease in churn rate
• Rapid visibility to new results from forecast adjustments
• Improved stakeholder confidence in forecasting processes
W i t h i 2 e , i n f o r m a t i o n a t y o u r f i n g e r t i p s i s j u s t a c l i c k a w a y f r o m a n y w h e r e a t a n y p l a c e a n d o n a n y d e v i c e
• Which channels are performing the best: Wireless, Cable, Internet or Home phone?
• What are my product displacements on a weekly basis?
• What is my average agent call time?
• What are my agent’s call volumes today?
• What are my agents call resolution rate?
• What is my customer churn rate?
• What is my revenue from each LOB?
• What is my traffic volume across stores/ regions comparing WoW and QoQ?
• What are my store level results?
• Who is my best performing rep?
• How successful was my marketing
campaign?
Imagine being able to answer the following questions?Call Centres Retail Storesi2eforTelecom

B A C K G R O U N D
Similar to other large organizations, telecommunication providers are challenged with restructuring and implementing cost cutting measures in order to streamline processes, reduce redundancies and control costs. With increasing competition, operational executives are introducing new processes that will result in a more agile organization.
This industry has moved from a product-centric to a customer-centric approach and the need for better customer service and enhanced insights into customer behavior is critical. Improving the customer experience and overall performance at all levels of the company is the key to competitive advantage as well as ensuring that front line workers are aligned with the company’s strategy.
In order to achieve this, accurate, timely and detailed level data is required in a format that business stakeholders can consume, distribute and base important decisions on.
A n O v e r v i e w i 2 e f o r T e l e c o mA more agile approach to Telecom BI
2 Brock Street West, Suite 201 Uxbridge, Ontario, Canada L9P 1P2 Phone 1•905•852•0086 www.scarsin.com
A B O U T S C A R S I N Scarsin is a software development and service company specializing in enterprise-class Business Intelligence. Scarsin’s Integrated Insight Environment (i2e) platform supports global organizations’ critical business processes.
Scarsin’s team of experts has managed a diverse portfolio including Revenue programs, Planning/Implementation, Speech/Data Analytics, Budget Planning, and Performance Management, creating and implementing policy roadmap for 8000+ front-line agents and delivered a year over year revenue improvement.
i2e is an end-to-end BI platform designed to integrate all complex BI processes into a unified solution, with a focus on business friendly processes and direct integration with Microsoft Office.
business stakeholders can consume, distribute and base important decisions on.
i 2 e p r o v i d e s o n e f u l l y i n t e g r a t e d p l a t f o r m d e l i v e r i n g :
S P E E D
A G I L I T Y
C O S T E F F E C T I V E N E S