An Optimization Approach Coupling Rockfall Simulation and ...
146
Graduate Theses, Dissertations, and Problem Reports 2014 An Optimization Approach Coupling Rockfall Simulation and An Optimization Approach Coupling Rockfall Simulation and Slope Stability Analysis for New Rock Cut Profiles Slope Stability Analysis for New Rock Cut Profiles Justin Pentz Follow this and additional works at: https://researchrepository.wvu.edu/etd Recommended Citation Recommended Citation Pentz, Justin, "An Optimization Approach Coupling Rockfall Simulation and Slope Stability Analysis for New Rock Cut Profiles" (2014). Graduate Theses, Dissertations, and Problem Reports. 6398. https://researchrepository.wvu.edu/etd/6398 This Thesis is protected by copyright and/or related rights. It has been brought to you by the The Research Repository @ WVU with permission from the rights-holder(s). You are free to use this Thesis in any way that is permitted by the copyright and related rights legislation that applies to your use. For other uses you must obtain permission from the rights-holder(s) directly, unless additional rights are indicated by a Creative Commons license in the record and/ or on the work itself. This Thesis has been accepted for inclusion in WVU Graduate Theses, Dissertations, and Problem Reports collection by an authorized administrator of The Research Repository @ WVU. For more information, please contact [email protected].
Transcript of An Optimization Approach Coupling Rockfall Simulation and ...

Graduate Theses, Dissertations, and Problem Reports
2014
An Optimization Approach Coupling Rockfall Simulation and An Optimization Approach Coupling Rockfall Simulation and
Slope Stability Analysis for New Rock Cut Profiles Slope Stability Analysis for New Rock Cut Profiles
Justin Pentz
Follow this and additional works at: https://researchrepository.wvu.edu/etd
Recommended Citation Recommended Citation Pentz, Justin, "An Optimization Approach Coupling Rockfall Simulation and Slope Stability Analysis for New Rock Cut Profiles" (2014). Graduate Theses, Dissertations, and Problem Reports. 6398. https://researchrepository.wvu.edu/etd/6398
This Thesis is protected by copyright and/or related rights. It has been brought to you by the The Research Repository @ WVU with permission from the rights-holder(s). You are free to use this Thesis in any way that is permitted by the copyright and related rights legislation that applies to your use. For other uses you must obtain permission from the rights-holder(s) directly, unless additional rights are indicated by a Creative Commons license in the record and/ or on the work itself. This Thesis has been accepted for inclusion in WVU Graduate Theses, Dissertations, and Problem Reports collection by an authorized administrator of The Research Repository @ WVU. For more information, please contact [email protected].

An Optimization Approach Coupling Rockfall Simulation and Slope Stability
Analysis for New Rock Cut Profiles
Justin Pentz
Thesis submitted to the
Benjamin M. Statler College of Engineering and Mineral Resources
at West Virginia University
in partial fulfillment of the requirements for the degree of
Master of Science
in
Civil and Environmental Engineering
John D. Quaranta, Ph.D., P.E., Chair
Hema Siriwardane, Ph.D., P.E.
John Zaniewski, Ph.D
Department of Civil and Environmental Engineering
Morgantown, West Virginia
2014
KEYWORDS: Cut slopes, benching, planar, highway design, slope degradation, rock fall
ABSTRACT
An Optimization Approach Coupling Rockfall Simulation and Slope Stability
Analysis for New Rock Cut Profiles
Justin D. Pentz
In this report investigation and identification of the elements of bench cut bedrock slopes that
affect the rockfall characteristics was performed in order to create alternatives for highway
bedrock cut slope design for the state of West Virginia. The scope of this research was to
determine what geometric and material parameters effect rockfall on bench cut bedrock slopes
and present design suggestions for increasing rockfall retention. Additionally as a means
developing alternative slope designs a new design methodology involving slope stability and
rockfall behavior was established.
In order to analyze rockfall behavior in West Virginia geology, a three dimensional version of
Colorado Rockfall Simulation Program (CRSP-3D) was selected to provide rockfall simulation.
A field calibration workbook was developed in order to provide a systematic procedure for
selecting and evaluating field sites as candidates for calibration of the rockfall modeling
software. Using the data collected, the program was calibrated for two principal types of
rockfall. These groups, Hard and Soft Rock, were defined to be directly correlated to preexisting
West Virginia Design Directive 403 (WVDOH DD-403) rock classifications.
A parametric sensitivity analysis was conducted using WVDOH DD-403 geometric parameters
for bench cut bedrock cut slopes. Using Oregon Department of Transportation specifications as a
guideline, a threshold of ninety percent on-slope rockfall retention was imposed as a pass-fail
criterion. Parametric analysis showed that if all benches located in a profile are designed as the
primary means of rockfall catchment, benches widths should be designed to a minimum of 35
feet in order to provide adequate on slope catchment. As an attempt to increase rockfall
retention, an alternate toe of slope geometry to that specified in the WVDOH DD-403 was
implemented to the same parametric trails previously conducted. A Rockfall Catchment Area
Design (RCAD) ditch was selected due to its widespread use by other state agencies. Results
from modeling showed in the majority of iterations, the RCAD ditch was necessary in order to
provide acceptable retention for the entire range of the slope parameters. Although the RCAD
ditch equals or increases rockfall retention to the WVDOH toe of slope design in all cases, it did
not yield total rockfall retention to the ninety percent threshold for all geometric profiles
analyzed. Therefore, RCAD ditches should not be considered a complete design solution for toe
of slope rockfall retention during profile design; other geometric parameters must be considered
in order to facilitate a profile meeting rockfall retention requirements.
In order to assess the rockfall behavior of alternative geometric profiles to those currently
specified by the WVDOH, a design methodology was developed for analyzing the effects of cut
slope stability and the resulting rockfall retention. This process incorporated numerical stability
modeling using the Hoek-Brown failure criterion coupled with General Limit Equilibrium
analysis method. CRSP-3D provided rockfall analysis for each design profile. The analysis was
performed on a section of U.S. 48 in Hardy County consisting primarily of hard rock material. .
The results of the alternate design methodology showed that iterative reductions in the number of
geotechnical benches in a slope profile can be performed as to meet stability and rockfall
retention requirements, provided RCAD ditch design is diligently designed and modeled.

ACKNOWLEDGEMENTS
I would like to take this opportunity to thank several individuals whom have been provided the
guidance and support needed for me pursue and complete my M.S. in Civil Engineering. I
would first like to thank Dr. John Quaranta, for providing me the ability to conduct this research.
His guidance, commitment, and support throughout this process were invaluable in my academic
pursuits, without his diligent efforts this research would not be possible. In addition I would also
like to thank head rifle coach Jon Hammond and the West Virginia University athletic
department for providing me a graduate assistant position that funded this degree. I would
additionally like to thank Dr. Hema J. Siriwardane and Dr. John Zaniewski for being on my
advisory committee, providing insight on my thesis and ultimately enabling me to complete my
M.S. degree.
I would like to acknowledge the West Virginia Department of Highways for selecting West
Virginia University to perform this research. In addition, I would like to thank the engineers and
staff of the WVDOH for providing insight and the necessary elements required to conduct this
research. I also want to thank the individuals whom I worked with on this project, Mr. Matt
Idleman, Mr. Harold Russell and Mr. Michael Kulbacki.
I would like to dedicate this thesis to my parents, Joanne and Mark Pentz, my sister Renee Pentz,
and my entire extended family for their underlying support for me during my college years.
Without their love and support, my academic development including this research would not
have been possible.

iii
TABLE OF CONTENTS
Abstract ...................................................................................................................................... i
Acknowledgements .................................................................................................................... ii
Table of Contents ...................................................................................................................... iii
List of Figures ........................................................................................................................... vi
List of Tables ..............................................................................................................................x
1. Introduction .........................................................................................................................1
1.1 Research Purpose and Objectives .................................................................................1
1.2 Scope of Work .............................................................................................................1
2. Literature Review ................................................................................................................2
2.1 Rockfall .......................................................................................................................2
2.1.1 Topple ...................................................................................................................2
2.1.2 Fall ........................................................................................................................2
2.1.3 Design Considerations ...........................................................................................3
2.2 Rockfall Attenuation and Retention .............................................................................3
2.2.1 Rockfall Catchment Area Design (RCAD) .............................................................3
2.3 WVDOH Guide for Design in Cut Sections Through Bedrock .....................................4
2.4 Bedrock Cut Slope Design Guidelines for Selected State Agencies ..............................6
2.5 Computer Modeling Software ......................................................................................7
2.5.1 Colorado Rockfall Simulation Program ..................................................................8
2.5.1.1 Colorado Rockfall Simulation Program 2-Dimensional Version 4.0 ................8
2.5.1.2 Colorado Rockfall Simulation 3-Dimensional .................................................9
2.5.2 SoilVision® SVSlope® .........................................................................................9
3. Colorado Rockfall Simulation Program 3-dimensional ...................................................... 10
3.1 Introduction ............................................................................................................... 10
3.2 CRSP 3-Dimensional Field Data Collection Ideology ................................................ 12
3.2.1 Introduction ......................................................................................................... 12
3.2.2 Site Selection Criteria .......................................................................................... 12
3.2.3 In-Field Data Collection Method .......................................................................... 14
3.2.4 Alternate In-Field Data Collection Methods ......................................................... 16
3.3 CRSP 3-Dimensional Software Calibration ................................................................ 17
3.3.1 Geometry ............................................................................................................. 17
3.3.2 Bedrock Classification ......................................................................................... 19

iv
3.3.3 Slope Roughness .................................................................................................. 19
3.3.4 Slope Hardness .................................................................................................... 20
3.3.5 Slope Mechanical Properties ................................................................................ 20
3.3.6 Analysis Partitions ............................................................................................... 22
3.3.7 Falling Rock Parameters ...................................................................................... 22
3.3.8 Simulation ........................................................................................................... 23
3.3.9 Output .................................................................................................................. 24
3.4 CRSP 3-Dimensional Limitations .............................................................................. 25
3.5 CRSP 3-Dimensional Calibration Iteration Procedures ............................................... 26
3.5.1 Calibration Spreadsheet ....................................................................................... 26
3.5.2 Iterative Procedure for Determining Input Rock Parameters ................................. 27
3.6 CRSP 3-Dimensional Calibration Case Studies .......................................................... 30
3.6.1 Introduction ......................................................................................................... 30
3.6.2 Soft Rock Calibration: U.S. Route 121 ................................................................. 30
3.6.3 Hard Rock Calibration: U.S. Route 48 ................................................................. 35
4. CRSP 3-Dimensional Parameteric Analysis ....................................................................... 40
4.1 Introduction ............................................................................................................... 40
4.2 Method ...................................................................................................................... 41
4.2.1 Material Type ...................................................................................................... 42
4.2.2 Backslope Height ................................................................................................. 44
4.2.3 Backslope Ratio ................................................................................................... 44
4.2.4 Bench Width ........................................................................................................ 44
4.2.5 WVDOH DD-403 Toe of Slope Design ............................................................... 45
4.2.6 Additional CRSP 3-D Parametric Analysis Methods ............................................ 45
4.2.7 Parametric Analysis Typical Bench Cut Bedrock Slope Cross Section Using
WVDOH DD-403 Design Specifications ........................................................................... 46
4.3 Results DD-403 Design Cut Slope Parameters for Hard Rock using CRSP-3D .......... 47
4.4 Results DD-403 Design Cut Slope Parameters for Soft Rock using CRSP-3D ........... 56
4.5 Utilization of Rockfall Catchment Area Design Ditch for a CRSP-3D Sensitivity
Analysis ................................................................................................................................ 67
4.6 Results DD-403 Design Cut Slope Parameters with RCAD Ditch for Hard Rock using
CRSP-3D .............................................................................................................................. 69
4.7 Results DD-403 Design Cut Slope Parameters with RCAD Ditch for Soft Rock using
CRSP-3D .............................................................................................................................. 80

v
5. Numerical Modeling .......................................................................................................... 89
5.1 Methodology ............................................................................................................. 89
5.1.1 Hoek-Brown Failure Criterion.............................................................................. 89
5.1.2 General Limit Equilibrium Analysis Method ........................................................ 91
5.1.3 Limitations of Numerical Modeling ..................................................................... 91
6. BENCH REMOVAL FEASIBILITY STUDY ................................................................... 92
6.1 Bench Reduction Ideology ......................................................................................... 92
6.2 Case Study: U.S. Route 48 ......................................................................................... 92
6.2.1 Field Data Collection Method .............................................................................. 95
6.2.2 Geologic Exploration Data and Material Properties .............................................. 96
6.2.3 Analysis Methodology ......................................................................................... 98
6.2.4 SVSlope® Stability Results for Plan Geometry .................................................... 99
6.2.5 CRSP-3D Rockfall Simulation Results for Plan Geometry ................................. 100
6.2.6 SVSlope® Stability Results for Plan Geometry with RCAD Ditch ..................... 103
6.2.7 CRSP-3D Rockfall Simulation Results for Plan Geometry with RCAD Ditch .... 105
6.2.8 Plan Profile Bench Reduction Study: Two Geotechnical Benches ...................... 108
6.2.7.1 SVSlope® Stability Results for Two Geotechnical Bench Profile ............... 109
6.2.7.2 CRSP-3D Rockfall Simulation Results for Two Geotechnical Bench Profile
110
6.2.9 Plan Profile Bench Reduction Study: One Geotechnical Bench .......................... 113
6.2.8.1 SVSlope® Stability Results for a Single Geotechnical Bench Profile .......... 114
6.2.8.2 CRSP-3D Rockfall Simulation Results for a Single Geotechnical Bench
Profile 115
7. Conclusions and Recommendations ................................................................................. 118
References .............................................................................................................................. 120
Appendicies ............................................................................................................................ 122
Appendix I: CRSP Field Calibration Workbook .................................................................. 122

vi
LIST OF FIGURES
Figure 2.1 Illustration of Topple Slope Failure (OHDOT 2007) ..............................................2
Figure 2.2 Illustration of Fall Slope Failure (OHDOT 2007) ...................................................3
Figure 3.1 CRSP-3D Output Stats Table ............................................................................... 24
Figure 3.2 U.S. Route 121 Soft Rock Calibration in CRSP-3D Model Space ........................ 32
Figure 4.1 Typical Cross Section used in Parametric Analysis for Designs using WVDOH
DD-403 Specifications .............................................................................................................. 47
Figure 4.2 Histogram of Percent Hard Rockfall Passing Toe of Slope with 15 ft. Benches .... 51
Figure 4.3 Histogram of Percent Hard Rockfall Passing Toe of Slope with 25 ft. Benches .... 51
Figure 4.4 Histogram of Percent Hard Rockfall Passing Toe of Slope with 35 ft. Benches .... 52
Figure 4.5 Histogram of Percent Hard Rockfall Retained By Bench Number with 50 ft.
Backslope Heights..................................................................................................................... 53
Figure 4.6 Histogram of Percent Hard Rockfall Retained By Bench Number with 60 ft.
Backslope Heights..................................................................................................................... 53
Figure 4.7 Histogram of Percent Hard Rockfall Retained By Bench Number with 70 ft.
Backslope Heights..................................................................................................................... 54
Figure 4.8 Average Hard Rockfall Runout Distance using an Averaged Backslope Ratio for
Three Bench Widths and Backslope Heights ............................................................................. 54
Figure 4.9 Average Hard Rockfall Runout Distance using an Averaged Bench Width for
Three Backslope Ratios and Backslope Heights ........................................................................ 55
Figure 4.10 Histogram of Percent Soft Rockfall Passing Toe of Slope with 15 ft. Benches .. 61
Figure 4.11 Histogram of Percent Soft Rockfall Passing Toe of Slope with 25 ft. Benches .. 61
Figure 4.12 Histogram of Percent Soft Rockfall Passing Toe of Slope with 35 ft. Benches .. 62
Figure 4.13 Histogram of Percent Soft Rockfall Retained By Bench Number with 50 ft.
Backslope Heights..................................................................................................................... 63
Figure 4.14 Histogram of Percent Soft Rockfall Retained By Bench Number with 60 ft.
Backslope Heights..................................................................................................................... 63
Figure 4.15 Histogram of Percent Soft Rockfall Retained By Bench Number with 70 ft.
Backslope Heights..................................................................................................................... 64
Figure 4.16 Average Rockfall Runout Distance using an averaged Backslope Ratio for Three
Bench Widths and Backslope Heights ....................................................................................... 64
Figure 4.17 Average Hard Rockfall Runout Distance using an Averaged Bench Width for
Three Backslope Ratios and Backslope Heights ........................................................................ 65
Figure 4.18 Cross Section of RCAD Ditch Design created for CRSP-3D Parametric Analysis
68

vii
Figure 4.19 Typical Cross Section used in Parametric Analysis for Design using WVDOH
DD-403 Specifications with RCAD Ditch ................................................................................. 69
Figure 4.20 Histogram of Percent Hard Rockfall Passing RCAD Ditch with 15 ft. Benches 73
Figure 4.21 Histogram of Percent Hard Rockfall Passing RCAD Ditch with 25 ft. Benches 73
Figure 4.22 Histogram of Percent Hard Rockfall Passing RCAD Ditch with 35 ft. Benches 74
Figure 4.23 Histogram of Percent Hard Rockfall Retained By Bench Number with 50 ft.
Backslope Heights..................................................................................................................... 75
Figure 4.24 Histogram of Percent Hard Rockfall Retained By Bench Number with 60 ft.
Backslope Heights..................................................................................................................... 75
Figure 4.25 Histogram of Percent Hard Rockfall Retained By Bench Number with 70 ft.
Backslope Heights..................................................................................................................... 76
Figure 4.26 Average Hard Rockfall Runout Distance beyond the RCAD Ditch using an
Averaged Backslope Ratio for Three Bench Widths and Backslope Heights .............................. 76
Figure 4.27 Average Hard Rockfall Runout Distance beyond the RCAD Ditch using an
Averaged Bench Width for Three Backslope Ratios and Backslope Heights .............................. 77
Figure 4.28 Comparison of Hard Rockfall Catchment Effectiveness of a WVDOH DD-403
Specification Lower Catchment Bench and the RCAD Ditch designed for this Analysis using 15
ft. Bench Widths ....................................................................................................................... 78
Figure 4.29 Comparison of Hard Rockfall Catchment Effectiveness of a WVDOH DD-403
Specification Lower Catchment Bench and the RCAD Ditch designed for this Analysis using 25
ft. Bench Widths ....................................................................................................................... 79
Figure 4.30 Comparison of Hard Rockfall Catchment Effectiveness of a WVDOH DD-403
Specification Lower Catchment Bench and the RCAD Ditch designed for this Analysis using 35
ft. Bench Widths ....................................................................................................................... 79
Figure 4.31 Histogram of Percent Soft Rockfall Passing RCAD Ditch with 15 ft. Benches.. 83
Figure 4.32 Histogram of Percent Soft Rockfall Passing RCAD Ditch with 25 ft. Benches.. 83
Figure 4.33 Histogram of Percent Soft Rockfall Retained By Bench Number with 50 ft.
Backslope Heights..................................................................................................................... 84
Figure 4.34 Histogram of Percent Soft Rockfall Retained By Bench Number with 60 ft.
Backslope Heights..................................................................................................................... 84
Figure 4.35 Histogram of Percent Soft Rockfall Retained By Bench Number with 70 ft.
Backslope Heights..................................................................................................................... 85
Figure 4.36 Average Soft Rockfall Runout Distance beyond the RCAD Ditch using an
Averaged Backslope Ratio for Three Bench Widths and Backslope Heights .............................. 85
Figure 4.37 Average Soft Rockfall Runout Distance beyond the RCAD Ditch using an
Averaged Bench Width for Three Backslope Ratios and Backslope Heights .............................. 86

viii
Figure 4.38 Comparison of Soft Rockfall Catchment Effectiveness of a WVDOH DD-403
Specification Lower Catchment Bench and the RCAD Ditch designed for this Analysis using 15
ft. Bench Widths ....................................................................................................................... 87
Figure 4.39 Comparison of Soft Rockfall Catchment Effectiveness of a WVDOH DD-403
Specification Lower Catchment Bench and the RCAD Ditch designed for this Analysis using 25
ft. Bench Widths ....................................................................................................................... 88
Figure 4.40 Comparison of Soft Rockfall Catchment Effectiveness of a WVDOH DD-403
Specification Lower Catchment Bench and the RCAD Ditch designed for this Analysis using 35
ft. Bench Widths ....................................................................................................................... 88
Figure 6.1 View of U.S. Route 48 Bench Removal Case Study Slope Section From Opposite
Side of Cut Section ................................................................................................................... 94
Figure 6.2 View of U.S. Route 48 Bench Removal Case Study Slope Section From Roadway
Elevation 94
Figure 6.3 U.S. Route 48 Plan Geometry Slope Cross Section showing Stability Analysis
Results 100
Figure 6.4 U.S. Route 48 Plan Geometry Slope Cross Section in CRSP-3D ........................ 101
Figure 6.5 Histogram of Percent Hard Rockfall Retained with 1.5 ft. Diameter ................... 102
Figure 6.6 Histogram of Percent Hard Rockfall Retained with 2.5 ft. Diameter ................... 102
Figure 6.7 Histogram of Percent Hard Rockfall Retained with 3.5 ft. Diameter ................... 103
Figure 6.8 U.S. Route 48 Plan Geometry Slope Cross Section with RCAD ditch showing
Stability Analysis Results ........................................................................................................ 105
Figure 6.9 Plan Geometry Cross Section with RCAD Ditch in CRSP-3D ............................ 107
Figure 6.10 Histogram Comparing Rockfall Retention for the Plan Profile to the Plan Profile
with RCAD Ditch for Rockfall Released from Backslope 2. .................................................... 107
Figure 6.11 U.S. Route 48 Slope Cross Section with Two Geotechnical Benches and RCAD
ditch showing Stability Analysis Results ................................................................................. 110
Figure 6.12 U.S. Route 48 Slope Cross Section with Two Geotechnical Benches and RCAD
ditch in CRSP-3D ................................................................................................................... 111
Figure 6.13 Histogram of Percent 1.5 ft. Diameter Hard Rockfall Retained on a Two Bench
Profile with RCAD Ditch ........................................................................................................ 112
Figure 6.14 Histogram of Percent 2.5 ft. Diameter Hard Rockfall Retained on a Two Bench
Profile with RCAD Ditch ........................................................................................................ 112
Figure 6.15 Histogram of Percent 3.5 ft. Diameter Hard Rockfall Retained on a Two Bench
Profile with RCAD Ditch ........................................................................................................ 113
Figure 6.16 U.S. Route 48 Slope Cross Section with One Geotechnical Bench and RCAD
ditch showing Stability Analysis Results ................................................................................. 115
Figure 6.17 U.S. Route 48 Slope Cross Section with One Geotechnical Bench and RCAD
ditch in CRSP-3D ................................................................................................................... 116

ix
Figure 6.18 Histogram of Percent Hard Rockfall Retained for Three Rockfall Diameters on a
Single Bench Profile with RCAD Ditch .................................................................................. 117

x
LIST OF TABLES
Table 2.1 Comparison of WVDOH Rock Cut Slope Guidelines with Selected State
Department of Transportation Agencies (Quaranta and Siriwardane, et al., 2014) ........................7
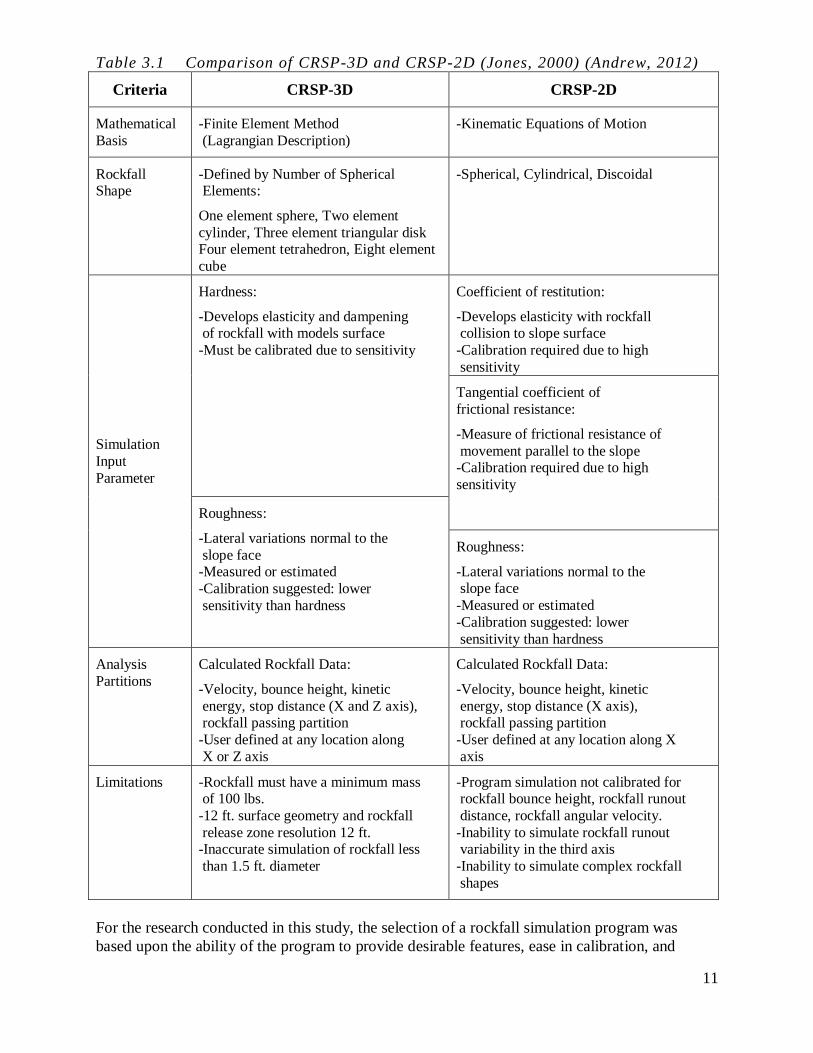
Table 3.1 Comparison of CRSP-3D and CRSP-2D (Jones, 2000) (Andrew, 2012) ............... 11
Table 3.2 Sample Field Data Collection Worksheet for Slope Regions and CRSP Input
Parameters (Idleman, 2014) ....................................................................................................... 15
Table 3.3 Rock Count Data Collection Worksheet for CRSP Calibration (Idleman, 2014) .. 16
Table 3.4 Example Slope Geometry Coordinate Trio for CRSP-3D ..................................... 19
Table 3.5 CRSP-3D: Suggested Roughness Input Ranges and Descriptions for Slope Profiles
(CRSP-3D User’s Manual, 2012) .............................................................................................. 27
Table 3.6 CRSP-3D: General Hardness Coefficient Ranges for Different Slope Surface Types
(CRSP-3D User’s Manual, 2012) .............................................................................................. 28
Table 3.7 CRSP-3D: Hardness Coefficient Adjustment ....................................................... 29
Table 3.8 U.S. Route 121 Soft Rock Calibration Site Overview (Idleman, 2014) ................. 31
Table 3.9 U.S. Route 121 Field Data Collection Worksheet for Slope Regions and CRSP
Input Parameters ....................................................................................................................... 31
Table 3.10 U.S. Route 121 Rock Count Data Collection Worksheet for CRSP Calibration
(Idleman, 2014) ......................................................................................................................... 32
Table 3.11 U.S. Route 121 Calibration for 1.5 ft. Diameter Soft Rock Using CRSP-3D (Trial
and Error Method) ..................................................................................................................... 33
Table 3.12 U.S. Route 121 Calibration for 2.5 ft. Diameter Soft Rock Using CRSP-3D (Trial
and Error Method) ..................................................................................................................... 34
Table 3.13 Calibrated CRSP-3D Parameters for Soft Bedrock in West Virginia..................... 34
Table 3.14 U.S. Route 48 Hard Rock Calibration Site Overview ........................................... 35
Table 3.15 U.S. Route 48 Field Data Collection Worksheet for Slope Regions and CRSP Input
Parameters 36
Table 3.16 U.S. Route 48 Rock Count Data Collection Worksheet for CRSP Calibration ...... 36
Table 3.17 U.S. Route 48 Calibration for 1.5 ft. Diameter Hard Rock Using CRSP-3D (Trial
and Error Method) ..................................................................................................................... 38
Table 3.18 U.S. Route 48 Calibration for 2.5 ft. Diameter Hard Rock Using CRSP-3D (Trial
and Error Method) ..................................................................................................................... 39
Table 3.19 Calibrated CRSP-3D Parameters for Hard Bedrock in West Virginia ................... 40
Table 4.1 WVDOH Design Directive 403 Bedrock Type and Suggested Geometry (Over
50ft. Backslope Height) (WVDOH, 2006) ................................................................................. 40
Table 4.2 Range of Values and Structure of Parametric Sensitivity Analysis ....................... 42
Table 4.3 Material Input Parameters for Parametric Analysis ............................................... 43
xi
Table 4.4 Results for CRSP-3D Parametric Analysis Iterations for Hard Rock with 50 ft.
Backslope Heights..................................................................................................................... 48
Table 4.5 Results for CRSP-3D Parametric Analysis Iterations for Hard Rock with 60 ft.
Backslope Heights..................................................................................................................... 49
Table 4.6 Results for CRSP-3D Parametric Analysis Iterations for Hard Rock with 70 ft.
Backslope Heights..................................................................................................................... 50
Table 4.7 Results for CRSP-3D Parametric Analysis Iterations for Soft Rock with 50 ft.
Backslope Heights..................................................................................................................... 58
Table 4.8 Results for CRSP-3D Parametric Analysis Iterations for Soft Rock with 60 ft.
Backslope Heights..................................................................................................................... 59
Table 4.9 Results for CRSP-3D Parametric Analysis Iterations for Soft Rock with 70 ft.
Backslope Heights..................................................................................................................... 60
Table 4.10 Results for CRSP-3D Parametric Analysis Iterations for Hard Rock with 50 ft.
Backslope Heights and RCAD Ditch ......................................................................................... 70
Table 4.11 Results for CRSP-3D Parametric Analysis Iterations for Hard Rock with 60 ft.
Backslope Heights and RCAD Ditch ......................................................................................... 71
Table 4.12 Results for CRSP-3D Parametric Analysis Iterations for Hard Rock with 70 ft.
Backslope Heights and RCAD Ditch ......................................................................................... 72
Table 4.13 Results for CRSP-3D Parametric Analysis Iterations for Soft Rock with 50 ft.
Backslope Heights and RCAD Ditch ......................................................................................... 80
Table 4.14 Results for CRSP-3D Parametric Analysis Iterations for Soft Rock with 60 ft.
Backslope Heights and RCAD Ditch ......................................................................................... 81
Table 4.15 Results for CRSP-3D Parametric Analysis Iterations for Soft Rock with 70 ft.
Backslope Heights and RCAD Ditch ......................................................................................... 82
Table 6.1 Case Study In-Field Parameters Collected for SVSlope® and CRSP-3D .............. 95
Table 6.2 Geometric Data and Corresponding Material Properties Used for Input into
SVSlope® and CRSP-3D .......................................................................................................... 97
Table 6.3 Plan Geometry for SVSlope® Stability Analysis .................................................. 99
Table 6.4 Plan Geometry with RCAD ditch for SVSlope Stability Analysis....................... 104
Table 6.5 Two Bench Geometry for SVSlope® Stability Analysis ..................................... 109
Table 6.6 Single Bench Geometry for SVSlope® Stability Analysis .................................. 114

1
1. INTRODUCTION
West Virginia’s mountainous terrain presents engineers with challenges for both new highway
construction and maintenance of existing highway infrastructure. In regards to new highway
construction, large bedrock cut slopes are often necessary to meet the criteria of both horizontal
and vertical highway alignments. The design of bedrock cut slopes is multifaceted; a design
profile must meet geometric design standards, stability requirements, and the ability mitigate
rockfall from reaching the roadway so as it does not become a hazard to the public. The West
Virginia Department of Highway’s Design Directive 403 current practices specify the use of
geotechnical benches to serve as on-slope rockfall catchment devices and as elements of slope
stability. Unfortunately the benched profiles are commonly inaccessible to maintenance
operations, inhibiting their intended design function performance. Computer modeling software
allows for the analysis of alternative designs that have increased performance over current
practices. By modeling of geometric slope parameters, stability and slope profile bench
reductions, additional perspectives and theories on an optimized design process for bedrock cut
slopes are developed.
1.1 Research Purpose and Objectives
The purpose of this research project was to investigate and identify the elements of bench cut
bedrock slopes that affect the stability and rockfall characteristics in order to create alternatives
for highway bedrock cut slope design. The development of the following objectives provided
structure in the ability of fulfilling this purpose:
Conduct a literature review to achieve a baseline assessment of the problem and
understand previously investigated methods to the problem.
Data collection of currently constructed highway cut slopes allowed for assessment of the
problem and for an evaluation of current practices.
Perform computer modeling for an analysis of current practices along with alternative
design practices and methods were evaluated comprehensively for their performance
toward the goals of this research.
Develop recommendations that allow for greater insight and knowledge about possible
solutions to the problem.
1.2 Scope of Work
Develop an in-field data collection method that allows for calibration of CRSP in West
Virginia.
Calibrate CRSP-3D Version 1.0 for West Virginia geology and topography
Perform a parametric sensitivity analysis on both current and proposed geometric design
parameters in order to determine which parameter(s) allow for the best rockfall retention
characteristics to develop.
Develop a RCAD ditch design that increases on-slope rockfall retention and general
rockfall behavior and compare it to current toe of slope geometric design
Perform an iterative analysis using CRSP-3D and SVSlope® that estimates the feasibility
of designing profiles composed of hard bedrock with fewer benches than current
WVDOH DD-403 design directives specify.

2
2. LITERATURE REVIEW
The overall objective of the literature review for this document was to consider:
The behavior, types, causations, failure and mitigation of rockfall for geology of West
Virginia.
West Virginia Department of Transportation’s current rock cut slope design guidelines in
comparison to those currently specified by other state transportation agencies.
Comparison was conducted on those of which contain similar geologic and lithological
units such as Pennsylvania and Ohio and additional states with well-established rock cut
slope geometric designs such as Colorado, Montana, and Oregon.
Appropriate modeling software and rationale for why each was chosen for the
investigations performed in this research.
2.1 Rockfall
For slopes comprised of bedrock, two principal modes of failure occur. The first of these modes
is known as a rockfall topple. The second mode is more common and is known as a fall
(OHDOT, 2007). Both of these conditions cause rockfall by the detachment of material from the
larger bedrock cut face. Topples and Falls are discussed in detail below.
2.1.1 Topple
A topple is defined as the forward rotation out of the slope mass consisting of soil or rock about
a point or axis below the center of gravity of the displaced mass. Toppling is sometimes driven
by gravity exerted by material upslope of the displaced mass. A topple can also occur due to
water or ice expanding in the cracks of the displaced mass. The cracks in the displaced mass can
be due to discontinuities, stratification of the material, and over blasting effects. Common causes
of a topple include vibrations, undercutting, differential weathering, excessive excavation, and
erosive forces. A topple usually results in a collection of debris at the toe of the slope, called a
talus cone. The age of a topple can be generalized based on whether or not vegetation is growing
on the talus. New topples do not have vegetative growth on the talus while older topples do have
vegetation growing on the talus (Das, 2006).
Figure 2.1 Illustration of Topple Slope Failure (OHDOT 2007)
2.1.2 Fall
A fall starts with a detachment of soil and or rock from a steep slope along a surface in which
little or no shear displacement occurs. The detached material descends primarily through the air
by falling, bouncing, or rolling down the remaining slope. Falls generally occur on slopes with
angles ranging from 45 to 90 degrees and are caused by vibrations, undercutting, differential
weathering, and erosion. Falls are generated from discontinuities in the rock or soil, creating
weak points for failure. Falls can be especially dangerous near roadways or above residential

3
areas. Falls can be easily classified by debris or rubble found at the toe of the slope. Catchment
structures are the primary mode of confining the fallen debris and keeping debris from entering
roadways (Das, 2006).
Figure 2.2 Illustration of Fall Slope Failure (OHDOT 2007)
2.1.3 Design Considerations
The combined effects of topples and falls on highway bedrock cut slopes can have serious
negative implications on roadway users if rockfall reaches the roadway. Regardless of the
lithology of the strata present in the slope and the geometric slope design used, some degree of
rockfall will occur. Therefore it is the public service duty of the various state departments of
transportation to mitigate the rockfall hazards. The process of effectively mitigating rockfall is
holistic and must be considered during the entire slope design, construction, and maintenance
processes. The first step in proper rockfall mitigation is the identification of root causes of
rockfall. The most common causes of rockfall encountered during design are adverse strata
configurations, erosive forces that cannot be effectively managed, and other hydrologic effects
such as freeze-thaw cycles. During construction of a rock cut slope overblasting is the principal
cause of short term and long term rockfall development (Quaranta and Siriwardane, et al., 2014).
2.2 Rockfall Attenuation and Retention
Due to natural processes, weathering of earthen materials on exposed slope faces is expected to
occur over time. When natural landforms are disturbed by engineering projects, their natural
“equilibrium” with erosive forces is upset. In the case of rock cut slope excavation for highways,
the process of erosion is likely to occur, especially in weak strata such as sandstone, shale,
siltstone, and coal. Geotechnical engineers and geologists often plan for rock fall and erosion
processes to occur by constructing rock fall attenuation structures such as containment ditches,
barriers, netting, and benches, amongst other techniques (Quaranta and Siriwardane, et al.,
2014).
2.2.1 Rockfall Catchment Area Design (RCAD)
Containment ditches, commonly referred to as “Ritchie ditches,” named after rockfall expert
Arthur Ritchie, are the most common type of rockfall mitigation used along roadways. Ditches
are a preferred mitigation technique due to being predominantly hidden to roadway users and are
considered aesthetically pleasing (Andrew, 2011). Other factors associated with the size and
depth of the ditch include slope height and slope ratio (Ritchie, 1963). In terms of design,
Oregon DOT (in correlation with the Federal Highway Administration (FHWA)) modified
Arthur Ritchie’s original design guidelines in the 2002 report “Rockfall Catchment Area Design
Guide.” The modified RCAD design creates a safe rockfall catchment area between the edge of
the roadway pavement and the base of an adjacent slope based on a desired percentage of
rockfall retention. This desired percentage is independent of the height and angle of the
backslope. The Oregon DOT has developed design curves for various slope heights that specify

4
the minimum required geometric dimensions of an RCAD ditch with respect to several levels of
percent rockfall retention. A finite total slope height that is within the Oregon DOT case studied
range must be known in order to use the design curves. The corresponding geometry of the
RCAD ditch selected is dependent upon the designers desired level of rockfall retention.
The Oregon DOT has set a minimum value of 90% rockfall retention by the slope or ditch for all
rock cut slopes (ODOT, 2012). This value was selected to be used as the minimum performance
benchmark for all subsequent simulation and analysis in this research. Additionally, ODOT
published RCAD ditch design curves are calibrated for maximum total slope heights of 80 feet
(ODOT, 2001). Unfortunately, this value is significantly smaller than typical total cut heights in
West Virginia and therefore cannot be directly implemented without extensive analysis. Section
4.5 discusses this issue in greater depth along with the RCAD ditch design used in this study. In
general terms, all states that manage rockfall utilize some type of catchment ditch as a means of
mitigation. In addition to Oregon, other state highway departments including Alaska, Arizona,
California, New York, Tennessee, Washington, and Wyoming use modified Ritchie ditches.
Additional state highway departments cite the Oregon rockfall study as well, including, but not
limited to, Ohio and Virginia (Quaranta and Siriwardane, et al., 2014).
2.3 WVDOH Guide for Design in Cut Sections Through Bedrock
The State of West Virginia Department of Highways guidance document for the
recommendations and guidelines for rock cut slopes is Design Directive Number 403 (DD-403)
and was last updated in July 2006. The WVDOH also uses the WVDOH Standard Specifications
for supplemental guidelines in both design and construction of cut rock slopes.
The lithology of West Virginia is fairly diverse due to the state being located geographically
across all four of the main regions of the Central Appalachian Mountains. These regions are the
Ohio River Valley at West Virginias western border, the Allegheny Plateau making up majority
of the center of the state from north to south, Allegheny Highlands on majority of the eastern
border, and finally the Potomac Section comprising most of the eastern panhandle of the state.
Adding to the diversity is the vast difference in similar material strength and lithology that each
region exhibits despite the relative proximity each region has to one another (WVDOH, 2006).
In regards to design limitations, the Ohio River Valley region’s slopes typically suffer from weak
shales such as Creston Red Shales and very low residual strength overburden soils (WVDOH,
2006). The Allegheny Plateau region’s slopes typically suffer from differential rates of erosion
of the interbedded rock strata that makes up the majority of cut rock slopes (WVDOH, 2006).
This differential weathering creates overhanging rock strata layers that after significant
undercutting are prone to both toppling and rock fall failures causing possible maintenance and
safety concerns. The Allegheny Highlands section commonly exhibits problematic design
approaches regarding the structural integrity of the joints and bedding planes in its massive
limestone units which are predominantly found in this region’s cut slopes (WVDOH, 2006). The
Potomac region exhibits the most structurally stable and lowest slake index strata in the state, but
still exhibits formations of weakly bedded limestone and dolomite (WVDOH, 2006).
DD-403 consists of three sections. The first section is primarily designated for introductory
information. This section states that the guidelines given in the document are not fixed and
therefore are flexible to site specific needs and design challenges. Additionally this section
states that the WVDOH has an obligation to the public to balance quality versus the cost of rock
slope design and construction in order to maintain sustainability. The DD-403’s five key rock
slope design principles are abbreviated below:

5
Elimination or minimization of maintenance cost from the erosive degradation of
exposed bedrock: This issue is of key importance for most cut rock slopes in West
Virginia and tends to cause infilling of roadway ditches resulting in pavement failure.
Material build up on roadway shoulders creates more dangerous driving conditions for
roadway users. Large rockfall events lead to pavement damage and increased roadway
user hazards (WVDOH, 2006).
Slopes shall be constructed as steep as possible, reducing initial construction costs: This
principle with addition to the first principle encompasses the primary rock cut slope
design problem. In West Virginia, contracted construction material removal is 1/4 to 1/3
the cost of material removal by WVDOH maintenance crews. This cost differential
results from the lower unit cost of material removal that occurs in large volume localized
contracted construction work versus that of a higher unit cost that occurs in low volume
and increased mobilization cost of WVDOH maintenance personnel (WVDOH, 2006).
The best design approach for rock cut slopes involves a detailed analysis of the bedrock
at the site. The most difficult task is determining the most pertinent design limiting
feature of the bedrock under consideration. In the design process, the local climate,
construction blasting, and erosion rates must all be considered in addition to the bedrock
characteristics. Instead of investigating all possible limiting features, it is suggested by
the WVDOH to design new rock cut slopes by a detailed analysis of very similar existing
cut rock slopes as proximal to the location of the new cut slope. It is critical that the
design comparison slope has been an exposed cut for a minimum duration of that of the
design life of the proposed new construction slope. DD-403 stresses that observation and
study of existing cuts cannot be over emphasized (WVDOH, 2006).
The second section of the DD-403 discusses the various rock strata types which includes a brief
description of their material properties, design procedure and physical location that these
materials can be found within the state. The content within section two is discussed greater
detail in section three of the DD-403 and is omitted from this research.
The third section of DD-403 is titled “Design of Cuts in Bedrock.” This section breaks down
rock cut slope design into four distinct bedrock classifications that are commonly encountered
throughout the state for cut highway sections. The bedrock types are classified by a suggested
geometric design, not by their functional class. These four bedrock types are listed below:
Type 1 Medium-Hard to Hard Limestone, Sandstone and Hard Shale: Type 1 bedrock
exhibits a compressive strength minimum of 8000 psi. This type of bedrock
exists in massive formations with varying degrees of dip. Softer material such as
coal or shale may be present in Type 1 bedrock in smaller seams. For Type 1
bedrock with shale, a slake durability index of at least 95 percent is required for
the shale layer (WVDOH, 2006).
Type 2 Soft Limestone or Sandstone, Medium-Hard Shale, Siltstone and Interbedded
Combinations of any of these listed types: Type 2 bedrock has a Compressive
Strength ranging from 4000-8000 psi, and covers the vast majority of all strata
present in West Virginia. Many areas of the state have soft shale and coal seams
present in this classification. Slake durability should be between 51 to 94 percent
(WVDOH, 2006).

6
Type 3 Soft Shale Interbedded with Siltstone, Sandstone, or Limestone: Type 3 bedrock
has a Compressive Strength ranging from 1000-4000 psi. These Soft Shale
bedding planes are typically not very thick, and the interbedded with harder
bedrock, varying in thickness. Type 3 only varies from Type 4 bedrock due to the
bedding of stronger, more competent materials interbedded with the shale
(WVDOH, 2006).
Type 4 Soft and Very Soft Shale: The compressive strength of Type 4 bedrock is
approximately 1000 psi. Weak shale may be considered indurated clays when
fissility is lacking. When exposed to water, these materials completely degrade
into tiny particles. Slake Durability values for these materials range between 0
and 50 percent (WVDOH, 2006).
The WVDOH DD-403 specifies bench width for a bedrock slope by roadway classification.
Slopes that are not considered arterials have a lower magnitude minimum value than bench cut
slopes designed for highways classified as arterials. The DD-403 states that the purpose of these
benches is to provide locations of rockfall catchment, but frequency of design interval is subject
to the material properties and not the needs of rockfall catchment.
2.4 Bedrock Cut Slope Design Guidelines for Selected State Agencies
In order to gain a greater understanding rock cut slope design, construction and maintenance,
reference material was reviewed on selected state transportation agencies. Although many
similarities were found between the selected state transportation agencies and WVDOH, several
key differences were also found. Table 2.1 below was constructed as a tabular format presents
these similarities and differences. This table is not exhaustive and only highlights areas that have
the greatest impact on Rock Cut Slope design, construction and maintenance. This comparison
was not developed to suggest practices of other states are of a greater validity and accuracy than
WVDOH. The table’s contents simply provide areas of consideration for the WVDOH during
Rock Cut Slope Design in West Virginia (Quaranta and Siriwardane, et al., 2014).

7
Table 2.1 Comparison of WVDOH Rock Cut Slope Guidelines with Selected State
Department of Transportation Agencies (Quaranta and Siriwardane, et
al., 2014)
Criteria Documented
WVDOH Practices
Selected State DOT
Practice(s)
State DOT’s Using
Practice
Factor of Safety Min. 1.25
Min. 1.50 (roads classified as
arterials)
Min. 1.50 for all roadways Montana
Slope Stability Analysis General Limit
Equilibrium
General Limit Equilibrium
+
Computer Analysis Software
Montana
Oregon
Pennsylvania
Rockfall Retention
Requirements
Not a Documented
Practice
Min. of 90% Rockfall
Retention
Oregon
Min. of 95% Rockfall
Retention
Ohio
Rockfall Rating System Not a Documented
Practice
Rockfall Hazard Rating
System
Colorado
Montana
Ohio
Pennsylvania
Material Testing Compressive Strength
Slake Durability
Compressive Strength
Slake Durability
Shear Strength
Rock Quality Designation
Point Load Testing
Ohio
Pennsylvania
Overblasting Control
Techniques
Pre-Splitting Pre-Splitting
Trim Blasting
Line Drilling
Montana
Oregon
Pennsylvania
2.5 Computer Modeling Software
The development of computer modeling software has allowed engineers of all disciplines the
ability to design an entity, evaluate its performance, and finally if necessary, edit the design
without having to complete time consuming traditional methods of solving problems by hand or
complete trial and error construction practices (Quaranta and Siriwardane, et al., 2014). In
regards to the scope of this project, commercially available programs allow engineers the ability
to evaluate rock cut slopes for stability and rockfall simulation. The ability to determine stability

8
allows for engineers to meet requirements and identify any possible zones of failure or areas of
difficulty in the design, construction and maintenance of slope profiles. The ability to model
rockfall allows for slope designs to be constructed in manner of which rockfall reaching the
roadway can be minimized, allowing for safer highways for the traveling public (Quaranta and
Siriwardane, et al., 2014)
2.5.1 Colorado Rockfall Simulation Program
One of the most popular simulation programs available is the Colorado Rockfall Simulation
Program (CRSP). Using the user specified input parameters the program simulates the behavior
characteristics and final resting location of the rockfall as it encounters gravimetric forces and
kinetic impact from striking the slope surface. An important distinction must be made about the
programs’ intended purpose. The program only provides the user information about effects of
rockfall behavior and not the causation of rockfall. Zones of rockfall initiation are explicitly pre
-defined by the user and are not probabilistically determined by the program via input
parameters. In order to effectively implement rockfall mitigation measures, it is important to
first understand the potential launching and kinetic energy associated with rockfall events present
at the site of installation of rockfall mitigation measures. The kinematic physics of rockfall
events can be computed in computer programs such as CRSP. CRSP enables the user the ability
to model rockfall events and quantitatively develop a predicted performance of the cut slope
profiles with each simulated event. Specific geometric items such as backslope ratios, backslope
heights, quantity of benches, bench widths can be assessed for their contributing effects toward
rockfall behavior. Through the modeling of geometric parameters of the slope profile the user
gains insight on the requirements of the needs of rockfall mitigation and attenuation for the
simulation profile. Subsequently these design elements can be modeled for their effectiveness
and if needed additional changes to the profile such as its geometry or the need of additional
mitigation and attenuation structures can be determined (Quaranta and Siriwardane, et al., 2014).
2.5.1.1 Colorado Rockfall Simulation Program 2-Dimensional Version 4.0
CRSP was originally developed in 1988 by Dr. Jerry Higgins and Timothy J. Pfeiffer at the
Colorado School of Mines. The project was funded as a research project for the Colorado
Department of Transportation. The original version along with subsequent versions are based
upon a two dimensional Cartesian plane. Within the two-dimensional plane this program allows
the user to input slope parameters that allow for the simulation of rockfall. These parameters are
slope geometry, material properties, rockfall shape, rockfall size, along with other parameters
that attribute to the rockfall contact with the simulated slope surface. The latest version of the
Colorado Rockfall Simulation Program Two-Dimensional (CRSP-2D) was developed in 2000
and is currently used by state agencies such as Colorado, Ohio, Oregon, and California (Jones,
2000).
The CRSP-2D algorithm is comprised of various kinematic equations of motion in conjunction
with an assumed initial velocity and a friction function to account for rockfall interaction of
varying degrees of slope surface roughness and hardness (Jones, 2000). The surface roughness
(S) of the slope is measured perpendicular to the slopes’ backslope in feet and should account for
an average roughness for that section of the defined slope profile. Additionally two other
parameters account for hardness and the kinematic behavior of the rockfall. The first coefficient
is called the normal coefficient of restitution (Rn). This coefficient is a reduction coefficient for
rockfall velocity that is defined normal to the slopes cross section values range from .01 to 1.0.
The second parameter, the tangential coefficient of frictional resistance (Rt), is a reduction
coefficient for tangential velocity of the rockfall as it strikes the slope face. The value of this

9
parameter also ranges from .01 to 1.0. All three of these parameters (S, Rn, Rt) must be calibrated
at each defined geometric cell within the program (Jones, 2000).
The value or range of values selected by the user are dependent upon the slope material and
slope geometry of which CRSP-2D will be used to simulate. Additionally three different
rockfall shapes can be simulated. This allows the user to gain insight on the behavior of rockfall
with respect to the various shapes. According to CRSP 2-D manual, it is in the user’s best
interest to model the worst case cross sectional profile and parameter inputs (Jones, 2000)
Therefore, if this profile meets performance guidelines, it becomes intuitive that other profiles
that allow better rockfall retention will also meet guidelines. In addition to the above assumption,
listed below are several other assumptions that should be considered when using CRSP-2D.
A rockfall shape must be calibrated to field observations before other rockfall shape
behavior can be assessed. Spherical rockfall shape yields the highest rockfall runout
distances and can be consider to provide the worst case results (Jones, 2000).
Initial rockfall x and y vectors used to create release velocity have a maximum magnitude
of 1ft/sec. Although the program provides accurate rockfall simulation with these
parameters, this is not the likely behavior of actual rockfall on a constructed slope cross
sectional profile (Jones, 2000).
The algorithms used in CRSP-2D version 4.0 are not calibrated for the following items
and therefore their values should be considered to have lower accuracy, reliability and
should be made cautiously (Jones, 2000).
1. Bounce Height
2. Rockfall Runout Distance
3. Angular Velocity
2.5.1.2 Colorado Rockfall Simulation 3-Dimensional
The development for a three-dimensional program that modeled rockfall with the same
objectives and validity of previous versions of CRSP was initiated by Yeh and Associates Inc.
along with Summit Peak Technologies LLC, in 2006. The program became available for public
use in 2010. CRSP-3D Version 1.0 was created as a means of addressing the issues that the
algorithms used in CRSP-2D were unable to adequately assess. The goal of CRSP-3D was to
improve accuracy of rockfall simulations, increase validity of rockfall bounce heights and
rockfall runout distance over previous versions (Andrew, 2012).
Further insight about the programs features, input parameters, output parameters and limitations
are explained in detail in Chapter 3 of this report. Additionally, calibration techniques that were
used to validate CRSP-3D rockfall behavior to that of the needs of West Virginia bench cut slope
design can also be found in Chapter 3.
2.5.2 SoilVision® SVSlope®
Created by SoilVision Systems, LTD of Saskatoon, Saskatchewan, SVSlope® is a modeling
software program within the SVOffice™ 2009 program suite. SVSlope® provides a finite
element method analysis approach that enables a user the ability to conduct various methods of
stability analysis using user defined geometry for earthen structures. The program uses multiple
searching methods along with probabilistic analysis to determine the location of each critical
failure surface in the geotechnical model (SoilVision®, 2011). Coupling traditional failure
criterion methods with statistical analysis allows the program to be used for, but not limited to,
sensitivity analysis, stochastic, or deterministic modeling approaches. The program offers
several failure criterion methods of which can be selected and applied by the user depending on

10
the desired analysis method requirements. Analysis methods that evaluate slope stability using
limit equilibrium include Simplified Bishops, Simplified Janbu, and General Limit Equilibrium.
Due to the wide array of analysis methods, SVSlope® has the ability to model rock and soil
materials allowing it to be used on a vast number of geotechnical applications. Independent of
the analysis method used for analysis, SVSlope® computes a factor of safety for all of the
critical failure planes. The factor of safety for each failure plane is dependent upon the input
parameters such as material strength, geometry of the structure, and the analysis method used. A
graphical depiction of the weakest failure plane is shown at the corresponding location on the
profile (Quaranta and Siriwardane, et al., 2014).
3. COLORADO ROCKFALL SIMULATION PROGRAM 3-DIMENSIONAL
3.1 Introduction
CRSP 3-D was developed using a Finite Element Method for dynamic model simulation using
the equations of motion (Andrew, 2012). Unlike previous versions, CRSP-3D allows for
coordinate to be defined in the third principal plane of the Cartesian coordinate system. This
allows for greater accuracy in modeling rockfall behavioral interaction to the defined slope
surface (Andrew, 2012). Additionally, concavity or other important spatial features that occur in
this plane can be represented in the model. The use of a three dimensional space allows CRSP-
3D to accurately model irregular movement of non-spherical rockfall. In order to gain greater
insight into features of CRSP-3D, Table 3.1 was developed to show the specific differences
between CRSP-3D and CRSP-2D. Although CRSP-2D and CRSP-3D both simulate rockfall
occurrence on a user defined slope surface, large differences in the criteria for evaluation exist.
CRSP-2D algorithms directly use kinematic equations of motion. The use of these equations
provides an appropriate means of simulating rockfall but these equations require additional input
parameters to achieve accurate simulation. CRSP-2D requires a total of three parameters for the
calibration. The parameters are a coefficient of restitution, a tangential coefficient of frictional
resistance, and roughness for each slope region. The coefficient of restitution and the tangential
coefficient of frictional resistance are used to simulate the kinetic interaction of rockfall and the
slope surface. Conversely, CRSP-3D uses finite element method algorithms that allow for the
combination of normal and tangential coefficients of the equations of motion.
Therefore CRSP-3D requires the calibration of two parameters, hardness and roughness, to
simulate rockfall interaction with the slope surface. Although the roughness parameter does
require calibration to ensure accuracy, field measurement provides foundation for initial values
leaving CRSP-3D hardness the only parameter necessary for intensive calibration efforts. This is
not the case for CRSP-2D; the associated relationship of these two parameters creates difficulty
during calibration due to the inability to truly isolate one parameter while holding the other
variable. Ultimately calibration efforts are more intensive in CRSP-2D than CRSP-3D and
theoretically contain more error in the final calibrated values. As with any simulation software
limitations and boundary conditions exist and must be recognized. Both CRSP-2D and CRSP-
3D exhibit uniquely different limitations. CRSP-2D lacks the complex rockfall shapes thus
raising questions upon its accuracy in modeling rockfall with many fracture faces and irregular
shapes. Additionally, the lack of the third dimension does not account for rockfall trajectory
variability along this axis; this directly affects the simulation accuracy of rockfall runout. Finally
the program’s development has not allowed for validation of specific model parameters (rockfall
bounce height, rockfall runout distance, and angular velocity). These parameters, especially
rockfall runout distance, provide valuable insight in the simulation of rock cut slopes and without
validation concerns may be raised when selecting a rockfall simulation program.
11
Table 3.1 Comparison of CRSP-3D and CRSP-2D (Jones, 2000) (Andrew, 2012)
Criteria CRSP-3D CRSP-2D
Mathematical
Basis
-Finite Element Method
(Lagrangian Description)
-Kinematic Equations of Motion
Rockfall Shape
-Defined by Number of Spherical Elements:
One element sphere, Two element
cylinder, Three element triangular disk Four element tetrahedron, Eight element
cube
-Spherical, Cylindrical, Discoidal
Simulation
Input
Parameter
Hardness:
-Develops elasticity and dampening of rockfall with models surface
-Must be calibrated due to sensitivity
Coefficient of restitution:
-Develops elasticity with rockfall collision to slope surface
-Calibration required due to high
sensitivity
Tangential coefficient of
frictional resistance:
-Measure of frictional resistance of
movement parallel to the slope -Calibration required due to high
sensitivity
Roughness:
-Lateral variations normal to the
slope face -Measured or estimated
-Calibration suggested: lower
sensitivity than hardness
Roughness:
-Lateral variations normal to the slope face
-Measured or estimated
-Calibration suggested: lower
sensitivity than hardness
Analysis
Partitions
Calculated Rockfall Data:
-Velocity, bounce height, kinetic
energy, stop distance (X and Z axis), rockfall passing partition
-User defined at any location along
X or Z axis
Calculated Rockfall Data:
-Velocity, bounce height, kinetic
energy, stop distance (X axis), rockfall passing partition
-User defined at any location along X
axis
Limitations -Rockfall must have a minimum mass of 100 lbs.
-12 ft. surface geometry and rockfall
release zone resolution 12 ft. -Inaccurate simulation of rockfall less
than 1.5 ft. diameter
-Program simulation not calibrated for rockfall bounce height, rockfall runout
distance, rockfall angular velocity.
-Inability to simulate rockfall runout variability in the third axis
-Inability to simulate complex rockfall
shapes
For the research conducted in this study, the selection of a rockfall simulation program was
based upon the ability of the program to provide desirable features, ease in calibration, and

12
accuracy in modeling rockfall for a wide range of rock types and slope profiles located in West
Virginia. The combination of the greater inherent accuracy that corresponds to the addition of a
third dimension coupled with the finite element method algorithms allowed CRSP-3D to be the
most suitable choice for modeling rockfall in this research study.
3.2 CRSP 3-Dimensional Field Data Collection Ideology
A systematic procedural method for field data collection is necessary in order to enable the use
of CRSP-3D to meet the requirements set by the scope of this research. The procedure
developed consists of two key components, site-selection criteria and an in-field data collection
method. A Material classification scheme that is concurrent to West Virginia DOH DD-403
material classification was also developed.
3.2.1 Introduction
The calibration of a rockfall simulation program such as CRSP-3D is extremely critical in
providing valid and accurate simulation results. Andrew (2012) states the most accurate
calibration method is achieved via creating a systematic method that involves manually rolling
rocks from a zone of interest for a site specific slope and systematically recording their behavior.
While this method may provide the most accurate results, it is impractical for the scope of this
study and the alternative method suggested by Andrew was initiated. The alternative method
suggests the study of rockfall that has already occurred, and is presently at rest on flat locations
along the slope profile (Andrew, 2012). However, an exact methodology for conducting this
alternate calibration process is not stated and is left up to the user. A similar study conducted by
Idleman (2014), suggested for a three step process for the calibration of CRSP-2D software to
West Virginia geology. Due to the similarity of CRSP-2D and CRSP-3D in their input
parameters requirements it was felt his methodology would also yield calibration for CRSP-3D
software for the geology of West Virginia. The suggested calibration methodology developed by
Idleman (2014) is presented below.
1. The creation of a site selection method for which an evaluation process is established in
order to determine if a site is appropriate for calibration techniques. The requirements set
by the site selection method ensure that the respective slope can be used for calibration
with the least amount of uncertainty and variability in the field rockfall observations,
reducing the propagation of error during simulation (Idleman, 2014).
2. A calibration process and development of an in-field data collection method. The
requirements and procedures established by the in-field data collection method ensures
than a representative sample of relevant rockfall is collected on a slope meeting the site
selection requirements. Once a calibration candidate slope has met or exceeded the
requirements set by the site selection method and the in-field data collection method, the
third and final step in the calibration process can be performed (Idleman, 2014).
3. The use of an iterative calibration procedure using CRSP software. This iterative process
allows for the validation of several variable input parameters in the software to be
determined yielding CRSP as an analysis tool that can be used on a wide range of West
Virginia bedrock cut slopes for rockfall analysis (Idleman, 2014).
3.2.2 Site Selection Criteria
Two general material classifications can be developed from the various materials present in cut
slope profiles in West Virginia. The first of these will be denoted by the nomenclature of hard
rock (Limestone and Sandstone). This group directly correlates to all Type 1 rock characteristics
denoted in the DD-403. It also includes all hard rock material found in Type 2 rock

13
characteristics denoted in the DD-403. The second group classification was denoted as soft rock.
This group directly correlates to Type 3 rock characteristics denoted in the DD-403.
Additionally this group considers all lower strength material, less structurally competent material
that “hard rock” does not consider in DD-403 Type 2 classification rock (Shale and low
compressive strength friable material). These two materials classifications will be the basis for
which a division in material type will occur for the rest of this research. As suggested by
Idleman (2014), this site selection criterion is only valid for highway bedrock cut slopes located
within West Virginia comprised entirely of bedrock as the blasted face. Soil or other materials
are not part of the scope of this site selection. A region for which site selection is to occur
should be pre-determined and discussed with the West Virginia Division of Highways before in-
field investigation occurs. This region should be kept to that of which can be visually analyzed
by drive-by inspection and should contain rock cut slopes of similar geologic material type, slope
height, and roadway corridor location (Idleman, 2014). By pre-determining the site selection
region, comparative analysis between several slopes within the region can occur and the cut
slopes with the best attributes are selected (Idleman, 2014). The following items should be
considered when determining if a site is suitable for calibration (Idleman, 2014):
The user must be able to identify the general area(s) of the slope where each rock
recorded in the data collection had originated. The simplest way of achieving this is to
select a slope which is homogenous in material type from the toe to the crest of
uppermost backslope. The rockfall for which data collection is being performed upon
should be different from that lower in the slope profile, and be located directly on top of
this homogenous material. This layer must have a measurable thickness that extends
upward to the overburden. The homogenous material located lower in the profile will be
that which is calibrated. This strata configuration allows for the greatest accountability of
rockfall and yields the most accurate calibration.
For a homogenous condition, the user is able to count rocks consisting of slope material
of interest on each bench, as well as the ditch and roadway, and know the exact origin of
all rockfall. Then, when working with the CRSP software, the user can isolate the
rockfall release zone for accurate comparison of what was observed in the field. If
homogenous material profiles do not exist within a study region; a profile containing two
or more types of rockfall material (from toe to overburden) is also acceptable for
calibration efforts. The calibration process including the software modeling will be much
more intensive (see Section 4.2.1.2)
The slope should have a section that contains a statistically significant amount of rockfall
(> 30) for at least one rockfall diameter range
The slope must be newly constructed. These profiles are more desirable as the backslopes
tend to be smoother, thus making the surface roughness parameter (S) easier to estimate.
Slopes more than five years old will most likely have benches that are inaccessible due an
excess of fallen rocks and debris or large vegetation. However, slopes that are newer
than one year old may not have retained enough rockfall to provide significant rockfall
data
Rockfall for which data can be collected must have a minimum diameter of 6 inches
The sites selected must be continuously homogenous throughout its entire length parallel
to the roadway. The number of benches, total height of slope, and strata configuration
must not change within the section. A strata layer that tapers or dissipates within the rock
count section will not be properly modeled in CRSP-3D
14
Consider short sections of the slopes’ width parallel to the roadway (between 50 to 200
feet) when determining the suitability of the section
Candidate sites should not have an excess number of benches than what is needed for
calibration efforts. Less than or equal to three benches allows for the greatest accuracy in
rockfall origin determination. Profiles with four or more benches should not be
considered for calibration unless absolutely necessary
The percentage of the slope that will be classified as hard rock and the percentage
classified as soft rock should be determined so as to allow for easier calibration of the
opposing material type during site selection for the other material
3.2.3 In-Field Data Collection Method
As discussed by Idleman, the in-field data collection, “Rock Count”, can be performed once a
site has met a satisfactory amount of the above selection criteria. A data sheet must be
developed, that contains all necessary fields for data collection in order to systematically collect
data that can be used in conjunction with CRSP-3D software input. This form should be detailed
enough that all data can easily be analyzed, but should also be as concise as possible to avoid
excessive time to complete. The form suggested by Idleman for use to complete the data
collection is shown in Table 3.2 and 3.3. These forms were selected for the research conducted
by this study due to their comprehensiveness and ease of use. These forms would be used to
collect data on an ideal site such as that discussed in the “Site Selection Criteria”. The “Rock
Count” fields are categorized by a discrete range by rock diameter. These ranges were created to
be intuitive and as to allow for the greatest ease in field measurement of rockfall (Idleman,
2014).
A complete version of the tables that describe calibration procedures for a field condition of
three or more different strata configurations can be found in the Field Workbook entitled: “CRSP
Field Calibration Workbook,” found in Appendix I. In order to perform the in-field calibration
methods several physical tools are required in addition to these worksheets. A 200 ft. surveyor’s
flexible tape measure allows for all measurements to be made accurately. A retractable tape
allows for rapid measurement of the diameter for each suitable rock. A clinometer provides
accurate readings of the angle of each backslope. The use of a GPS camera provides pictures
and accurate geographical locations (Idleman, 2014). Pictures were taken in areas of lithological
anomalies or features of which cannot be described easily via the use of the field data collection
worksheets.
Once a particular section of a field site has met the, “Site Selection Criteria” a systematic
procedure for documenting the rockfall is performed. In order to initiate the data collection in an
efficient manner it is suggested the starting location and the final location of the profile to be
delineated so as data collection does not occur outside of the selected zone, reducing the validity
of the data collection. Data collection should occur by completing the cells nearest the roadway
and working up the slope profile. Before any rock data is collected all of the necessary fields for
the profile should be completed in Table 3.2. Some of these CRSP input parameter data entry
fields require insight about the value ranges used. This information is provided in “Field
Calibration Study” located in Appendix I. Starting at one side of the selected delineated section
and working toward the other, every rock meeting minimum size requirements should be
measured and tallied for each flat surface on the profile. The rocks should be recorded on their
type, hard or soft so as to allow for appropriate identification in calibration efforts (Idleman,
2014).

15
In order to calibrate material classified as hard rock and that classified as soft rock, a minimum
of two “Rock Count” data collection sites must be performed. These sites should meet the
criteria as follows (Idleman, 2014).
At minimum, Tables 3.2 and 3.3 shall be completed for one section of rock cut slope with
homogenous hard rock strata layers from toe of slope to highest backslope, followed by a
homogenous soft bedrock strata layer(s) from the top of the hard rock section to the crest
of the slope or overburden interface (Idleman, 2014).
At minimum, Tables 3.2 and 3.3 shall be completed for one section of rock cut slopes
with homogenous soft rock strata layers from toe of slope to the highest backslope,
followed by a homogenous hard bedrock strata layer(s) from the top of the soft rock
section to the crest of the slope or overburden interface (Idleman, 2014).
Table 3.2 Sample Field Data Collection Worksheet for Slope Regions and CRSP
Input Parameters (Idleman, 2014) Cell # 1 2 3 4 5 6 7 8
Cell Location Roadway
Height/ Width (ft.)
Angle°
(Backslope Only)
Material Type Pavement
Estimated Surface
Roughness (ft.) 0.1
Estimated Surface
Hardness
Coefficient Range
Vegetative Cover
(%) 0

16
Table 3.3 Rock Count Data Collection Worksheet for CRSP Calibration
(Idleman, 2014)
It was assumed that within a specific range of rockfall diameter that the rockfall data collected
would be normally distributed. Therefore the mean size best estimates the value of the true
average value for all rockfall located on that particular site. Therefore this average value is used
as the representative value for each size range during CRSP rockfall simulation.
3.2.4 Alternate In-Field Data Collection Methods
The above data collection methods are specifically for sites meeting the most ideal case of strata
configuration, therefore allowing the most simplistic case of field data collection and number of
sites needed to allow for program calibration. In cases where ideal sites such as those explained
in detail above are not present other methods of in-field data collection must be performed. Other
methods will require a greater amount of suitable sites and accompanying data collection but still
have the ability to provide the data necessary to calibrate the two principal rock classifications.
These additional methods and respective in-field data collection worksheets can be found in
Appendix I (Idleman, 2014). In general the items listed below are considered the minimum
necessary items for an accurate calibration to occur in CSRP-3D for any material type and strata
configuration.
All major geometric regions or cells of the slope profile such as: benches, backslopes,
and ditches. If possible, all of these regions shall be measured for their true dimensions
(height, width, and angle) or if measurements are unattainable due to unsafe conditions,
the best estimations possible should be recorded.
Estimated input parameters for CSRP-3D: roughness and hardness

17
The quantity, dimension, and material type of rockfall shall be recorded for each flat,
non-backslope geometric region or cell of the calibration slope profile.
3.3 CRSP 3-Dimensional Software Calibration
The section provides a detailed description of all the input parameters necessary for accurate
CRSP-3D calibration along the specific processes required for entry and ease of use in the
program. Limitations and insight in collecting these parameters in the field has also been
documented.
3.3.1 Geometry
As with any modeling process creating the models geometry is the first critical step in the
modeling process. In CRSP-3D the three dimensional space allows for “x”, “y” and “z”
coordinates to defined in the modeling space. The “x” coordinates yield width in the cross
section of the slope; that is width perpendicular to the roadway alignment. The “z” coordinates
yield height in the cross section of the slope; that is height of the slope perpendicular to the
roadway. Finally the “y” coordinates yield depth of the cross section of the slope; that is length
of the slope parallel to the roadway. For CRSP-3D rockfall analysis, the default “y” value of 60
feet. Using a value greater than 60 feet is not necessary for profiles linear in the “y” dimension.
If the slope profile being modeled has curvature or concavity in “y” dimension, it must be
accounted for and should be assigned a magnitude in this dimension greater than 60 ft.
Intuitively when modeling in a three dimensional space concavity results in different rockfall
behavior than that a profile without curvature. All profiles created for this research did not
exhibit concavity and therefore were modeled with constant “y” values.
The field data collection for calibration requires only a short section of slope length in the “y”
direction, less than 200 feet, this magnitude of length is likely to exhibit little to no change in
geometry or rock strata configuration that would justify using a larger value than 60 feet in the
CRSP-3D software. If a candidate slope section were to have significant changes in strata
configuration then that section of slope should not be used for calibration and a more
homogenous section should be selected.
Preprocessing of the field slope measurements must be performed before any coordinate entry
can be performed in CRSP-3D. This preprocessing involves the transformation of measurements
taken in the field into x and z coordinates for the CRSP-3D software. This transformation can
only be performed when necessary field measurements have been made. The specific field
measurements needed are listed below and integrated into the “Field Calibration Study”
documentation (Idleman, 2014).
Width and Inclination of Benches
Length and Angle of Back Slope Face
Width and Angle of Ditch (if present)
Width and Angle of Earthen and Concrete/Asphalt shoulder
Width and Angle of Roadway lane
Once these field measurements have been recorded simple trigonometry can be used to
determine the lengths of the unknown or unmeasurable slope geometry. Once these values have
been calculated the determination of the slope profile in “x” and “z” coordinates can be
performed. Although the geometric depiction of a slope theoretically contains an infinite
amount of “x” and “z” components, only key coordinates are needed to describe the geometry of

18
the slope. Since the geometry of most cut slopes are considered essentially linear between all
points only areas of significant geometric change require a coordinate pair to define the
geometry. Several criteria which are listed below must be met to satisfy the programs needs for
geometric closure and later inputs in the CRSP-3D software which require reference coordinates
in order to perform the correct assignments.
Coordinate Pair Criteria
A coordinate pair must be defined at major changes in geometry such as toes and crests
of back slopes or the back and front of bench depending on the reference ideology.
Two sets of coordinate pairs must be spaced at a minimum of 12 linear feet apart as this
value is the absolute surface resolution of the program. Two coordinate values that are
more proximal that 12 linear feet will result in no additional surface curvature and will
only reduce the efficiency of the CRSP-3D algorithms.
Unless a coordinate pair is needed to depict a major geometric feature of the slopes cross
section, additional coordinate pairs are not needed to define the surface roughness of the
profile. The effects of surface roughness in CRSP-3D are configured as a material input
coefficient variable and are mathematically considered in the rockfall simulation
algorithms.
After considering these criteria, creating coordinate pairs from the calculated x and z components
of the slope can be performed. Assigning the lowest “z” value on the slope cross section with a
value of zero, typically the water containment ditch or rockfall catchment ditch, an x value can
be calculated by simply adding the x-components of the earthen shoulder, paved/concrete
shoulder and the desired lane widths. On all slope profiles, this point will have “z” value of zero
and a positive “x” value of varying magnitude depending on the slope and width of the three
roadway components listed above. This point can be considered the “z” datum and all points in
the profile will have positive values of magnitude greater than zero.
The coordinate pairs in the cross section can be calculated in the direction toward the slope or
toward the roadway by simply adding or subtracting the “x” and “z” components previously
solved. After all coordinate pairs have been calculated they should be placed in a spreadsheet
program for ease of entry into the CRSP-3D software. The spreadsheet should have each
coordinate as a column. CRSP-3D requires an input for the “y” coordinate for each coordinate
trio. A previously discussed in section 3.3.1, a value of 60 feet should be used for each “y”
coordinate in the coordinate trio. An example of a spreadsheet coordinate trio depicting a
complete slope geometry profile is shown in Table 3.4. Upon opening CRSP-3D and navigating
to the “Slope Geometry” tab a designer can simply copy and paste these coordinate trios from the
spreadsheet into the program. CRSP-3D automatically generates a graphical representation of
the slope profile from the coordinates entered. This graphical representation yields a visual
validation for the designer that the slope profile created is that of which was intended and no
errors were made.

19
Table 3.4 Example Slope Geometry Coordinate Trio for CRSP-3D
x (ft.) y (ft.) z (ft.)
0 60 94.75
22.5 60 55.75
37.5 60 54.75
50.4 60 6.45
68.4 60 5.25
74.4 60 0
96.3 60 2.3
116.3 60 3
3.3.2 Bedrock Classification
West Virginia being located entirely in the Appalachian Mountains exhibits a large variety of
geologic material across the state. In the context of rockfall simulation modeling with CRSP-3D,
all strata can be classified into two distinct groups. Further classification is not necessary as the
program uses a single hardness coefficient to describe any materials mechanical behavior.
Although many types of strata are found in the state the absolute hardness in terms of all known
geologic strata does not vary in large orders of magnitude. Therefore all strata found in the state
that will be used for this research is divided into two groups, those being of hard bedrock and
soft bedrock. Listed below are types of strata found in West Virginia that have been segregated
into these two groups for CRSP-3D modeling purposes.
Soft Bedrock
Bituminous Coal
Shale
Claystone
Dolomite
Hard Bedrock
Limestone
Sandstone
Siltstone
3.3.3 Slope Roughness
In CRSP-3D, slope roughness influences the behavioral interaction between the slope and the
simulated falling rock. In CRSP-3D, the roughness of a slope feature is defined as the lateral
variations normal to the slope face (Andrew, 2012). The program itself uses a spherical finite
element model to create the virtual roughness. A mesh consisting of rows and columns of
spheres create the surface of the slope profile. The program assumes a fixed, 12 foot lateral
spacing between sphere centers regardless of the diameter of the spheres. These spheres have a
minimum diameter of 6 feet and a maximum diameter of 60 feet. The program calculates the
roughness by the amplitude of a feature perpendicular to the slope face, divided by the fixed base
length of 12 feet. The value of this ratio is calculated within the program, the user inputs the
average or range of field observed roughness amplitudes, in feet, perpendicular to the slopes’
face, in feet, for each geologic layer (Andrew, 2012).

20
For the calibration process in this research, the roughness parameter was field estimated for each
calibration site. Every bedrock surface in the profile was observed and when feasible,
measurements of the lateral variation from what were taken from assumed baseline slope surface.
The measurements were taken to the nearest tenth of a foot. In cases were a material region in
the backslope exhibited a wide range variation, the mean of the measured roughness values was
used to represent the roughness of the region. This practice was considered to yield the most
representative surface for the entire material region during modeling. Additionally, during initial
calibration iterations, values above and below the mean, but within the field measured range was
simulated.
The resulting rockfall behavior showed minimal sensitivity to the changes in magnitude of the
backslope roughness. Therefore, it was concluded that the mean roughness of the backslope
does not reduce the accuracy of rockfall simulation and rockfall calibration efforts. Additionally,
during field data collection, the majority of bench surfaces were observed to exhibit what would
be considered zero roughness, therefore a value of 0.01 feet was input. This practice was
considered to be both representative of field conditions and was assumed to produce worst case
conditions for rockfall retention on benches due to minimal lateral interaction between the rock
and the simulated surface. A range of CRSP-3D acceptable values along with the measured
values used for calibration in this research can be found later in this chapter.
3.3.4 Slope Hardness
In CRSP-3D the slope hardness coefficient is a function of the elasticity for the collision between
falling rock and the slopes’ face. The hardness parameter also includes a damping coefficient
which measures the tangential resistance that rockfall experiences upon sliding parallel to the
slope face (Andrew, 2010). Slope hardness has the greatest effect on rockfall bounce height and
trajectory in CRSP-3D besides the slope geometry. Therefore this coefficient must be calibrated
to the geologic materials present in West Virginia in order to provide accurate simulation results.
The global ranges of hardness values are found in the “CRSP-3D User’s Manual”. Hardness
values and corresponding pictures listed in the CRSP manual should be used as a baseline for
calibration. The hardness coefficient can take on a range of values from 0.0 to 1.0 at intervals of
0.01. According to Andrew, the ranges of hardness overlap slightly for various material types
(Andrew, 2010). Additionally a specific material type can take on a fairly large range of values.
Therefore due to the sensitivity of the parameter, the ranges suggested by Andrew (2010) must
be reduced to a much smaller range in order to simulate realistic rockfall for any profile. During
calibration efforts it was found that changes in hardness of 0.01 resulted in significant changes in
simulation behavior. This illustrated that only a small range of hardness will provide acceptable
simulation results. CRSP-3D accepts single hardness values for each material or a range of
values, however during calibration a single hardness value should be used in order to minimize
added variance in rockfall behavior that occurs when a range of values are used. The findings of
this research show that calibration can only be achieved by an iterative process of using a single
hardness value. The final resulting calibrated range should only exhibit a small range of
hardness values; if a large range of hardness values is found to be valid, then this range should be
narrowed as small as possible in order to increase the precision of the simulation.
3.3.5 Slope Mechanical Properties
After all slope geometry coordinates have been entered into CRSP-3D and the three-dimensional
model has been generated, the material properties of the slope can be entered. Entering the slope
mechanical properties is the most difficult and tedious process in CRSP-3D and requires strict
attention to detail. Proper field exploration, measurement and material classification is essential

21
in generating a slope profile that matches field characteristics (Idleman, 2014). In order to
achieve the most accurate results from the CRSP-3D software, during field exploration,
documentation of the items listed below should be performed. Alternatively completing a “Field
Calibration Study” of the slope profile that is to be modeled will generate sufficient information
need for the CRSP-3D mechanical property input. Regardless of the data collection method
used, the following are the field exploration requirements for slope mechanical properties used in
CRSP-3D:
The measurement of each material thickness must be performed. This must be performed
manually by using a measuring tape from the bench above the layer of consideration, or
mathematically by previous measurements such as total backslope height and other layer
thicknesses located within the same backslope.
Each material present on the slope must be classified as either soft or hard bedrock and
documented accordingly. Further explanation on classification of hard bedrock and soft
bedrock can be found in the section titled “Bedrock Classification”
A roughness value must be measured and assigned to each material layer. The roughness
for each layer should be measured manually; if infeasible it can be approximated. A
detailed discussion regarding slope roughness and program input is explained in detail in
the “Slope Roughness” section. The field documented roughness value should be an
average of the roughness for the entire 200 feet of the calibration section for sites that
display minor variation in the roughness across the calibration section. For sites that
have larger variations in roughness across the calibration section, several observed
roughness values that characterize the total range should be recorded.
After collecting the field exploration on the calibration site, entry of the data into the CRSP-3D
software can be performed. The “Slope Material Properties” tab, which is located adjacent to the
previously used slope geometry tab and contains all fields necessary for input of calibration slope
material properties. Listed below are the steps involved in the process of generating the desired
material properties on the previously generated slope geometric profile.
1. A material ID is assigned to every layer that has a unique roughness or hardness value. A
layer is not assigned a material ID by its unique physical material type or its physical
location on the slope. A material ID can only be assigned a single roughness and
hardness value but can be assigned to multiple coordinates on the slope profile. CRSP-
3D has nine fixed material ID names. The material ID name (i.e. Hard Bedrock, Soft
Bedrock, Sand, Gravel, etc.) should be assigned to the corresponding field materials as
much as possible, but ultimately any material ID name can be used for any material found
in the field. A user simply needs to note the actual material being modeled with the
assigned material name used in CRSP-3D.
2. Assign each material ID and unique color. CRSP-3D has 16 unique color schemes
available for assignment.
3. Assign the respective roughness for each material ID from field observations previously
discussed above.
4. Assign a baseline respective hardness for each material ID from field observation
previously discussed above.
5. Material coordinate trios are assigned to each material ID. Two coordinate trios are
required to create a field observed material type region. Many of the coordinate trios
needed to create regions of a material will use the same coordinates as those calculated to
define the slope geometry. For materials types located in regions that are between the
coordinate trios used to define the slope geometry, the coordinates needed to define these

22
regions must be calculated from field measurements using the same process listed above
in the “Geometry” section. It is important to note that a unique coordinate trio cannot be
assigned to two different material ID values such as what occurs at the interface of two
material types. A gap in the coordinate values must be used in order for CRSP-3D to
properly discretize the two respective material ID regions. A gap in coordinates of .01
should be used for both the “x” and “z” planes.
3.3.6 Analysis Partitions
Completion of the “Slope Mechanical Properties” allows for the next section of the CRSP
modeling building, the placement of analysis partitions. A unique ID must be given to each
partition along with one of seven available colors in the dropdown box. Analysis partitions
record and calculate several parameters for each rock the passes the location of the analysis
partition (Andrew, 2012). Therefore information collected by analysis partitions is critical in the
analysis of rockfall behavior.
Analysis partitions should be placed in locations where detailed information about rockfall is
pertinent to calibration or analysis; such as rock trajectory height, rock velocity and rock kinetic
energy. These partitions are typically placed at the front of each bench (toward roadway) and at
the edge of pavement as to determine rockfall characteristics for rockfall reaching the roadway.
In order to collect data on the runout distance of all rockfall that has been released it is crucial to
place one analysis partition in a location where all rockfall will pass it. In bench cut slopes the
back of the uppermost bench meets these requirements. CRSP-3D requires the placement of one
analysis partition at any location along the slopes profile in order for simulation to occur. Up to
four analysis partitions can be used without compromising the programs efficiency. These
partitions can be placed in either the “x” or “z” plane. The user is required to manually input the
coordinate associated to the plane of which the partition is to be placed. If only rockfall runout
distance is pertinent in the analysis, one analysis partition located at a designer’s discretion can
be effectively performed.
Regardless of the location of analysis partition(s), CRSP-3D records rockfall runout for each
rock for the distance of entire defined distance of the slope geometry. In many cases if a
construction plan or design cross section is used, little to no geometry will be provided beyond
the edge of the toe. In order to capture the true run out distances of the rock fall, the CRSP user
must attain additional roadway geometry or other features well beyond the slopes’ toe so as to
provide additional defined geometry for the rockfall to traverse.
3.3.7 Falling Rock Parameters
In the calibration of CRSP-3D a large portion of the iterative calibration process involves trials
of varying several input attributes in the “Falling Rock Parameters” tab. This tab is separated
into five input fields. CRSP-3D allows for the designer to define the number of release zones
from a required minimum of one to a maximum equaling the number of material ID’s defined in
the “Slope Mechanical Properties” tab. CRSP-3D randomly generates rockfall along the “z” and
“x” plane of each of the defined release zones yielding varying rockfall behavior. During the
calibration process only one release zone should be chosen in order to properly calibrate the
rockfall behavior. The release zone simulated in the program should match as close as possible
to what was field documented and determined as an acceptable site for calibration.
The unit weight dialog box allows for the user to input the appropriate density for the rockfall
that will be released in the release zone. A user should use a unit weight from a reliable

23
academic source or should be determined via lab testing from a field sample of the same type
bedrock being simulated.
The next three data fields are variable to field data collection and to calibration of the CRSP-3D
program. The first data field is titled “Rocks to Release”. This field is used as the input for the
quantity of rocks that will be released from the release zone(s). For calibration purposes the
number of rocks released for each diameter range should match the number of rocks recorded for
that range over the entire calibration slope profile.
Rockfall shape is the next field in the “Falling Rock Parameters” tab. The rockfall shapes
available for simulation in CRSP-3D are as listed below:
One Element Sphere
Two Element Cylinder
Three Element Disk
Four Element Tetrahedron
Eight Element Block
Any of the above rockfall shapes can be used for simulation and will provide different rockfall
behavior proportional to their specific shape. For CRSP-3D calibration to West Virginia
Geology only rockfall shapes that match that of those collected in the field calibration data sheet
should be used. The user will obtain more accurate calibration when the simulated rockfall
shape matches that of the field site being modeled. The geology of West Virginia typically
creates rockfall that can be modeled in CRSP-3D as a Disk, Tetrahedron, or Block. Therefore
during calibration iterations all three shapes should be used in the calibration process as to
determine which shape(s) generate the most accurate model(s).
Finally the last data field in the “Falling Rock Parameters” tab of CRSP-3D is the rockfall size
which is shown in the dialog box as the “diameter” of the falling rock. However, as stated in the
CRSP-3D user’s manual, the “diameter” field does not truly equate the diameter for all the
rockfall shapes in CRSP-3D. The “diameter” term has different meanings for each rock shape. A
value placed in the rockfall size field for spherical shape does describe the diameter of the
sphere. When placing a value in this field for a cylindrical shape, the dimension entered
describes the length of the cylinder. The field corresponds to the side length of a three element
triangular disk. Simulation of a four element tetrahedron rockfall results in the “diameter”
dimension correlating to the height of the polyhedron object, defined as the height of the
triangular pyramid. Finally the “diameter” dimension for the cube shape describes the length of
the side of the cube (Andrew, 2012)
During calibration the size used is directly input from the number of that size of rocks found on
the calibration site profile. From the “Field Calibration Study”, each size range will have an
average dimensional size for the number of rocks collected in that range. This average size and
the corresponding number of rocks in that range should be a constant pair of values used during
calibration iterations for that size of rock.
3.3.8 Simulation
The “Simulation” tab in CRSP-3D is the most simplistic and only performs two functions. The
first function is a drop down box that allows the user to select a property of which will be shown
to the user during the animation of the rockfall simulation. Although the user may want a visual
representation of more than one property from this drop down menu to be shown graphically
during a simulation run, CRSP-3D is only able to show one property during the simulation
process. Regardless of the property shown (except Slope Material) CRSP-3D displays a

24
graphical scale bar with a color legend of the property that is updated in real time as each rock
travels down the slope. The following list of properties can be graphically represented in CRSP-
3D during simulation:
Slope Material
Rock Trajectory Height (feet)
Rock Kinetic Energy (foot-kips)
Rock Kinetic Energy (Kilo-Joules)
Rock Velocity (feet/second)
The second function that the “Simulation” tab performs is the ability to start the simulation of
rockfall in CRSP-3D. The user simply clicks the “Run Simulation” button and the simulation
begins. The simulation graphically depicts a single rock starting in the release zone falling until
it comes to rest, then the next rock is released and the process continues until the user defined
number of rocks to release is met. After the simulation is complete the user can select and toggle
different graphical properties from the dropdown menu. These properties will depict the values
of the final result of the rockfall simulation on the simulated slope geometry.
3.3.9 Output
The final tabular feature in the CRSP-3D software is titled “Output”. The “Output” tab has two
sub tabs under it. The first and most useful, time efficient and simple method data can be
presented is sub tab title “Stats”. This sub tab has two main sections to it. The first is a
spreadsheet type data display located at the top of the screen. The second is a graphical
histogram output. The spreadsheet is organized in rows by the number assigned to each rock
within a particular analysis ID and each column displays the various parameters CRSP-3D
measures or calculates during the simulation process. Figure 3.1 below shows all the data
parameters that CRSP calculates in the “Stats” sub tab.
Figure 3.1 CRSP-3D Output Stats Table
All rocks released will have a row in the table associated to each analysis partition but will only
have populated values in the respective columns if they passed that analysis partition. This
enables the user to determine how many rocks passed a particular analysis partition and all
parameters associated to those rocks. The histogram is populated by simply clicking any field
entry. The histogram displays all of the columns’ data for the analysis ID for which the selected
point is located. Different histograms are automatically populated by simply clicking on a data
field within the desired column. If information is desired for another analysis ID the user simply
scrolls until the data points related to that analysis ID are shown.

25
The second sub tab under the Output tab is titled “Report” This tab generates a holistic report
that contains all input parameters such as material properties, analysis partition properties, and
rockfall parameters. Additionally the report displays 16 different views of the slope. Four sets
of four view angles are used to show the four properties CRSP-3D calculates via the user defined
analysis partition(s). These properties are: rock trajectory height (ft.), rock velocity (ft/sec),
kinetic energy (ft-kips), and kinetic energy in (kilo-joules). The angle views are isometric, cross-
section, aerial oriented in the y-z axis, and aerial in the y-x axis. The report generates several
small spreadsheet type tables. The first table is the calculated maximum values for bounce
height, velocity, energy, and the percent passing each of the defined analysis partition. Finally
the CRSP-3D report generates histograms for bounce height, velocity, kinetic energy, and rock
rollout distance along the x-axis. These histograms are the same as those accessed in the stats
tab but can be viewed simultaneously.
3.4 CRSP 3-Dimensional Limitations
All of the Colorado Rockfall Simulation software written to this point (CRSP 2D and 3D) was
created to model slopes of large magnitude, approximately 800 feet or more in all respective
axis’s. This becomes clearly evident in the CRSP-3D tutorial and the CRSP-3D user’s manual,
where all the slopes depicted are of this scale. The simulation of rockfall events on large
canyons where large boulders are created from the natural geomorphic behavior is very different
than engineered rock cut slopes. The difference in scope between Colorado’s objective and the
objectives of this research creates several limitations in the design and analysis of rockfall on
bench cut rock slopes in West Virginia. These limitations are listed below and must be
considered before any calibration efforts or extensive rockfall modeling is performed.
1. In order CRSP-3D to run without the program crashing and for correct rockfall behavior
to occur the rock being released must have a mass of 100 pounds. Keeping the density of
the rockfall material constant, each rockfall shape (sphere, cylinder, disk, etc.) will
require a different critical size in order to meet this mass requirement.
2. The geometry of CRSP-3D is generated by the simulated surface of spheres that are
spaced at a fixed distance of twelve feet from the center of one sphere to the sphere
adjacent to it (Andrew, 2012). If geometric points are not defined every twelve feet,
CRSP-3D extrapolates automatically new point data from the nearest user defined points.
The fixed twelve foot spacing becomes a significant limitation in CRSP-3D when
modeling the relatively variable small scale geometry and small material layer
thicknesses that exist in West Virginia. Additionally the large resolution becomes
cumbersome in defining the release zones for rockfall. Slope geometry points in any axis
cannot be defined in CRSP-3D as any linear distance less than twelve feet. If a geometric
feature, material layer, or release zone physically exists at a value less than twelve feet in
any dimension from another defined point, one of the features must be omitted,
expanded, or altered to where the two points are separated by a linear distance the twelve
feet.
3. Rockfall regardless of shape, having dimensions less than 1.5 feet do not produce
behavior that is consistent of that of which has been field observed in bench cut rock
slopes in West Virginia. Even if these rocks meet the 100 pound rockfall mass
requirement, rocks with diameters less than 1.5 feet tend to simply slide down the
backslope and exhibit little to zero runout distance. Rockfall that are 1.5 feet and greater
will freefall, bounce, and roll in a manner of which is expected for the kinematic behavior
of rockfall. If rockfall with diameters less than 1.5 feet is to be modeled it must be
performed in another analysis program such as CRSP-2D.

26
3.5 CRSP 3-Dimensional Calibration Iteration Procedures
Sections 3.5.1 and 3.5.2 are discussed in context of the calibration ideology developed by
Idleman (2014), the specific program parameters that must be calibrated for CRSP-3D software.
In addition parameter ranges from the CRSP-3D user’s manual are shown as reference and
validation of the final result of calibration efforts conducted by this study.
3.5.1 Calibration Spreadsheet
In order to calibrate CRSP one of the three method worksheets from the “CRSP Field Calibration
Study” must be completed for a slope that meets the criteria defined for the method being used
(Idleman, 2014). After the worksheet is complete the calibration procedure using the CRSP-3D
software can be performed. Since CRSP-3D does not create a database for its output for each
simulation, a database must be created using another program spreadsheet program such as
Excel® must be used so as comparative post simulation analysis can be performed. For greater
simplicity and ease during the calibration process all pertinent input variables should also be
recorded in the database. A single spreadsheet page should be dedicated to “Rock Count”
information observed from the suitable site location for which calibration is to occur (Idleman,
2014). The database should contain at minimum the information listed below under “Rock
Count” or more complete spreadsheet can be created by using the respective worksheets in the
“Field Calibration Study” located in Appendix I (Idleman, 2014). A second spreadsheet page
should be dedicated to the calibration parameter output results. This spreadsheet should contain
at minimum the following information listed under “Calibration Parameters and Coefficients” as
parameter headings:
Rock Count
Location of rockfall on slope (bench number, ditch, etc.)
Location of origin for rockfall
Material type (Hard of Soft)
Rock diameter ranges
Total of all rocks in each size range
Total number of rocks on each bench
Calibration Parameters and Coefficients
The calibration trial number
The roughness and hardness coefficients for all layers of hard rock
The roughness and hardness coefficients for all layers of soft rock
The range of rock size being using for calibration
The actual size of rock size being calibrated in CRSP software
The various rock shapes
Rock density
All regions where rockfall is being generated from
All geometric regions where rock fall can accumulate
A database containing this information will provide a means for determining coefficients,
parametric sensitivity and results. This database will allow for the interpretation of results from
each trial calibration run ultimately determining the input parameters for any modeling
performed on West Virginia cut rock slopes that contain either or both hard rock and soft rock.

27
3.5.2 Iterative Procedure for Determining Input Rock Parameters
Using the guide procedure established in the “CRSP-3D Software Calibration” section a suitable
calibration slope must have the field measured geometry converted into “x”, “y”, and “z”
coordinates. These coordinates should be placed into some form of spreadsheet to allow for
greater ease of assigning the field documented material properties to these Cartesian coordinates.
After calculating the coordinates for each material they can then be entered into the “Geometry”
tab in CRSP-3D.
1. The first step in the iteration process begins with assigning baseline values for the
material hardness and roughness to each material layer for the specific calibration site of
interest (Idleman, 2014). Table 3.5 below is taken from the CRSP Field Calibration
Study and should be used to develop this baseline values:
Table 3.5 CRSP-3D: Suggested Roughness Input Ranges and Descriptions for
Slope Profiles (CRSP-3D User’s Manual, 2012)
Roughness Value Range Comments
> 3.0 Generally only used for very rough slope surfaces where high
bounce heights are predicted or have been observed.
1.0 – 2.0
Generally for use on most slope surfaces with most falling rock
geometries, even if the slope is relatively smooth. This
compensates for the non-uniformity in most rock shapes and
slope surfaces.
0.1 – 1.0 Roughness values below 2.0 may produce higher than expected
values when modeling spherical rocks.
The table above provides initial insight into typical ranges of the CRSP-3D roughness
parameter that were developed primarily for “natural” slopes in Colorado topography
(Andrew, 2012). Although the CRSP-3D user’s manual suggests these values can used
as baseline for any bedrock cut slope, blasted cut slope profiles possess lower average
roughness than “natural” slopes. Typical values of roughness for blasted bench cut
profiles exhibit lower roughness magnitude due to the relatively smooth blasted faces and
bench surfaces. Therefore, for this research, the CRSP-3D user’s manual
recommendation to avoid CRSP-3D roughness values lower than 1.0 was not considered
when calibrating CRSP-3D for West Virginia’s rock cut slopes. Although the roughness
parameter affects simulated rockfall behavior for any slope profile regardless of
geometry, calibration efforts performed in this study have found the parameter to much
lower sensitivity than other parameters such as CRSP-3D hardness rockfall shape, and
rockfall diameter.
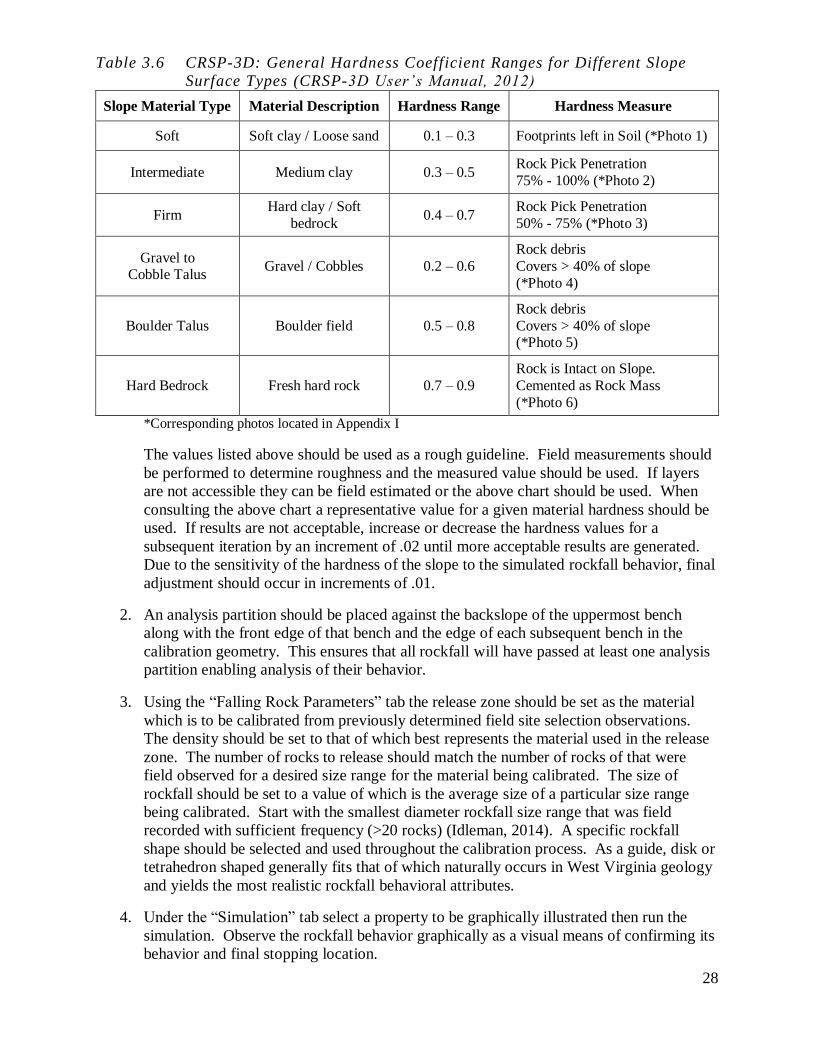
28
Table 3.6 CRSP-3D: General Hardness Coefficient Ranges for Different Slope
Surface Types (CRSP-3D User’s Manual, 2012)
Slope Material Type Material Description Hardness Range Hardness Measure
Soft Soft clay / Loose sand 0.1 – 0.3 Footprints left in Soil (*Photo 1)
Intermediate Medium clay 0.3 – 0.5 Rock Pick Penetration
75% - 100% (*Photo 2)
Firm Hard clay / Soft
bedrock 0.4 – 0.7
Rock Pick Penetration
50% - 75% (*Photo 3)
Gravel to Cobble Talus
Gravel / Cobbles 0.2 – 0.6
Rock debris
Covers > 40% of slope
(*Photo 4)
Boulder Talus Boulder field 0.5 – 0.8
Rock debris
Covers > 40% of slope (*Photo 5)
Hard Bedrock Fresh hard rock 0.7 – 0.9
Rock is Intact on Slope.
Cemented as Rock Mass
(*Photo 6)
*Corresponding photos located in Appendix I
The values listed above should be used as a rough guideline. Field measurements should
be performed to determine roughness and the measured value should be used. If layers
are not accessible they can be field estimated or the above chart should be used. When
consulting the above chart a representative value for a given material hardness should be
used. If results are not acceptable, increase or decrease the hardness values for a
subsequent iteration by an increment of .02 until more acceptable results are generated.
Due to the sensitivity of the hardness of the slope to the simulated rockfall behavior, final
adjustment should occur in increments of .01.
2. An analysis partition should be placed against the backslope of the uppermost bench
along with the front edge of that bench and the edge of each subsequent bench in the
calibration geometry. This ensures that all rockfall will have passed at least one analysis
partition enabling analysis of their behavior.
3. Using the “Falling Rock Parameters” tab the release zone should be set as the material
which is to be calibrated from previously determined field site selection observations.
The density should be set to that of which best represents the material used in the release
zone. The number of rocks to release should match the number of rocks of that were
field observed for a desired size range for the material being calibrated. The size of
rockfall should be set to a value of which is the average size of a particular size range
being calibrated. Start with the smallest diameter rockfall size range that was field
recorded with sufficient frequency (>20 rocks) (Idleman, 2014). A specific rockfall
shape should be selected and used throughout the calibration process. As a guide, disk or
tetrahedron shaped generally fits that of which naturally occurs in West Virginia geology
and yields the most realistic rockfall behavioral attributes.
4. Under the “Simulation” tab select a property to be graphically illustrated then run the
simulation. Observe the rockfall behavior graphically as a visual means of confirming its
behavior and final stopping location.

29
5. After completion of the “Simulation” the “Output” tab will have the results from the
simulation. Under the “Stats” sub tab generate a histogram for analysis partition that is
located at the uppermost point on the slope by clicking on any of the field entries under
the “Stop X, ft.” column. The scale for stop distance is located along the “x” axis of the
histogram and the frequency of occurrence is located on the “y” axis. Using the
previously defined “x” coordinates associated to bench locations, correlate and assign the
frequency of rockfall that occurred at the bench locations with the respective benches in
the previously created output data spreadsheet.
6. Once all rockfall has been assigned to the respective benches compare the values of
rockfall that occurred in the simulation on a bench by bench basis to the actual field
“Rock Count” data.
7. If the values between the simulation and the field observed values are significantly
different, then the hardness coefficient must be adjusted accordingly. Listed below are
suggestions to converge the behavior of the CRSP-3D simulation to the field “Rock
Count” data.
Table 3.7 CRSP-3D: Hardness Coefficient Adjustment
CRSP-3D Output Field “Rock Count” Data Calibration Action Required
Rockfall retention
primarily on 1st bench
Significant rockfall located
below first bench
Increase the hardness of the
material being calibrated.
Rockfall retention
primarily at toe of slope
Significant rockfall located
upslope of the toe
Decrease the hardness of the
material being calibrated
Rockfall retention
faction is split between
1st bench and toe
Significant rockfall located
at intermediate location on
slope
Increase or decrease the hardness
by .01, perform another iteration
and compare results to prior trials
8. After simulation and the field observation rockfall runout location has converged,
document the value of hardness that yielded convergence (Idleman, 2014). In CRSP-3D
the range of calibrated hardness values should not be larger than 0.03. If a larger range is
found then additional calibration sites may be required in order to achieve calibrated
hardness values. In most cases a hardness values with a range of 0.02 will produce
similar results. Therefore use of any of the three values within that range can be
considered calibrated values.
9. In the “Falling Rock Parameters” tab enter the next larger size range of rockfall and the
associated frequency that was field documented in the rock count for the calibration site.
Using the temporarily calibrated hardness value from the first rockfall diameter size
range, run another the simulation with the larger diameter rockfall. Observe the results in
the same comparison manner as discussed in “Step 5-7”. If the rockfall behavior differs
significantly then what was field documented use Table 3.7 as a guideline for adjusting
the hardness. The modification to the hardness value should be done in increments of .01
as the value should not need much adjustment to provide acceptable results.
10. All other field observed sizes ranges should be simulated using the hardness value
established in “Step 9”. If results are not desirable with established hardness value,
modify this value in increments of .01. The final value of hardness used to simulate the
largest rockfall must be subsequently re-simulated for the smallest diameter rockfall as a

30
means of verification of its validity. If this final value of hardness yields acceptable
results for the smaller diameter rockfall, the material is calibrated for hardness. If the
smallest diameter rockfall does not yield acceptable results, an intermediate hardness
value should be used for the material. The intermediate value selected should yield
equally compromising results for both small and large diameter rockfall.
11. Behavior analysis of other rockfall shapes should be conducted at this time to allow for
the determination of which rockfall shape generates the greatest similarity to the field
“Rock Count” data. Begin with the previously calibrated hardness values then repeat
“Steps 3-10”, documenting the simulation outputs in a spreadsheet (Idleman, 2014).
12. Completion of calibration simulations for all the defined rockfall shapes in CRSP-3D
allows for a final determination of which rockfall shape yields the best calibration results.
The rockfall shape that produces the most desirable calibration results and possess a
representative shape of rockfall for the calibration material should be used for all
subsequent rockfall simulation (Idleman, 2014).
3.6 CRSP 3-Dimensional Calibration Case Studies
Two calibration case study locations were used in order to calibrate CRSP-3D to West Virginia
geology. The investigations presented in the following sections were done in direct collaboration
with Idleman due to the importance of achieving calibrated CRSP-3D parameters. Interim
results comparison between CRSP-2D and CRSP-3D were discussed until it was agreed that both
programs had been successfully calibrated (personal communication, April 30, 2014).
3.6.1 Introduction
In order to effectively model rockfall along highway rock cut slope for West Virginia a rockfall
simulation program such as CRSP-3D must be calibrated for the geology and rockfall behavior
specific to the state. Analysis of field exploration has shown that rockfall behavior principally
depends on the hardness of the rock and the hardness of the surface it strikes. Therefore as stated
earlier for rockfall modeling purposes two different rock material classifications were created.
The two sites used in this research were considered “ideal” in their strata configuration.
Therefore the data collected from these sites allows for the most simplistic and accurate
calibration (Idleman, 2014).
3.6.2 Soft Rock Calibration: U.S. Route 121
Following insight provided by members of the WVDOH Geotechnical Design Section and
Idleman, U.S. Route 121 near Sophia, West Virginia was chosen as a case study location
(Idleman, 2014). The specific section of the highway used for this case study was three years old
and contained many large bedrock bench cut slopes. The roadway (subgrade, sub-base and
pavement) had not been constructed and was not open public entry. This allowed easy access
and safe conditions for traversing the various slope profiles. The methods described in Section
3.2.3 “In-Field Data Collection Method” were implemented. In collaboration with Idleman, data
shown in Tables 3.8 and 3.10 were observed from field measurements and “rock count”
procedures (Idleman, 2014). Table 3.9 was also created under suggestions of Idleman but
contain the respective initial CRSP-3D parameter ranges taken from the CRSP-3D user’s manual
(personal communication, July 3, 2014) (Andrew, 2012).

31
Table 3.8 U.S. Route 121 Soft Rock Calibration Site Overview (Idleman, 2014)
Parameter Site Information
Region of Data Collection on Profile Toe of Slope to Overburden
Total Number of Benches used for Rock
Count Data Collection
Three
Total Height of Data Collection Region Estimated: 180 ft.
Width of Data Collection Section
(Parallel to Roadway)
200 ft.
Assumed Rockfall Origin Location Hard Bedrock Section, Crest of Slope
Total Number of CRSP Material Regions
(Cells)
Ten
Total Number of Rocks Tallied 142
Average Diameter of Rocks Tallied 1.5 feet
Table 3.9 U.S. Route 121 Field Data Collection Worksheet for Slope Regions and
CRSP Input Parameters
Cell # 1 2 3 4 5 6 7 8 9 10
Slope
Region
Road Drainage Ditch
Backslope 1
Bench 1 Backslope 2
Bench 2 Backslope 3
Bench 3 Backslope 4.1
Backslope 4.2
Height/
Width
(ft.)
N/A 25 13 25 49 32 67 20 30 25
Backslope
Angle (°)
N/A 6° 40° N/A 75° N/A 80° N/A 75° 75°
Estimated
Surface
Roughnes
s (ft.)
0.1 0.1 0.2 0.1 0.5 0.1 0.4 0.1 1.5 0.75
Vegetative
Cover
(%)
0 100 100 100 0 50 5 5 0 5
Material
Type in
Region
Asphalt Firm Soil
Firm Soil Soft Bedrock
Soft Bedrock
Soft Bedrock
Soft Bedrock
Soft Bedrock
Soft Bedrock
Hard Bedrock
Initial
CRSP
Hardness
Range
0.6 –
1.0
0.3 – 0.7 0.3 – 0.7 0.3 – 0.7 0.3 – 0.7 0.3 – 0.7 0.3 – 0.7 0.3 – 0.7 0.3 – 0.70 0.7 – 0.9
Note: In order to avoid an unsafe measuring practice, some portions of the slope profile were estimated.
These estimates were developed via guidance from the WV DD-403.

32
Table 3.10 U.S. Route 121 Rock Count Data Collection Worksheet for CRSP
Calibration (Idleman, 2014)
CRSP
Slope
Region
(Cell) #
Rock Diameter (ft.)
0.5 –1.0 1.0 – 1.9 2.0 – 2.9 3.0 – 3.9 4.0 – 4.9 > 5.0
1 0 0 0 0 0 0
2 1 2 0 0 0 0
4 5 5 1 1 0 1
6 12 22 9 1 0 1
8 39 20 13 4 3 2
Total: 57 49 23 6 3 4
Figure 3.2 U.S. Route 121 Soft Rock Calibration in CRSP-3D Model Space
After the model was created in CRSP-3D, the iterative procedure outline in Section 3.5.2 was
performed. A hardness value of 0.45 was initially assumed for the soft rock material and a
hardness value of 0.8 was assumed and kept constant for the hard rock material. A tetrahedron
was selected as the best shape for representation of the multiple fractured faces and angularity
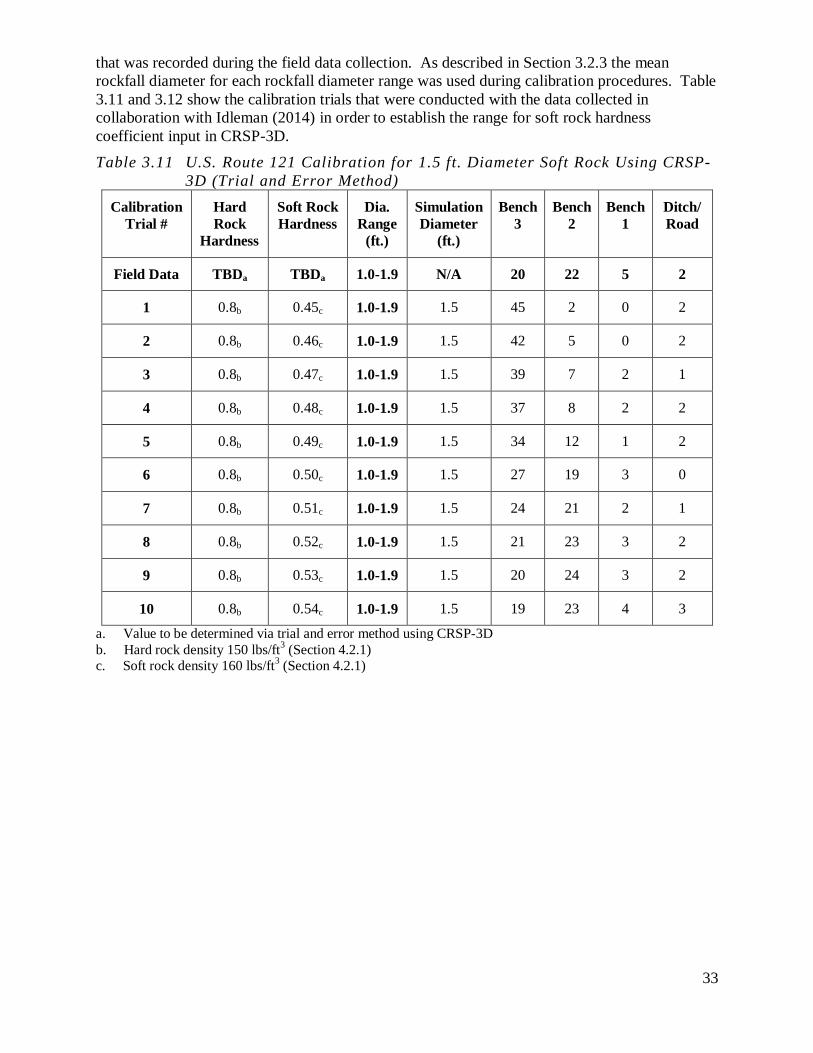
33
that was recorded during the field data collection. As described in Section 3.2.3 the mean
rockfall diameter for each rockfall diameter range was used during calibration procedures. Table
3.11 and 3.12 show the calibration trials that were conducted with the data collected in
collaboration with Idleman (2014) in order to establish the range for soft rock hardness
coefficient input in CRSP-3D.
Table 3.11 U.S. Route 121 Calibration for 1.5 ft. Diameter Soft Rock Using CRSP-
3D (Trial and Error Method)
Calibration
Trial #
Hard
Rock
Hardness
Soft Rock
Hardness
Dia.
Range
(ft.)
Simulation
Diameter
(ft.)
Bench
3
Bench
2
Bench
1
Ditch/
Road
Field Data TBDa TBDa 1.0-1.9 N/A 20 22 5 2
1 0.8b 0.45c 1.0-1.9 1.5 45 2 0 2
2 0.8b 0.46c 1.0-1.9 1.5 42 5 0 2
3 0.8b 0.47c 1.0-1.9 1.5 39 7 2 1
4 0.8b 0.48c 1.0-1.9 1.5 37 8 2 2
5 0.8b 0.49c 1.0-1.9 1.5 34 12 1 2
6 0.8b 0.50c 1.0-1.9 1.5 27 19 3 0
7 0.8b 0.51c 1.0-1.9 1.5 24 21 2 1
8 0.8b 0.52c 1.0-1.9 1.5 21 23 3 2
9 0.8b 0.53c 1.0-1.9 1.5 20 24 3 2
10 0.8b 0.54c 1.0-1.9 1.5 19 23 4 3
a. Value to be determined via trial and error method using CRSP-3D
b. Hard rock density 150 lbs/ft3 (Section 4.2.1)
c. Soft rock density 160 lbs/ft3 (Section 4.2.1)

34
Table 3.12 U.S. Route 121 Calibration for 2.5 ft. Diameter Soft Rock Using CRSP-
3D (Trial and Error Method)
Calibration
Trial #
Hard
Rock
Hardness
Soft Rock
Hardness
Dia.
Range
(ft.)
Simulation
Diameter
(ft.)
Bench
3
Bench
2
Bench
1
Ditch/
Road
Field Data TBDa TBDa 2.0-2.9 N/A 13 9 1 0
1 0.8b 0.45c 2.0-2.9 2.5 23 0 0 0
2 0.8b 0.46c 2.0-2.9 2.5 23 0 0 0
3 0.8b 0.47c 2.0-2.9 2.5 22 1 0 0
4 0.8b 0.48c 2.0-2.9 2.5 21 1 1 0
5 0.8b 0.49c 2.0-2.9 2.5 20 2 1 0
6 0.8b 0.50c 2.0-2.9 2.5 18 4 1 0
7 0.8b 0.51c 2.0-2.9 2.5 19 4 0 0
8 0.8b 0.52c 2.0-2.9 2.5 16 6 0 1
9 0.8b 0.53c 2.0-2.9 2.5 13 7 1 2
10 0.8b 0.54c 2.0-2.9 2.5 16 3 2 2
a. Value to be determined via trial and error method using CRSP-3D
b. Hard rock density 150 lbs/ft3 (Section 4.2.1)
c. Soft rock density 160 lbs/ft3 (Section 4.2.1)
Analyzing Table 3.11 and 3.12, it is proven as stated in the CRSP-3D manual, small incremental
changes in the CRSP-3D hardness coefficient, 0.01, effects rockfall behavior when other factors
are kept constant. Therefore, within the large hardness range specified by CRSP-3D manual (0.3
to 0.7), only a small increment of that range can be applied to soft rock material present in West
Virginia geology. Two different dimensionally proximal rock sizes were used to validate that a
given hardness range yields similar results for different rockfall dimensions. Although not
shown in Table 3.11 or 3.12, other rockfall shapes were analyzed but did not yield as consistent
results for both rockfall sizes. The following parameters and corresponding values listed in
Table 3.13 are considered calibrated values for the scope of this research.
Table 3.13 Calibrated CRSP-3D Parameters for Soft Bedrock in West Virginia
Calibrated Parameter Range CRSP-3D User’s Manual
Suggested Parameter Range
CRSP-3D Hardness Coefficient 0.52 to 0.54 0.3 to 0.7
CRSP-3D Rock Shape Tetrahedron ---

35
3.6.3 Hard Rock Calibration: U.S. Route 48
U.S. Route 48 near Moorefield, West Virginia was chosen as a case study location following the
insight provided by members of the WVDOH Geotechnical Design Section. The specific section
of the highway used in this case study was six years old and contained many large bench cut rock
cut slopes. This region of highway had cut slopes consisting almost exclusively of sandstone and
limestone. Therefore no sections were found that contained soft rockfall, therefore this did not
allow for the same calibration approach to be performed as previously discussed for soft rock.
Large quantities of existing rockfall were present on the site that was selected, but only a portion
of this rockfall, of which the origin could be determined, were used in the data collection and
calibration process (Idleman, 2014).
The methods described in Section 3.2.3 “In-Field Data Collection Method” were implemented.
In collaboration with Idleman, data shown in Tables 3.14 and 3.16 were observed from field
measurements and “rock count” procedures (Idleman, 2014). Table 3.15 was also created under
suggestions of Idleman but contain the respective initial CRSP-3D parameter ranges taken from
the CRSP-3D user’s manual (personal communication, July 3, 2014) (Andrew, 2012).
Table 3.14 U.S. Route 48 Hard Rock Calibration Site Overview
Parameter Site Information
Region of Data Collection on Profile Toe of Slope to Overburden
Total Number of Benches used for Rock Count
Data Collection
Two
Total Height of Data Collection Region 95 ft.
Width of Data Collection Section
(Parallel to Roadway)
200 ft.
Assumed Rockfall Origin Location Backslope 1 and Backslope 2
Total Number of CRSP Material Regions (Cells) Seven
Total Number of Rocks Tallied 139
Average Diameter of Rocks Tallied 1.2 feet

36
Table 3.15 U.S. Route 48 Field Data Collection Worksheet for Slope Regions and
CRSP Input Parameters
Cell # 1 2 3 4 5 6 7
Slope
Region
Road Drainage
Ditch
Backslope
1
Bench 1 Backslope
2
Bench 2 Backslope
Height/
Width (ft.)
N/A 22 5.25 18 50 15 45
Backslope
Angle(°)
N/A 6° 40° N/A 75° N/A 60°
Estimated
Surface
Roughness
(ft.)
0.0 0.0 0.50 0.0 0.75 0.0 0.80
Vegetative
Cover (%)
0 100 10 5 0 75 50
Material
Type in
Region
Asphalt Firm Soil Hard
Bedrock
Talus
Hard
Bedrock
Hard
Bedrock
Hard
Bedrock
Hard
Bedrock
Initial CRSP
Hardness
Range
0.6 – 1.0 0.3 – 0.7 0.3 – 0.7 0.7 – 0.9 0.7 – 0.9 0.7 – 0.9 0.7 – 0.9
Note: In order to avoid an unsafe measuring practice, some portions of the slope profile were estimated.
These estimates were developed via guidance from the WVDOH DD-403.
Table 3.16 U.S. Route 48 Rock Count Data Collection Worksheet for CRSP
Calibration
CRSP
Slope Region
(Cell) #
Rock Diameter (ft.)
0.5 –1.0 1.0 – 1.9 2.0 – 2.9 3.0 – 3.9 4.0 – 4.9 > 5.0
1 0 0 0 0 0 0
2 0 0 0 0 0 0
4 82 35 15 2 0 0
6 78 38 11 4 0 0
Total 160 73 26 6 0 0
Known Origin
Rockfall
83 41 11 4 0 0
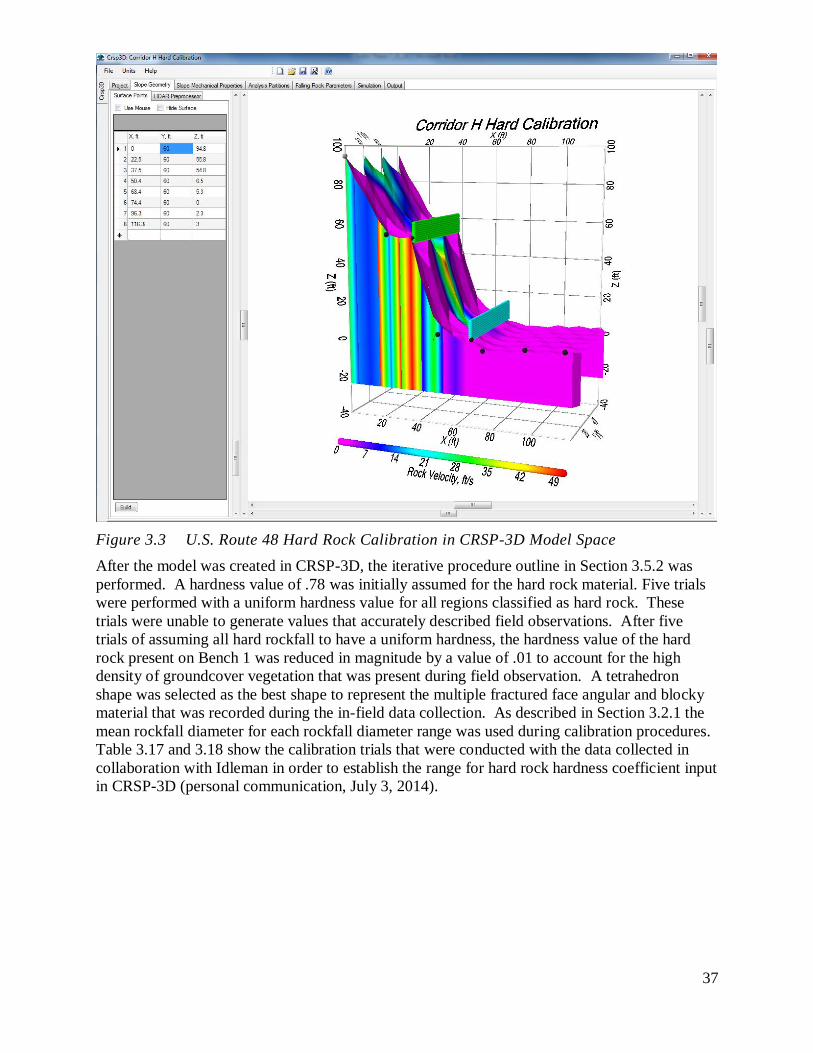
37
Figure 3.3 U.S. Route 48 Hard Rock Calibration in CRSP-3D Model Space
After the model was created in CRSP-3D, the iterative procedure outline in Section 3.5.2 was
performed. A hardness value of .78 was initially assumed for the hard rock material. Five trials
were performed with a uniform hardness value for all regions classified as hard rock. These
trials were unable to generate values that accurately described field observations. After five
trials of assuming all hard rockfall to have a uniform hardness, the hardness value of the hard
rock present on Bench 1 was reduced in magnitude by a value of .01 to account for the high
density of groundcover vegetation that was present during field observation. A tetrahedron
shape was selected as the best shape to represent the multiple fractured face angular and blocky
material that was recorded during the in-field data collection. As described in Section 3.2.1 the
mean rockfall diameter for each rockfall diameter range was used during calibration procedures.
Table 3.17 and 3.18 show the calibration trials that were conducted with the data collected in
collaboration with Idleman in order to establish the range for hard rock hardness coefficient input
in CRSP-3D (personal communication, July 3, 2014).

38
Table 3.17 U.S. Route 48 Calibration for 1.5 ft. Diameter Hard Rock Using
CRSP-3D (Trial and Error Method)
Calibration
Trial #
Hard
Rock
Hardness
Hard
Rock
Hardness
Bench 1
Dia.
Range
(ft.)
Simulation
Diameter
(ft.)
Bench 2 Bench 1 Ditch/
Road
Field Data TBDa TBDa 1.0-1.9 N/A 38 3 0
1 0.78b 0.78b 1.0-1.9 1.5 41 0 0
2 0.79b 0.79b 1.0-1.9 1.5 40 1 0
3 0.80b 0.80b 1.0-1.9 1.5 40 1 0
4 0.81b 0.81b 1.0-1.9 1.5 35 6 0
5 0.82b 0.82b 1.0-1.9 1.5 33 8 0
6 0.78b 0.77b,c 1.0-1.9 1.5 41 0 0
7 0.79b 0.78b,c 1.0-1.9 1.5 41 0 0
8 0.80b 0.79b,c 1.0-1.9 1.5 38 3 0
9 0.81b 0.80b,c 1.0-1.9 1.5 38 3 0
10 0.82b 0.81b,c 1.0-1.9 1.5 38 3 0
a. Value to be determined via trial and error method using CRSP-3D
b. Hard rock density 150 lbs/ft3 (Section 4.2.1)
c. Value reduced by .01 to account for heavy vegetation present on Bench 1 (See Section 3.6.2 for
additional details)

39
Table 3.18 U.S. Route 48 Calibration for 2.5 ft. Diameter Hard Rock Using
CRSP-3D (Trial and Error Method)
Calibration
Trial #
Hard
Rock
Hardness
Hard
Rock
Hardness
Bench 1
Dia.
Range
(ft.)
Simulation
Diameter
(ft.)
Bench 2 Bench 1 Ditch/
Road
Field Data TBDa TBDa 2.0-2.9 N/A 11 15 0
1 0.78b 0.78b 2.0-2.9 2.5 16 9 1
2 0.79b 0.79b 2.0-2.9 2.5 16 7 3
3 0.80b 0.80b 2.0-2.9 2.5 13 4 6
4 0.81b 0.81b 2.0-2.9 2.5 11 9 6
5 0.82b 0.82b 2.0-2.9 2.5 10 10 6
6 0.78b 0.77b,c 2.0-2.9 2.5 18 8 0
7 0.79b 0.78b,c 2.0-2.9 2.5 16 10 0
8 0.80b 0.79b,c 2.0-2.9 2.5 13 13 0
9 0.81b 0.80b,c 2.0-2.9 2.5 12 13 1
10 0.82b 0.81b,c 2.0-2.9 2.5 10 13 3
a. Value to be determined via trial and error method using CRSP-3D
b. Hard rock density 150 lbs/ft3 (Section 4.2.1)
c. Value reduced by .01 to account for heavy vegetation present on Bench 1
(See Section 3.6.2 for additional details)
Analyzing Table 3.17 and 3.18, it is proven as stated in the CRSP-3D manual, small incremental
changes in the CRSP-3D hardness coefficient, 0.01, effects rockfall behavior when other factors
are kept constant. Therefore within the large hardness range specified by CRSP-3D manual (0.7
to 0.9), only a small increment of that range can be applied to hard rock material present in West
Virginia geology. Two different dimensionally proximal rock sizes were used to validate that a
given hardness range yields similar results for different rockfall dimensions. Although not
shown in Table 3.17 or 3.18, other rockfall shapes were analyzed but did not yield as consistent
results for both rockfall sizes. The statement does not explicitly imply that different rockfall
shapes could not be calibrated to West Virginia geology, it only illustrates that for the scope of
this research other rockfall shapes provided insufficient ability to be calibrated as compared to
the tetrahedron shape. Therefore the following parameters in Table 3.19 and accompanying
values are considered calibrated values for the scope of this study.

40
Table 3.19 Calibrated CRSP-3D Parameters for Hard Bedrock in West Virginia
Calibrated Parameter Range CRSP-3D User’s Manual
Suggested Parameter Range
CRSP-3D Hardness
Coefficient 0.80 to 0.82 0.7 to 0.9
CRSP-3D Rock Shape Tetrahedron ---
4. CRSP 3-DIMENSIONAL PARAMETERIC ANALYSIS
4.1 Introduction
The design of cut sections through bedrock is presented by the West Virginia Department of
Highways DD-403 to consist of extensive preliminary site investigation, comprehensive yet
flexible design philosophy, extensive construction, and long term maintenance. Of these items
the design of the cut slope itself provides the greatest difficulty and effects both the construction
and the long maintenance of the slope. The West Virginia Design Directive 403 was created to
provide guidance for the design of cut slope through bedrock. This directive suggests that most
principal elements of the design involves the identification of the rock strata which the design cut
slope possesses (WVDOH, 2006). The directive separates all strata found in the state into four
different bedrock types. Each bedrock type corresponds to specific suggested design backslope
geometry. Table 4.1 lists the four bedrock types and the corresponding backslope ratios are
shown below.
Table 4.1 WVDOH Design Directive 403 Bedrock Type and Suggested Geometry
(Over 50ft. Backslope Height) (WVDOH, 2006)
Rock Type WVDOH
Rock Type
Recommend
Backslope Ratio
(H:V)
Suggested Minimum
Bench Width Range
(ft.)
Hard and Medium -Hard Limestone,
Sandstone and Hard Shale
Compressive Strength: > 8000 psi
1 1/6:1 15-20a,b
Soft Sandstone, Medium Hard Shale,
Soft Limestone, Siltstone or interbedded
combinations
Compressive Strength: 4000-8000 psi
2 1/2:1 15-20a,b
Soft Shale interbedded with Siltstone,
Sandstone or Limestone
Compressive Strength: 1000-4000 psi
3 3/4:1 15-20a,b
Soft Shale (alternative design)
Compressive Strength: <1000 psi 4 1:1 15-20a,b
a. Bench width range for roads classified as arterials. For slopes with backslopes heights less than 25 ft. a
minimum bench width of 15 ft. shall be used. For backslope heights greater than 25 ft. a minimum bench
width of 20 ft. shall be used.
b. Bench Width of all other roads shall have a minimum bench width of 10 feet for all intermediate
benches and 15 feet for the bench located just above the roadway grade.
41
From Table 4.1, basic geometric design of a bedrock slope is produced. This information is not
intended to not be a strict design guideline, specific values depend on local geologic conditions
and therefore the above values can be adjusted by an engineer’s discretion. The deviation from
the above suggested values should be done as a means to improve slope stability, reduce rockfall
and improve roadway safety for the public.
The analysis of the behavior of inevitable rockfall on a bedrock bench cut slope is critical to the
design of an effectively engineered highway slope. One of the largest factors in rockfall
behavior is the design geometry of the slope. The geometry affects all attributes of the rockfall
such as the trajectory, velocity, kinetic energy, bouncing behavior, and most importantly the
location of where the rockfall returns to a velocity of zero and lays to rest. The variability of the
geometry consists primarily of the parameters of which are listed below.
Rock Type
Bench Width
Backslope Ratio
Backslope Height
Rockfall Catchment
Each of the above parameters are present in a bench cut rock cut slope and contribute to the
behavior of rockfall. In order to understand the effects and sensitivity of each parameter
individually, all others must be held constant. The variable parameter is assigned a value within
a range that is acceptable for that parameter. The parameters’ sensitivity is determined by
changing its magnitude for several iterations and observing its effects on the dependent variable
(rockfall). This procedure is then repeated for each of the parameters listed above. The goal of
the parametric analysis is to determine which single or coupling of parameters is most significant
to rockfall behavior.
4.2 Method
In order to conduct a parametric sensitivity analysis of rockfall on bench cut rock slopes that
would correspond to the existing methods and ideology of WVDOH, Table 4.1 was used as
starting point for creating ranges of values for each of the parameters to be tested. The WVDOH
Design Directive 403 provides predominantly finite values for many of the geometric
parameters. In order to conduct the sensitivity analysis a range of values must be used rather
than single finite values. To create this range, the explicit values stated in the DD-403 were
placed within the range conducted in the sensitivity analysis. The DD-403 values often occupied
the mean of the range but in several instances were used as the maximum value in a parameters’
range. Table 4.2 depicts the ranges that were created for each parameter and the overall structure
of the parametric sensitivity analysis.

42
Table 4.2 Range of Values and Structure of Parametric Sensitivity Analysis
Rock
Classification
Backslope
Height (ft.)
Backslope Ratio
(H:V)
Bench Width
(ft.)
Toe of Slope Configuration
Hard Rock
50
1/2:1,
1/4:1,
1/6:1
(63.4°,76°,80.5°) 15, 25, 35 Lower Catchment Bench
60
1/2:1,
1/4:1,
1/6:1
(63.4°,76°,80.5°) 15, 25, 35 Lower Catchment Bench
70
1/2:1,
1/4:1,
1/6:1
(63.4°,76°,80.5°) 15, 25, 35 Lower Catchment Bench
Soft Rock
50 1:1,
3/4:1,
1/2:1
(45°, 53°, 63.4°) 15, 25, 35 Lower Catchment Bench
60 1:1,
3/4:1,
1/2:1
(45°, 53°, 63.4°) 15, 25, 35 Lower Catchment Bench
70 1:1,
3/4:1,
1/2:1
(45°, 53°, 63.4°) 15, 25, 35 Lower Catchment Bench
4.2.1 Material Type
In order to represent various forms of rock strata present in the state of West Virginia and
accurately model the behavior, rock strata used for this parametric analysis was categorized into
two distinct groups. The first group was denoted as hard rock material. This group directly
correlates to all Type 1 rock characteristics denoted in the DD-403. It also includes all hard rock
material found in Type 2 rock characteristics denoted in the DD-403. Essentially the hard rock
material in the analysis represents all structurally competent material with low susceptibility to
erosion or slaking, and medium to high hardness and compressive strength.
The second group in this analysis is that of which was considered as soft rock. This group
directly correlates to Type 3 and 4 rock characteristics denoted in the DD-403. Additionally this
group considers all lower strength material, less structurally competent material that “hard rock”
does not consider in DD-403 Type 2 classification rock. The rational of the two group
classification for the representation of strata allowed for previously calibrated hard rock and soft
rock material properties to be used. This allowed for the analysis to be conducted in the most
valid conditions possible and without the need of additional calibration methods. For both
material classifications, Table 4.3 presents a comprehensive set of material parameters that were
chosen for this research.

43
Table 4.3 Material Input Parameters for Parametric Analysis
Parametric
Analysis
Material
Classification
WVDOH
DD-403
Material
Classification
Assumed
Slope
Material
Density/
Rockfall
(lbs/ft3)
CRSP-3D
Hardness
Coefficient
CRSP-3D
Roughness
Coefficient
CRSP-3D
Rockfall
Shape
CRSP-3D
Rockfall
Size (ft.)
Hard Rock 1,2 150 .8 .25 Tetrahedron 2.5
Soft Rock 3,4 160 .53 .25 Tetrahedron 2.5
The following rationale was used to develop Table 4.3. These practices were used to reduce
variability caused by differences in material properties that would be considered in the field
versus that of which is necessary for conducting a parametric analysis using CRSP-3D.
The entire parametric analysis was conducted with isotropic homogenous material
properties through the entire defined geometric surface, In order to negate the unknown
effects that an anisotropic and heterogeneous stratified slope surface creates on rockfall
behavior.
The user of CRSP-3D defines a region of the slope for which rockfall is generated; this
regions material properties become the generated rockfall properties. A unit weight value
of 150 lbs/ft3 was assigned to material classified as Hard Rock (DD-403 Type 1 and 2
Bedrock) this value was developed as an estimated average of hard rock materials found
in West Virginia, principally sandstone and limestone. A unit weight value of 160 lbs/ft3
for material classified as Soft Rock (DD-403 Type 3 Bedrock) estimates the average of
soft rock materials found in West Virginia, principally mudstone and shale (Zhao, 2010).
A constant CRSP-3D surface roughness was defined for the slope. These values, listed in
Table 4.3, were selected on a basis of average of field site observations of slopes
possessing varying degrees of backslope roughness and roughness on the benches caused
by retained small diameter rockfall.
A constant CRSP-3D hardness value was defined for the entire slope for the respective
material being analyzed in this analysis. These values, listed in Table 4.3, were used as
representative values for each rock type and validated for parametric influence on
rockfall behavior during prior calibration procedures.
A single rockfall dimension was used to eliminate unknown effects that varying rockfall
dimensions possess on rockfall characteristics. Rockfall with a 2.5 foot diameter was
chosen due to the frequency of occurrence of which was observed during field site
investigations. Additionally, during calibration rockfall simulated with diameters greater
than two feet yielded results with less variability in rockfall behavior on multiple trial
bias. A tetrahedron shape was also selected due to being previously used in calibration
procedures.
44
4.2.2 Backslope Height
The heights of the backslopes in a bench cut slope profiles is critical parameter in the profile
geometry and resulting rockfall behavior. According the WVDOH Design Directive 403 all
backslope heights are held to a 50 ft. maximum unless extenuating circumstances are present,
allowing the backslope height reach an absolute design maximum height of 70 ft. (WVDOH,
2006). Therefore, the minimum value and maximum values stated in the DD-403 above were
used for the sensitivity analysis. A third, intermediate value, was added because of the large
range between the minimum and maximum values. Additionally the three values system was
used in order for the data output to show trends and behavior that occurs between the minimum
and maximum values. The same three backslope height values were used for the analysis of both
hard and soft rock categories since the DD-403 states the minimum and maximum values
without specifying the corresponding rock types.
The WVDOH DD-403 uses the backslope height parameter as the primary means of determining
the number of benches that will be placed on a cut slope cross section profile. Assuming that the
total cross section height is in excess of the maximum backslope height for the corresponding
material, a bench is placed when one of the following criteria occurs.
The height of the cross section slope profile above the first bench (5 feet above roadway
grade) is in excess of 50 to 70 feet.
At interface between low compressive strength, erodible strata and a higher strength more
competent layer. At the interface, the day lighted face of the bench is to be placed at the
highest vertical height in the thickness of the low strength layer above the roadway
datum.
At the discretion of WVDOH Engineering Division
The number of benches used in a cross section has a significant effect on the behavior of
rockfall. In order to perform the parametric analysis in a manner that allowed for the same
number of benches to be used on a cross section profile, the total cross section profile height was
held variable. Regardless of the backslope height in the specific iteration, three benches with a
constant backslope height were used to create the total cross section profile.
4.2.3 Backslope Ratio
Backslope ratio is typically expressed as a proportion of horizontal distance to a proportion of
vertical distance. This ratio can also be expressed as a simple angle from a horizontal. In
regards to hard rock for this analysis, according the DD-403 Type 1 bedrock will stand on a 1/6:1
ratio and the Type 2 bedrock will stand on a 1/2:1 ratio (WVDOH, 2006). Therefore these values
were used as maximum and minimum values, respectively. As stated above in section 4.2.2 a
third point was needed to detect behavior trends and to added intermediate data. A value of 1/4:1
was chosen due to the observation that many WVDOH in-house design, as-built slopes possess
this value of backslope angle. In this analysis, for rocks possessing the soft rock classification,
according to the DD-403 Type 3 bedrock will stand on 3/4:1 ratio and Type 4 bedrock will stand
on 1:1 ratio (WVDOH, 2006). During field exploration and review of several as-built cut slope
plans several slopes containing material that of which is classified as soft rock were designed and
built with a backslope ratio of 1/2:1. Therefore this value was added as the maximum for the
analysis of soft rock.
4.2.4 Bench Width
The DD-403 states that benches are need to reduce rolling rock and retain material from
weathering or sloughing from the slopes. Additionally, the document states that slopes with

45
backslope angles greater than 1:1 must have a bench located 5 feet above ditch grade and at
intermediate intervals (WVDOH, 2006). The scope of this analysis is to study rockfall on slopes
that meet or exceed the 1:1 backslope angle and therefore all slopes in this analysis possess
multiple intermediate slope benches at intervals defined by the backslope height.
The DD-403 “Table for Design of Cut Sections through Bedrock and Overburden”, states that all
four types of bedrock should have a minimum bench width of 10-20 ft. As a supplemental
footnote, the document states that all roads classified as arterials that have a backslope above a
bench that is greater than 25 feet, then a minimum of a 20-ft bench should be used (WVDOH,
2006). As stated above, a 50 ft. minimum backslope height used in this analysis. Therefore
using the directive as a guideline the minimum bench width used in this analysis was chosen to
be 15 ft. Although this value is below minimum value stated in the DD-403 footnote, during
several field explorations and reviewing of as-built plans, slopes in excess of the 20 ft. bench
width criteria exhibited benches with widths less than 20 feet. As with the other parameters a
total of three bench widths were defined, the intermediate width being 25 feet and the maximum
bench width being 35 ft. The intermediate width occupying the most common field observed
width and the maximum value being that of which having a potential to retain the most rockfall
and sloughing.
4.2.5 WVDOH DD-403 Toe of Slope Design
The design of the toe of the slope has an important role in the catchment of rockfall making it
past all intermediate benches. Rockfall reaching the toe of the slope possesses the highest kinetic
energy, velocity, and probability of rolling beyond the toe into the shoulder or into the roadway
itself. If rockfall is retained here it has been effectively mitigated from being a danger to the
roadway users. One strategy that has been developed is through the use of a catchment bench
that is placed slightly above the roadway grade and has sufficient width to retain falling rock
with various trajectories and bounce heights. The WVDOH specifies this type of toe of slope
bench for catchment, specifically the DD-403 states that on arterial routes, a minimum of a 15
foot wide bench should be placed approximately 5 feet above ditch grade in order to provide and
impact area to reduce rolling rock and retain material. On local service and collector roads this
width may be reduced to 10 feet (WVDOH, 2006).
4.2.6 Additional CRSP 3-D Parametric Analysis Methods
Although the WVDOH DD-403 discusses the vast majority of rock cut slope design items,
several aspects are not discussed and additional items unique to conducting a parametric analysis
in CRSP-3D were performed in order to create a more robust analysis. These items are listed
below in detail.
The area beyond the lowest sighting bench is typically subject to WVDOH roadway
design and is site specific to the roadway vertical alignment design and water
management design requirements. In many cases it was field observed that this area was
sloped toward the toe from the edge of pavement at an angle of approximately 5°, thereby
providing little to no effect on rock retention characteristics. WVDOH DD-403 does not
provide any design detail on rockfall catchment ditches therefore in the case of this
analysis this area was defined to be flat (0° slope) and extending 200 feet beyond the toe
of the slope in the x-axis. This flat area allows for the greatest rockfall rolling effects and
runout distances and was considered to be the worst case design for rockfall reaching the
toe of the slope.
The rockfall release zone, where all rockfall is simulated to originate from, was defined
to an area located in the uppermost height of the backslope located the greatest vertical

46
distance from the toe of the slope. By selecting the highest portion of the uppermost
backslope rockfall behavior was assumed to be created for the highest probability of the
lowest rockfall retention to occur. This release zone was defined to have a vertical height
in the z-axis of 12 feet. This number was chosen because it is equal to that of the surface
resolution of the CRSP-3D software. By setting the release zone equal to the surface
resolution this enables the program to use a complete cell of the simulated surface for
rockfall release behavior to occur. In order to ascertain validity of the dimension of the
release zone the results of this parametric analysis was compared to that of a similar
analysis conducted using CRSP-2D (Idleman, 2014).
Every iteration in this analysis consisted of 200 rocks being released from the defined
release zone. The number was selected for its ability to provide statistical consistent
output data on an identical trial run over several iterations. The statistical variation
between trials was from 3 to 5 percent. This variation was comparative to that reported
in another similar study (Idleman, 2014).
Analysis partitions were placed at the edge nearest the toe on each of the three benches.
Thereby allowing the number of rocks retained on each bench to be determined easily.
The placement of the analysis partition on the lowest bench is representative of a location
that when rocks pass beyond this point, they are not effectively mitigated and become a
hazard to roadway users.
4.2.7 Parametric Analysis Typical Bench Cut Bedrock Slope Cross Section Using
WVDOH DD-403 Design Specifications
As stated in Section 4.2.2 a cross sectional profile consisting of three benches and three
backslopes were used for all iterations designed to WVDOH DD-403 specifications. Although
the magnitude of these parameters changed in accordance to Table 4.2 an overall typical cross
section is shown below in Figure 4.1 to illustrate the labeling conventions used for each region of
this slope. Both bench and backslope numbers initiate at the crest of the slope and increases in
value moving down the cross section towards the toe. Bench three in the figure is analogues to
lower catchment bench. The rockfall runout surface was defined to be completely flat (0°) to
allow for the greatest magnitude of rockfall runout. In reality this surface for most pavement and
shoulder cross section would have some small value of inclination toward to toe of the slope.

47
Figure 4.1 Typical Cross Section used in Parametric Analysis for Designs using
WVDOH DD-403 Specifications
4.3 Results DD-403 Design Cut Slope Parameters for Hard Rock using CRSP-3D
In order to develop iterations that tested each parameter independently the Hard Rock portion of
Table 4.2 was used as a guideline. A total of 54 models were created. 27 of these models were
used for material considered by this study as Hard Rock. Each of these models generated output
data that was used to characterize the behavior of the rockfall in regards to a specific parameter.
The following data fields in CRSP 3-D were used for quantitatively describe the behavior of
rockfall during the analysis.
Rockfall Velocity (ft./sec)
Bounce Height- Height of rockfall above Z-axis datum at analysis partitions (ft.)
Kinetic Energy (ft-kips)
Average Rockfall runout distance in X-axis (ft.)
Greatest Rockfall runout distance in X-axis (ft.)
Percent of Rockfall retained on each bench
Percent of Rockfall passing lower bench (five feet above roadway grade: toe of slope)
Backslope #1
Backslope #2
Backslope #3
Bench #3
Bench #1
Bench #2
Rockfall Runout Surface

48
Tables 4.4, 4.5 and 4.6 depict the results for twenty seven iterations of Hard Rock Classification
slope material (DD-403 Type 1 and Type 2 Bedrock). The table is categorized by bench width,
which increases moving down the table. Within a given bench width the backslope angle
decreases. For rocks passing the toe of the slope several key behavior observations can be
deducted from observation of the tables, these are as follows:
The greater the magnitude of the backslope angle, the larger the magnitude of the rockfall
velocity, kinetic energy, and bounce height
The greater the bench width the greater the rockfall retention ability of the slope profile
Table 4.4 Results for CRSP-3D Parametric Analysis Iterations for Hard Rock
with 50 ft. Backslope Heights
Equivalencies: 1/6:1 = 80.5°,
1/4:1 = 76°.
1/2:1 = 63.4°
a. Rock in free fall trajectory. Value is the average height of the falling rock above slope surface at
analysis partition location
b. Absence of value due to zero rocks passing lower bench
Bench
width
(ft.)
Back
slope
Ratio
(H:V)
Avg.
Vel.
@ toe
(𝐟𝐭.
𝐬𝐞𝐜.)
Avg.
Kinetic
Energy
@ toe
(kips)
Avg.
bounce
height
@ toe
(ft.)
Avg.
rockfall
runout
distance
(ft.)
Max.
rockfall
runout
distance
(ft.)
% Rocks
retained
on
Bench 1
% Rocks
retained
on
Bench 2
% Rocks
retained
on
Bench 3
% Rocks
Passing
lower
Bench
15
1/6:1 62 225 36a 92 156 48 0 0 52
1/4:1 43 52 23 36 81 0 0 0 100
1/2:1 34 38 6.2 43 120 0 0 0 100
25
1/6:1 38 37 7.8 55 184 74 1 0 25
1/4:1 13 5.4 0.6 18 50 1.5 3.5 7.5 87.5
1/2:1 21 12 3.6 19 54 42 19 2 37
35
1/6:1 N/Ab N/Ab N/Ab N/Ab N/Ab 100 0 0 0
1/4:1 37 35 5.5 57 57 99.5 0 0 0.5
1/2:1 N/Ab N/Ab N/Ab N/Ab N/Ab 100 0 0 0

49
Table 4.5 Results for CRSP-3D Parametric Analysis Iterations for Hard Rock
with 60 ft. Backslope Heights
Bench
width
(ft.)
Back
slope
Ratio
(H:V)
Avg.
Vel.
@ toe
(𝐟𝐭.
𝐬𝐞𝐜.)
Avg.
kinetic
energy
@ toe
(kips)
Avg.
bounce
height
@ toe
(ft.)
Avg.
rockfall
runout
distance
(ft.)
Max.
rockfall
runout
distance
(ft.)
% Rocks
retained
on
Bench 1
% Rocks
retained
on
Bench 2
% Rocks
retained
on
Bench 3
% Rocks
Passing
lower
Bench
15
1/6:1 74 135 50a 44 94 47.5 0 0 52.5
1/4:1 54 70 37a 57 130 0 0 0 100
1/2:1 50 73 19 68 143 0 5 0 95
25
1/6:1 N/A N/A N/A N/A N/A 100 0 0 0
1/4:1 54 84 26 56 133 82.5 0 0 17.5
1/2:1 28 37 7.9 56 111 0 91 5.5 3.5
35
1/6:1 N/A N/A N/A N/A N/A 100 0 0 0
1/4:1 N/A N/A N/A N/A N/A 100 0 0 0
1/2:1 20 13 4.7 24 78 28.5 34 10.5 27
Equivalencies: 1/6:1 = 80.5°,
1/4:1 = 76°.
1/2:1 = 63.4°
a. Rock in free fall trajectory. Value is the average height of the falling rock above slope surface at
analysis partition location
b. Absence of value due to zero rocks passing lower bench
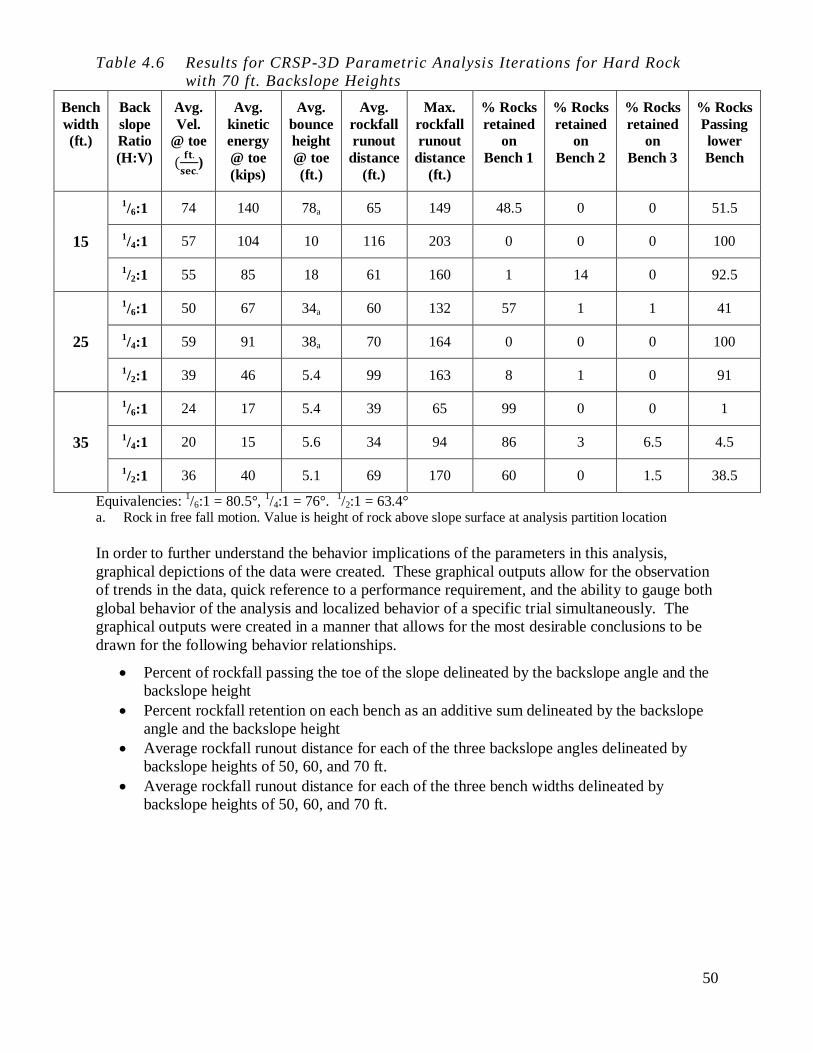
50
Table 4.6 Results for CRSP-3D Parametric Analysis Iterations for Hard Rock
with 70 ft. Backslope Heights
Bench
width
(ft.)
Back
slope
Ratio
(H:V)
Avg.
Vel.
@ toe
(𝐟𝐭.
𝐬𝐞𝐜.)
Avg.
kinetic
energy
@ toe
(kips)
Avg.
bounce
height
@ toe
(ft.)
Avg.
rockfall
runout
distance
(ft.)
Max.
rockfall
runout
distance
(ft.)
% Rocks
retained
on
Bench 1
% Rocks
retained
on
Bench 2
% Rocks
retained
on
Bench 3
% Rocks
Passing
lower
Bench
15
1/6:1 74 140 78a 65 149 48.5 0 0 51.5
1/4:1 57 104 10 116 203 0 0 0 100
1/2:1 55 85 18 61 160 1 14 0 92.5
25
1/6:1 50 67 34a 60 132 57 1 1 41
1/4:1 59 91 38a 70 164 0 0 0 100
1/2:1 39 46 5.4 99 163 8 1 0 91
35
1/6:1 24 17 5.4 39 65 99 0 0 1
1/4:1 20 15 5.6 34 94 86 3 6.5 4.5
1/2:1 36 40 5.1 69 170 60 0 1.5 38.5
Equivalencies: 1/6:1 = 80.5°,
1/4:1 = 76°.
1/2:1 = 63.4°
a. Rock in free fall motion. Value is height of rock above slope surface at analysis partition location
In order to further understand the behavior implications of the parameters in this analysis,
graphical depictions of the data were created. These graphical outputs allow for the observation
of trends in the data, quick reference to a performance requirement, and the ability to gauge both
global behavior of the analysis and localized behavior of a specific trial simultaneously. The
graphical outputs were created in a manner that allows for the most desirable conclusions to be
drawn for the following behavior relationships.
Percent of rockfall passing the toe of the slope delineated by the backslope angle and the
backslope height
Percent rockfall retention on each bench as an additive sum delineated by the backslope
angle and the backslope height
Average rockfall runout distance for each of the three backslope angles delineated by
backslope heights of 50, 60, and 70 ft.
Average rockfall runout distance for each of the three bench widths delineated by
backslope heights of 50, 60, and 70 ft.

51
Figure 4.2 Histogram of Percent Hard Rockfall Passing Toe of Slope with 15 ft. Benches
Figure 4.3 Histogram of Percent Hard Rockfall Passing Toe of Slope with 25 ft. Benches
0
25
50
75
100
125
150
175
200
1/6:1 1/4:1 1/2:1 1/6:1 1/4:1 1/2:1 1/6:1 1/4:1 1/2:1# o
f H
ard
Rock
Pa
ssin
g T
oe
60 ft. Backslope 50 ft. Backslope 70 ft. Backslope
0
25
50
75
100
125
150
175
200
1/6:1 1/4:1 1/2:1 1/6:1 1/4:1 1/2:1 1/6:1 1/4:1 1/2:1# o
f H
ard
Rock
Pa
ssin
g T
oe
60 ft. Backslope 70 ft. Backslope 50 ft. Backslope

52
Figure 4.4 Histogram of Percent Hard Rockfall Passing Toe of Slope with 35 ft. Benches
Critical analysis of Figures 4.2 through 4.4 for parameter trends, minimums, maximums and
overall performance allows for the following conclusions to be made:
A backslope ratio of 1/6:1 produces significantly less rockfall passing the toe of the slope
than slope angles less than this ratio. This result was independent of backslope height or
bench width within the magnitude of the values used for these parameters in this analysis.
Bench widths less than 25 feet produce the largest quantity of rockfall passing the toe
when a 1/4:1 backslope angle is used. A bench width of 35 feet produces the largest
rockfall passing the toe when a 1/2:1 backslope is used.
As bench width increases the amount of rocks passing the toe of the slope decreases.
Intuitively the larger bench width yields greater on slope rockfall retention. In order to
evaluate holistic performance of the analysis, 90 percent rockfall retention was used as
the minimum performance benchmark for rockfall catchment effectiveness. Only slopes
having a backslope angle of 1/4:1 or greater and a bench width of 35 feet were able to
meet this performance standard.
Following DD-403 slope design standards for Type 1 and 2 hard bedrock slope geometric
design, in order to effectively mitigate rockfall to the 90 percent catchment level all
slopes with backslopes greater than 50 vertical feet should be constructed to a backslope
ratio of 1/4:1 or greater and contain benches with a 35 foot minimum width.
0
25
50
75
100
125
150
175
200
1/6:1 1/4:1 1/2:1 1/6:1 1/4:1 1/2:1 1/6:1 1/4:1 1/2:1
# o
f H
ard
Rock
s P
ass
ing T
oe
50 ft. Backslope 60 ft. Backslope 70 ft. Backslope

53
Figure 4.5 Histogram of Percent Hard Rockfall Retained By Bench Number with 50 ft.
Backslope Heights
Figure 4.6 Histogram of Percent Hard Rockfall Retained By Bench Number with 60 ft.
Backslope Heights
0
10
20
30
40
50
60
70
80
90
100
1/6:1 1/4:1 1/2:1 1/6:1 1/4:1 1/2:1 1/6:1 1/4:1 1/2:1
% R
ock
fall
Reta
ined
on
Slo
pe
Bench 3
Bench 2
Bench 1
15 ft. Benches 25 ft. Benches 35 ft. Benches
0
10
20
30
40
50
60
70
80
90
100
1/6:1 1/4:1 1/2:1 1/6:1 1/4:1 1/2:1 1/6:1 1/4:1 1/2:1
% R
ock
fall
Reta
ined
on
Slo
pe
Bench 3
Bench 2
Bench 1
15 ft. Benches 25 ft. Benches 35 ft. Benches
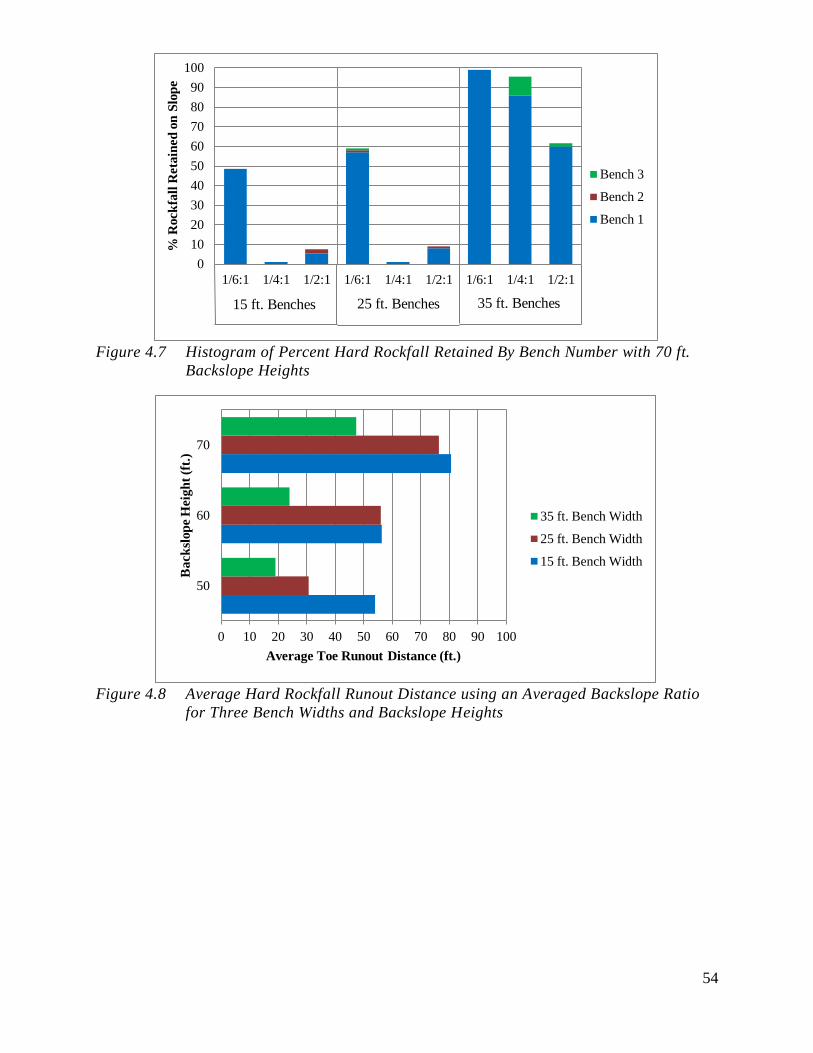
54
Figure 4.7 Histogram of Percent Hard Rockfall Retained By Bench Number with 70 ft.
Backslope Heights
Figure 4.8 Average Hard Rockfall Runout Distance using an Averaged Backslope Ratio
for Three Bench Widths and Backslope Heights
0
10
20
30
40
50
60
70
80
90
100
1/6:1 1/4:1 1/2:1 1/6:1 1/4:1 1/2:1 1/6:1 1/4:1 1/2:1
% R
ock
fall
Reta
ined
on
Slo
pe
Bench 3
Bench 2
Bench 1
15 ft. Benches 25 ft. Benches 35 ft. Benches
0 10 20 30 40 50 60 70 80 90 100
50
60
70
Average Toe Runout Distance (ft.)
Ba
ck
slop
e H
eig
ht
(ft.
)
35 ft. Bench Width
25 ft. Bench Width
15 ft. Bench Width

55
Figure 4.9 Average Hard Rockfall Runout Distance using an Averaged Bench Width for
Three Backslope Ratios and Backslope Heights
Figures 4.5 through 4.7 depict the rockfall retention as a summation of each bench’s individual
retention characteristics. These figures were created using the same iteration data that was used
to create Figures 4.2 through 4.4. Each graph depicts each of the three backslope angles and
bench widths that were used in the analysis but differ by the backslope heights. The construction
of these graphs allows for the following deductions to be made:
Increasing backslope height does marginally decrease the ability of a bench cut slope to
retain rockfall as compared to other geometric parameters. Therefore from the results of
this analysis, holding all other parameters constant, increasing a slopes backslope
height(s) from 50 to 70 feet will not substantially decrease on-slope rockfall retention
characteristics.
For a backslope height and bench width within the range of this analysis, the ratio of the
backslope angle plays a minor effect rockfall retention ability of the slope profile.
The width of all benches placed on a slope profile exhibits the largest effect on rockfall
retention. As bench width increases, the ability of a slope profile to retain rockfall
increases. The bench width of the uppermost and lower bench show the greatest response
to a change in bench width as the majority of rockfall trajectory involves an impact
somewhere along the width of these two benches.
Figures 4.8 and 4.9 allow for the evaluation of rockfall runout distance beyond the toe of the
slope. Figure 4.7 shows the behavior of rockfall in regards to 15, 25, and 35 ft. bench widths
used with 50, 60, and 70 foot backslopes. The third geometric parameter, backslope ratio, was
taken as an average for each of the bench width and backslope height. Likewise, in Figure 4.9
the third non illustrated parameter, bench width, was taken as an average for each of the
backslope ratios and backslope heights. Analysis of these figures allows for the following
deductions to be made:
The width of the bench for a constant backslope height exhibits the largest effects on
rockfall runout past the toe in comparison to other parametric factors.
The effects of bench width for the range of backslope heights performed in this study
shows that as backslope height increases, rockfall runout distance beyond the toe
increases for all values of bench width.
0 10 20 30 40 50 60 70 80 90 100
50
60
70
Average Toe Runout Distance (ft.)
Back
slop
e H
eig
ht
(ft.
) 1/2:1 Backslope
1/4:1 Backslope
1/6:1 Backslope

56
The three backslope angles used in this study, when considered with a constant backslope
height has minor effects on rockfall runout distance beyond the toe. Holding backslope
angle constant as backslope height increases, rockfall runout past the toe increases.
The steepest backslope angle analyzed, 1/6:1 yielded on average the lowest rockfall
runout distances beyond the toe of the slope.
The design of bedrock cut slope profiles for the state of West Virginia would be performed using
Table 4.1 taken from the WVDOH DD-403 for material classified in this study as Hard Rock.
This design would consist of a backslope ratio of 1/2:1 to
1/6:1 (DD-403 Type 1 and Type 2
Bedrock) depending on the borehole classification of the material present. The accompanying
bench widths would be at a minimum value of 20 feet and the backslope heights would be
dependent on the total depth of the cut and the competency of the bedrock.
The results of this analysis show that even by superseding the minimum value and designing for
25 foot bench widths, on slope rockfall catchment is unable to attain the 90% retention minimum
performance benchmark. Specifically, the best retention behavior was attained for a 1/2:1
backslope angle with a 50 foot backslope height. Sixty three percent of rockfall was retained on
the slope profile, far below that of which has been deemed acceptable. This analysis yielded an
average runout beyond the toe of 20 feet, thus depending on the width of earthen shoulder
between the toe of the slope and the roadway, up to thirty seven percent of falling rock would
reach the roadway. The best retention behavior for a 25 foot bench was attained using a 1/6:1
backslope ratio and occurred when a 50 foot backslope height was used. Seventy-five percent of
rockfall was retained on the slope profile, fifteen percent lower than the minimum value.
Depending on the bench width and backslope height this analysis showed rockfall runout
distance ranging from 35 to 55 feet beyond the toe, exceeding the earthen shoulder width of any
typical highway cross section.
From the results of this parametric analysis on hard rock using DD-403 guidelines, in order to
consistently meet the minimum performance requirement of 90% rockfall retention with
backslope ratios of 1/2:1 through
1/6:1, the geometric design should possess a minimum of 35
foot bench widths and a maximum of 50 ft. backslopes. If 60 foot backslope heights are required
for the design, this research shows that a backslope ratio equal to or greater than 1/4:1 provides
sufficient results. Designing with 70 foot backslope intervals requires that at minimum a 1/6:1 or
steeper backslope ratios are used to meet rockfall retention requirements. This analysis shows
that designing to the above parameters will generate rockfall runout distances that will exceed
the earthen shoulder width of a typical highway cross section, especially in a design using 70
foot backslope heights.
The parameters used in this analysis are only part of the considerations that are required to
design a bedrock cut slope, other equally important factors include slope stability analysis, slope
and highway drainage design, erosion control both on slope and roadway shoulder, and a design
approach to minimize the propensity for weaker material undercutting.
4.4 Results DD-403 Design Cut Slope Parameters for Soft Rock using CRSP-3D
Using the Soft Rock portion of Table 4.2 as a guideline, as with material classified as Hard Rock
in Section 4.3, iterations were developed that tested each parameter independently for soft rock
material. A total of twenty of these models were created to analyze the behavior of Soft Rock.
Each of these models generated output data that was used to characterize the behavior of the
rockfall in regards to a specific parameter. The following data fields in CRSP 3-D was used to
analyze the behavior of rockfall during the analysis.

57
Rockfall Velocity (ft./sec)
Bounce Height- Height of rockfall above Z-axis datum at analysis partition (ft.)
Kinetic Energy (ft-kips)
Average Rockfall runout distance in X-axis (ft.)
Greatest Rockfall runout distance in X-axis (ft.)
Percent of Rockfall retained on each bench
Percent of Rockfall passing lower bench (five feet above roadway grade: toe of slope)
Tables 4.7, 4.8 and 4.9 depict the results for twenty seven iterations of Soft Rock Classification
slope material (Principally DD-403 Type 3 Bedrock). The table is categorized by bench width,
which increases moving down the table. Within a given bench width the backslope angle
decreases. For rocks passing the toe of the slope several key behavior observations can be
deducted from observation of the tables, these are as follows:
For backslopes heights of 50 feet larger, decreasing the magnitude of the backslope ratio
from 1/2:1 to 1:1 does not cause an overall increase in average rockfall velocity, kinetic
energy, and rockfall runout values. In this analysis, 50 foot backslope heights did not
provide sufficient rockfall contact surface length that increased the horizontal component
of the rockfall trajectory to a level that exceed the level of that obtained by rockfall
simulated at larger backslope heights.
For backslope heights greater than or equal to 60 feet, as the backslope ratio decreased
from 1/2:1 to 1:1, the magnitude of average rockfall velocity, kinetic energy and rockfall
runout values increase significantly. This behavior occurs for two reasons. The first is
that the rock does not leave the face of the slope during its downward trajectory from its
release zone. This allows for the falling rock to achieve a large amount of rolling
momentum before leaving the bench below its release zone. Secondly, as the backslope
ratio decreases to that of a 1:1 ratio, the horizontal component of the rockfall energy is
much greater than what is developed on larger backslope angles such as 1/2:1.
The greater the bench width, the greater the rockfall retention ability of the slope profile.

58
Table 4.7 Results for CRSP-3D Parametric Analysis Iterations for Soft Rock with
50 ft. Backslope Heights
Bench
width
(ft.)
Back
slope
Ratio
(H:V)
Avg.
Vel.
@ toe
(𝐟𝐭.
𝐬𝐞𝐜.)
Avg.
Kinetic
Energy
@ toe
(kips)
Avg.
bounce
height
@ toe
(ft.)
Avg.
rockfall
runout
distance
(ft.)
Max.
rockfall
runout
distance
(ft.)
% Rocks
retained
on
Bench 1
% Rocks
retained
on
Bench 2
% Rocks
retained
on
Bench 3
% Rocks
Passing
lower
Bench
15
1/2:1 25 26 4.5 19 62 36 9 12 43
3/4:1 20 14 4.9 14 45 31 17 20 32
1:1 19 13 4.3 29 58 70 9 19 2
25
1/2:1 19 14 3.4 2.5 48 81 2 4 13
3/4:1 18 12 4.7 2 8 73 5 15 7
1:1 17 11 3.3 15 36 91 0 3.5 5.5
35
1/2:1 N/Aa N/Aa N/Aa N/Aa N/Aa 100 0 0 0
3/4:1 N/Aa N/Aa N/Aa N/Aa N/Aa 100 0 0 0
1:1 N/Aa N/Aa N/Aa N/Aa N/Aa 100 0 0 0
Equivalencies: 1/2:1 = 63.4°,
3/4:1 = 53°, 1:1 = 45°
a. Absence of value due to zero rocks passing lower bench

59
Table 4.8 Results for CRSP-3D Parametric Analysis Iterations for Soft Rock with
60 ft. Backslope Heights
Bench
width
(ft.)
Back
slope
Ratio
(H:V)
Avg.
Vel.
@ toe
(𝐟𝐭.
𝐬𝐞𝐜.)
Avg.
Kinetic
Energy
@ toe
(kips)
Avg.
bounce
height
@ toe
(ft.)
Avg.
rockfall
runout
distance
(ft.)
Max.
rockfall
runout
distance
(ft.)
% Rocks
retained
on
Bench 1
% Rocks
retained
on
Bench 2
% Rocks
retained
on
Bench 3
% Rocks
Passing
lower
Bench
15
1/2:1 19 17 5.3 14 63 32 34 7 27
3/4:1 25 22 4.2 23 62 28 13 31 28
1:1 34 34 5.6 45 70 62 8 0 30
25
1/2:1 19 14 4.5 9 45 65 32 1 2
3/4:1 17 11 3.9 19 51 63 19.5 11 6.5
1:1 26 21 4.5 22 62 85 4 6 5
35
1/2:1 17 13 4.4 8 8 94 4.5 1 0.5
3/4:1 N/Aa N/Aa N/Aa N/Aa N/Aa 92 6 2 0
1:1 N/Aa N/Aa N/Aa N/Aa N/Aa 95 5 0 0
Equivalencies: 1/2:1 = 63.4°,
3/4:1 = 53°, 1:1 = 45°
a. Absence of value due to zero rocks passing lower bench

60
Table 4.9 Results for CRSP-3D Parametric Analysis Iterations for Soft Rock with
70 ft. Backslope Heights
Bench
width
(ft.)
Back
slope
Ratio
(H:V)
Avg.
Vel.
@ toe
(𝐟𝐭.
𝐬𝐞𝐜.)
Avg.
Kinetic
Energy
@ toe
(kips)
Avg.
bounce
height
@ toe
(ft.)
Avg.
rockfall
runout
distance
(ft.)
Max.
rockfall
runout
distance
(ft.)
% Rocks
retained
on
Bench 1
% Rocks
retained
on
Bench 2
% Rocks
retained
on
Bench 3
% Rocks
Passing
lower
Bench
15
1/2:1 33 36 8.8 25 84 12 4 8 76
3/4:1 34 37 4.8 36 94 10 2 3.5 84.5
1:1 36 40 5.9 54 76 58 2 0 40
25
1/2:1 17 11 4.6 14 40 52 24 6 18
3/4:1 15 14 4.4 19 116 46 14 8 32
1:1 30 27 4.9 32 74 75 7 2.5 15.5
35
1/2:1 16 17 4.5 12 35 87 2.5 3.5 7
3/4:1 12 16 4.3 17 77 84 9 2 5
1:1 26 28 4.7 34 79 90 2 2 6
Equivalencies: 1/2:1 = 63.4°,
3/4:1 = 53°, 1:1 = 45°
Graphical outputs for soft rock material are shown in Figures 4.10 through 4.12. The graphical
outputs were created in a manner that allows for the most desirable conclusions to be drawn for
the following behavior relationships.
Percent of rockfall passing the toe of the slope delineated by the backslope angle and the
backslope height
Percent rockfall retention on each bench as an additive sum delineated by the backslope
angle and the backslope height
Average rockfall runout distance for each of the three backslope angles delineated by
backslope heights of 50, 60, and 70 ft.
Average rockfall runout distance for each of the three bench widths delineated by
backslope heights of 50, 60, and 70 ft.

61
Figure 4.10 Histogram of Percent Soft Rockfall Passing Toe of Slope with 15 ft. Benches
Figure 4.11 Histogram of Percent Soft Rockfall Passing Toe of Slope with 25 ft. Benches
0
25
50
75
100
125
150
175
200
1/2:1 3/4:1 1:1 1/2:1 3/4:1 1:1 1/2:1 3/4:1 1:1
# o
f S
oft
Rock
s P
ass
ing T
oe
50 ft. Backslope 60 ft. Backslope 70 ft. Backslope
0
25
50
75
100
125
150
175
200
1/2:1 3/4:1 1:1 1/2:1 3/4:1 1:1 1/2:1 3/4:1 1:1
# o
f S
oft
Rock
s P
ass
ing
Toe
70 ft. Backslope 60 ft. Backslope 50 ft. Backslope

62
Figure 4.12 Histogram of Percent Soft Rockfall Passing Toe of Slope with 35 ft. Benches
Critical analysis of Figures 4.10 through 4.12 for parameter trends, minimums, maximums and
overall performance allows the following conclusions to be made:
On average a backslope ratio of 1:1 produces less rockfall passing the toe of the slope
than the steeper slope angles considered. This result was independent of backslope
height or bench width within the magnitude of the values used for these parameters in
this analysis.
Bench widths less than 25 feet produce the largest quantity of rockfall passing the toe
when a 3/4:1 backslope angle or steeper is used. Bench widths of 35 feet do not appear to
have a large sensitivity to the range of backslope angles considered in this study.
As bench width increases the amount of rocks passing the toe of the slope decreases.
Intuitively the larger bench width yields greater on slope rockfall retention. In order to
evaluate holistic performance of the analysis, 90 percent rockfall retention was used as
the minimum performance benchmark for rockfall catchment effectiveness. Only slopes
with bench widths greater than or equal to 25 feet and backslopes less than or equal to 60
feet were able to meet this performance standard. All three of the backslope angle used
in this study allowed for acceptable performance when the profile is designed to the
previously mentioned bench width and backslope height.
It can be concluded that following DD-403 slope design standards for Type 3 and 4 soft
bedrock slope geometric design, in order to effectively mitigate rockfall to the 90 percent
catchment level, all slopes with 25 foot benches require backslopes less than 60 feet
independent of backslope angle. Bench widths greater 25 feet can be constructed to a
backslope angle and height that falls within range of parameters analyzed in this study or
those listed in the DD-403.
0
25
50
75
100
125
150
175
200
1/2:1 3/4:1 1:1 1/2:1 3/4:1 1:1 1/2:1 3/4:1 1:1
# o
f S
oft
Rock
s P
ass
ing T
oe
50 ft. Backslope 60 ft. Backslope 70 ft. Backslope
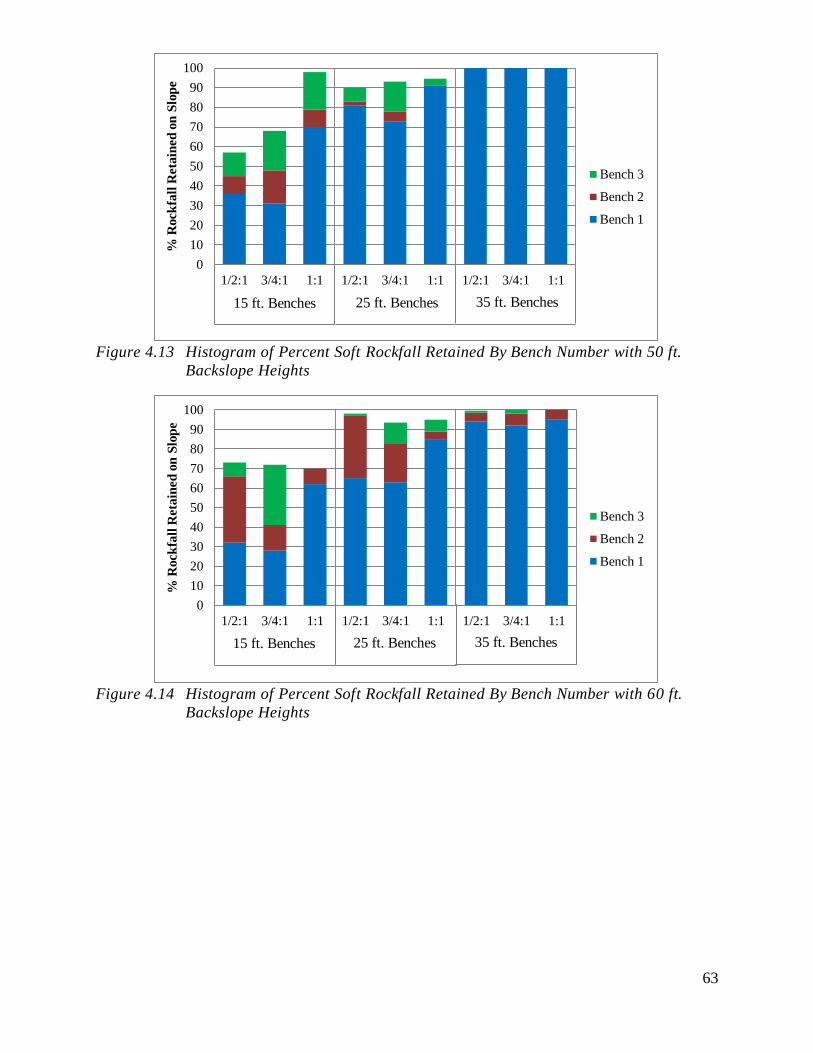
63
Figure 4.13 Histogram of Percent Soft Rockfall Retained By Bench Number with 50 ft.
Backslope Heights
Figure 4.14 Histogram of Percent Soft Rockfall Retained By Bench Number with 60 ft.
Backslope Heights
0
10
20
30
40
50
60
70
80
90
100
1/2:1 3/4:1 1:1 1/2:1 3/4:1 1:1 1/2:1 3/4:1 1:1
% R
ock
fall
Reta
ined
on
Slo
pe
Bench 3
Bench 2
Bench 1
15 ft. Benches 25 ft. Benches 35 ft. Benches
0
10
20
30
40
50
60
70
80
90
100
1/2:1 3/4:1 1:1 1/2:1 3/4:1 1:1 1/2:1 3/4:1 1:1
% R
ock
fall
Reta
ined
on
Slo
pe
Bench 3
Bench 2
Bench 1
15 ft. Benches 25 ft. Benches 35 ft. Benches

64
Figure 4.15 Histogram of Percent Soft Rockfall Retained By Bench Number with 70 ft.
Backslope Heights
Figure 4.16 Average Soft Rockfall Runout Distance using an averaged Backslope Ratio for
Three Bench Widths and Backslope Heights
0
10
20
30
40
50
60
70
80
90
100
1/2:1 3/4:1 1:1 1/2:1 3/4:1 1:1 1/2:1 3/4:1 1:1
% R
ock
fall
Reta
ined
on
Slo
pe
Bench 3
Bench 2
Bench 1
15 ft. Benches 25 ft. Benches 35 ft. Benches
0 10 20 30 40 50
50
60
70
Average Toe Runout Distance (ft.)
Ba
ck
slop
e H
eig
ht
(ft.
)
35 ft. Bench Width
25 ft. Bench Width
15 ft. Bench Width

65
Figure 4.17 Average Soft Rockfall Runout Distance using an Averaged Bench Width for
Three Backslope Ratios and Backslope Heights
Figures 4.13 through 4.15 depict the rockfall retention as a summation of each benches
individual retention characteristics. These figures were created using the same iteration data that
was used to create Figures 4.10 through 4.12. Each graph depicts each of the three backslope
angles and bench widths that were used in the analysis but differ by the backslope heights. The
construction of these graphs allows for the following deductions to be made:
Increasing backslope height decrease the ability of a bench cut slope to retain rockfall,
but the sensitivity of the parameter is much less than that of bench width. Therefore from
the results of this analysis, holding all other parameters constant, increasing a slopes
backslope height(s) from 50 to 70 feet will considerably decrease the ability for a slope
profile to provide rockfall retention.
For slopes analyzed with backslope heights less than or equal to 60 feet with benches
greater than or equal to 25 feet, the range of backslope ratios used in this analysis showed
minor effect on the rockfall retention ability of the slope profile.
The width of benches placed on a slope profile proves to exhibit the highest sensitivity
for a slope profile to provide rockfall retention. As bench width increases, the ability of a
slope profile to retain rockfall increases. The bench width of the two uppermost adjacent
benches show the greatest response to a change in bench width as the majority of rockfall
trajectory involves an impact somewhere along the width of these two benches. This is
not to say that the lowermost bench does not show sensitivity to the range bench widths,
its sensitivity proves slightly subordinated to those of the benches located more proximal
to the origin of rockfall in the profile.
Figures 4.16 and 4.17 allows for the evaluation of rockfall runout distance beyond the toe of the
slope. Figure 4.15 shows the behavior of rockfall in regards to 15, 25, and 35 ft. bench widths
used with 50, 60, and 70 foot backslopes. The third geometric parameter, backslope ratio, was
taken as an average for each of the bench width and backslope height. Likewise, in Figure 4.17
the third non illustrated parameter, bench width, was taken as an average for each of the
backslope ratios and backslope heights. Analysis of these figures allows for the following
deductions to be made:
0 10 20 30 40 50
50
60
70
Average Toe Runout Distance (ft.)
Back
slop
e H
eig
ht
(ft.
) 1:1 Backslope
3/4:1 Backslope
1/2:1 Backslope

66
The width of the bench for a constant backslope height exhibits the largest effects on
rockfall runout past the toe in comparison to other parametric factors.
The effects of bench width for the range of backslope heights performed in this study
shows that as backslope height increases, rockfall runout distance beyond the toe
increases for all values of bench width.
The three backslope angles used in this study considered with constant backslope height
shows sensitivity on the magnitude of rockfall runout distance beyond the toe. This is
especially true for backslope heights greater than or equal to 60 feet. Therefore, holding
backslope angle constant, as backslope height increases, rockfall runout past the toe
increases. In this study, the use of a 1:1 backslope angle showed substantially larger
rockfall runout values than the other backslope angles considered. This is again due to
the large magnitude of rolling energy rockfall possesses when released from a slope
angles that allows for near equal components or gravimetric and rotational kinetic energy.
The steepest backslope angle analyzed, 1/2:1 yielded the lowest rockfall runout distances
beyond the toe of the slope.
Designing bedrock cut slope profile for the state of West Virginia under current practices would
be performed using Table 4.1 taken from the WVDOH DD-403 for material classified in this
study as Soft Rock. This design would consist of backslope ratios of 3/4:1 to 1:1 (DD-403 Type
3 Bedrock) depending on the borehole classification of the material present. Provided that the
slope was being designed for roads classified as arterials, the accompanying design bench widths
for backslopes over 25 feet would be at a minimum value of 20 feet and the backslope heights
would be dependent on the total depth of the cut and the competency of the bedrock.
The results of this analysis show that by slightly superseding the minimum value and designing
for 25 foot bench widths with a maximum backslope height of 60 feet, on-slope rockfall
catchment is able to attain the 90% retention minimum performance benchmark. For all
iterations meeting this criteria this analysis yielded an average runout beyond the toe of 15 feet,
thus depending on the width of earthen shoulder between the toe of the slope and the roadway,
up to 10 percent of falling rock would reach the roadway. In order for a design to meet
minimum performance rockfall retention standards for 70 foot backslope heights, a 35 foot bench
width for all benches in the slope profile must be implemented.
Backslope angle determined the average runout distance. The lowest values were recorded using
50 foot backslope heights and 1/2:1 backslope angles. The largest values occurred with 70 foot
backslope heights and 1:1 backslope angles. These values range from that of which could be
contained on most highway cross section earthen shoulders to that of which would place rockfall
into areas that are detrimental to roadway users.
From the results of this parametric analysis on Soft Rock using DD-403 guidelines, in order to
consistently meet the minimum performance requirement of 90% rockfall retention for all
backslope ratios and backslope heights, 35 foot benches should be designed. If 60 foot
backslope heights are required for the slope design, this analysis shows that any appropriate
backslope ratio coupled with a 25 foot bench width provides sufficient results.
Additionally, the parameters used in this analysis are only part of the considerations that are
required to design a bedrock cut slope other equally important factors include slope stability
analysis, slope and highway drainage design, erosion control both on slope and roadway
shoulder, and a design approach to minimize the propensity for weaker material undercutting.

67
4.5 Utilization of Rockfall Catchment Area Design Ditch for a CRSP-3D Sensitivity
Analysis
The completion of the parametric analysis of rockfall behavior using DD-403 guidelines for
Hard Rock (DD-403 Type 1 and 2) and Soft Rock (DD-403 Type 3) demonstrated that some of
the rockfall reaching the lowest bench in the profile was not able to be retained. This behavior
allowed for these rocks to continue their trajectory toward that of the roadway cross sections
shoulder and possibly the vehicular traveled roadway. Therefore as an attempt to retain a greater
percentage of the rockfall from reaching this region and reduce rockfall runout distances from
the toe of the slope, a rockfall catchment area design was created.
This analysis of the design was conducted using the same methodology used for the 54
previously discussed iterations, 27 iterations were performed using Hard Rock, and 27 iterations
were conducted using Soft Rock. All 54 iterations were conducted using the same Rockfall Area
Catchment Design (RCAD). The general implementation and historical prospective of a rockfall
catchment area design otherwise known as a Ritchie Ditch or Modified Ritchie Ditch is
discussed in detail in Section 2.3.1. The exact design methodology and implementation of a
RCAD ditch in this parametric analysis differs from traditional RCAD design due to several
design constraints that occur with the implementation of the RCAD ditch in the state of West
Virginia
The largest issue that arises with the use of direct implementation of previously designed,
analyzed and constructed RCAD ditches lies in one of the most fundamental design principles
for the ditch. Historically, the RCAD ditch has been designed and implemented for cut slopes
that have a total cut depth (distance from original ground contour located at top of cut to the toe
of the slope) of 80 feet. Currently available design charts and tables provide insight for the
design up to an 80 foot cut depth (ODOT, 2001). Any type of statistical extrapolation would
prove exceedingly difficult for total cut depths that are within the scope of this parametric
analysis. Therefore the following general conditions and design assumptions were used for the
development of an RCAD ditch for this analysis.
The angle of ditch nearest the roadway shoulder (Figure 4.18 Backslope B) was designed
at a ratio of 4H:1V or 14° measured from horizontal. The use of an angles equal to or
less than 14° allows for recoverable driving maneuvers from highway motorists entering
this zone of the slope intentionally or unintentionally (ODOT, 2001) If a ratio greater
than 4H:1V is used, it shall be considered not recoverable to vehicular traffic and
guiderail should be used as to not allow motorist to enter the this section of the RCAD
ditch (ODOT, 2001). The installation of guiderail presents several facets that are
typically undesirable for highway design. The use of guiderail involves monetary cost,
maintenance, and creates difficulty in the maintenance of removing rockfall from the
RCAD ditch. For these reasons, a ditch angle greater than 4H:1V was not used in this
analysis.
In order to design a RCAD ditch in place of the lowest catchment bench designed in prior
iterations of this analysis, some geometric parameters required modification.
Incorporating the RCAD ditch with the least amount of alterations to the overall
geometry required that each coordinate in the slope profile increase in the “z” dimension
by six feet. The enabled RCAD ditch to have a total depth of six feet below the roadway
elevation. This alteration allows for the bottom of the RCAD ditch to be defined at an
elevation of zero and all other aspects of the model be defined in positive coordinates
above this datum. Additionally the backslope above the RCAD ditch increased in the
defined height by six feet creating a backslope height over 70 feet in several iterations.

68
Although this creates unique condition for this analysis, in reality, this type of geometric
alteration would not be performed for a slope design.
The horizontal width of the ditch measured from the toe of the slope to the edge nearest
the roadway of the 4H:1V slope was designed to be 25 feet for all iterations. During field
site investigations it was observed that this distance (toe of slope to edge of roadway) was
between 25 to 30 feet. Therefore the analysis for implementation of an RCAD ditch for
DD-403 geometric slope design was performed in manner that required, in realistic terms,
no additional Right-Of-Way to beyond that of which is need to design a profile to
exacting DD-403 specifications.
Figure 4.18 Cross Section of RCAD Ditch Design created for CRSP-3D Parametric
Analysis
The calibrated properties used in CRSP 3-D simulations, such as roughness and hardness, were
kept constant to those of which were defined in Sections 4.3 and 4.4. Therefore rockfall impact
and rolling behavior is theoretically only dependent upon the difference in geometry between the
lower catchment bench and the RCAD ditch. As depicted in Figure 4.19 a typical cross sectional
profile was created with the implementation of the RCAD ditch. The typical cross section
consisted of two benches, an RCAD ditch, and three backslopes for all iterations. Although the
magnitude of these parameters changed in accordance to Table 4.2 an overall typical cross
section is shown below to illustrate the labeling conventions used for each area of this slope.
Both bench and backslope numbers initiate at the crest of the slope and increase in value moving
down the cross section towards the toe. The rockfall runout surface was defined to be
completely flat (0°) to allow for the greatest magnitude of rockfall runout. In practice this
surface would have inclination toward to toe of the slope, reducing rockfall runout distances.

69
Figure 4.19 Typical Cross Section used in Parametric Analysis for Design using WVDOH
DD-403 Specifications with RCAD Ditch
4.6 Results DD-403 Design Cut Slope Parameters with RCAD Ditch for Hard Rock
using CRSP-3D
As performed in Section 4.3, 27 iterations were conducted in order to determine the effects of
each geometric parameter with the resulting rockfall behavior. Tables 4.10, 4.11, and 4.12 depict
the results of Hard Rock Classification slope material (Principally DD-403 Type 1 and Type 2
Bedrock). The table is categorized by bench width, which increases moving down the table,
within a given bench width the backslope angle decreases.
Backslope #1
Backslope #2
Backslope #3
RCAD Ditch
Rockfall Runout Surface
Bench #1
Bench #2
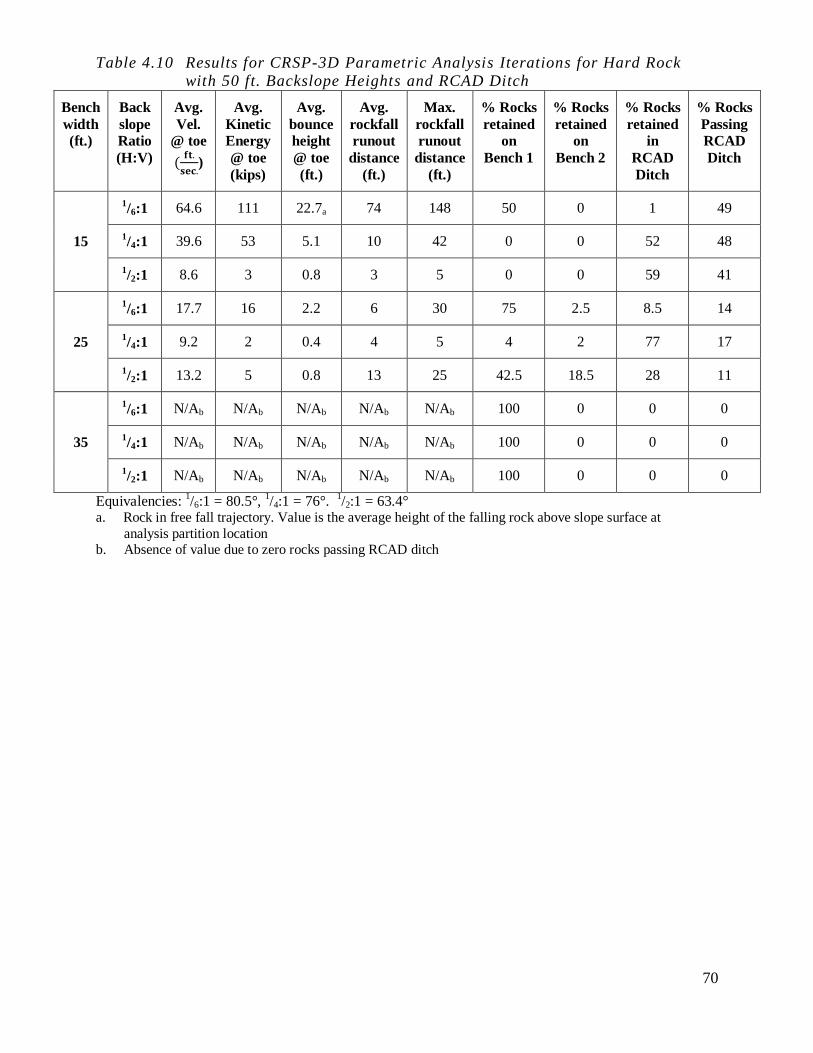
70
Table 4.10 Results for CRSP-3D Parametric Analysis Iterations for Hard Rock
with 50 ft. Backslope Heights and RCAD Ditch
Bench
width
(ft.)
Back
slope
Ratio
(H:V)
Avg.
Vel.
@ toe
(𝐟𝐭.
𝐬𝐞𝐜.)
Avg.
Kinetic
Energy
@ toe
(kips)
Avg.
bounce
height
@ toe
(ft.)
Avg.
rockfall
runout
distance
(ft.)
Max.
rockfall
runout
distance
(ft.)
% Rocks
retained
on
Bench 1
% Rocks
retained
on
Bench 2
% Rocks
retained
in
RCAD
Ditch
% Rocks
Passing
RCAD
Ditch
15
1/6:1 64.6 111 22.7a 74 148 50 0 1 49
1/4:1 39.6 53 5.1 10 42 0 0 52 48
1/2:1 8.6 3 0.8 3 5 0 0 59 41
25
1/6:1 17.7 16 2.2 6 30 75 2.5 8.5 14
1/4:1 9.2 2 0.4 4 5 4 2 77 17
1/2:1 13.2 5 0.8 13 25 42.5 18.5 28 11
35
1/6:1 N/Ab N/Ab N/Ab N/Ab N/Ab 100 0 0 0
1/4:1 N/Ab N/Ab N/Ab N/Ab N/Ab 100 0 0 0
1/2:1 N/Ab N/Ab N/Ab N/Ab N/Ab 100 0 0 0
Equivalencies: 1/6:1 = 80.5°,
1/4:1 = 76°.
1/2:1 = 63.4°
a. Rock in free fall trajectory. Value is the average height of the falling rock above slope surface at
analysis partition location
b. Absence of value due to zero rocks passing RCAD ditch

71
Table 4.11 Results for CRSP-3D Parametric Analysis Iterations for Hard Rock
with 60 ft. Backslope Heights and RCAD Ditch
Bench
width
(ft.)
Back
slope
Ratio
(H:V)
Avg.
Vel.
@ toe
(𝐟𝐭.
𝐬𝐞𝐜.)
Avg.
Kinetic
Energy
@ toe
(kips)
Avg.
bounce
height
@ toe
(ft.)
Avg.
rockfall
runout
distance
(ft.)
Max.
rockfall
runout
distance
(ft.)
% Rocks
retained
on
Bench 1
% Rocks
retained
on
Bench 2
% Rocks
retained
in
RCAD
Ditch
% Rocks
Passing
RCAD
Ditch
15
1/6:1 83 166 34.8a 38 90 46 0 0 54
1/4:1 67 133 12.5 67 158 0 0 41 59
1/2:1 57 74 8.8 67 135 0 8 36 56
25
1/6:1 58 85 33.7 61 64 79.5 0 2.5 18
1/4:1 48 74.4 9.4 19 53 13 0 66 21
1/2:1 33 48 5.8 32 77 15 10 62 13
35
1/6:1 N/Ab N/Ab N/Ab N/Ab N/Ab 100 0 0 0
1/4:1 N/Ab N/Ab N/Ab N/Ab N/Ab 100 0 0 0
1/2:1 97 5 0.6 7 27 24.5 23.5 47.5 4.5
Equivalencies: 1/6:1 = 80.5°,
1/4:1 = 76°.
1/2:1 = 63.4°
a. Rock in free fall trajectory. Value is the average height of the falling rock above slope surface at
analysis partition location
b. Absence of value due to zero rocks passing lower bench
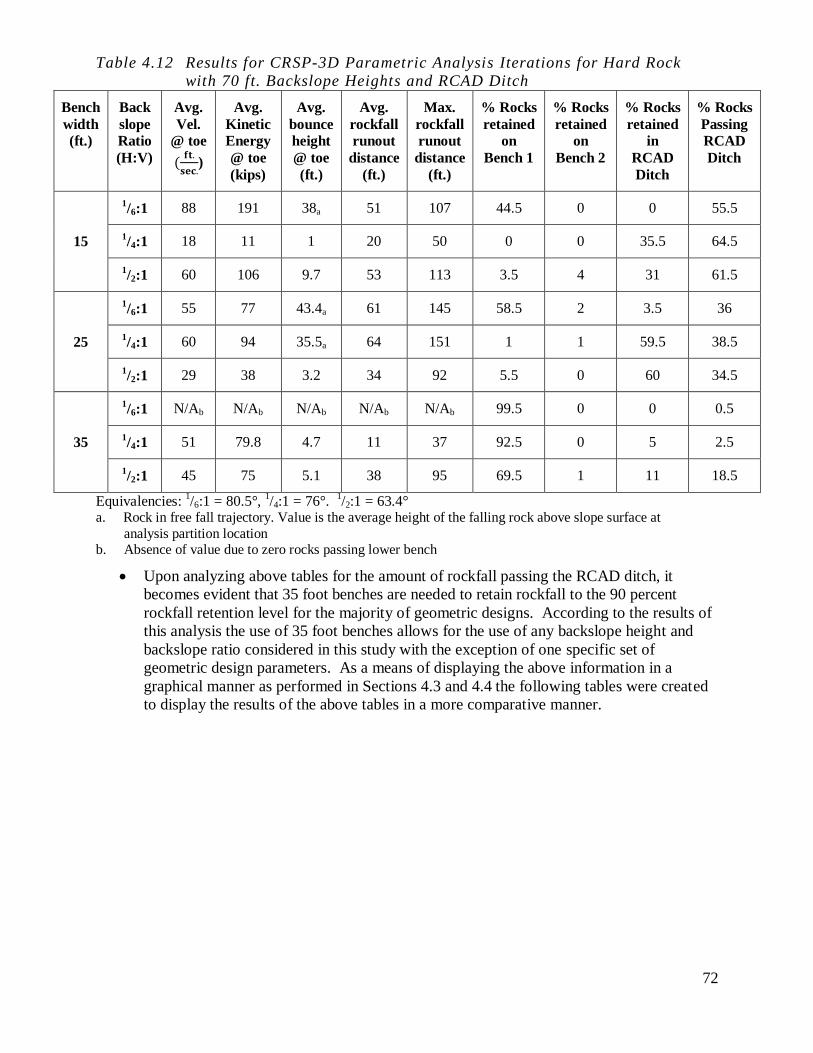
72
Table 4.12 Results for CRSP-3D Parametric Analysis Iterations for Hard Rock
with 70 ft. Backslope Heights and RCAD Ditch
Bench
width
(ft.)
Back
slope
Ratio
(H:V)
Avg.
Vel.
@ toe
(𝐟𝐭.
𝐬𝐞𝐜.)
Avg.
Kinetic
Energy
@ toe
(kips)
Avg.
bounce
height
@ toe
(ft.)
Avg.
rockfall
runout
distance
(ft.)
Max.
rockfall
runout
distance
(ft.)
% Rocks
retained
on
Bench 1
% Rocks
retained
on
Bench 2
% Rocks
retained
in
RCAD
Ditch
% Rocks
Passing
RCAD
Ditch
15
1/6:1 88 191 38a 51 107 44.5 0 0 55.5
1/4:1 18 11 1 20 50 0 0 35.5 64.5
1/2:1 60 106 9.7 53 113 3.5 4 31 61.5
25
1/6:1 55 77 43.4a 61 145 58.5 2 3.5 36
1/4:1 60 94 35.5a 64 151 1 1 59.5 38.5
1/2:1 29 38 3.2 34 92 5.5 0 60 34.5
35
1/6:1 N/Ab N/Ab N/Ab N/Ab N/Ab 99.5 0 0 0.5
1/4:1 51 79.8 4.7 11 37 92.5 0 5 2.5
1/2:1 45 75 5.1 38 95 69.5 1 11 18.5
Equivalencies: 1/6:1 = 80.5°,
1/4:1 = 76°.
1/2:1 = 63.4°
a. Rock in free fall trajectory. Value is the average height of the falling rock above slope surface at
analysis partition location
b. Absence of value due to zero rocks passing lower bench
Upon analyzing above tables for the amount of rockfall passing the RCAD ditch, it
becomes evident that 35 foot benches are needed to retain rockfall to the 90 percent
rockfall retention level for the majority of geometric designs. According to the results of
this analysis the use of 35 foot benches allows for the use of any backslope height and
backslope ratio considered in this study with the exception of one specific set of
geometric design parameters. As a means of displaying the above information in a
graphical manner as performed in Sections 4.3 and 4.4 the following tables were created
to display the results of the above tables in a more comparative manner.

73
Figure 4.20 Histogram of Percent Hard Rockfall Passing RCAD Ditch with 15 ft. Benches
Figure 4.21 Histogram of Percent Hard Rockfall Passing RCAD Ditch with 25 ft. Benches
0
25
50
75
100
125
150
175
200
1/6:1 1/4:1 1/2:1 1/6:1 1/4:1 1/2:1 1/6:1 1/4:1 1/2:1
# H
ard
Rock
fall
Pass
ing R
CA
D D
Itch
60 ft. Backslope 50 ft. Backslope 70 ft. Backslope
0
25
50
75
100
125
150
175
200
1/6:1 1/4:1 1/2:1 1/6:1 1/4:1 1/2:1 1/6:1 1/4:1 1/2:1
# H
ard
Rock
fall
Pa
ssin
g R
CA
D D
itch
50 ft. Backslope 70 ft. Backslope 60 ft. Backslope

74
Figure 4.22 Histogram of Percent Hard Rockfall Passing RCAD Ditch with 35 ft. Benches
Critical analysis of Figures 4.20 through 4.22 for parameter trends, minimums, maximums and
overall performance allows for the following conclusions to be made:
The backslope ratio range used in this study has little sensitivity when coupled with a
rock catchment ditch. Varying the backslope angle produces little to no change in the
number of rocks passing the toe of the slope for slopes with backslope heights less than
or equal to 60 feet. For backslopes designed with 70 foot height and 35 foot bench width
only the 1/2:1 backslope angle produces rockfall passing the toe that significantly differs
from other backslope angles considered in this analysis.
Although differentially small in magnitude, bench widths less than 25 feet produce the
largest quantity of rockfall passing the toe when a 1/4:1 backslope angle is used. A bench
width of 35 feet produces the largest rockfall passing the toe when a 1/2:1 backslope is
used.
As bench width increases, the amount of rocks passing the toe of the slope decreases.
Intuitively the larger bench width yields greater on-slope rockfall retention. In order to
evaluate holistic performance of the analysis, 90 percent rockfall retention was used as
the minimum performance benchmark for rockfall catchment effectiveness. All slopes
with 35 foot bench with were able to meet this benchmark with the exception of a profile
designed with 1/2:1 backslope ratios and 70 foot backslope heights.
Following DD-403 slope design standards for Type 1 and 2 hard bedrock slope geometric
design, in order to effectively mitigate rockfall to the 90 percent catchment level all
slopes with backslopes greater than 50 vertical feet should be constructed to a ratio of 1/4:1 or greater and benches contain benches with a 35 foot minimum width.
0
25
50
75
100
125
150
175
200
1/6:1 1/4:1 1/2:1 1/6:1 1/4:1 1/2:1 1/6:1 1/4:1 1/2:1
# H
ard
Rock
fall
Pass
ing R
CA
D D
itch
50 ft. Backslope 70 ft. Backslope 60 ft. Backslope

75
Figure 4.23 Histogram of Percent Hard Rockfall Retained By Bench Number with 50 ft.
Backslope Heights
Figure 4.24 Histogram of Percent Hard Rockfall Retained By Bench Number with 60 ft.
Backslope Heights
0
10
20
30
40
50
60
70
80
90
100
1/6:1 1/4:1 1/2:1 1/6:1 1/4:1 1/2:1 1/6:1 1/4:1 1/2:1% H
ard
Rock
fall
Reta
ined
on
Slo
pe
RCAD Ditch
Bench 2
Bench 1
15 ft. Benches 25 ft. Benches 35 ft. Benches
0
10
20
30
40
50
60
70
80
90
100
1/6:1 1/4:1 1/2:1 1/6:1 1/4:1 1/2:1 1/6:1 1/4:1 1/2:1
% R
ock
fall
Reta
ined
on
Slo
pe
RCAD Ditch
Bench 2
Bench1
15 ft. Benches 25 ft. Benches 35 ft. Benches
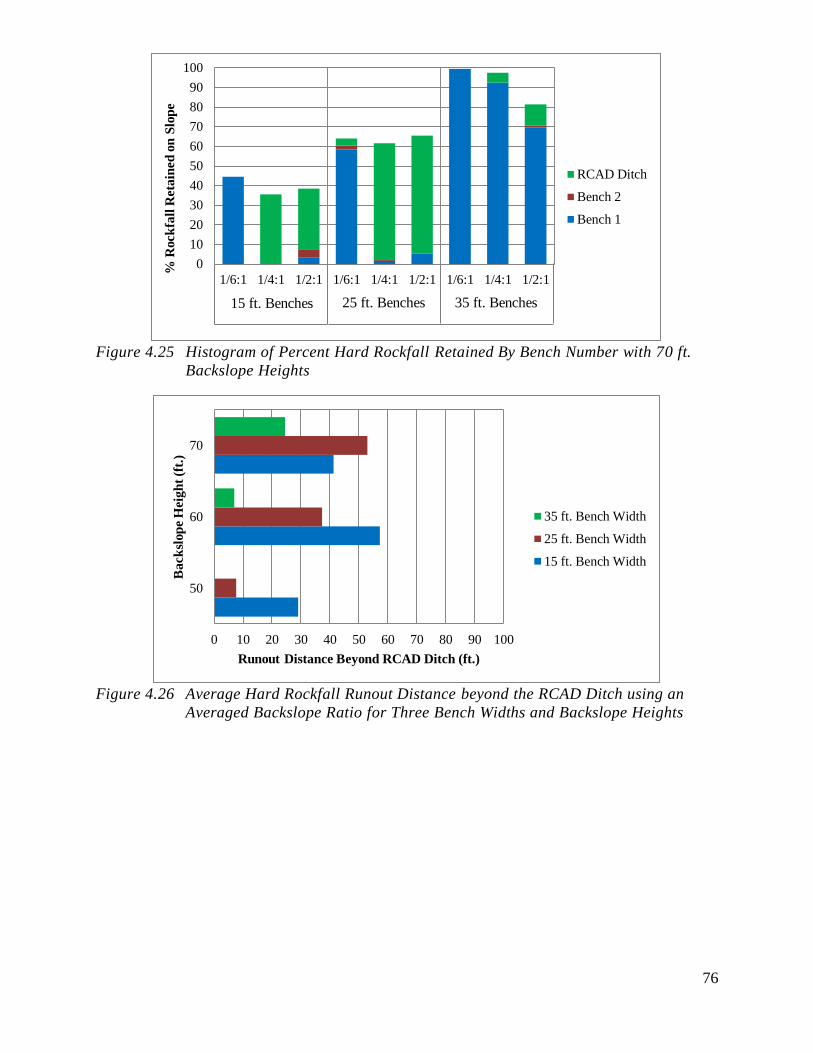
76
Figure 4.25 Histogram of Percent Hard Rockfall Retained By Bench Number with 70 ft.
Backslope Heights
Figure 4.26 Average Hard Rockfall Runout Distance beyond the RCAD Ditch using an
Averaged Backslope Ratio for Three Bench Widths and Backslope Heights
0
10
20
30
40
50
60
70
80
90
100
1/6:1 1/4:1 1/2:1 1/6:1 1/4:1 1/2:1 1/6:1 1/4:1 1/2:1
% R
ock
fall
Reta
ined
on
Slo
pe
RCAD Ditch
Bench 2
Bench 1
15 ft. Benches 25 ft. Benches 35 ft. Benches
0 10 20 30 40 50 60 70 80 90 100
50
60
70
Runout Distance Beyond RCAD Ditch (ft.)
Ba
ck
slop
e H
eig
ht
(ft.
)
35 ft. Bench Width
25 ft. Bench Width
15 ft. Bench Width

77
Figure 4.27 Average Hard Rockfall Runout Distance beyond the RCAD Ditch using an
Averaged Bench Width for Three Backslope Ratios and Backslope Heights
Figures 4.23 through 4.25 depict the rockfall retention as a summation of each benches
individual retention characteristics. Each graph depicts each of the three backslope angles and
bench widths that were used in the analysis but differ by the backslope heights. The construction
of these graphs allows for the following deductions to be made:
Increasing backslope height marginally decreases the ability of a bench cut slope to retain
rockfall as compared to other geometric parameters. Therefore, holding all other
parameters constant, increasing backslope height(s) from 50 to 70 feet will not
substantially decrease on-slope rockfall retention characteristics.
The width of all benches placed on a slope profile exhibits the largest effect on rockfall
retention. As bench width increases, the ability of a slope profile to retain rockfall
increases.
Slope cross section profiles with bench widths less than 25 feet yielded the greatest
retention effectiveness for the RCAD ditch. The majority of rockfall retained by the
entire slope profile was facilitated by the RCAD ditch for these iterations. Rockfall
passing the first two slope benches on profiles with 35 foot benches also showed rockfall
retention by the RCAD ditch but encompassed a lower percentage as the upper two
benches retained the majority of the rockfall.
Figures 4.26 and 4.27 allows for the evaluation of rockfall runout distance beyond the toe of the
slope. Runout distance was measured from edge of the RCAD ditch adjacent to the roadway
shoulder (Figure 4.19 Side B). This allowed for as similar as possible comparison in runout
distance beyond the toe to those geometric designs with a lower catchment bench. Analysis of
these figures allows for the following deductions to be made:
The width of the bench for a constant backslope height exhibits the largest effects on
rockfall runout past the toe in comparison to other parametric factors.
The effects of bench width for the range of backslope heights performed in this research
shows that as backslope height increases, rockfall runout distance beyond the RCAD
ditch increases for all values of bench width.
0 10 20 30 40 50 60 70 80 90 100
50
60
70
Runout Distance Beyond RCAD Ditch (ft.)
Back
slop
e H
eig
ht
(ft.
) 1/2:1 Backslope
1/4:1 Backslope
1/6:1 Backslope

78
The three backslope angle used in this study considered with constant backslope height
show sensitivity to the effects on rockfall runout distance beyond the RCAD ditch.
Except for slopes with 1/4:1 backslope angle, holding backslope angle constant as
backslope height increases, rockfall runout past the RCAD ditch increases.
Providing almost equal results, 1/2:1 and
1/4:1 yielded the lowest rockfall runout distance
beyond the RCAD ditch. During modeling it was observed that the lower the backslope
angle the more suitable the trajectory for rockfall to strike the ditch closer to the toe of
the slope, allowing for greater retention within the area of the RCAD ditch.
Figures 4.28 through 4.30 were created as a graphical comparison between the Hard Rockfall
retention behavior analysis in Section 4.3 and that of which has been previously discussed in this
section. By creating these following figures a direct comparison of the performance of similar
geometric slope profiles can be made, thereby showing the performance of the two very distinct
toe-of-slope rockfall retention designs. All three figures represent direct comparisons for a given
backslope angle and backslope height, and only are separated by the respective bench widths.
Figure 4.28 Comparison of Hard Rockfall Catchment Effectiveness of a WVDOH DD-403
Specification Lower Catchment Bench and the RCAD Ditch designed for this
Analysis using 15 ft. Bench Widths
0
10
20
30
40
50
60
70
80
90
100
1/6:1 1/4:1 1/2:1 1/6:1 1/4:1 1/2:1 1/6:1 1/4:1 1/2:1
% H
ard
Rock
fall
Reta
ined
on
Slo
pe
Catchment Bench
RCAD Ditch
50 ft. Backslope 60 ft. Backslope 70 ft. Backslope

79
Figure 4.29 Comparison of Hard Rockfall Catchment Effectiveness of a WVDOH DD-403
Specification Lower Catchment Bench and the RCAD Ditch designed for this
Analysis using 25 ft. Bench Widths
Figure 4.30 Comparison of Hard Rockfall Catchment Effectiveness of a WVDOH DD-403
Specification Lower Catchment Bench and the RCAD Ditch designed for this
Analysis using 35 ft. Bench Widths
Critical analysis of Figures 4.28 through 4.30 allows for the determination of the effectiveness of
two distinct designs for toe of slope rockfall catchment. Conclusions on about the performance
of each are as follows:
By designing a RCAD ditch as the toe of slope catchment design, total on-slope hard
rockfall retention increased in all but two iterations. In these two iterations the retention
difference between the two designs was on the order of two to three percent for the lower
bench over the RCAD ditch. This magnitude was considered minimal and within the
error of the programs simulation characteristics and therefore the simulated performance
was considered equal.
0
10
20
30
40
50
60
70
80
90
100
1/6:1 1/4:1 1/2:1 1/6:1 1/4:1 1/2:1 1/6:1 1/4:1 1/2:1
% H
ard
Rock
fall
Reta
ined
on
Slo
pe
Catchment Bench
RCAD Ditch
50 ft. Backslope 60 ft. Backslope 70 ft. Backslope
0
10
20
30
40
50
60
70
80
90
100
1/6:1 1/4:1 1/2:1 1/6:1 1/4:1 1/2:1 1/6:1 1/4:1 1/2:1
% H
ard
Rock
fall
Reta
ined
on
Slo
pe
Catchment Bench
RCAD Ditch
50 ft. Backslope 60 ft. Backslope 70 ft. Backslope

80
For the backslope angle range considered in this study, as backslope angle decreases, the
margin of the effectiveness of an RCAD ditch over the lower catchment bench increases.
Profiles with bench widths of 25 feet and less show the greatest increase in rockfall
retention by the use of an RCAD ditch over the lower catchment bench design.
Profiles with the RCAD ditch design show a smaller reduction to rockfall retention with
increases in backslope height than that of the lower catchment bench design.
Within the geometric profile parameters conducted for this analysis, on-slope rockfall catchment
for Hard Rock material is equaled or increased by the addition of the RCAD ditch over the lower
catchment bench design. Although the ditch equals or increases rockfall retention in all cases, it
does not consistently yield total rockfall retention for all geometric profiles analyzed to the 90%
rockfall retention requirement. Therefore RCAD ditches should not be considered a design
panacea for toe of slope rockfall retention during profile design; other geometric parameters
must be considered in order to facilitate a profile meeting rockfall retention requirements.
4.7 Results DD-403 Design Cut Slope Parameters with RCAD Ditch for Soft Rock
using CRSP-3D
As performed in Section 4.4, 27 iterations were conducted in order to determine the effects of
each geometric parameter with the resulting rockfall behavior. Tables 4.13, 4.14 and 4.15 depict
the results of Soft Rock Classification slope material (Principally DD-403 Type 3 Bedrock). The
table is categorized by bench width, which increases moving down the table. Within a given
bench width the backslope angle decreases.
Table 4.13 Results for CRSP-3D Parametric Analysis Iterations for Soft Rock with
50 ft. Backslope Heights and RCAD Ditch
Bench
width
(ft.)
Back
slope
Ratio
(H:V)
Avg.
Vel.
@ toe
(𝐟𝐭.
𝐬𝐞𝐜.)
Avg.
Kinetic
Energy
@ toe
(kips)
Avg.
bounce
height
@ toe
(ft.)
Avg.
rockfall
runout
distance
(ft.)
Max.
rockfall
runout
distance
(ft.)
% Rocks
retained
on
Bench 1
% Rocks
retained
on
Bench 2
% Rocks
retained
in
RCAD
Ditch
% Rocks
Passing
RCAD
Ditch
15
1/2:1 12.5 4.5 0.85 6 8 33 10 55 2
3/4:1 10 3 0 2 3 30 15 54 1
1:1 N/Aa N/Aa N/Aa N/Aa N/Aa 69 11 20 0
25
1/2:1 N/Aa N/Aa N/Aa N/Aa N/Aa 80 2 18 0
3/4:1 N/Aa N/Aa N/Aa N/Aa N/Aa 71 3 26 0
1:1 N/Aa N/Aa N/Aa N/Aa N/Aa 92 0 8 0
35
1/2:1 N/Aa N/Aa N/Aa N/Aa N/Aa 100 0 0 0
3/4:1 N/Aa N/Aa N/Aa N/Aa N/Aa 100 0 0 0
1:1 N/Aa N/Aa N/Aa N/Aa N/Aa 100 0 0 0
Equivalencies: 1/2:1 = 63.4°,
3/4:1 = 53°, 1:1 = 45°
a. Absence of value due to zero rocks passing RCAD ditch

81
Table 4.14 Results for CRSP-3D Parametric Analysis Iterations for Soft Rock with
60 ft. Backslope Heights and RCAD Ditch
Bench
width
(ft.)
Back
slope
Ratio
(H:V)
Avg.
Vel.
@ toe
(𝐟𝐭.
𝐬𝐞𝐜.)
Avg.
Kinetic
Energy
@ toe
(kips)
Avg.
bounce
height
@ toe
(ft.)
Avg.
rockfall
runout
distance
(ft.)
Max.
rockfall
runout
distance
(ft.)
% Rocks
retained
on
Bench 1
% Rocks
retained
on
Bench 2
% Rocks
retained
in
RCAD
Ditch
% Rocks
Passing
RCAD
Ditch
15
1/2:1 10 6 1.17 12.3 34 35 33 30.5 1.5
3/4:1 15 7.5 0.9 7 12 31 11 52 6
1:1 15.7 14 0.5 5 16 64 5 24 7
25
1/2:1 N/Aa N/Aa N/Aa N/Aa N/Aa 63 36 1 0
3/4:1 N/Aa N/Aa N/Aa N/Aa N/Aa 64 20.5 15.5 0
1:1 N/Aa N/Aa N/Aa N/Aa N/Aa 82 5 13 0
35
1/2:1 N/Aa N/Aa N/Aa N/Aa N/Aa 95 3.5 1.5 0
3/4:1 N/Aa N/Aa N/Aa N/Aa N/Aa 93 5 2 0
1:1 N/Aa N/Aa N/Aa N/Aa N/Aa 95 5 0 0
Equivalencies: 1/2:1 = 63.4°,
3/4:1 = 53°, 1:1 = 45°
a. Absence of value due to zero rocks passing RCAD ditch

82
Table 4.15 Results for CRSP-3D Parametric Analysis Iterations for Soft Rock with
70 ft. Backslope Heights and RCAD Ditch
Bench
width
(ft.)
Back
slope
Ratio
(H:V)
Avg.
Vel.
@ toe
(𝐟𝐭.
𝐬𝐞𝐜.)
Avg.
Kinetic
Energy
@ toe
(kips)
Avg.
bounce
height
@ toe
(ft.)
Avg.
rockfall
runout
distance
(ft.)
Max.
rockfall
runout
distance
(ft.)
% Rocks
retained
on
Bench 1
% Rocks
retained
on
Bench 2
% Rocks
retained
in
RCAD
Ditch
% Rocks
Passing
RCAD
Ditch
15
1/2:1 41 70 6.71 29.8 90 13 6 71.5 9.5
3/4:1 15 8 0.7 6 13 12 3 68 17
1:1 16.5 9 1.1 9 30 57 3 27 13
25
1/2:1 10.5 3.8 0.54 5.5 22 51 22 24.5 2.5
3/4:1 17 7.8 0.3 5.8 11 46 13 37 4
1:1 16 9 1 19 40 73 6 18.5 2.5
35
1/2:1 N/Aa N/Aa N/Aa N/Aa N/Aa 88 6 6 0
3/4:1 N/Aa N/Aa N/Aa N/Aa N/Aa 81 9 10 0
1:1 N/Aa N/Aa N/Aa N/Aa N/Aa 92 4.5 3.5 0
Equivalencies: 1/2:1 = 63.4°,
3/4:1 = 53°, 1:1 = 45°
a. Absence of value due to zero rocks passing RCAD ditch
Upon analyzing above tables for the amount of rockfall passing the RCAD ditch, it
becomes evident that 15 foot benches and an RCAD ditch provided sufficient area to
retain rockfall to the 90 percent rockfall retention level for the majority of geometric
designs. Specifically, only 70 foot backslope heights yielded rockfall behavior that could
not be retained to the benchmark value with 15 ft. bench widths. According to the results
of this analysis, the use of 25 foot and greater benches allows for a slope design using any
value of backslope height and backslope ratio that are within the ranges considered by
this research.

83
Figure 4.31 Histogram of Percent Soft Rockfall Passing RCAD Ditch with 15 ft. Benches
Figure 4.32 Histogram of Percent Soft Rockfall Passing RCAD Ditch with 25 ft. Benches
Critical analysis of Figures 4.31 and 4.32 for parameter trends, minimums, maximums and
overall performance allows for the following conclusions to be made:
On average, a backslope ratio of 1/2:1 produces slightly less rockfall passing the toe of the
slope than the steeper slope angles considered. This result was independent of backslope
height or bench width within the magnitude of the values used for these parameters in
this analysis.
As bench width increases, the amount of rocks passing the toe of the slope decreases.
Intuitively the larger bench width yields greater on-slope rockfall retention. The 35 ft.
bench width has been omitted from graphical representation due to zero rocks passing
beyond the RCAD ditch in all iterations conducted.
It can be concluded that following DD-403 slope design standards for Type 3 and 4 soft
with the addition of the above designed RCAD ditch, in order to effectively mitigate
rockfall to the 90 percent catchment level, all slopes can be design with the DD-403
minimum 15 ft. bench width and any backslope angle considered in this study provided
0
25
50
75
100
125
150
175
200
1/2:1 3/4:1 1:1 1/2:1 3/4:1 1:1 1/2:1 3/4:1 1:1# o
f S
oft
Rock
fall
Pa
ssin
g R
CA
D D
itch
50 ft. Backslope 60 ft. Backslope 70 ft. Backslope
0
25
50
75
100
125
150
175
200
1/2:1 3/4:1 1:1 1/2:1 3/4:1 1:1 1/2:1 3/4:1 1:1# o
f S
oft
Rock
fall
Pa
ssin
g R
CA
D D
itch
50 ft. Backslope 60 ft. Backslope 70 ft. Backslope

84
backslope heights are less than or equal to 60 feet. Using bench widths of 25 feet or
greater can be designed to any backslope angle and height that falls within range of
parameters of this study and yield rockfall retention exceeding 90 percent.
Figure 4.33 Histogram of Percent Soft Rockfall Retained By Bench Number with 50 ft.
Backslope Heights
Figure 4.34 Histogram of Percent Soft Rockfall Retained By Bench Number with 60 ft.
Backslope Heights
0
10
20
30
40
50
60
70
80
90
100
1/2:1 3/4:1 1:1 1/2:1 3/4:1 1:1 1/2:1 3/4:1 1:1
% S
oft
Rock
fall
Rete
nti
on
on
Slo
pe
RCAD Ditch
Bench 2
Bench 1
15 ft. Benches 25 ft. Benches 35 ft. Benches
0
10
20
30
40
50
60
70
80
90
100
1/2:1 3/4:1 1:1 1/2:1 3/4:1 1:1 1/2:1 3/4:1 1:1
% S
oft
Rock
fall
Rete
nti
on
on
Slo
pe
RCAD Ditch
Bench 2
Bench 1
15 ft. Benches 25 ft. Benches 35 ft. Benches

85
Figure 4.35 Histogram of Percent Soft Rockfall Retained By Bench Number with 70 ft.
Backslope Heights
Figure 4.36 Average Soft Rockfall Runout Distance beyond the RCAD Ditch using an
Averaged Backslope Ratio for Three Bench Widths and Backslope Heights
0
10
20
30
40
50
60
70
80
90
100
1/2:1 3/4:1 1:1 1/2:1 3/4:1 1:1 1/2:1 3/4:1 1:1
% S
oft
Rock
fall
Rete
nti
on
on
Slo
pe
RCAD Ditch
Bench 2
Bench 1
15 ft. Benches 25 ft. Benches 35 ft. Benches
0 10 20 30 40 50
50
60
70
Runout Distance Beyond RCAD Ditch (ft.)
Ba
ck
slop
e H
eig
ht
(ft.
)
35 ft. Bench Width
25 ft. Bench Width
15 ft. Bench Width

86
Figure 4.37 Average Soft Rockfall Runout Distance beyond the RCAD Ditch using an
Averaged Bench Width for Three Backslope Ratios and Backslope Heights
Figures 4.33 through 4.35 depict the rockfall retention as a summation of each benches
individual retention characteristics. Each graph depicts each of the three backslope angles and
bench widths that were used in the analysis but differ by the backslope heights. The construction
of these graphs allows for the following deductions to be made:
Increasing backslope height does marginally decrease the ability of a bench cut slope to
retain rockfall as compared to other geometric parameters. Therefore from the results of
this analysis, holding all other parameters constant, increasing a slopes backslope
height(s) from 50 to 70 feet will not substantially decrease on-slope rockfall retention
characteristics.
The width of all benches placed on a slope profile exhibits the largest effect on rockfall
retention. As bench width increases, the ability of a slope profile to retain rockfall
increases.
Slope cross section profiles with bench widths less than 25 feet yielded the greatest
retention effectiveness with the addition of an RCAD ditch. For these slopes, of the total
rockfall retained on the slope profile that is not retained by the first bench, the remainder
is almost entirely retained by the RCAD ditch. Rockfall passing the first two benches on
profiles with 35 foot benches also showed rockfall retention by the RCAD ditch, but
encompassed a lower percentage as the upper two benches retained the majority of the
rockfall.
Figures 4.36 and 4.37 allows for the evaluation of rockfall runout distance beyond the toe of the
slope. Runout distance was measured from edge of the RCAD ditch adjacent to the roadway
shoulder (Figure 4.19 Side B). This allowed for as similar as possible comparison in runout
distance beyond the toe to those geometric designs with a lower catchment bench. Analysis of
these figures allows for the following deductions to be made:
The width of the bench for a constant backslope height exhibits the largest effects on
rockfall runout past the toe in comparison to other parametric factors.
The effects of bench width for the range of backslope heights performed in this study
shows that as backslope height increases, rockfall runout distance beyond the RCAD
ditch increases for all values of bench width.
0 10 20 30 40 50
50
60
70
Runout Distance Beyond RCAD Ditch (ft.)
Back
slop
e H
eig
ht
(ft.
) 1:1 Backslope
3/4:1 Backslope
1/2:1 Backslope
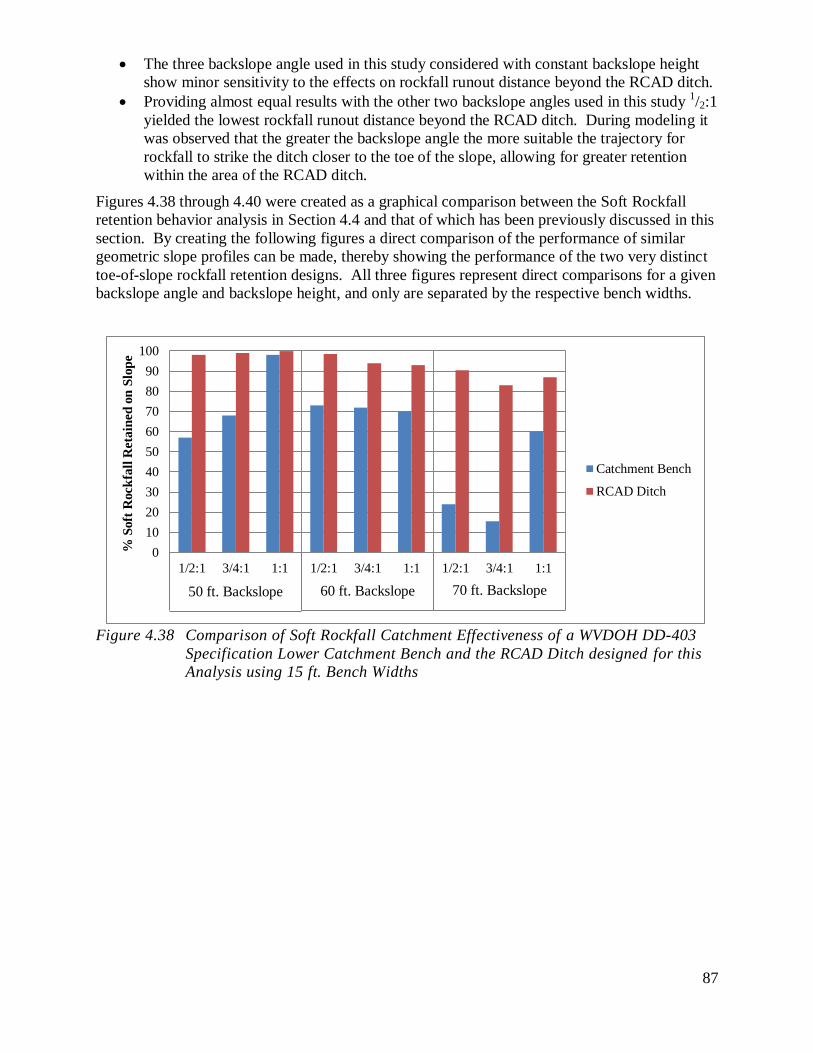
87
The three backslope angle used in this study considered with constant backslope height
show minor sensitivity to the effects on rockfall runout distance beyond the RCAD ditch.
Providing almost equal results with the other two backslope angles used in this study 1/2:1
yielded the lowest rockfall runout distance beyond the RCAD ditch. During modeling it
was observed that the greater the backslope angle the more suitable the trajectory for
rockfall to strike the ditch closer to the toe of the slope, allowing for greater retention
within the area of the RCAD ditch.
Figures 4.38 through 4.40 were created as a graphical comparison between the Soft Rockfall
retention behavior analysis in Section 4.4 and that of which has been previously discussed in this
section. By creating the following figures a direct comparison of the performance of similar
geometric slope profiles can be made, thereby showing the performance of the two very distinct
toe-of-slope rockfall retention designs. All three figures represent direct comparisons for a given
backslope angle and backslope height, and only are separated by the respective bench widths.
Figure 4.38 Comparison of Soft Rockfall Catchment Effectiveness of a WVDOH DD-403
Specification Lower Catchment Bench and the RCAD Ditch designed for this
Analysis using 15 ft. Bench Widths
0
10
20
30
40
50
60
70
80
90
100
1/2:1 3/4:1 1:1 1/2:1 3/4:1 1:1 1/2:1 3/4:1 1:1
% S
oft
Rock
fall
Reta
ined
on
Slo
pe
Catchment Bench
RCAD Ditch
50 ft. Backslope 60 ft. Backslope 70 ft. Backslope

88
Figure 4.39 Comparison of Soft Rockfall Catchment Effectiveness of a WVDOH DD-403
Specification Lower Catchment Bench and the RCAD Ditch designed for this
Analysis using 25 ft. Bench Widths
Figure 4.40 Comparison of Soft Rockfall Catchment Effectiveness of a WVDOH DD-403
Specification Lower Catchment Bench and the RCAD Ditch designed for this
Analysis using 35 ft. Bench Widths
Critical analysis of Figures 4.38 through 4.40 allows for the determination of the effectiveness of
two distinct designs for toe of slope rockfall catchment. Conclusions on about the performance
of each are as follows:
By designing a RCAD ditch as the toe of slope catchment design, total on-slope soft
rockfall retention is increased.
Independent of other geometric parameters, the implementation of an RCAD ditch when
coupled with bench widths greater than or equal to 25 feet allows for rockfall catchment
meeting or exceeding the 90% threshold. In comparison, when a lower catchment bench
is used for toe of slope rockfall catchment, bench widths must be at minimum 35 feet
wide to meet the threshold.
0
10
20
30
40
50
60
70
80
90
100
1/2:1 3/4:1 1:1 1/2:1 3/4:1 1:1 1/2:1 3/4:1 1:1
% S
oft
Rock
fall
Reta
ined
on
Slo
pe
Catchment Bench
RCAD Ditch
50 ft. Backslope 60 ft. Backslope 70 ft. Backslope
0
10
20
30
40
50
60
70
80
90
100
1/2:1 3/4:1 1:1 1/2:1 3/4:1 1:1 1/2:1 3/4:1 1:1
Catchment Bench
RCAD Ditch
50 ft. Backslope 60 ft. Backslope 70 ft. Backslope

89
Profiles with bench widths of 25 feet and less show the greatest increase in rockfall
retention by the use of an RCAD ditch over the lower catchment bench design.
Profiles with the RCAD ditch design show a smaller reduction to rockfall retention with
increases in backslope height than that of the lower catchment bench design.
Within the geometric profile parameters conducted for this analysis, on-slope rockfall catchment
for soft rock material increased in every iteration by the addition of the RCAD ditch over the
lower catchment bench design. Although the RCAD ditch increases rockfall retention in all
cases, it does not yield total rockfall retention for all geometric profiles analyzed to the 90%
rockfall retention requirement. Therefore RCAD ditches should not be considered a design
panacea for toe of slope rockfall retention during profile design; other geometric parameters
must be considered in order to facilitate a profile meeting rockfall retention requirements.
5. NUMERICAL MODELING
The most essential element of any form of geotechnical engineering design involves some form
of analysis about the driving and resisting forces that cause failure in an earthen structure. One
of the most popular and accurate means of conducting this analysis is through the use of finite
element analysis software. These programs have the ability to rapidly compute failure planes or
slip surfaces that exist within an earthen structure such as a slope cross sectional profile.
Numerical modeling allows the user to input all pertinent site parameters into the software such
as geometric and material properties. These parameters can be taken from researched values,
such as those used in this study, or through site specific field exploration. Both methods allow
for failure analysis with the respective degree of accuracy being dependent on the accuracy of
the input parameters. Numerical modeling in itself does not output results that are the complete
solution to all design elements. Therefore in agreement with Idleman, in order to evaluate
additional aspects of slope design stability modeling can be coupled with rockfall simulation
computer software (personal communication, July 17, 2014) By utilizing both analysis methods
the user is able determine an even greater insight to the overall slope design and performance.
5.1 Methodology
The validity of the analysis conducted by numerical modeling is dependent upon the failure
criterion method used. The failure criteria selected is dependent upon the structure to be
analyzed, the material that the structure is comprised of and the expected failure mode. Once a
failure criterion method(s) has been selected, software that contains the chosen methods can be
implemented. As suggested by a similar study conducted by Kulbacki (2014), for this scope of
this study, the Hoek-Brown Failure Criterion was selected. This method was developed for
bedrock materials and containing parameters that allow for variably in construction quality such
as the “Degree of Disturbance” which accounts for material disturbance such as construction
blasting (Hoek, 2002). Additionally the findings of Kulbacki showed that although several
different forms of analysis methods can be used for the stability analysis of cut slopes in West
Virginia, the General Limit Equilibrium (GLE) provides the best overall for failure analysis
method (Kulbacki, 2014). Therefore this research conducted in this report used exclusively the
GLE failure analysis method.
5.1.1 Hoek-Brown Failure Criterion
Hoek and Brown introduced their failure criterion in an attempt to provide an analysis method
for the evaluation required for the civil engineering rock removal and design of underground
excavation in hard rock (Hoek, 2002). Although the purpose of the failure criterion method was
90
developed for large scale underground tunnels and structural discontinuities in rock masses, the
method can be used for small scale blasted bedrock slopes (Hoek, 2002). The Hoek-Brown
method is based primarily upon the calculation of principal stresses at locations within the rock
and considers the discontinuities and fractures as locations where failure stresses have been
previously developed. Due to the complexity of calculating principal stresses and considerations
of fractures planes needed for Hoek-Brown, the Mohr-Coulomb failure criterion is often used for
small scale slope stability design as it offers a more conventional simplistic means of calculating
failure envelopes. For this research the Hoek-Brown Failure Criterion was chosen primarily due
to its greater accuracy potential over Mohr-Coulomb.
The generalized form of the Hoek-Brown equation is shown below as Equation 5.1. As stated
earlier the equation considers several other parameters in the calculation of the principal stresses
such as the degree of disturbance, the geologic strength index, and a reduction coefficient that is
a function of the material type.
𝜎′1 = 𝜎′3 + 𝜎𝑐𝑖 (𝑚𝑏𝜎′
3
𝜎𝑐𝑖+ 𝑠)
𝑎
Equation 5.1
Where:
𝜎′1 and 𝜎′3 = major and minor effective principal stresses at failure
𝜎′𝑐𝑖 = the uniaxial compressive strength of the intact rock material
𝑚𝑏= is a reduced value of the material constant 𝑚𝑖
𝑚𝑏 = 𝑚𝑖 exp(𝐺𝑆𝐼−100
27−14 𝐷) Equation 5.2
𝑆 = exp (𝐺𝑆𝐼−100
9 − 3𝐷)
Where:
D = Degree of disturbance.
Scalar factor that is dependent on the level of physical disturbance the rock mass has
been subjected to via blasting damage and stress relaxation. The magnitude of this
factor varies from zero to one. Assigning a value zero corresponds to in-situ rock
masses. A value of one equate to highly disturbed fractured rock masses (Hoek,
2002)
GSI = Geologic Strength Index.
A constant term of which is dependent upon the rock material type for which the
principal stress act upon. GSI selection is in regards to the geologic character of the
material and by a visual selection of the parameters relevant for the prediction of the
rock mass strength (Hoek, 2002).
a = constant value for rock material in analysis, given by the following relationship
𝑎 = 1
2+
1
6 (𝑒−
𝐺𝑆𝐼
15 − 𝑒−20
3 ) Equation 5.3
In field material observations, borehole drilling, and material testing of the material for which the
Hoek-Brown failure criterion is to be applied is essential in calculating the most accurate results.
Unfortunately, the case study sites used for this report did not contain material testing results or
other observations that allowed for specific input values to be used in the failure criterion.

91
Without specific insight for the material parameter values, the material classifications from the
borehole logs for these sites were used to attain approximate values from published literature.
Therefore, calculated Hoek-Brown principal stress values are approximated.
5.1.2 General Limit Equilibrium Analysis Method
In order to develop the traditional Factor of Safety (F.S.) values for a failure surfaces within a
modeled slope profile in SVSlope® a slope stability analysis method must be used. The General
Limit Equilibrium (GLE) or “Method of Slices” provides and accurate means of determining the
failure areas within a slope profile through the use of segmented slices within the cross section.
The analysis involves the summation of forces in two directions and the summation of moments
about a chosen point of rotation (Fredlund, 1981). In addition it is assumed that the direction or
magnitude of the forces in the summation allow for a mathematical solution. In order for this
assumption to be valid there must be a connection among inter-slice forces that identifies a
direction, each vector (Rahardjo, 1983). Most analysis methods produce circular failure
surfaces, which typically do not occur in bedrock. The GLE analysis method allows for the
determination of a non-circular slip surface, making the analysis more suitable for bedrock. The
failure surface begins and ends with a circular portion but the majority of the slip surface is
linear. It is assumed that the linear portion is a result of a geological discontinuity and therefore
represents the failure surface within that cross section (Fredlund, 1981). Equation 5.4 below
shows the general GLE equation solved for a factor of safety.
𝐹𝑚 = Σ[𝑐′𝑙+(𝑃−𝑢𝑙) tan ∅′] R
Σ𝑊𝑥 − ΣPf ±Aa Equation 5.4
Where:
𝐹𝑚 = Computed Factor of Safety
𝑐′ = Effective cohesion
𝑢 = Pore water pressure (if present)
𝑙 = Length of the failure surface at base of each slice
∅′ = Effective angle of internal friction
P = Total normal force acting upon the base of a slice
R = Radius of curvature
𝑊𝑥 = Total vertical forces resulting from a rock mass with width B and height H
𝐴 = The resultant external water
𝑎 = The perpendicular distance from the resultant external water forces to the
center of rotation
Pf = Resulting moment of failing mass, independent from slice to slice
5.1.3 Limitations of Numerical Modeling
Although the Hoek-Brown failure criterion used in conjunction with the general limit
equilibrium is a comprehensive and theoretically accurate means of calculating failure surfaces
limitations due exist when using finite element software such as SVSlope®. Failure planes are
often calculated to be very deep from the surface of the cross sectional profile. Field
observations of rock cut slopes showed that deep failures are much less common than failures
that occur within three feet of the surface of the exposed face. Therefore the deep failures
calculated using SVSlope® should be considered as the areas of where shallow discontinuities
create rockfall at the exposed face.

92
6. BENCH REMOVAL FEASIBILITY STUDY
The parametric analysis previously discussed allowed for each of the slope geometric design
parameters specified within the West Virginia Design Directive 403 to be analyzed for effects on
the sensitivity to rockfall retention. The study used a fixed number of benches and assumed that
the profile met stability requirements. The ability to study the effects of bench placement,
quantity, and associated backslope height increase for both stability and rockfall characteristics
would allow for greater knowledge and design approach for bench cut rock slopes. If stability
and rockfall behavior provide acceptable results, a reduction in the number of benches for a
given profile would allow for greater flexibility over current design methods for WVDOH
geotechnical engineers. Therefore the objective of this section is to determine through the
investigation of case study site if the number of benches in a design profile can be reduced while
meeting stability requirements and provide satisfactory rockfall retention characteristics.
6.1 Bench Reduction Ideology
Benches on bedrock cut slope are used to improve several negative attributes that are incurred
when blasted rock faces are exposed to the environment. Assuming the total cut depth is larger
than approximately 70 feet; benches are needed during construction in order to facilitate accurate
bore hole drilling that will enable desirable blasted final face attributes. Benches also allow for
reductions in erosion caused by undercutting when placed at the top of the interface between a
layer having lower slake durability and hardness than the material located above. Idleman also
claimed that benches can be considered rockfall catchment devices, reducing the number of
rockfall reaching the toe of the slope (personal communication, March 14, 2014). If benches are
used as rockfall catchment devices, they are commonly placed at fairly even spaced intervals
along the slope. In theory, even spacing allows for equal rockfall retention regardless of the
backslope of origin. However, this may not be the case depending on the rockfall material
classification, the hardness, and vegetation density of the bench(s). As to increase the ability of
the bench below each backslope to retain rockfall, the WVDOH specifies that backslope vertical
height never exceed 70 feet regardless of material hardness in order to reduce the ability of a
rockfall to gain excessive kinetic energy during its initial fall.
As shown in Section 4 benches can exhibit negative attributes to the rockfall behavior. By using
intermediate benches as catchment, infilling of the bench occurs. Infilling and sloughing creates
a surface that no longer possesses the same effective horizontal catchment width and does not
exhibit the same material hardness as when originally constructed. A bench that has a lower
effective catchment width causes increased rockfall runout distances. The negative attributes
associated to benches used as catchment are the principal reasons many states do not design their
benches as the primary means of rockfall catchment. The following sections of this research
examine the theory that was also suggested by Idleman and Kulbacki in that reducing the number
of benches on a profile minimizes their detrimental effects (personal Communication, March 14,
2014). The objective is to determine the feasibility of designing with fewer benches on sections
with large total cut depths while still meeting stability and rockfall retention requirements.
6.2 Case Study: U.S. Route 48
In Section 3.6.3 a 200 ft. section of roadway on U.S. Route 48 was chosen to provide field
rockfall data for a calibration of Hard Rock for this report. The region of this highway that was
in consideration for calibration connects the towns of Scherr and Moorefield, West Virginia.
The GPS coordinates of the site location were recorded via a GPS camera as (39.121161, -
78.90552). The site was selected due to ease of access, availably of borehole log information

93
along with other factors. Additionally personal communication with Idleman and Kulbacki
whom also conducted research at this location, allowed for this research to gain greater insight
about site specific input parameters and additional expertise during the slope stability and
rockfall modeling process (personal communication, April 30, 2014). From field observation the
calibration section of U.S. 48 contained principally WVDOH DD-403 Type 1 bedrock or Hard
Bedrock by this study. This section of U.S. 48 was also selected as a representative region for
which a case study for bench reduction could be performed. A case study on Hard Rock was
chosen as opposed to Soft Rock (WVDOH DD-403 Type 3). The following statements in
addition to field observations were used as the rationale for a bench reduction case study to be
performed on Hard Bedrock cut slopes in West Virginia
Hard rock (Type 1 Bedrock) exhibits the highest compressive strengths for all rock
material within the state of West Virginia, initiating the hypothesis that more
competent bedrock slopes can be stable with minimal intermediate slope benches.
Hard rock slopes typically producer lower quantity of rockfall than less competent,
lower slake durability, erosion prone soft rock material. Initiating the theory that hard
rock slopes could retain an acceptable percentage of rockfall with fewer benches.
Homogenous hard rock slopes do not require additional benching to reduce erosion
causing undercutting.
The particular site selected for the bench removal study in this study was constructed to 207 ft.
as-built total cut depth and was designed with 6 geotechnical benches. Idleman and Kulbacki
also investigated this site concurrently for their research purposes, and it was determined that
additional research using CRSP-3D rockfall simulation would be advantageous (personal
communication, April 30, 2014). The sandstone material at the site exhibited a blocky lithology
with many bedding planes. A minimal amount of rockfall ranging from 1-2 feet was present on
the all of the geotechnical benches. The rockfall quantity present on each bench did not impact
effective catchment width of the bench. Vegetation density on the benches was at, or near 100
percent, and the lower sections of each backslope (3-5 feet) had a vegetation density similar to
the benches. The remainder of the backslopes height (greater than 3-5 feet above each bench)
exhibited what was field estimated to be 15 percent vegetation density as well. The slopes
appeared very structurally stable and the majority of the benches were only needed in the
circumstance of a large rockfall event. Figures 6.1 and 6.2 are photos taken during site
investigation. These photos depict the entire cut slope length including the section selected for
analysis.

94
Figure 6.1 View of U.S. Route 48 Bench Removal Case Study Slope Section From
Opposite Side of Cut Section
Figure 6.2 View of U.S. Route 48 Bench Removal Case Study Slope Section From
Roadway Elevation

95
6.2.1 Field Data Collection Method
In order to model a slope profile in both SVSlope® and CRSP-3D several in-field geometric
parameters are needed. Many of these parameters are common to both programs but each has
additional parameters that are site specific. The parameters collected during the single field visit
are shown below in Table 6.1:
Table 6.1 Case Study In-Field Parameters Collected for SVSlope® and CRSP-3D
Parameter SVSlope® Requirements CRSP-3D Requirement
Slope Geometry
(Roadway to Overburden) All geometric measurements All geometric measurements
Backslopes and Benches
Material
Classification/Properties
Specific Hard Bedrock Strata
(For Material Properties)
Specific Hard Bedrock Strata
(Hardness Values)
Material Properties of other
Profile Elements Not explicitly required for analysis
Ditch and Earthen Shoulder Material
Classification/Properties
(Hardness Values, Roughness values)
Rock Strata Geometry Locations and dimensions of each
strata layer within the profile
Locations and dimensions of each
strata layer within the profile
Slope Face Condition Blasting Quality
(Under/Over Blasted) Roughness of each backslope
Rockfall N/A Location(s) and size(s)
Vegetation N/A Location(s) and Densities
While Table 6.1 above lists all field collection parameters necessary for input in the two
programs, other input values are needed in order to conduct a case study analysis. Material
properties for a site are typically gained by borehole drilling and subsequent lab testing. For this
case study, bore hole information was attained via the WVDOH Geotechnical Division but
specific material properties were not available for this site or any other locations considered to be
proximal to the case study location. In addition to the borehole log information access to the
plan cross section was provided by the WVDOH. As a means of confirming the measurements
taken in-field the plan cross sections were compared to the “as-built” measurements with
exception to the highest backslope and bench due to inaccessibility. Idleman also claimed that
the as-built measurements did not differ from the plan by more than a couple degrees on all
backslopes and benches (personal communications, June 30, 2014). Additionally, Idleman
agreed that the bench widths and backslope height measurements only slightly differed from the
plan cross sections in a few instances by a couple feet and therefore either set of geometric data
would produce similar results (personal communications, June 30, 2014). However for this
research, in order to assess the intended slope design the stability analysis performed in
SVSlope® and Rockfall analysis Performed in CRSP-3D was performed using the WVDOH
cross section plans.

96
6.2.2 Geologic Exploration Data and Material Properties
Borehole data taken from the plan cross sections needed to be transformed into two-dimensional
coordinate for input into the two programs. The information used to create the coordinates for
both programs is listed below in Table 6.2. The material types were extracted from the borehole
logs. The chart shows these respective materials increasing in depth from the top of the cut
section, the highest elevation above mean sea level (MSL), toward to toe of the cut slope, lowest
elevation above MSL.
Unable to attain site specific material properties for unconfined compressive strength (UCS) and
geological strength index (GSI) and other Hoek-Brown Failure Criterion parameters required
that values be used from previous research performed at the site. The value for the UCS shown
in Table 6.2 were used by Kulbacki (2014) were stated as the mean of each respective materials
range found in literature. The GSI value shown below was stated by Kulbacki (2014) to
represent the minimum value found in literature for blocky hard rock material. Additionally the
GSI values are intended to assume worst case bedding plane jointing material strength. Values
larger in magnitude would provide an increase in principal effective stress. Values for Hoek-
Brown mi, mb, and s for the site were established from literature findings. Prior research
performed by Kulbacki did not evaluate the in-field blasting quality and assumed a worst case
disturbance factor of 1.0 (Kulbacki, 2014).
For this research during field site investigation, blasting quality was assessed in order to develop
an estimation of the Hoek-Brown Disturbance factor. Idleman agreed that in field blasting
quality correlated to that of “good blasting” and after consulting literature was assigned a
disturbance factor of 0.7 (personal communication, June 30, 2014). Idleman claimed that by
using assumptions from previous calibration efforts, parametric analysis and general field
observations, the material unit weights shown in Table 6.2 were assumed as representative
values for hard rock material at the site location (personal communication, June 30, 2014).
All CRSP-3D hardness values were equated with previously calibrated values for the sandstone
material. A slightly higher CRSP-3D hardness coefficient was used for the limestone as it
appeared to be more structurally competent than the material which had been used for the
calibration hardness value of 0.80. The slope profile exhibited minimal roughness in the
backslopes for both the sandstone and limestone materials. A value of 0.25 was assigned to all
backslope regions. All bench surfaces, earthen shoulder and pavement surfaces were considered
to have negligible roughness and were assigned a value of 0.01, as performed previously during
calibration and parametric sensitivity analysis.

97
Table 6.2 Geometric Data and Corresponding Material Properties Used for Input
into SVSlope® and CRSP-3D
Vertical Cut
Depth from
Original
Topography (ft.)
Vertical
Height above
Toe (ft.)
Strata
Material
Type
SVSlope® Material
Input Parameters
CRSP-3D Material
Classification and
Properties
0 – 2.48 197.52 - 200.0 Soil
(Silty-Sand)
See Section 6.2.4 Soil
2.48 – 10.0 190.0 - 197.52 Sandstone
Unit Weight = 150 lb/ft3
UCS = 1984116 (psf)
GSI = 23
mb = 0.073
mi = 5
s = 1.42e-5
Hard Bedrock Hardness = 0.80
Roughness:
Backslope = 0.25 Bench = 0.01
10.0 – 63.44 136.56 - 190.0 Sandstone
Unit Weight = 150 lb/ft3
UCS = 1984116 (psf)
GSI = 23
Mb = 0.073
mi = 5
s = 1.42e-5
Hard Bedrock Hardness = 0.80
Roughness:
Backslope = 0.25
Bench = 0.01
63.44 – 76.0 124.0 - 136.56 Sandstone
Unit Weight = 150 lb/ft3
UCS = 1984116 (psf)
GSI = 23
Mb = 0.073
mi = 5
s = 1.42e-5
Hard Bedrock
Hardness = 0.80
Roughness:
Backslope = 0.25
76.0 – 165.52 34.48 - 124.0 Limestone
Unit Weight = 160 lb/ft3
UCS = 29233961 (psf)
GSI = 23
Mb = 0.058
mi = 4
s = 1.42e-5
Hard Bedrock
Hardness = 0.81
Roughness: Backslope = 0.25
Bench = 0.01
165.52 – 176.0 24.0 - 34.48 Limestone
Unit Weight = 160 lb/ft3
UCS = 29233961 (psf)
GSI = 23
Mb = 0.058
mi = 4
s = 1.42e-5
Hard Bedrock
Hardness = 0.81
Roughness:
Backslope = 0.25
176.0 – 200.0 0.0 - 24.0 Limestone
Unit Weight = 160 lb/ft3
UCS = 29233961 (psf)
GSI = 23
Mb = 0.058
mi = 4
s = 1.42e-5
Hard Bedrock
Hardness = 0.81
Roughness:
Backslope = 0.25 Bench = 0.01
Note: In SVSlope® modeling, roadway shoulder was modeled as bedrock using the same material parameters as shown above. In CRSP-3D simulation the roadway shoulder was
given a hardness of 0.45 which correlates to hard clay/soft bedrock (Andrew, 2012). The paved
roadway was given a value of 0.95. Both regions were simulated with a roughness of 0.01.

98
6.2.3 Analysis Methodology
The West Virginia Department of Highways specifies in the DD-403 that all bedrock slopes must
have a minimum factor of safety (F.S.) of 1.25 for roads considered smaller than arterials and a
F.S. of 1.5 for roads considered arterials (WVDOH, 2006). U.S. Route 48 is considered by the
WVDOH to be an arterial and therefore requires a minimum design F.S. of 1.5. Therefore when
modeling the stability of the cross-section in SVSlope®, a F.S. of 1.5 was used as the threshold
value. Unlike the F.S. value specified for rock slope stability, the WVDOH does not currently
have a specification for minimum rockfall retention performance. Therefore, as conducted in
Section 4, the ODOT specification of 90% minimum rockfall retention was used for this case
study.
Idleman also claimed the need for development of an analysis procedure in order to assess the
stability and rockfall characteristics of the plan cross section for U.S. Route 48 and for
subsequent bench removal (personal communication, July 17, 2014). This procedure is outlined
below:
1. Analyze slope profile for stability F.S. (SVSlope®)
a. If the proposed design slope profile exhibits a factor of safety greater than minimum
specification, CRSP analysis is performed
b. If the proposed slope design profile does not meet a factor of safety greater than the
minimum specification then the proposed geometry must be altered so as it meets the
minimum F.S. specification.
2. Analyze slope profile for rockfall retention (CRSP-3D)
a. If the profile is able to retain the minimum value of rockfall, slope design is adequate
for construction
b. If the profile is not able to retain the minimum value of rockfall add/alter profile as to
increase the ability of the profile to retain rockfall. Return to Step 1 to ensure the
altered profile meets stability requirements.
This analysis leaves geometric design up to the engineer and specification guidelines. The
analysis simply states the procedure which stability and rockfall retention must be conducted to
determine the overall performance of a bedrock slope profile. Idleman agreed to the procedure
developed by this study but developed his own similar procedure for the removal of benches
(personal communication, July 17, 2014). The procedure used for this study is shown below:
1. Analyze slope profile for stability F.S (SVSlope®).
a. If a profile containing “x” number of benches passes stability analysis
requirements, a new profile containing a lower number of geotechnical benches
located the discretion of the designer can be created.
b. If this new profile meets stability requirements and fewer benches are still a
desirable design theory, then reduction in the number of benches by a magnitude
of one continues. Each subsequent profile with fewer benches from the prior
profile is subjected to a stability analysis.
c. If at any time a profile is not able to pass stability requirement after all feasible
bench placements in the profile is exhausted, then the bench reduction process
ends and a profile containing the fewest number of benches and passing rockfall
requirements can be used as the final slope design.
The above methodology is simply that which is conceptually feasible. If at any time in the bench
reduction process the designer believes having fewer benches in the profile places another
element of the design at risk for other reasons not discussed above such as lithology, erosion,

99
anomalies in the bedrock or other features that of which is outside the expertise and scope of this
document, all bench reduction procedures should cease.
6.2.4 SVSlope® Stability Results for Plan Geometry
As performed by Idleman (2014) and Kulbacki (2014), in order to develop a baseline of the
stability of the case study location, the plan geometry was modeled in SVSlope® to determine
the factor of safety. The plan profile contained a total of five benches and five backslopes. Table
6.3 presents the geometry that was transformed into two dimensional coordinates to create the
surface geometry of the model in SVSlope®.
Table 6.3 Plan Geometry for SVSlope® Stability Analysis
Slope Region Material Backslope
Height (ft.)
Backslope
Angle (H:V, °)
Bench Width
(ft.)
Bench Angle
(H:V, °)
Backslope 1 / Bench 1 Sandstone 7.4 15:1 / 41.2 15 15:1 / 3.8
Backslope 2 / Bench 2 Sandstone 32.0 ½:1 / 63.4 20 15:1 / 3.8
Backslope 3 / Bench 3 Sandstone 32.6
50.0 ¼:1 / 76.0 20 15:1 / 3.8 Backslope 3 / Bench 3 Limestone 13.4
Backslope 4 / Bench 4 Limestone 51.0 ¼:1 / 76.0 19.7 15:1 / 3.8
Backslope 5 / Bench 5 Limestone 50.0 ¼:1 / 76.0 20 15:1 / 3.8
Additional Geometry - Backslope for roadway shoulder to catchment bench: 2.7 ft. height at 75.5°,
Earthen/Paved shoulder: 44 ft. length at 3.8°
Only one material interface is present in the profile and is located in backslope three. Figure 6.1
shows this interface along with the bench and backslope numbering scheme used in this research.
Although the small overburden zone located at the crest of the slope is comprised of a soil
material, it was modeled as bedrock so as during analysis failures would not occur in this zone.
Material inputs for the profile include all those necessary to satisfy the Hoek-Brown Failure
Criterion and GLE analysis method as shown in Table 6.2. Using the assumption of a
disturbance factor equal to 0.7, the factor of safety was 3.6. Therefore lesser extents of blasting
damage would produce higher FS levels than that of which is shown in Figure 6.3.

100
Figure 6.3 U.S. Route 48 Plan Geometry Slope Cross Section showing Stability Analysis
Results
6.2.5 CRSP-3D Rockfall Simulation Results for Plan Geometry
In agreement to the methodology of the CRSP-2D plan profile analysis conducted by Idleman
(2014) and following the analysis methodology outlined in Section 6.2.3 for a profiles meeting
stability requirements, rockfall modeling in CRSP-3D was performed (personal communication,
July 17, 2014). Material type, CRSP-3D hardness and roughness values from Table 6.2 were
used as inputs into the profile. The following assumptions were used during this analysis of this
profile.
Although the profile contained five benches and backslopes, only four of these
backslopes consisted of bedrock material. The uppermost backslope consisted of soil
material and was not considered as zone of rockfall initiation in this study.
Each of the four backslopes were considered locations of possible rockfall, therefore each
backslope was defined as a release zone, resulting in four iterations for each rockfall size.
Three rockfall diameters were used in the simulation. The three diameters used are
synonymous with those used during the calibration of Hard Rock material and therefore
were expected to yield the most accurate results.
1
2
3
4
5
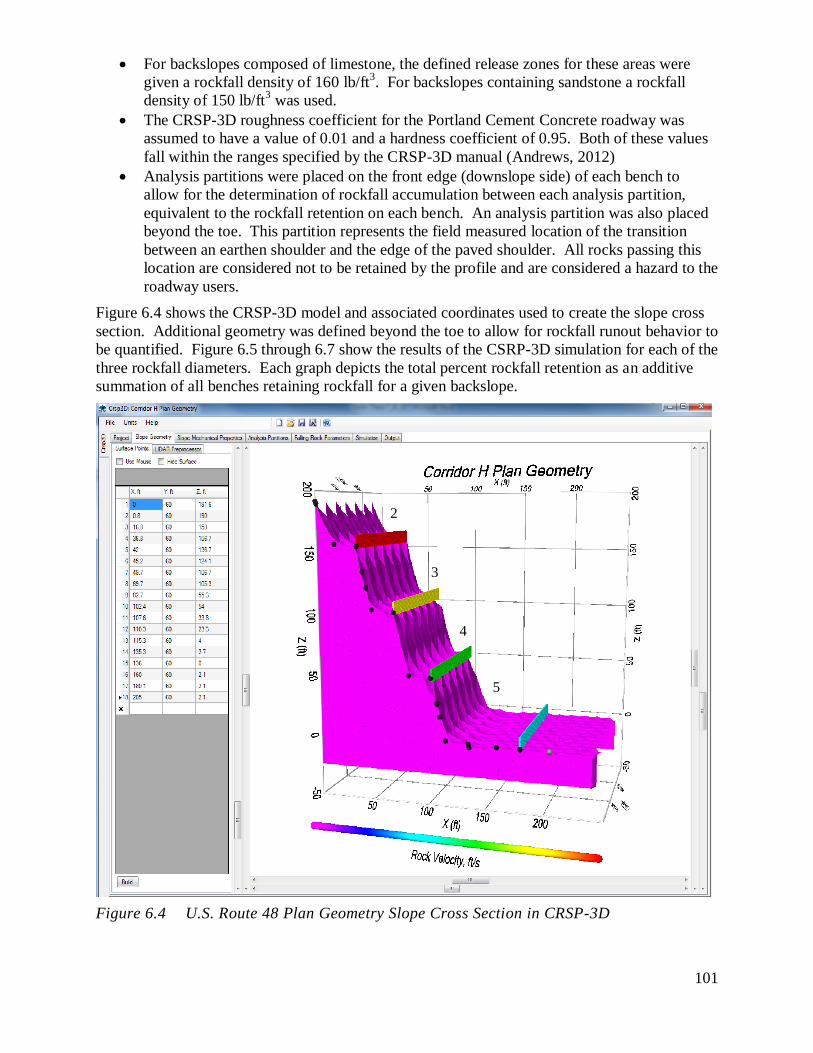
101
For backslopes composed of limestone, the defined release zones for these areas were
given a rockfall density of 160 lb/ft3. For backslopes containing sandstone a rockfall
density of 150 lb/ft3 was used.
The CRSP-3D roughness coefficient for the Portland Cement Concrete roadway was
assumed to have a value of 0.01 and a hardness coefficient of 0.95. Both of these values
fall within the ranges specified by the CRSP-3D manual (Andrews, 2012)
Analysis partitions were placed on the front edge (downslope side) of each bench to
allow for the determination of rockfall accumulation between each analysis partition,
equivalent to the rockfall retention on each bench. An analysis partition was also placed
beyond the toe. This partition represents the field measured location of the transition
between an earthen shoulder and the edge of the paved shoulder. All rocks passing this
location are considered not to be retained by the profile and are considered a hazard to the
roadway users.
Figure 6.4 shows the CRSP-3D model and associated coordinates used to create the slope cross
section. Additional geometry was defined beyond the toe to allow for rockfall runout behavior to
be quantified. Figure 6.5 through 6.7 show the results of the CSRP-3D simulation for each of the
three rockfall diameters. Each graph depicts the total percent rockfall retention as an additive
summation of all benches retaining rockfall for a given backslope.
Figure 6.4 U.S. Route 48 Plan Geometry Slope Cross Section in CRSP-3D
2
3
4
5

102
Figure 6.5 Histogram of Percent Hard Rockfall Retained with 1.5 ft. Diameter
Figure 6.6 Histogram of Percent Hard Rockfall Retained with 2.5 ft. Diameter
0
10
20
30
40
50
60
70
80
90
100
Backslope 2 Backslope 3 Backslope 4 Backslope 5
% R
ock
fall
Rete
nti
on
on
Slo
pe
Bench 5
Bench 4
Bench 3
Bench 2
0
10
20
30
40
50
60
70
80
90
100
Backslope 2 Backslope 3 Backslope 4 Backslope 5
% R
ock
fall
Rete
nti
on
on
Slo
pe
Bench 5
Bench 4
Bench 3
Bench 2

103
Figure 6.7 Histogram of Percent Hard Rockfall Retained with 3.5 ft. Diameter
For rocks retained by the above slope profile several key behavior observations can be concluded
from observation of Figures 6.5 through 6.7, these are as follows:
As the diameter of rockfall increases the ability of the profile to retain these larger rocks
decreases. The higher the release zone is in the profile, the greater the reduction in the
retention ability as rockfall diameter increases.
On average release zones higher in the profile generate more rockfall passing the toe
regardless of rockfall size.
The majority of rockfall simulated is retained by the bench located directly below its
originating release zone.
Rockfall with a diameter of 2.5 ft. and greater that was released from backslope two does
not meet 90% retention requirements. Rockfall simulated from the other three backslope
release zone meet rockfall retention requirements for all rock diameters used in this
research.
The analysis shows the WVDOH plan profile meets the rockfall retention requirements for most
of the geometric locations that have the ability to produce rockfall. However, at least two
conditions exist where rockfall retention does not meet the minimum requirements. Therefore it
is recommended that a more effective toe of slope catchment, such as an RCAD ditch should be
added to the profile in order to increase the profiles ability to retain rockfall.
6.2.6 SVSlope® Stability Results for Plan Geometry with RCAD Ditch
In order to increase the rockfall retention of the plan geometry the RCAD ditch developed in
Section 4.5 was implemented. Therefore all the existing plan geometry was kept constant except
for the removal of lower catchment bench and replacement with the RCAD ditch. With the
removal of the catchment bench an analysis on the effects of this geometric change with regards
to the global stability was performed. To perform this analysis the coordinates shown in Table
6.4 were used to develop the surface geometry of the model in SVSlope®.
0
10
20
30
40
50
60
70
80
90
100
Backslope 2 Backslope 3 Backslope 4 Backslope 5
% R
ock
fall
Rete
nti
on
on
Slo
pe
Bench 5
Bench 4
Bench 3
Bench 2

104
Table 6.4 Plan Geometry with RCAD ditch for SVSlope Stability Analysis
Slope Region Material Backslope
Height (ft.)
Backslope
Angle (H:V, °)
Bench
Width (ft.)
Bench Angle
(H:V, °)
Backslope 1 / Bench 1 Sandstone 7.4 15:1 / 41.2 15 15:1 / 3.8
Backslope 2 / Bench 2 Sandstone 32.0 ½:1 / 63.4 20 15:1 / 3.8
Backslope 3 / Bench 3 Sandstone 32.6 50.0 ¼:1 / 76.0 20 15:1 / 3.8
Backslope 3 / Bench 3 Limestone 13.4
Backslope 4 / Bench 4 Limestone 51.0 ¼:1 / 76.0 19.7 15:1 / 3.8
Slope Region Material Backslope
Height (ft.)
Ditch Angle
(H:V / °)
Width of
Inclined
Ditch (ft.)
Ditch
Bottom
Width (ft.)
RCAD Ditch Limestone 54 4:1 / 14.0° 24 1
Material inputs for this analysis were identical to those in the as-built profile an include all those
necessary to satisfy the Hoek-Brown Failure Criterion and GLE analysis method as shown in
Table 6.2. As show below in Figure 6.8, when using the same assumption for the disturbance
factor, the calculated factor of safety was 3.7. This increase in factor of safety from the
WVDOH plan cross section profile is only marginal and should not be considered a substantial
improvement in stability of the profile and certainly does not reduce the propensity of rockfall
occurring. Ultimately the simulation results show that the addition of the RCAD ditch, for this
profile, allows for stability in great excess of the minimum requirements.

105
Figure 6.8 U.S. Route 48 Plan Geometry Slope Cross Section with RCAD ditch showing
Stability Analysis Results
6.2.7 CRSP-3D Rockfall Simulation Results for Plan Geometry with RCAD Ditch
As presented in Section 6.25, rockfall released from backslope two in the profile produced
rockfall behavior that resulting in the profile not meeting the retention requirements set by this
research. Using CRSP -3D, an RCAD ditch was added to the profile as a possible means of
improving retention of rockfall released from this zone. Stability modeling was not performed
on the profile with the addition of the RCAD ditch. It was assumed that the ditch would not
produce significant degradation on the stability of the profile. This assumption was rationalized
for several reasons. The previously calculated failure plane was located in sandstone material
located much higher in the profile. The RCAD ditch is located at the toe in the more competent
limestone material. A previously calculated factor of safety was in great excess of the minimum
therefore the ditch would have to drastically reduce the factor of safety in order for it to be
reduced below the minimum acceptable value. Therefore, CRSP-3D modeling was performed on
the profile under the following additional assumptions:
2
1
3
4
RCAD
Ditch

106
All assumptions that were previously defined in Section 6.2.5 that are not in direct
conflict with those listed in this section are considered valid.
The analysis partition placed beyond the toe represents the identical field measured
location that was defined in Section 6.2.5. Due to the 25 foot RCAD ditch width, the
partition is located 37 feet from the edge of the RCAD ditch slope or 180 feet from the x-
axis origin. Therefore, the criterion for rocks passing the partition is synonymous to those
in the plan profile without the implementation of the RCAD ditch. All rocks passing this
location are considered not to be retained by the profile and are considered a hazard to the
roadway users.
The CRSP-3D roughness coefficient for the ditch and the earthen shoulder were set to a
value of 0.01. This area is intended to be traversable by vehicles and should exhibit the
smoothest possible surface as to not cause vehicular damage. A hardness value of 0.45
was selected for both the RCAD ditch and the earthen shoulder. These values are
representative of a compacted soft rock material or that of a compacted granular material
(Andrews, 2012). The traveled vehicular lane was assigned a hardness of 0.95 and a
roughness of 0.01 (Andrews, 2012).
Figure 6.9 shows the CRSP-3D model and associated coordinates used to create the slope cross
section. Additional geometry was defined beyond the toe to allow for rockfall runout behavior to
be quantified. Figure 6.10 shows a comparison of the rockfall retention characteristics results
from Section 6.2.5 to those simulated in this section. The comparison is only for the rockfall
release zone located in backslope two. The comparison of rockfall behavior for the other three
backslopes is not necessary as the plan profile allowed for sufficient retention performance. The
addition of the RCAD ditch to the profile would likely only equal or improve previously
simulated retention characteristics.

107
Figure 6.9 Plan Geometry Cross Section with RCAD Ditch in CRSP-3D
Figure 6.10 Histogram Comparing Rockfall Retention for the Plan Profile to the Plan
Profile with RCAD Ditch for Rockfall Released from Backslope 2.
The above figure illustrates the importance of toe of slope rockfall catchment. While benches
located higher in profile do provide the ability to retain a modest percentage of small diameter
rockfall released from the upper backslope, some of the rockfall makes it beyond these benches
0
10
20
30
40
50
60
70
80
90
100
Backslope 2 Backslope 2
RCAD Ditch
Backslope 2 Backslope 2
RCAD Ditch% R
ete
nti
on
on
Slo
pe/R
CA
D D
itch
RCAD Ditch
Bench 5
Bench 2
2.5 ft. Diameter 3.5 ft. Diameter
2
3
4
RCAD
Ditch

108
and must be retained at the toe of the slope. In the plan profile, the bench located above the
roadway is essentially flat (3.8 degree inclination toward the roadway), this flat surface tends to
propagate the x-component of the rockfall trajectory as the flat surface provides no resistance in
the normal direction. The RCAD ditch having a slope ratio of 4:1 (13°) provides a surface that
retards the x-component of velocity in the rockfall trajectory, thereby increasing the ability to
retain rockfall. For this specific profile the RCAD ditch retained 20.5 percent more 2.5 ft.
diameter rockfall and 27.5 percent more 3.5 ft. diameter rockfall. The addition of the RCAD
ditch to the plan geometry profile allows the profile to meet the 90 percent minimum rockfall
retention threshold for both 2.5 and 3.5 ft. rockfall released from the uppermost backslope in the
profile. Therefore all subsequent profiles for which the bench reduction was performed will be
designed with RCAD ditches at the toe of the slope.
6.2.8 Plan Profile Bench Reduction Study: Two Geotechnical Benches
Initial stability analysis showed that the plan profile with five backslopes and benches was
beyond adequate in meeting minimum stability requirements. Therefore following the
methodology outlined in Section 6.2.3 the profile was redesigned with fewer number of
geotechnical benches. The following items are the specific changes performed by this study to
the plan profile for the bench reduction process.
In the plan profile three benches were placed in the limestone bedrock material.
Limestone being one of the most competent strata types found in the state of West
Virginia along with field observations noting favorable orientation of the bedding planes,
intuition was developed to remove all three (two intermediate slope benches and the
catchment bench) benches located in this region.
A bench was placed at the interface between the limestone and sandstone as it was
assumed that this region would be one of the weakest areas in the profile. The bench was
designed with a width of 25 feet as to not increase required right of way to construct the
profile. By placing the bench at this location that backslope height above the RCAD
ditch was 128 feet. Although this backslope height in excess of the maximum backslope
height the stability was assumed to govern the design provided the RCAD ditch could
retain rockfall to the 90 % minimum value.
The bench at the interface between the sandstone and overburden was kept to the same
location and width as designed in the plan profile. Therefore this bench placement kept
conformity to the DD-403 guidelines.
All slope backslope angles were kept at identical to the plan profile as to not add another
element of variability in the stability analysis.
In order to create a design that did not require additional right of way, the edge of the
paved shoulder was placed adjacent to the edge of the RCAD ditch. The paved shoulder
extending from the edge of the RCAD ditch toward the roadway was designed for a
width of eight feet, the value that is specified for arterials in the DD-403 (WVDOH,
2006).

109
The using the above methodology, the geometry listed in Table 6.5 was transformed into two
dimensional coordinates to develop the surface geometry of the model in SVSlope®.
Table 6.5 Two Bench Geometry for SVSlope® Stability Analysis
Slope Region Material Backslope
Height (ft.)
Backslope
Angle (H:V, °)
Bench
Width (ft.)
Bench Angle
(H:V, °)
Overburden Soil -- -- 26.4 11:1 / 5.4
Backslope 1 / Bench 1 Sandstone 4.9 ¾:1 / 53 15 15:1 / 3.8
Backslope 2 / Bench 2 Sandstone 67.6 ½:1 / 63.4 25 15:1 / 3.8
Slope Region Material Backslope
Height (ft.)
Ditch Angle
(H:V / °)
Width of
Inclined
Ditch (ft.)
Ditch Bottom
Width (ft.)
RCAD Ditch Limestone 122.4 4:1 / 14.0° 24 1
6.2.7.1 SVSlope® Stability Results for Two Geotechnical Bench Profile
Figure 6.11 represents the slope stability analysis performed in SVSlope®. As performed
previously, the small overburden zone located at the crest of the slope, comprised of a soil
material, was modeled as bedrock so as during analysis failures would not occur in this zone.
The material inputs for the profile include all those necessary to satisfy the Hoek-Brown Failure
Criterion, borehole logs, and published literature. The estimated factor of safety shown was
calculated under the key assumption that the Hoek-Brown “Disturbance Factor” equated to a
value of 1.0. This value correlates to the worst possible condition of a rock mass due to poor
blasting procedures (Hoek, 2007). As expected the failure surface occurred in the weaker, less
competent sandstone material. The analysis showed a large reduction in the magnitude of the
factor of safety, but the estimated factor of safety value of 3.3 remains in large excess of the
minimum value. Additionally if a lower disturbance factor was assumed the factor of safety
would certainly have been in excess of that calculated. Therefore, from the analysis the profile
designed is considered to be stable with two geotechnical benches.

110
Figure 6.11 U.S. Route 48 Slope Cross Section with Two Geotechnical Benches and RCAD
ditch showing Stability Analysis Results
6.2.7.2 CRSP-3D Rockfall Simulation Results for Two Geotechnical Bench Profile
Using CRSP 3-D, a profile identical to two bench profile used in the stability analysis was
created. The profile contains an RCAD ditch that was developed for the parametric analysis
performed in Section 4 and is identical to the RCAD ditch design in Section 6.2.6. The RCAD
ditch is located at the toe in the more competent limestone material, where the ditch was
assumed to have negligible effect on the profiles stability. The CRSP-3D modeling performed on
the profile under the following additional assumptions:
All assumptions that were previously defined in Section 6.2.5 that are not in direct
conflict with those listed in this section are considered valid.
An analysis partition was placed at the edge of the paved shoulder and the traveled
highway lane adjacent to the slopes toe; 8 feet from the edge of the RCAD ditch. As
previously mentioned, this was done as to not infer the need of addition right of way
1
2
RCAD Ditch
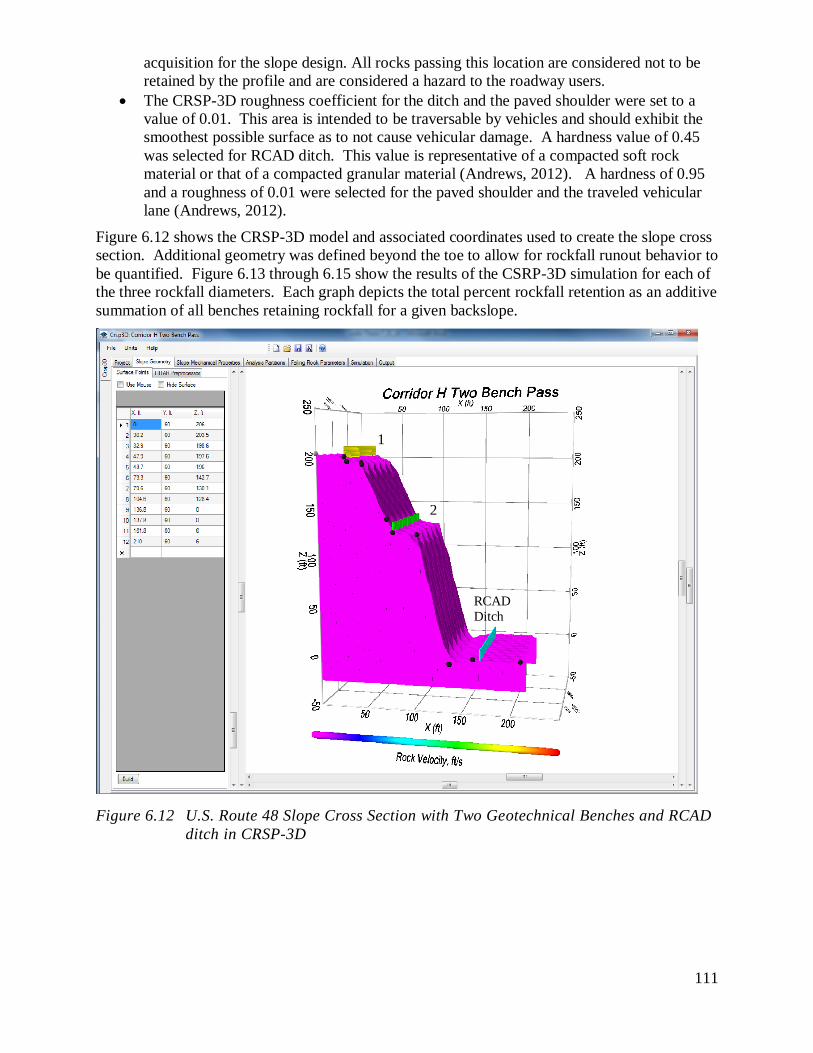
111
acquisition for the slope design. All rocks passing this location are considered not to be
retained by the profile and are considered a hazard to the roadway users.
The CRSP-3D roughness coefficient for the ditch and the paved shoulder were set to a
value of 0.01. This area is intended to be traversable by vehicles and should exhibit the
smoothest possible surface as to not cause vehicular damage. A hardness value of 0.45
was selected for RCAD ditch. This value is representative of a compacted soft rock
material or that of a compacted granular material (Andrews, 2012). A hardness of 0.95
and a roughness of 0.01 were selected for the paved shoulder and the traveled vehicular
lane (Andrews, 2012).
Figure 6.12 shows the CRSP-3D model and associated coordinates used to create the slope cross
section. Additional geometry was defined beyond the toe to allow for rockfall runout behavior to
be quantified. Figure 6.13 through 6.15 show the results of the CSRP-3D simulation for each of
the three rockfall diameters. Each graph depicts the total percent rockfall retention as an additive
summation of all benches retaining rockfall for a given backslope.
Figure 6.12 U.S. Route 48 Slope Cross Section with Two Geotechnical Benches and RCAD
ditch in CRSP-3D
1
2
RCAD
Ditch

112
Figure 6.13 Histogram of Percent 1.5 ft. Diameter Hard Rockfall Retained on a Two Bench
Profile with RCAD Ditch
Figure 6.14 Histogram of Percent 2.5 ft. Diameter Hard Rockfall Retained on a Two Bench
Profile with RCAD Ditch
0
10
20
30
40
50
60
70
80
90
100
Backslope 1 Backslope 2 Backslope 3
% R
ete
nti
on
on
Slo
pe/R
CA
D D
itch
RCAD Ditch
Bench 2
Bench 1
0
10
20
30
40
50
60
70
80
90
100
Backslope 1 Backslope 2 Backslope 3
% R
ete
nti
on
on
Slo
pe/R
CA
D D
itch
RCAD Ditch
Bench 2
Bench 1

113
Figure 6.15 Histogram of Percent 3.5 ft. Diameter Hard Rockfall Retained on a Two Bench
Profile with RCAD Ditch
Analysis of the figures above show the effects of rockfall release zones and rockfall diameter on
the ability of profile to retain rockfall. Rockfall with diameter of 1.5 feet was retained to the 90
percent minimum performance level regardless of backslope origin. The RCAD ditch at the toe
should be considered the primary attribute for the high rockfall retention characteristics for all
the backslopes. Rockfall released from backslope one with diameters of 2.5 feet and greater
were unable to be retained to the 90 percent retention level. Although the RCAD ditch did
provide additional catchment for rockfall passing bench 2, the larger rockfall often rolled beyond
the cross section of the ditch and into the roadway. In order to increase the ability of the RCAD
ditch to retain rockfall with diameters greater than 2.5 feet, modification to the RCAD ditch
geometric design must be performed. Provided that adequate right-of-way was present,
recommendations would include increasing the width to the cross section to that of 30 to 35 feet.
According to observations noted during modeling the additional five to ten feet would allow for
almost all rockfall trajectories to occur with impact inside the RCAD ditch. Rockfall impacting
at a distance of 5 feet or farther from the outward edge of the sloped RCAD ditch were
consistently retained during CRSP-3D simulation.
6.2.9 Plan Profile Bench Reduction Study: One Geotechnical Bench
The previous stability analysis for a profile designed with two geotechnical benches showed that
a profile containing a lower number of benches can exceed minimum stability requirements.
Therefore following the methodology outlined in Section 6.2.3 and discussions with Idleman the
profile was redesigned again with only the presence of one geotechnical bench (personal
communication, July 17, 2014). The following items are the specific design parameters used in
the design of the single bench profile.
The bench at the interface between the sandstone and overburden was removed. In order
to maximize stability, undercutting and erosion issues, the angle of the overburden was
layed back to an angle of 2.5 degrees.
The single bench was placed at the interface between the limestone and sandstone as it
was assumed that this region would be one of the weakest areas in the profile. This
bench was designed with a width of 35 feet. From prior modeling in CRSP-3D, the use
of a 35 foot bench was necessary due to the backslope above the bench having a height in
0
10
20
30
40
50
60
70
80
90
100
Backslope 1 Backslope 2 Backslope 3
% R
ete
nti
on
on
Slo
pe/R
CA
D D
itch
RCAD Ditch
Bench 2
Bench 1
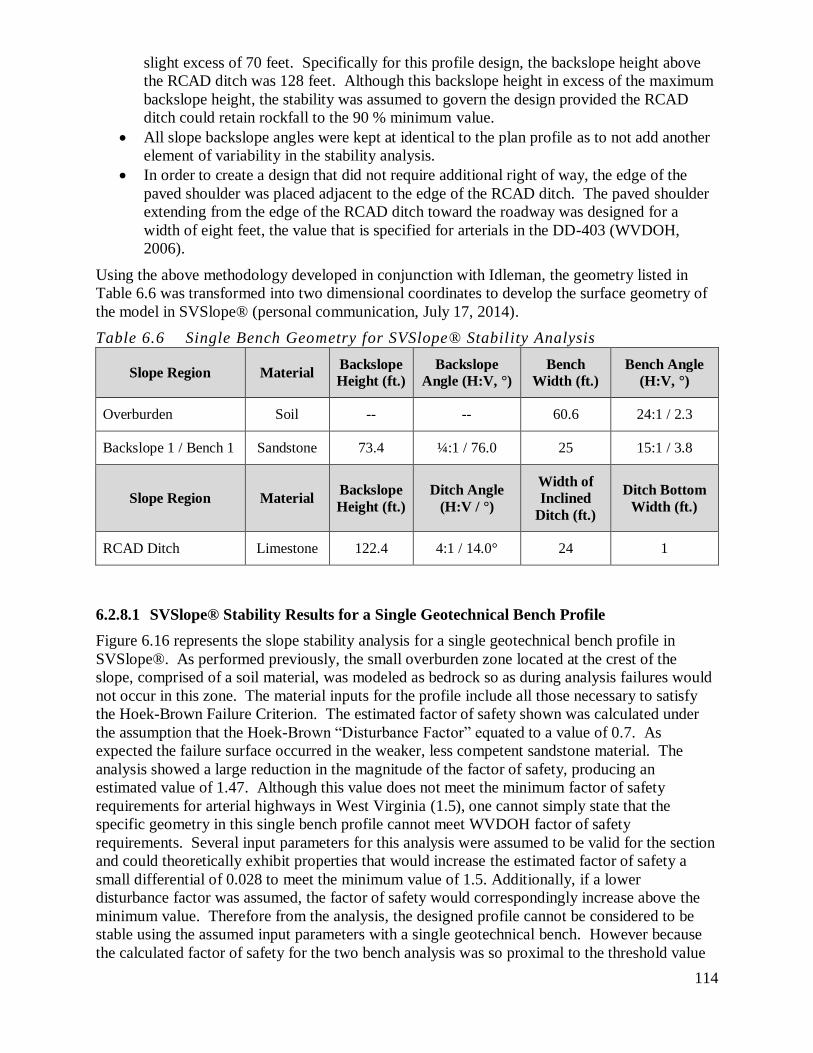
114
slight excess of 70 feet. Specifically for this profile design, the backslope height above
the RCAD ditch was 128 feet. Although this backslope height in excess of the maximum
backslope height, the stability was assumed to govern the design provided the RCAD
ditch could retain rockfall to the 90 % minimum value.
All slope backslope angles were kept at identical to the plan profile as to not add another
element of variability in the stability analysis.
In order to create a design that did not require additional right of way, the edge of the
paved shoulder was placed adjacent to the edge of the RCAD ditch. The paved shoulder
extending from the edge of the RCAD ditch toward the roadway was designed for a
width of eight feet, the value that is specified for arterials in the DD-403 (WVDOH,
2006).
Using the above methodology developed in conjunction with Idleman, the geometry listed in
Table 6.6 was transformed into two dimensional coordinates to develop the surface geometry of
the model in SVSlope® (personal communication, July 17, 2014).
Table 6.6 Single Bench Geometry for SVSlope® Stability Analysis
Slope Region Material Backslope
Height (ft.)
Backslope
Angle (H:V, °)
Bench
Width (ft.)
Bench Angle
(H:V, °)
Overburden Soil -- -- 60.6 24:1 / 2.3
Backslope 1 / Bench 1 Sandstone 73.4 ¼:1 / 76.0 25 15:1 / 3.8
Slope Region Material Backslope
Height (ft.)
Ditch Angle
(H:V / °)
Width of
Inclined
Ditch (ft.)
Ditch Bottom
Width (ft.)
RCAD Ditch Limestone 122.4 4:1 / 14.0° 24 1
6.2.8.1 SVSlope® Stability Results for a Single Geotechnical Bench Profile
Figure 6.16 represents the slope stability analysis for a single geotechnical bench profile in
SVSlope®. As performed previously, the small overburden zone located at the crest of the
slope, comprised of a soil material, was modeled as bedrock so as during analysis failures would
not occur in this zone. The material inputs for the profile include all those necessary to satisfy
the Hoek-Brown Failure Criterion. The estimated factor of safety shown was calculated under
the assumption that the Hoek-Brown “Disturbance Factor” equated to a value of 0.7. As
expected the failure surface occurred in the weaker, less competent sandstone material. The
analysis showed a large reduction in the magnitude of the factor of safety, producing an
estimated value of 1.47. Although this value does not meet the minimum factor of safety
requirements for arterial highways in West Virginia (1.5), one cannot simply state that the
specific geometry in this single bench profile cannot meet WVDOH factor of safety
requirements. Several input parameters for this analysis were assumed to be valid for the section
and could theoretically exhibit properties that would increase the estimated factor of safety a
small differential of 0.028 to meet the minimum value of 1.5. Additionally, if a lower
disturbance factor was assumed, the factor of safety would correspondingly increase above the
minimum value. Therefore from the analysis, the designed profile cannot be considered to be
stable using the assumed input parameters with a single geotechnical bench. However because
the calculated factor of safety for the two bench analysis was so proximal to the threshold value

115
and theoretically could be in excess of the value, rockfall simulation modeling was performed on
the profile.
Figure 6.16 U.S. Route 48 Slope Cross Section with One Geotechnical Bench and RCAD
ditch showing Stability Analysis Results
6.2.8.2 CRSP-3D Rockfall Simulation Results for a Single Geotechnical Bench Profile
Using CRSP 3-D, a profile identical to the single bench profile used in the stability analysis was
created. In agreement to the methodology of the CRSP-2D single bench analysis conducted by
Idleman, the profile contains an RCAD ditch that was developed for the parametric analysis and
is identical to the RCAD ditch design in previous U.S. Route 48 bench reduction case studies
(personal communication, July 17, 2014). The RCAD ditch is located at the toe in the more
competent limestone material. The CRSP-3D modeling performed on the profile under the
following additional assumptions:
All assumptions that were previously defined in Section 6.2.5 that are not in direct
conflict with those listed in this section are considered valid.
1
RCAD
Ditch

116
An analysis partition was placed at the edge of the paved shoulder and the traveled
highway lane adjacent to the slopes toe; 8 feet from the edge of the RCAD ditch. As
previously mentioned, this was done as to not infer the need of addition right of way
acquisition for the slope design. All rocks passing this location are considered not to be
retained by the profile and are considered a hazard to the roadway users.
The CRSP-3D roughness coefficient for the ditch and the paved shoulder were set to a
value of 0.01. This area is intended to be traversable by vehicles and should exhibit the
smoothest possible surface as to not cause vehicular damage. A hardness value of 0.45
was selected for RCAD ditch. This value is representative of a compacted soft rock
material or that of a compacted granular material (Andrews, 2012). A hardness of 0.95
and a roughness of 0.01 were selected for the paved shoulder and the traveled vehicular
lane (Andrews, 2012).
Figure 6.17 below shows the CRSP-3D model and associated coordinates used to create the
slope cross section. Additional geometry was defined beyond the toe to allow for rockfall runout
behavior to be quantified. Figure 6.18 shows the results of the CSRP-3D simulation for each of
the three rockfall diameters. Each graph depicts the total percent rockfall retention as an additive
summation of all benches retaining rockfall for a given backslope.
Figure 6.17 U.S. Route 48 Slope Cross Section with One Geotechnical Bench and RCAD
ditch in CRSP-3D
1
RCAD
Ditch

117
Figure 6.18 Histogram of Percent Hard Rockfall Retained for Three Rockfall Diameters on
a Single Bench Profile with RCAD Ditch
Analysis of the figure above show the effects of rockfall release zones and rockfall diameter on
the ability of profile to retain rockfall. Rockfall released from backslope 2 for all three diameters
simulated was retained to the 90 percent minimum. Rockfall released from backslope one was
not retained to the 90 percent retention level for any of the rockfall diameters. Although the
RCAD ditch did provide additional catchment for rockfall passing bench 1, rockfall often rolled
beyond the cross section of the ditch and into the roadway. In order to increase the ability of the
RCAD ditch to retain rockfall modification to the RCAD ditch geometric design must be
performed. Provided that adequate right-of-way was present, recommendations would include
increasing the width to the cross section to that of 30 to 35 feet. According to observations noted
during modeling the additional five to ten feet would allow for almost all rockfall trajectories to
occur with impact inside the RCAD ditch. Rockfall impacting at a distance of 5 feet or farther
from the edge of the sloped RCAD ditch were consistently retained during CRSP-3D simulation.
0
10
20
30
40
50
60
70
80
90
100
Backslope 1 Backslope 2 Backslope 1 Backslope 2 Backslope 1 Backslope 2% R
ete
nti
on
on
Slo
pe/R
CA
D D
itch
RCAD Ditch
Bench 1
2.5 ft. Diameter 1.5 ft. Diameter 3.5 ft. Diameter
118
7. CONCLUSIONS AND RECOMMENDATIONS
The scope of this report was to conduct research on the elements of bench cut bedrock slopes
along highways that affect all aspects of rockfall behavior. In order to fully articulate rockfall
behavior rockfall in-field observations were performed at various regions of the state and
comprehensive data collection methods were created. Simulation software was calibrated
specific to West Virginia geology and rockfall mechanical properties. All current West Virginia
Department of Highways geometric design parameters were analyzed for their influence on
rockfall behavior and catchment. Rockfall catchment design ideologies differing from those
currently practiced were assessed. A bench cut design methodology was developed in order to
provide a design process that considers both stability and rockfall catchment effectiveness for
various profile geometries. The following items describe the most significant findings for the
future design of bedrock bench cut slopes in West Virginia
The development of a field data collection method for existing bedrock bench cut slopes
that contains provisions for collecting detailed slope geometry, rock material properties
and preexisting rockfall behavior allowing for rockfall simulation and behavior analysis
to be performed on future slope designs.
Strategic sub-surface geotechnical exploration allows for increased insight for all aspects
of geotechnical engineering slope design. One or more bore hole logs per cut slope
section that are as continuous as possible for the entire depth of the cut allows for
intuition about the material properties prior to design. Characterization of site specific
material properties allows for an increased overall understanding of the materials
lithology, strength parameters, susceptibility to erosion, and possibly localized anomalies
that ultimately allow for increased ability to design profiles to exhibit the best possible
attributes.
For most strata encountered during roadway cut slopes design in West Virginia, with the
use of currently available rockfall simulation software, rock material can be effectively
classified into two distinct material groups. Material classified as Hard Rock (DD-403
Type 1 and 2 Bedrock) representing rock with high CRSP-3D hardness coefficients such
as sandstone and limestone. Material classified as Soft Rock (DD-403 Type 3 and 4
Bedrock) represents rock with low CRSP-3D hardness coefficients such as mudstone and
shale.
Using deductions from the rockfall simulation modeling conducted in this report, the
WVDOH current “Guide for Design in Cut Sections through Bedrock” (DD-403)
provides acceptable guidance for a geometric design that considers rockfall behavior. In
order to strengthen the scope and objectives of the directive the following additions
should be considered.
o If all benches located in a profile are designed with the intention of being the
primary means of rockfall catchment, bench widths should be designed to a
minimum of 25 feet in width provided the design geometric profile has shown to
provide adequate catchment in rockfall simulation. If no rockfall simulation is to
be performed on a design profile, benches should be designed to a minimum
width of 35 feet in order to ensure adequate rockfall retention occurs.
o The design of an RCAD ditch that implements principals developed by Ritchie
and used by the Oregon DOT in place of the current lower catchment bench
located 5 feet above roadway grade allows for increased rockfall retention.
o Cut sections consisting of primarily or entirely of material classified as Hard Rock
by this report should be designed with backslope angles as steep as possible

119
provided stability requirements are met. As backslope angle is increased all
rockfall behavioral attributes reduce in severity.
o Cut sections consisting of primarily or entirely of material classified as Soft Rock
by this report should be designed to a backslope angle of lowest practical
magnitude that reduces erosion, can be constructed within a reasonable
acquisition of right-of-way and meets stability requirements. The findings of this
report show that as backslope angle decreases all rockfall behavioral attributes
reduce in severity.
o By conducting both stability modeling analysis and rockfall simulation as a
iterative holistic design procedure for a bench cut bedrock slope sections, the
geometry can be optimized so as the profile can be designed with minimal
benches and catchment effectiveness exceeds the predetermined threshold.
o The minimum number of benches for a profile is dependent upon meeting
stability and rockfall retention requirements. Therefore if a profile can be
constructed with minimal to no benches while meets stability and rockfall
retention requirements, these profiles shall be considered acceptable candidates
for design.
The completion of this research has developed topics and concepts that provide
opportunities for additional research to be conducted. Investigation into these topics
would provide supplemental understanding of bench cut bedrock cut slopes in West
Virginia.
o Performing rockfall simulation analysis using the upcoming version of CRSP,
available in early 2015 in similar manner to which was conducted for this report.
A direct comparison between the input requirements, limitations, analysis
methods, and output results would allow for the determination of the best overall
rockfall simulation software for bedrock cut slope design in West Virginia.
o During rockfall simulation, the ability to simulate rockfall mass separation due to
fracture upon striking a profile surface would provide higher accuracy of rockfall
behavior particularly for material with lower unconfined compressive strength
o A rockfall modeling software that facilitates the analysis of rockfall behavior
changes due to rockfall accumulation and infilling of erodible material in all
rockfall catchment areas.
o Analysis of the change in on-slope rockfall retention for various geometric
profiles due to the attributes of additional rockfall mitigation practices such as
barriers, netting, and fences via rockfall simulation software.

120
REFERENCES
Andrew, R., Hume, H., Bartingale, R. (2012). CRSP-3D User’s Manual (FHWA-CFL/TD-12-
007). Colorado: FHWA- Central Federal Lands Highway Division
Colorado Department of Transportation. (2014). 2014 CDOT Construction Manual. CDOT.
Das, B.M. (2006). Principles of Geotechnical Engineering (7th ed.). Canada: Nelson Education
Ltd.
Fredlund, D.G., Krahn, J., Pufahl, D.E. (1981). “The Relationship between Limit Equilibrium
Slope Stability Methods.” Proceedings of the International Conference on Soil
Mechanics and Foundation Engineering, Vol. 3, 409 – 416. Stockholm, Sweden.
Hoek, E., Carranza-Torres, C., Corkum, B. (2002). Hoek-Brown Failure Criterion—2002
Edition. RocScience Inc.
Idleman, M.D. (2014). The Effects of Bench Removal on Rockfall Attenuation on Highway Cut
Slopes. (Master’s Thesis). West Virginia University, Morgantown, WV.
Jones, C.L., Higgins, J.D., Andrew, R.D. (2000). Colorado Rockfall Simulation Program
Version 4.0 (CDOT-SYMB-CGS-99-1). Colorado Department of Transportation.
Kulbacki, M. A. (2014). Slope Stability and Alternative Design Methodology for Highway Rock
Cut Slopes in West Virginia (Master’s Thesis). West Virginia University, Morgantown,
WV.
Ohio Department of Transportation. (2011). Rock Slope Design Guide. Columbus, OH.
Ohio Department of Transportation: Office of Research and Development. (2007). Landslide
Hazard Rating Matrix and Database: Volume 1 (State Job No. 134165). Akron, OH.
University of Akron.ODOT, 2001
Oregon Department of Transportation. (2001). Rockfall Catchment Area Design Guide Final
Report (FHWA-OR-RD-02-04). Washington, DC: Federal Highway Administration.
Oregon Department of Transportation: Technical Services Branch: Geo-Environmental Section.
(2012). Geotechnical Design Manual Volume 1. Salem, OR.
Pennsylvania Department of Transportation. (2007). Publication 293 Geotechnical Manual.
Harrisburg, PA: PennDOT.
Quaranta, J., Siriwardane, H., Russell, H., Kulbacki, M., Pentz, J., Idleman, M., “Research
Project 283, Design Approach for Continuous Highway Cut Slopes in West Virginia,
Final Report,” Draft 4 November 2014.
Rahardjo, H., Fredlund, D.G. (1984). “General limit equilibrium method for lateral earth force.”
Canadian Geotechnical Journal 21, 166 – 175.
Ritchie, A.M. (1963). “Evaluation of Rockfall and Its Control.” Highway Research Record (Vol.
17). Washington, DC: Highway Research Board.
SjÖberg, J. (1997) Estimating Rock Mass Strength using the Hoek-Brown Failure Criterion and
Rock Mass Classification. Internal Report: Division of Highways, (SE-971 87 Lulea,
Lulea University of Technology).
SoilVision Systems, Ltd. (2011). “Public Release of SVSlope® 3D – A New Standard in 3D
Slope Stability Analysis.” Saskatoon, Canada.
The State of Montana Department of Transportation. (2008). MDT Geotechnical Manual. MDT.

121
West Virginia Department of Transportation, Division of Highways. (2006). Design Directives:
Guide for Design in Cut Sections Through Bedrock (DD-403). Charleston, WV:
WVDOH.
Zhao, J. (2010). “Chapter 4: Properties of Rock Materials.” Rock Mechanics for Civil Engineers.
Swiss Federal Institute of Technology.

122
APPENDICIES
Appendix I: CRSP Field Calibration Workbook
CRSP Field Calibration Workbook
Site Name
City/Town Identification
Highway Identification
Mile Marker / Coordinates (if available)
Construction Plan Stations
Calibration Conducted by
Date
Step 1: Select short section(s) (between 50 to 200 feet long) of the slope to conduct the
calibration survey. Observe as many cut slopes in the area as possible, and take descriptive
notes on the surface materials that make up each cut slope. Things to take note of include:
Number of benches on slope
Overall height of slope
Percentage of the slope that is hard rock and soft rock
If there are any sections greater than 50 feet wide that are over 80% homogenous for the
entire height
Percentage of backslopes on the slope that are homogenous (only one strata or surface
type present per backslope).
Locations of significant rockfall events on slopes
At this point in the calibration investigation, there are three options to choose from based on the
available slopes: Methods A, B, and C. Use the following descriptions of the methods to decide
on the most feasible method for this study.
Field Calibration Method Descriptions
1. Method A - Preferred
a. Collect rock fall frequency and dimension data by selecting a sample rock cut slope
with at least two benches and back slopes. There must be two material types present
on the slope: the top section (or release zone) must be homogenous in one material
type, and the bottom section (majority of slope) must be homogenous in the other
material type. Rock fall data collection must be done in a manner where frequency
123
and dimension for each rock classification type is collected independently. The
process of back solving for the hardness of each classification will be iterative with a
second slope of exact opposite composition.
b. CRSP calibration: The material classified as hard rock will be given a hardness value
that is a maximum for CRSP input parameters. The hardness value of material
classified as soft rock will become the only variable calibrated. The process of
establishing the hardness value for a rock classification is discussed in the Calibration
section of the CRSP write-up.
2. Method B
a. Collect rock fall frequency and dimension data by selecting a sample rock cut slope
that possess a homogenous rock strata type classified either as hard or soft rock along
its vertical back slope heights. The sample calibration section should have a
minimum of two back slopes and benches so as the sample calibration has rock fall
accumulation on both benches from both back slopes.
b. The sample rock cut slope will be given an initial hardness value range that
corresponds to its classification and the process of establishing the calibrated
hardness value will be performed. This process is discussed in detail in the
Calibration section of the CRSP write-up.
3. Method C
a. Collect rock fall frequency and dimension data by selecting a sample rock cut slope
with a minimum of two benches and back slopes. All of the back slopes must exhibit
primarily homogenous rock classified as hard rock (high hardness value). This
sample rock slope will be selected from a region of Corridor H (U.S. Route 48).
b. The sample cut slope will be given an initial hardness value that corresponds to its
classification and the process of establishing the calibrated hardness value will be
performed. This process will be discussed later in detail.
c. After establishing the hardness value for the rock classified as hard rock this value
will be held as a constant in the determination of the hardness of material classified as
hard material. A second sample site will be used for the calibration of the hardness
value of material classified as soft rock. This site selection criterion will only be that
of a minimum of two benches and back slopes and may contain any percent
composition of material classified as hard or soft material. The most optimal
condition being that of 50 percent soft and 50 percent hard material but any
substantial amount of material classified as soft rock will suffice for the calibration.
Using the calibrated hardness value for hard rock the process of calibrating the soft
rock material will be performed. This process will be discussed in the Calibration
section of the CRSP write-up.

124
Step 2: Fill out the general information on Page 4. The total number of CRSP cells (row 6 in
Table 2) will be equal to the sum of the number of backslopes, benches, and the ditch. Look for
areas on the slope where it is obvious that large amounts of rocks have fallen from. List those in
row 5. Also select the material type that the majority of this section of rock cut is composed of,
and is thus the type of material being calibrated in this test. Additional help on material type
selection for the 3D program can be found on pages 14 and 15.
Step 3: Starting at the roadway shoulder, record the information in the table on the
following pages (starting with the Geometric Data table on Page 4). Cell numbers increase
as you advance up the slope. Reference the tables on Pages 13-15 for the estimated coefficient
values and ranges. Use the “rock count” tables to tally rocks of various diameters within each
cell (rocks must be greater than 6 inches in diameter to be counted). Remember to stay within
the designated section length when conducting the rock count.
Step 4: Calculate the total fallen rocks and average rock radius and shape for the entire
section. This can be done in post-processing after field visit if necessary.
Step 5: Repeat with other sections on the slope or neighboring slopes if possible, for
accuracy.
Step 6: Compare results with CRSP-2D and 3D results to find calibrated Normal or
Hardness Coefficient* values for this slope. Different coefficients, and thus different
procedures within the program, must be found for both the 2-Dimensional version and 3-
Dimensional version of CRSP. While the field data collection for the calibration is the same for
both versions, the testing within the programs varies greatly, depending on the calibration
procedure used. Please see the additional document: “CRSP Program Calibration Methods” to
complete this calibration process

125
Calibration Section # : ____________
1. Location of Section on slope (Station No./Mile Marker)
2. Section length parallel to roadway
3. Section height
4. Total number of benches in section
5. Estimated starting location(s) of majority of rockfall events (Bench #, height, etc.)
6. Total number of CRSP cells for this section
SELECTED SLOPE MATERIAL TYPE TO BE CALIBRATED (circle one):
HARD BEDROCK SOFT BEDROCK FIRM SOIL/TALUS OTHER: ____________
Total fallen rocks in section: ___________
Average diameter of fallen rocks in section: ______________
Average fallen rock shape(s) (Circle all that apply) :
Spherical Cylindrical Discoidal Tetrahedral Cubical
Geometric Data For Section ____ :
Cell # Description Width/Height (ft.) Angle (°) Notes
1
W
H
2
W H
3
W
H
4
W H
5
W
H
6
W H
7
W
H
8
W H
9
W
H
10
W H
*(additional geometry sheets available in back of packet)

126
METHOD A WORKSHEET 1 Section #: _________________________
*Remember that the tallest portion of the slope (i.e. the uppermost backslope) is Cell 1.
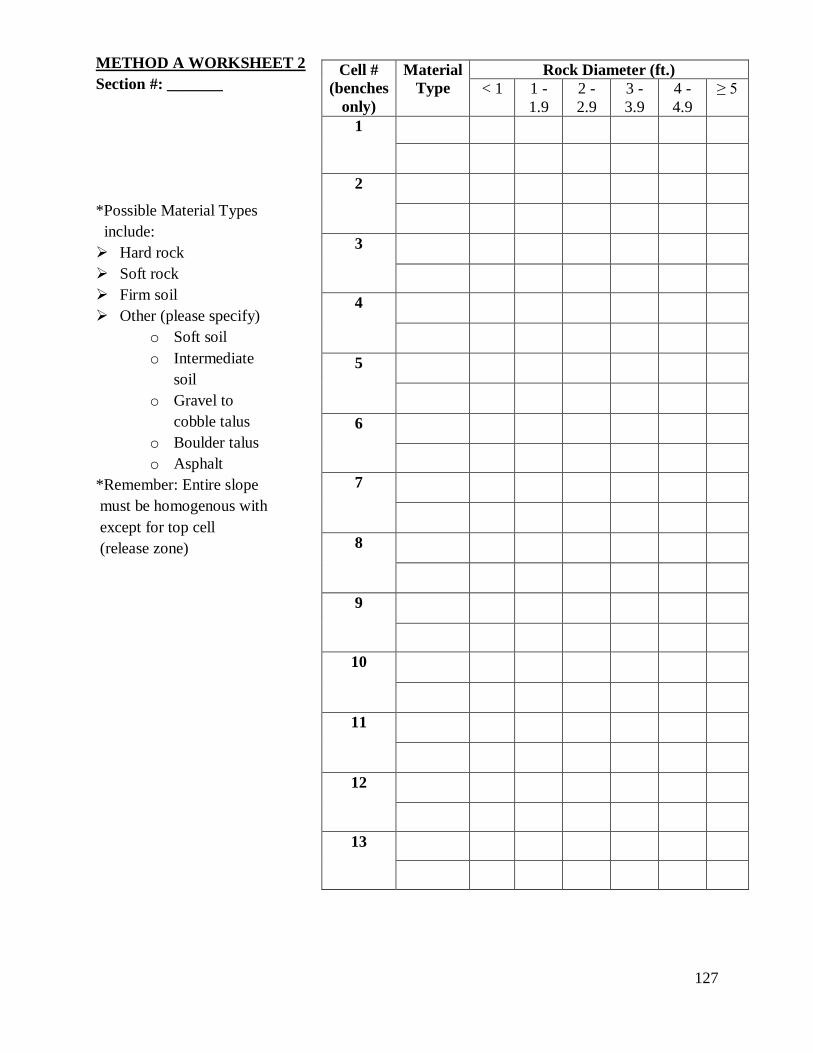
127
METHOD A WORKSHEET 2
Section #: _______
*Possible Material Types
include:
Hard rock
Soft rock
Firm soil
Other (please specify)
o Soft soil
o Intermediate
soil
o Gravel to
cobble talus
o Boulder talus
o Asphalt
*Remember: Entire slope
must be homogenous with
except for top cell
(release zone)
Cell #
(benches
only)
Material
Type
Rock Diameter (ft.)
< 1 1 -
1.9
2 -
2.9
3 -
3.9
4 -
4.9
≥ 5
1
2
3
4
5
6
7
8
9
10
11
12
13

128
METHOD B WORKSHEET Section # : ___________

129
METHOD C WORKSHEET 1 Section # : ______________

130
METHOD C WORKSHEET 2
Section # : __________
*Possible Material Types include:
Hard rock
Soft rock
Firm soil
Other (please specify)
o Soft soil
o Intermediate soil
o Gravel to cobble talus
o Boulder talus
o Asphalt
Cell #
(benches
only)
Material
Type
Rock Diameter (ft.)
< 1 1-
1.9
2-
2.9
3-
3.9
4-
4.9
≥ 5
1
2
3
4
5
6
7
8
9
10
11
12
13

131
CRSP 2-Dimensional Supplemental Data
*All of the following information was taken from CRSP Version 4.0 User’s Manual (Jones,
2000).
Table 1: General Tangential Coefficient Ranges for Different Slope Surface Types
Description of Slope Tangential Coefficient (Rt) Remarks
Smooth hard surfaces and paving 0.90 – 1.0 -Use lower Rt as density of
vegetation on the slope increases.
Most bedrock and boulder fields 0.75 – 0.95
Talus and firm soil slopes 0.65 – 0.95
Soft soil slopes 0.50 – 0.80
Table 2: General Normal Coefficient Ranges for Different Slope Surface Types
Description of Slope Normal Coefficient (Rn) Remarks
Smooth hard surfaces and paving 0.60 – 1.0 -If max. velocity is desired output, use lower values in range.
If average velocity is desired
output, use higher values in
range.
Most bedrock and boulder fields 0.15 – 0.30
Talus and firm soil slopes 0.12 – 0.20
Soft soil slopes 0.10 – 0.20
Surface roughness is a function of the size of the rock and the irregularity of the surface.
Stretch a measuring tape down the backslope (within a given cell on CRSP) and measure
the largest distance to the actual slope perpendicular to the tape. Divide this distance by
the average falling rock radius to achieve a value for S. Values should typically be less
than 2.0, with pavement being between 0.1 and 0.5 (see 3D section for additional
recommendations on surface roughness values).
Figure 1: Visual Description of the Surface Roughness input in CRSP-2D

132
CRSP 3-Dimensional Supplemental Data
*All of the following information was taken from CRSP-3D User’s Manual (Andrews, 2012).
Table 3: General Roughness Input Ranges and Descriptions for Slopes
Roughness Value Range Comments
> 3.0 Generally only used for very rough slope surfaces
where high bounce heights are predicted or have
been observed.
1.0 – 2.0 Generally for use on most slope surfaces with most falling rock geometries, even if the slope is
relatively smooth. This compensates for the non-
uniformity in most rock shapes and slope surfaces.
0.1 – 1.0 Use judiciously*. Roughness values below 2.0 may produce higher than expected values when
modeling spherical rocks.
* NOTE: CRSP was developed primarily for use with “natural” slopes in Colorado where
construction equipment has not been used to smooth rock cut surfaces. Thus, the user’s
manual’s recommendation to avoid Roughness values lower than 1.0 should be ignored when
calibrating CRSP for West Virginia rock cut slopes. This table is given just for a general guide,
and the actual process of developing accurate roughness values can be found in the 2-D section
on Page 13.
Table 4: General Hardness Coefficient Ranges for Different Slope Surface Types
Slope Material Type Material Description Hardness Range Hardness Measure
Soft Soft clay / Loose sand 0.1 – 0.3 Footprints left in soil
(*Photo 1)
Intermediate Medium clay 0.3 – 0.5 75% - 100% rock pick penetration (*Photo 2)
Firm Hard clay / Soft bedrock 0.4 – 0.7 50% - 75% rock pick
penetration (*Photo 3)
Gravel to Cobble Talus Gravel / Cobbles 0.2 – 0.6 Rock debris (talus) covers > 40% of slope. (*Photo 4)
Boulder Talus Boulder field 0.5 – 0.8 Rock debris covers > 40%
of slope. (*Photo 5)
Hard Bedrock Fresh hard rock 0.7 – 0.9 Rock is intact on slope. Concrete. (*Photo 6)
*Accompanying Photographs for visual estimation of Hardness Coefficient on the next page.

133