An Observing System Experiment with the West …ritchie/REFS/Hirschberg_etal_2001.pdfAn Observing...
15
OCTOBER 2001 2585 HIRSCHBERG ET AL. An Observing System Experiment with the West Coast Picket Fence PAUL A. HIRSCHBERG National Weather Service, Silver Spring, Maryland PERRY C. SHAFRAN National Centers for Environmental Prediction, Camp Springs, Maryland RUSSELL L. ELSBERRY AND ELIZABETH A. RITCHIE Naval Postgraduate School, Monterey, California (Manuscript received 13 July 2000, in final form 8 February 2001) ABSTRACT Analyses and forecasts from a modern data assimilation and modeling system are used to evaluate the impact of a special rawinsonde dataset of 3-h soundings at seven sites interspersed with the seven regular sites along the West Coast (to form a so-called picket fence to intercept all transiting circulations) plus special 6-h rawin- sondes over the National Weather Service Western Region. Whereas four intensive observing periods (IOPs) are available, only two representative IOPs (IOP-3 and IOP-4) are described here. The special observations collected during each 12-h cycle are analyzed with the National Centers for Environmental Prediction (NCEP) Eta Data Assimilation System in a cold start from the NCEP–National Center for Atmospheric Research reanalyses as the initial condition. Forecasts up to 48 h with and without the special picket fence observations are generated by the 32-km horizontal resolution Eta Model with 45 vertical levels. The picket fence observations had little impact in some cases with smooth environmental flow. In other cases, relatively large initial increments were introduced offshore of the picket fence observations. However, these increments usually damped as they translated downstream. During IOP-3, the increments amplified east of the Rocky Mountains after only 24 h. Even though initially small, the increments in IOP-4 grew rapidly to 500-mb height increments ;20–25 m with accompanying meridional wind increments of 5–8 m s 21 that contributed to maxima in shear vorticity. Many of the downstream amplifying circulations had associated precipitation incre- ments ;6 mm (6 h) 21 between the control and experimental forecasts. The equitable threat scores against the cooperative station set for the first 24-h forecasts during IOP-3 had higher values at the 0.50- and 0.75-in- thresholds for the picket fence dataset. However, the overall four-IOP equitable threat scores were similar. Although the classical synoptic case was not achieved during the picket fence, these model forecasts suggest that such observations around the coast of the United States would impact the downstream forecasts when added in dynamically unstable regions. An ultimate picket fence of continuous remotely observing systems should be studied further. 1. Introduction As numerical model predictions of midlatitude cir- culations have improved, the uneven quality and in- homogeneous space–time distribution of atmospheric observations is becoming the most significant factor hin- dering further improvements in the accuracy of weather forecasts (Emanuel et al. 1997). Although relatively high temporal resolution global satellite observations are increasingly being assimilated more effectively into numerical models (e.g., Caplan et al. 1997; Derber and Corresponding author address: Dr. Russell L. Elsberry, Depart- ment of Meteorology, Naval Postgraduate School, Code MR/Es, 589 Dyer Rd., Room 254, Monterey, CA 93943-5114. E-mail: [email protected] Wu 1998), they have not yet completely offset forecast degradations owing to deficient in situ data (e.g., Kelly 1997; Tomassini et al. 1998). In particular, the relative lack of adequate observational data over upstream re- gions is often cited as a primary cause of 1–4-day fore- cast failures over regions in the United States (e.g., Emanuel et al. 1997; Langland et al. 1999). To supplement satellite observations and pilot reports from commercial aircraft in observational data voids such as the world’s oceans, observations from special aircraft reconnaissance are one possible option. For ex- ample, an instrumented aircraft that can release drop- sondes may be deployed to intercept a disturbance of interest such as a tropical depression or an upper-level extratropical vorticity feature. This type of ‘‘subjective’’ targeting is based on the premise that acquiring mea-
Transcript of An Observing System Experiment with the West …ritchie/REFS/Hirschberg_etal_2001.pdfAn Observing...

OCTOBER 2001 2585H I R S C H B E R G E T A L .
An Observing System Experiment with the West Coast Picket Fence
PAUL A. HIRSCHBERG
National Weather Service, Silver Spring, Maryland
PERRY C. SHAFRAN
National Centers for Environmental Prediction, Camp Springs, Maryland
RUSSELL L. ELSBERRY AND ELIZABETH A. RITCHIE
Naval Postgraduate School, Monterey, California
(Manuscript received 13 July 2000, in final form 8 February 2001)
ABSTRACT
Analyses and forecasts from a modern data assimilation and modeling system are used to evaluate the impactof a special rawinsonde dataset of 3-h soundings at seven sites interspersed with the seven regular sites alongthe West Coast (to form a so-called picket fence to intercept all transiting circulations) plus special 6-h rawin-sondes over the National Weather Service Western Region. Whereas four intensive observing periods (IOPs)are available, only two representative IOPs (IOP-3 and IOP-4) are described here. The special observationscollected during each 12-h cycle are analyzed with the National Centers for Environmental Prediction (NCEP)Eta Data Assimilation System in a cold start from the NCEP–National Center for Atmospheric Research reanalysesas the initial condition. Forecasts up to 48 h with and without the special picket fence observations are generatedby the 32-km horizontal resolution Eta Model with 45 vertical levels.
The picket fence observations had little impact in some cases with smooth environmental flow. In other cases,relatively large initial increments were introduced offshore of the picket fence observations. However, theseincrements usually damped as they translated downstream. During IOP-3, the increments amplified east of theRocky Mountains after only 24 h. Even though initially small, the increments in IOP-4 grew rapidly to 500-mbheight increments ;20–25 m with accompanying meridional wind increments of 5–8 m s21 that contributed tomaxima in shear vorticity. Many of the downstream amplifying circulations had associated precipitation incre-ments ;6 mm (6 h)21 between the control and experimental forecasts. The equitable threat scores against thecooperative station set for the first 24-h forecasts during IOP-3 had higher values at the 0.50- and 0.75-in-thresholds for the picket fence dataset. However, the overall four-IOP equitable threat scores were similar.
Although the classical synoptic case was not achieved during the picket fence, these model forecasts suggestthat such observations around the coast of the United States would impact the downstream forecasts when addedin dynamically unstable regions. An ultimate picket fence of continuous remotely observing systems should bestudied further.
1. Introduction
As numerical model predictions of midlatitude cir-culations have improved, the uneven quality and in-homogeneous space–time distribution of atmosphericobservations is becoming the most significant factor hin-dering further improvements in the accuracy of weatherforecasts (Emanuel et al. 1997). Although relativelyhigh temporal resolution global satellite observationsare increasingly being assimilated more effectively intonumerical models (e.g., Caplan et al. 1997; Derber and
Corresponding author address: Dr. Russell L. Elsberry, Depart-ment of Meteorology, Naval Postgraduate School, Code MR/Es, 589Dyer Rd., Room 254, Monterey, CA 93943-5114.E-mail: [email protected]
Wu 1998), they have not yet completely offset forecastdegradations owing to deficient in situ data (e.g., Kelly1997; Tomassini et al. 1998). In particular, the relativelack of adequate observational data over upstream re-gions is often cited as a primary cause of 1–4-day fore-cast failures over regions in the United States (e.g.,Emanuel et al. 1997; Langland et al. 1999).
To supplement satellite observations and pilot reportsfrom commercial aircraft in observational data voidssuch as the world’s oceans, observations from specialaircraft reconnaissance are one possible option. For ex-ample, an instrumented aircraft that can release drop-sondes may be deployed to intercept a disturbance ofinterest such as a tropical depression or an upper-levelextratropical vorticity feature. This type of ‘‘subjective’’targeting is based on the premise that acquiring mea-

2586 VOLUME 129M O N T H L Y W E A T H E R R E V I E W
FIG. 1. Locations of the West Coast picket fence rawindsonde sites(NWS and AES sites, circles; special picket fence sites, triangles).
surements at the location of a disturbance will improveforecasts of the disturbance at some later time (Emanuelet al. 1997). While this approach has been demonstratedto have a positive impact on tropical cyclone track fore-casts (e.g., Burpee et al. 1996), Emanuel et al. (1997)point out that it will work only if disturbance energy isadvected in a very simple way. More sophisticated ap-proaches may be necessary when disturbance energypropagates through the atmosphere at group velocitiesrather than local advection speeds, and when steeringcurrents are changed by processes far from the distur-bance of interest.
Recent predictability studies indicate that the impactof observations strongly depends on the observation lo-cations or sampling strategy relative to so-called dy-namically sensitive portions of the flow (e.g., Palmer etal. 1998). These studies support the notion that areas inwhich the initial condition error is likely to be both largeand rapidly growing are the preferred areas to obtainsupplementary observations (Emanuel et al. 1997). Overthe last few years, several ‘‘objective’’ or ‘‘adaptive’’targeting strategies to identify these preferred areas havebeen proposed (e.g., Bishop and Toth 1999; Buizza andMontani 1999; Pu et al. 1997; Gelaro et al. 1999). Fieldtests with aircraft dropsonde missions have included theFronts and Atlantic Storm-Track Experiment (FASTEX;see Joly et al. 1999), North Pacific Experiment (Lang-land et al. 1999), California Land-falling Jets Experi-ment (Ralph et al. 1999), and the 1999 Winter StormReconnaissance Program (Szunyogh et al. 2000). Ob-servation sensitivity results by including the special datafrom the Pacific-based adaptive observation field ex-periments have demonstrated 10% reductions in 2-daynumerical model forecast error over operational controlruns for the western United States verification region(Langland et al. 1999; Szunyogh et al. 2000).
Another potential observational sampling strategy toimprove weather prediction within the interior of theUnited States is to increase the in situ observationalnetwork along or just outside the U.S. borders (Hirsch-berg et al. 1995). This so-called picket fence strategyto intercept and observe accurately features as they crossthe coast may be justified based on studies with limited-area numerical models (e.g., Vukicevic and Errico1990), which indicate that an accurate lateral boundarycondition specification can enhance the predictability ofsynoptic- and mesoscale flows in the interior of the mod-el domain. Given an appropriate horizontal spacing be-tween stations, the picket fence measurements wouldmonitor boundary fluxes of energy, mass, momentum,humidity, etc. In addition to providing continuous in-formation about the boundary flow, the picket fencewould accurately observe dynamically sensitive areasas they passed by.
To examine this picket fence concept, the spatial andtemporal resolution of the National Weather Service(NWS) and Canadian Atmospheric Environmental Ser-vice (AES) operational rawinsonde network along the
U.S. west coast was increased during the StormscaleOperational and Research Meteorology-Fronts Experi-ment Systems Test (STORM-FEST; Cunning and Wil-liams 1993). The resulting picket fence (Fig. 1) con-sisted of seven special rawinsonde stations interspersedamong the seven regular rawinsonde sites from PortHardy, British Columbia, to San Diego, California. Thepicket fence stations recorded upper-air data from 3-hsoundings during four intensive observing periods(IOPs) during February and March 1992 (see Hirsch-berg et al. 1995).
The specific objectives of the picket fence field ex-periment were to demonstrate (i) the operational fea-sibility of obtaining enhanced spatial and temporal ob-servations via a quasi-linear array of extra observingstations; (ii) that the extra observations better resolvedthe space–time characteristics of the mass, heat, mo-mentum, potential energy, kinetic energy, and moistureentering the United States from the Pacific Ocean; and(iii) that these extra observations improved downstreamforecast accuracy. The field portion of the picket fenceexperiment demonstrated the operational feasibility ofobtaining extra spatial and temporal observations viathe picket fence approach, and is detailed in Lind et al.(1992).
The potential boundary condition impact of the picketfence was investigated in Hirschberg et al. (1995) bycomparing the fluxes of mass, heat, momentum, poten-tial energy, kinetic energy, and moisture across the WestCoast resolved with various spatial and temporal com-binations of picket fence data against a control calcu-lation with only the 12-h regular upper-air sites. In par-

OCTOBER 2001 2587H I R S C H B E R G E T A L .
ticular, the flux quantities resolved by all picket fencestations at 3-h intervals were contrasted with those re-solved by only the 12-h NWS and AES stations duringtwo IOPs that represented systems that crossed the in-terior and periphery of the picket fence network, re-spectively. Hirschberg et al. (1995) demonstrated thatnew flux information is obtained from the extra picketfence spatial and temporal observations if the main syn-optic feature crossed the middle of the enhanced ob-servation network. In the best case (IOP-3) in which awave system crossed the middle of the picket fence,significantly different fluxes were calculated with thefull spatial and 3-h picket fence observations. Since thestructure and location of the main circulation featureswere better defined, and the 3-h soundings providedincreased temporal resolution, high-frequency varia-tions in the fluxes accompanying the passage of thesystem were resolved that were not detected by the 12-h NWS-only calculations. In a more extensive IOP-4case in which the main circulation center crossed thecoast near the southern periphery of the enhanced ob-servational network, little difference was detected be-tween the enhanced picket fence and NWS-only anal-yses. In such cases, Hirschberg et al. (1995) hypothesizethat NWS-only soundings adequately resolve the at-mospheric circulations and boundary fluxes across theU.S. west coast because no significant mesoscale fea-tures were present for the special stations to detect.
The set of boundary flux calculations by Hirschberget al. (1995) with and without the special picket fencedata does not necessarily demonstrate that the extrapicket fence observations have a downstream forecastimpact. Clearly, the quantitative influence of the addedobservations on analysis and forecasting downstreamneeds to be documented. In the current study, analysesand forecasts with a modern four-dimensional data as-similation and modeling system are used to compare theimpact of the special picket fence data relative to thecurrent 12-h sounding network to determine whetherbetter-resolved boundary fluxes indeed lead to signifi-cant forecast improvements.
2. Methodology
a. Eta Model
The model used in the picket fence experiments isthe National Centers for Environmental Prediction(NCEP) mesoscale Eta Model (Black 1994). The etacoordinate is a step-mountain coordinate (Mesinger1984), and the eta surfaces are nearly horizontal. Theeta vertical coordinate is also normalized with respectto mean sea level pressure rather than surface pressureas in the sigma coordinate. A vertical Lorenz grid isused with 45 levels between the 20-m surface layer andthe model top at 25 mb. The horizontal grid is an Ar-akawa E grid with 32-km spacing. The lateral boundaryconditions are supplied by the NCEP–National Center
for Atmospheric Research (NCAR) global reanalysisproject (Kalnay et al. 1996). Deep and shallow con-vection are predicted with the Betts–Miller–Janjicscheme (Betts 1986; Betts and Miller 1986; Janjic1994). Predictions of cloud water and ice are included(Zhao et al. 1997), and large-scale precipitation is pro-duced from parameterized microphysics. Predictedclouds are included in the Geophysical Fluid DynamicsLaboratory radiation scheme (Fels and Schwartzkopf1975; Lacis and Hansen 1974). The planetary boundarylayer parameterization is a Mellor and Yamada (1982)level 2.5 model. The surface layer uses similarity func-tions from a Mellor–Yamada level 2.0 model. Finally,a coupled atmosphere–land surface package predicts thesurface heat and moisture fluxes, as well as soil tem-perature and moisture, snow, and runoff. The packageuses a multilayer soil model as well as vegetation andland-use fields that are the same as those used in thereanalysis. Snow depth analyses are obtained from theNational Climatic Data Center archives.
Initial conditions at either 0000 or 1200 UTC for eachcontrol and experiment are created via a ‘‘cold start’’procedure using the four dimensional Eta Data Assim-ilation System (EDAS); (Rogers et al. 1995) with ob-servations during the previous 12-h period. The fieldsfrom the global reanalysis serve as the first initial guessfor the EDAS at model start time minus 12 h. The as-similation uses all of the data types available in a stan-dard NCEP dataset, including all of the 12-hourly raw-insonde soundings, surface land and marine data, pro-filers, aircraft reports, and satellites in the control andin addition to these, special picket fence and offtime 6-hourly NWS soundings in the experiment. These dataare analyzed using a three-dimensional variational dataassimilation (3DVAR) technique developed for theNCEP global system by Derber et al. (1991) and Derberand Parrish (1994) and extended to Eta applications byParrish et al. (1996). Four analysis–forecast cycles arethen made in which a 3-h forecast is generated thatserves as the first guess for the next analysis, whichincludes available picket fence observations and offtimeNWS soundings. Thus, each 12-h period during a picketfence IOP is treated as a separate data assimilation cycleto demonstrate the impact the special observations hadon the Eta Model forecast from those initial conditions.
b. Experimental design
Four IOPs (Table 1) were available to study the effectsof adding the special picket fence rawinsondes alongthe United States west coast. Most of the interpretationsbelow will be based on the increments, which are de-fined as the experiment forecast initiated from an anal-ysis that includes all picket fence special observationsduring the previous 12 h minus the control forecast. Analternate approach of comparing with the operationalanalyses at verifying times would not demonstrate asclearly the impact of the picket fence rawinsondes, since

2588 VOLUME 129M O N T H L Y W E A T H E R R E V I E W
TABLE 1. Experimental design for the picket fence comparison of the control experiment with the experiment using the special picketfence rawinsondes.
IOP No. of cycles First cycle Last cycle Times of picket fence files
1234
2435
1200 UTC 13 Feb0000 UTC 15 Feb0000 UTC 20 Feb1200 UTC 5 Mar
0000 UTC 14 Feb1200 UTC 16 Feb0000 UTC 21 Feb1200 UTC 7 Mar
0600 UTC 13 Feb–1800 UTC 13 Feb1800 UTC 14 Feb–2100 UTC 16 Feb0000 UTC 20 Feb–0000 UTC 21 Feb0900 UTC 5 Mar–1200 UTC 7 Mar
FIG. 2. Analyses of 500-mb height (m, solid) and sea level pressure (contours below 1008 mbshaded with 4-mb increments) during IOP-3 at (a) 0000 UTC 20 Feb, (c) 1200 UTC 20 Feb, and(e) 0000 UTC 21 Feb 1992. Increments (m, 2-m contour, solid positive, dashed negative) of 500-mb heights defined as the experiment–control forecast differences in (b), (d), and (f ) that cor-respond to the times in (a), (c), and (e), respectively.
this impact is generally smaller than the departures ofboth control and experimental forecasts from the anal-yses. Except in the STORM-FEST region over the cen-tral United States, the rawinsonde coverage is not ad-equate to resolve the specific locations and amplitudes
of the changes introduced by the picket fence obser-vations.
Each IOP consists of two to five individual cycles inwhich the 12-h EDAS is performed, and then a 48-hfree forecast ensues from either 0000 or 1200 UTC.

OCTOBER 2001 2589H I R S C H B E R G E T A L .
FIG. 3. Precipitation [mm (6 h)21 with contour increment of 4 mm (6 h)21, with shadingbeginning at 4 mm (6 h)21] during the prior 6 h predicted by the control Eta forecast at (a) 0600UTC 20 Feb, (c) 1200 UTC 20 Feb, and (e) 1800 UTC 20 Feb 1992. Increments[mm (6 h)21 with 2 mm (6 h)21 intervals, dashed negative] of precipitation defined as the ex-periment–control forecast differences in (b), (d), and (f ) corresponding to the times in (a), (c),and (e) respectively.
Only three selected cycles will be described here. Twoof the cycles are the first and third during IOP-3, whichis the IOP for which Hirschberg et al. (1995) found thelargest differences in the boundary fluxes from the ad-dition of the special picket fence observations. The thirdcycle is from IOP-4, for which the boundary fluxes weresmall, but in which the most active weather developeddownstream over the STORM-FEST domain.
3. Intensive Observing Period-3
a. First cycle (0000 UTC 20 Feb 1992)
The synoptic situation in this first cycle is illustratedin Fig. 2a. A 500-mb short-wave trough is approachingthe northern picket fence sites. However, the short wave
is predicted in the control forecast to move across theNorthwest and decrease in amplitude during the next 24h (Figs. 2c and 2e). For this case, special picket fenceobservations were only available at the initial time ofthe model run (0000 UTC 20 Feb 1992). Nevertheless,the positive 500-mb increments from the inclusion ofthese observations indicates a weaker trough off mostof the West Coast, with a slightly weaker ridge to theeast (Fig. 2b). Already by 12 h into the forecast (Fig.2d), the positive increments off the West Coast havemoved onshore with the associated trough, but the mag-nitude has decreased to only 6 m. The experimentalforecast has a weaker (6 m) ridge over Idaho after 12h. By 24 h (Fig. 2f), this negative increment has rapidlypropagated downstream, and amplified slightly, with a
2590 VOLUME 129M O N T H L Y W E A T H E R R E V I E W
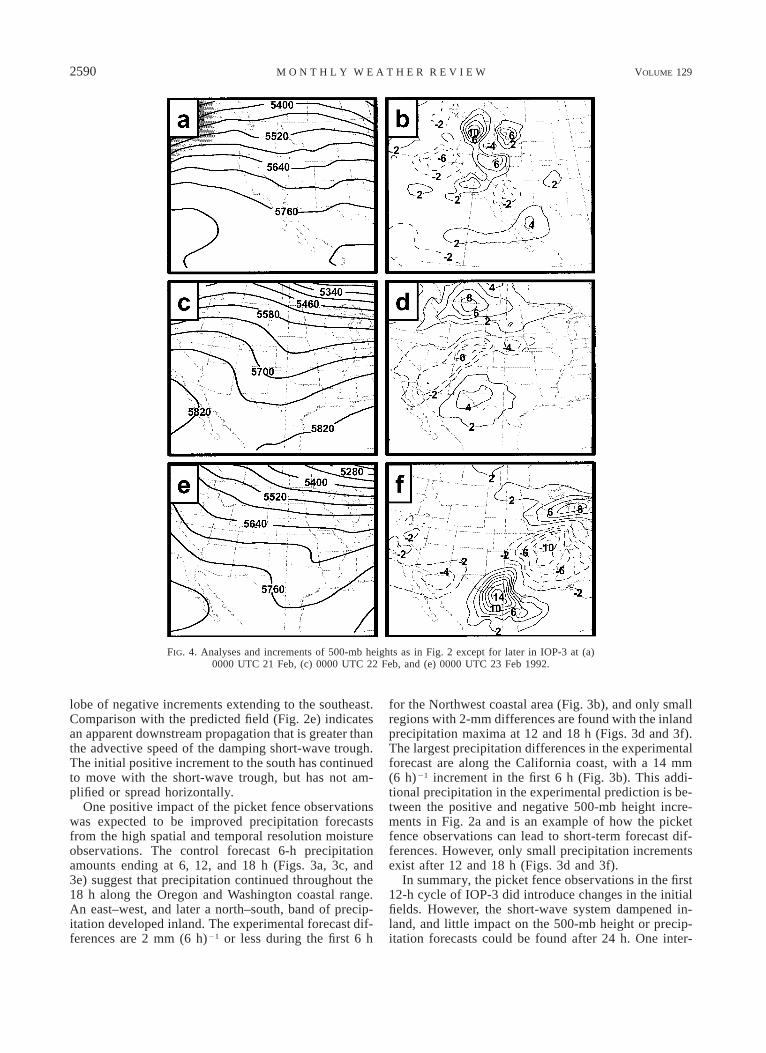
FIG. 4. Analyses and increments of 500-mb heights as in Fig. 2 except for later in IOP-3 at (a)0000 UTC 21 Feb, (c) 0000 UTC 22 Feb, and (e) 0000 UTC 23 Feb 1992.
lobe of negative increments extending to the southeast.Comparison with the predicted field (Fig. 2e) indicatesan apparent downstream propagation that is greater thanthe advective speed of the damping short-wave trough.The initial positive increment to the south has continuedto move with the short-wave trough, but has not am-plified or spread horizontally.
One positive impact of the picket fence observationswas expected to be improved precipitation forecastsfrom the high spatial and temporal resolution moistureobservations. The control forecast 6-h precipitationamounts ending at 6, 12, and 18 h (Figs. 3a, 3c, and3e) suggest that precipitation continued throughout the18 h along the Oregon and Washington coastal range.An east–west, and later a north–south, band of precip-itation developed inland. The experimental forecast dif-ferences are 2 mm (6 h)21 or less during the first 6 h
for the Northwest coastal area (Fig. 3b), and only smallregions with 2-mm differences are found with the inlandprecipitation maxima at 12 and 18 h (Figs. 3d and 3f).The largest precipitation differences in the experimentalforecast are along the California coast, with a 14 mm(6 h)21 increment in the first 6 h (Fig. 3b). This addi-tional precipitation in the experimental prediction is be-tween the positive and negative 500-mb height incre-ments in Fig. 2a and is an example of how the picketfence observations can lead to short-term forecast dif-ferences. However, only small precipitation incrementsexist after 12 and 18 h (Figs. 3d and 3f).
In summary, the picket fence observations in the first12-h cycle of IOP-3 did introduce changes in the initialfields. However, the short-wave system dampened in-land, and little impact on the 500-mb height or precip-itation forecasts could be found after 24 h. One inter-

OCTOBER 2001 2591H I R S C H B E R G E T A L .
FIG. 5. Meridional wind increments (m s21, 1 m s21 interval, dashed negative) at 500 mb definedas experiment–control during IOP-3 at (a) initial time of 0000 UTC 21 Feb and Eta forecasts after(b) 12, (c) 24, and (d) 48 h. Panel (c) corresponds to (c) and (d) in Fig. 4, and panel (d) correspondsto (e) and (f ) in Fig. 4.
pretation for this lack of amplification of the incrementsbased on the FASTEX field experiment (Langland et al.1999; Gelaro et al. 1999; Szunyogh et al. 1999) is thatthe special observations were not in the regions of dy-namic instability that lead to growth. The internal dif-fusion in the Eta Model will also contribute to a damp-ing.
b. Third cycle (0000 UTC 21 Feb 1992)
Just 24 h later, a weak 500-mb trough over the north-west United States (Fig. 4a) is predicted in the controlforecast to amplify by 24 h (Fig. 4c) and then movedownstream in the westerly flow by 48 h (Fig. 4e). Atthe initial time, the impact of the special data is forgenerally small positive height increments over theNorthwest, with small negative increments off theOregon coast and over the California–Arizona border(Fig. 4b). Those positive and negative increment areasintroduced by both the picket fence and 6-hourly NWSWestern Region rawinsondes coalesce and slightly am-plify by 24 h (Fig. 4d), with positive increments overMontana and western Texas bracketing an elongatednegative increment from Arizona to Nebraska. This tri-ple increment pattern continues at 48 h, with the north-ern positive increment propagating rapidly to the GreatLakes region. Both the central negative increment and
the southern positive increment amplify during the 24-h period, with a 114 m increment over northeast Mex-ico.
The corresponding 500-mb meridional wind com-ponent increments are illustrated in Fig. 5. Althoughlarge (27, 16 m s21) wind increments are introducedover the Northwest at the initial time (Fig. 5a), thesevery small spatial scale features do not persist for even12 h (Fig. 5b). However, some elongated 63 m s21
increments are evident at 12 h (Fig. 5b) and the positiveincrement region has become more coherent by 24 h(Fig. 5c). A remarkable amplification then occurs overTexas at 48 h (Fig. 5d) as a 27 m s21 (larger northerly)increment is ahead of a 17 m s21 increment. This im-plied shear vorticity increment in the experimental fore-cast indicates a phase shift consistent with the 500-mbheight increments in Fig. 4f.
The major band of 6-h precipitation associated withthe trough approaching the Northwest during the first 6h of the control forecast (Fig. 6a) is accompanied byprecipitation increments of up to 6 mm (Fig. 6b). In thiscase, the experimental forecast brings the rain ashore alittle earlier (later) in the northern (southern) band. Dur-ing the next 36 h (Fig. 6c), the precipitation band movesslowly inland and decays. Only small [2 mm (6 h)21]increments are found in the 6-h precipitation prior to36 h (Fig. 6d). By 48 h (Fig. 6e), a significant band of

2592 VOLUME 129M O N T H L Y W E A T H E R R E V I E W
FIG. 6. Precipitation [mm (6 h)21] in the control and the corresponding increments [mm (6 h)21
contours] as in Fig. 3 except for IOP-3 forecasts beginning at 0000 UTC 21 Feb and verifyingafter (a) 6, (c) 36, and (e) 48 h.
precipitation is developing along the Gulf of Mexicocoast in the control forecast. Although the differencesnear the Texas coast at 48 h (Fig. 6f) are only 3 mm (6h)21 it appears that the 500-mb height (Fig. 4f) andmeridional wind (Fig. 5d) increments from the picketfence observations are associated with these precipita-tion increments.
Verification of the precipitation forecasts is againstthe 24-hourly accumulations taken from the supple-mentary cooperative stations across the country, whichare then analyzed to the model grid. Equitable threatscores (ETSs) are calculated from
(C 2 E )ETS 5 ,
(F 1 O 2 C 2 E )
where C represents the number of grid points at which
both the observation and the model value fall above acertain threshold (say, 0.5 in.), O is the number of ob-served points that fall above that threshold, F is thenumber of forecast points above the threshold, and E5 FO/T, where T is the total number of points in thedomain. A higher value of an ETS represents a betterverification against observed precipitation.
The ETSs and bias scores for various precipitationthresholds during the first 24 h of all three cycles ofIOP-3 are given in Figs. 7a and 7b. No significant ETSdifferences between the control and experimental fore-casts are found for the 0.01-in, 0.10-in, and 0.25-inthreshold verifications, and both forecasts have a largeoverprediction bias for these smaller amounts. A slightETS improvement for the experimental forecast (Fig.7a) is found for the 0.50-in. threshold and a rather large

OCTOBER 2001 2593H I R S C H B E R G E T A L .
FIG. 7. (a) Equitable threat scores and (b) bias scores relative to the cooperative stations overthe United States for various 24-h precipitation accumulation (in.) thresholds for the control(solid) and experimental (dashed) Eta forecasts during three cycles of IOP-3; (c) and (d) allcycles during all IOPs. The number of observation points for each threshold is indicated alongthe top.
ETS improvement is found for the 0.75-in. threshold.This improvement is not due to an overprediction as thebias scores (Fig. 7b) are close to 1.0 for these two thresh-olds. Only 16, 3, and 1 reports exceeded the 1.0-, 1.5-,and 2.0-in. thresholds, respectively, and neither modelforecast was successful in delineating these larger pre-cipitation areas (Fig. 7a), and both forecasts have a largeunderprediction bias (Fig. 7b) for these amounts. DuringIOP-3 the only precipitation reports over the cooperativestation network were in the Northwest, so this summarywith higher ETS scores for the 0.50- and 0.75-in thresh-olds is considered to be a favorable result.
By contrast, the first 24-h ETSs for all precipitationthresholds accumulated over the thousands of reportsduring all four IOP cycles during the picket fence period(Fig. 7c) are not significantly different for the controland the experimental forecasts. A similar bias patternwith over- (under-) prediction of small (large) amountsapplies to both models for the all-IOP summary (Fig.7d). This null ETS result might be expected since theETS is calculated over the entire continental U.S. co-operative station network and precipitation is not oc-curring just in the Northwest or western U.S. areas.Additional observations from the seven picket fence ra-winsondes and 6-h NWS Western Region rawinsondeswould not be expected to affect the first 24-h forecast
precipitation amounts at the central and eastern U.S.cooperative sites. Modifying the ETS/bias precipitationsoftware to verify a positive regional impact with se-lected cooperative station reports is considered to bebeyond the scope of this research effort.
4. Intensive Observing Period-4
Although IOP-4 had the most dramatic synoptic sys-tem during the picket fence experiment (Fig. 8), theamplitude of the offshore trough was so large that mostof the energy flux crossed the West Coast south of thepicket fence sites (Hirschberg et al. 1995). At least at500 mb, the northern stations in the picket fence hadoffshore flow at 1200 UTC 7 March 1992 and only thesouthernmost sites had onshore flow that was fairlyweak as the center was over the central California coast(Fig. 8a). By 24 (Fig. 8c) and 48 h (Fig. 8e), the controlforecast slowly moved the deep trough northeastwardto the Four Corners area. Notice the development of asea level pressure trough (shading each 4 mb) east ofthe Rockies from Colorado southward into Mexico at48 h (Fig. 8e).
The effect on the initial 500-mb heights from thespecial picket fence observations during the previous12 h is a filling by 14 m (and weakening by 8 m) of

2594 VOLUME 129M O N T H L Y W E A T H E R R E V I E W
FIG. 8. Analyses and increments of 500-mb heights and sea level pressures as in Fig. 2 exceptfor IOP-4 at (a) 1200 UTC 7 Mar, (c) 1200 UTC 8 Mar, and (e) 1200 UTC 9 Mar 1992.
the trough (ridge) to the west of southern (northern)California. Over the western United States, small in-crements in magnitude and horizontal scale are foundat the initial time. By 24 h, the offshore area of positiveincrements has rotated cyclonically around the maintrough to a position in northern Mexico, and has de-creased in magnitude. The extensive area of negativeheight increments in Fig. 8d indicates the trough in theexperimental forecast has advanced northeastward fasterthan in the control forecast. By 48 h (Fig. 8f), the areaof positive increments has continued to rotate cyclon-ically into the region of the trough and has amplifiedto 118 m. More significantly, the negative anomaly hasamplified from about 24 m at the initial time (Fig. 8b)to 214 m at 24 h (Fig. 8d) and to 226 m at 48 h (Fig.8f). Especially during the 24–48-h period, the north-eastward translation of the negative anomaly is faster
than that of the trough–ridge system. Notice that thisdeeper 500-mb trough over Kansas in the experimentalforecast is in the same region as the sea level pressuretrough in Fig. 8e, which indicates that the low east ofthe Rocky Mountains is deeper.
The corresponding 500-mb meridional wind incre-ments at 24 h (Fig. 9a) and 48 h (Fig. 9b) also indicateamplification in the region of negative 500-mb heightincrements (Fig. 8). Whereas the meridional wind in-crements at 24 h were about 5–6 m s21, two areas withpositive–negative dipoles are found at 48 h near the deep500-mb trough (Fig. 8e) and in conjunction with thenegative height increment area over Kansas (Fig. 8f).Since the maximum (minimum) increments are 19 (28)m s21, these dipoles represent significant differences inthe shear of the meridional wind components betweenthe control and experimental forecasts. Whether due to

OCTOBER 2001 2595H I R S C H B E R G E T A L .
FIG. 9. Meridional wind increments as in Fig. 5 except for the (a)24- and (b) 48-h forecasts from 1200 UTC 7 Mar during IOP-4. Panel(a) corresponds to (c) and (d) in Fig. 8, and panel (b) correspondsto (e) and (f ) in Fig. 8.
phase or amplitude differences, the height and meridi-onal wind increments that have developed between 24and 48 h are noteworthy.
Although we do not have singular vectors as in theFASTEX analyses summarized by Gelaro et al. (1999),the amplification of the positive height increments andmeridional wind dipole increments between 24 and 48h is in an analogous ‘‘dynamically sensitive’’ area wheregrowth of perturbations were found in FASTEX. Al-though a similar location relative to the upper-level jetand 500-mb trough does not guarantee the area is dy-namically unstable, these conditions are consistent withforecaster experience. Because of the initial location ofthe negative height anomaly over the western UnitedStates, it is likely that the NWS Western Region ra-winsondes were more important than the West Coastpicket fence sondes in this case. It is noteworthy thatsignificant growth can occur from quite small incre-ments at the initial times, when those increments are ina dynamically unstable area (Palmer et al. 1998; Gelaroet al. 1999). Although similar or larger size incrementswere introduced by the picket fence observations inIOP-3 (Figs. 2b and 4b), these did not amplify signif-
icantly downstream, presumably because they were notin a dynamically unstable area (the short-wave troughdamped).
In the control forecast at 12 h (Fig. 10a), only onesmall area of precipitation is predicted east of the trough.Both positive and negative precipitation increments ofabout 5 mm (6 h)21 exist between the control and ex-perimental forecasts (Fig. 10b), which are mainly as-sociated with phasing differences. Both models thenpredict diminished and scattered precipitation over thewestern U.S. terrain through the next 24 h (Fig. 10c).In the 30–36-h period (Fig. 10c), a new small precip-itation area along the Oklahoma–Texas border is pre-dicted in both models, since the increment is at mostabout 1 mm (6 h)21 (Fig. 10d). However, a major out-break of precipitation occurs by 48 h (Fig. 10e) overMissouri with a trailing region of precipitation overKansas and another narrow band extending southwest-ward into central Texas. Large areas with precipitationincrements of about 4 mm (6 h)21 (Fig. 10f) have de-veloped between the two models from differences in thephases of the bands and the amplitude of the primaryprecipitation center. Whereas such differences may notbe surprising in view of the height (Fig. 8f) and merid-ional wind increments (Fig. 9b), it is interesting thatthey arise from such small initial increments over thewestern United States. The suggested interpretationfrom the FASTEX results would be that such differencesmay be a result of small initial analysis differences indynamically unstable regions.
The largest fractional change in any of the meteo-rological variables from the picket fence observationsoccurred in the relative humidity analyses. In the IOP-4 example above, the initial 500-mb relative humidityincrements (Fig. 11a) include large areas of 50%. Thesedifferences arise in part because of the sensitivity of theunivariate humidity analysis to gradients between thedata-rich land areas and the data-sparse ocean areas,where the background field is the primary contributor.Baker and Daley (2000) illustrate a supersensitivity tothe accuracy of any observations along such coastalregions, as the data assimilation system projects thisinformation offshore into the data-sparse area. In gen-eral these large humidity increments tended to damp asthey were advected with the flow. For example, the ini-tial negative increment off the southern California coastis damped as it is rotated cyclonically around the deeptrough by 12 h (Fig. 11b). Notice that the 36-h incre-ments (Fig. 11c) are less than 10% over Oklahomawhere the new area of precipitation was developing (Fig.10c). However, the maximum 500-mb relative humidityincrement at 48 h is again 50%. The close similarity inthe increment patterns of humidity and precipitation(Fig. 10f) suggest that these midtropospheric humiditydifferences arise from vertical motion and moisture ad-vection in association with the precipitation differences,rather than by downstream horizontal advection.

2596 VOLUME 129M O N T H L Y W E A T H E R R E V I E W
FIG. 10. Precipitation [mm (6 h)21] in the control and the corresponding increments [contoursof mm (6 h)21] as in Fig. 3 except for IOP-4 forecasts beginning at 1200 UTC 7 Mar and verifyingafter (a) 12, (c) 36, and (e) 48 h.
5. Summary and discussion
The picket fence experiment was a logistical successin that 3-h rawinsonde soundings were collected at sev-en sites interspersed with the regular sites along the WestCoast between Port Hardy and San Diego. Four IOPsof varying lengths in time were achieved through thecooperation of a number of agencies and volunteers (seedescription in Lind et al. 1992). These data providedhigher spatial and temporal resolution in estimates ofthe fluxes across a line paralleling the picket fence sites(Hirschberg et al. 1995). In some situations with small-er-scale features present, the boundary fluxes includingthe picket fence observations were larger than from theregular rawinsonde sites with 12-h resolution. However,it remained to be demonstrated that these differences in‘‘upstream boundary conditions’’ would have a sub-stantial effect on numerical weather predictions over the
United States, and specifically over the target STORM-FEST area with enhanced meteorological observations.
The West Coast picket fence soundings within a 12-h window (plus special 6-h rawinsondes over the NWSWestern Region) were analyzed with the Eta Data As-similation System, which is a regional 3DVAR system,and integrated to 48 h in a 32-km horizontal resolutionEta Model with 45 levels in the vertical. The primaryfields analyzed here are the experiment–control incre-ments, because the purpose is to illustrate that the ad-dition of the special picket fence observations wouldchange the Eta Model forecasts. Since none of the cir-culation systems verified over the STORM-FEST spe-cial rawinsondes, verification of the mesoscale featuresintroduced by the picket fence observations is difficultas such amplitude and phase differences are not resolvedwell by the conventional network.

OCTOBER 2001 2597H I R S C H B E R G E T A L .
FIG. 11. Relative humidity (%) increments defined as experiment–control forecast differencesduring IOP-4 at (a) initial time 1200 UTC 7 Mar and forecasts after (b) 12, (c) 36, and (d) 48 h.
In many cases (including IOPs-1 and -2 and the earlypart of IOP-4 not discussed here), the interspersed ra-winsondes had a limited effect. That is, the regular ra-winsonde sites were often adequate to resolve the hor-izontal scales of the circulation crossing the picketfence. The analyses that included the picket fence ob-servations occasionally did have sizeable increments,especially offshore and in the relative humidity fields.Offshore increments may be introduced by the hori-zontal structure functions in the objective analysis thatextend data from the land areas to the offshore areas,where the analyses may also be affected by offshoreadvection represented in the background fields from theprevious model integration. During the picket fence pe-riod, nearly all of the increments were advected down-stream with the synoptic flow and generally dampedafter at most a brief amplification. This damping wasparticularly noted with the relative humidity increments.At other times, the increments rapidly propagated down-stream at speeds greater than the translation with thesynoptic circulation. Thus, increments introduced by theWest Coast picket fence observations could at selectedtimes be found over the Midwest by 48 h.
Late in IOPs-3 and -4, the increments introduced bythe picket fence and extra NWS observations amplifiedeast of the Rocky Mountains after 36–48 h. Exampleswere illustrated in which sizeable 500-mb height incre-ments between the control and experimental forecastswere accompanied by meridional wind dipoles that have
large shear vorticity values. The distinguishing featurebetween these amplifying and damping increments isinterpreted to be that they have moved into a dynami-cally unstable area (e.g., in advance of a developingsynoptic wave during IOP-4). That is, both phase dif-ferences and amplification appear to play a role in theseamplification cases. Corresponding 6-h precipitation ac-cumulation increments were documented in these am-plifying perturbations. In general, the increments weremodulations of features in the control forecast, ratherthan being completely unresolved weather events.
The ETS for the first 24-h precipitation during IOP-3 indicated a more skillful prediction for the thresholdsof 0.50 and 0.75 in. when the picket fence observationswere included. Since the corresponding bias scores arenear 1.0 for these two thresholds, this favorable resultis not simply due to overpredicted rainfall amounts.Even though the cooperative station observations in theETS included the entire United States, this positive re-sult is consistent with the only precipitation area duringIOP-3 being in the western United States where thepicket fence observations might indeed be expected toimprove 24-h precipitation scores. When all 14 picketfence cycles were included, and precipitation was notjust limited to the western United States, no significantdifference in 24-h precipitation threat scores could bedocumented. A regional ETS verification system fol-lowing only those precipitation systems affected by the
2598 VOLUME 129M O N T H L Y W E A T H E R R E V I E W
picket fence observations would be necessary to doc-ument an overall positive regional impact.
As is often the case in a short field experiment ofopportunity, the anticipated ‘‘classical’’ case of an in-tense jet stream and/or vigorous short wave was notdocumented crossing the picket fence. Thus, the picketfence strategy of having a higher spatial and temporalresolution in such a case remains to be tested. Althougha short wave was observed during IOP-3, it was a maturewave that damped quickly as it moved inland. Whereasa strong jet was present during IOP-4, it crossed thecoast south of the picket fence.
Because of the different advective/propagation pathsdownstream from the West Coast, the objective of trac-ing a better-resolved feature directly to the STORM-FEST observing region was generally not achieved.Based on this limited sample, it may be difficult to an-ticipate a downstream area of impact without an adjointsensitivity or ensemble transform technique that haverecently been used in FASTEX and other targeted ob-servation experiments (Langland et al. 1999). Such tech-niques are not available for the picket fence period.
A limitation of this assimilation is that each 12-hcycle was a ‘‘cold start’’ using the 12-h previous controlforecast from the NCEP–NCAR reanalysis as back-ground field and only the regular and special observa-tions during that 12-h period. That is, a regional modelupdate strategy of analysis–forecast–analysis was notused, because the desire was that the separate contri-bution from each 12-h cycle could be evaluated. A con-tinuing regional model update cycle throughout the IOPwould have propagated the accumulated effects of thepicket fence observations farther downstream. However,it would have been more difficult to trace which 12-hcycle contributed to an improvement, as a specificdownstream target may be impacted from multiple raypaths originating at different times.
An obvious conclusion is that a larger picket fencethat includes more stations to the south and north isneeded to capture subtropical jet events over the BajaPeninsula and trough passages over western Canada.The ultimate application of the picket fence strategywould be a permanent set of ground-based profiling in-struments around the U.S. coasts and borders that wouldobserve continuously, or on an ‘‘as needed’’ basis, thewinds, temperature, humidity, etc. When synoptic con-ditions are relatively quiescent, NWS-only soundingsmay be adequate for analyzing the atmospheric condi-tions and defining the boundary fluxes across the westcoast of the United States. It may be scientifically sound,besides being more cost effective, to make special oradaptive rawinsonde observations only on an intermit-tent as needed basis. For instance, portions of a futurepicket fence could be activated for flexible time periodsbased on some reasonable assessment of the timing andlocation of the West Coast passage of significant, dy-namically sensitive portions of the flow that may triggersignificant weather over the United States.
Acknowledgments. This research has been sponsoredby the National Science Foundation. Special thanks goto the volunteer observers who collected these obser-vations. Drs. Geoff DiMego and Eric Rogers of NCEP/EMC provided support and guidance in carrying outthese comparisons. Mrs. Penny Jones skillfully preparedthe manuscript.
REFERENCES
Baker, N. L., and R. Daley, 2000: Observation and background sen-sitivity in the adaptive observation-targeting problem. Quart. J.Roy. Meteor. Soc., 126, 1431–1454.
Betts, A. K., 1986: A new convective adjustment scheme. Part I:Observational and theoretical basis. Quart. J. Roy. Meteor. Soc.,112, 1306–1335.
——, and M. T. Miller, 1986: A new convective adjustment scheme.Part II: Single tests using GATE wave, BOMEX, and Arctic air-mass data. Quart. J. Roy. Meteor. Soc., 112, 693–709.
Bishop, C., and Z. Toth, 1999: Ensemble transformation and adaptiveobservations. J. Atmos. Sci., 56, 1748–1765.
Black, T. L., 1994: The new NMC mesoscale Eta Model: Descriptionand forecast examples. Wea. Forecasting, 9, 265–278.
Buizza, R., and A. Montani, 1999: Targeted observations using sin-gular vectors. J. Atmos. Sci., 56, 2965–2985.
Burpee, R. W., J. L. Franklin, S. J. Lord, R. E. Tuleya, and S. D.Aberson, 1996: The impact of omega dropwindsondes on op-erational hurricane track forecast models. Bull. Amer. Meteor.Soc., 77, 925–933.
Caplan, P., J. Derber, W. Gemmill, S. Y. Hong, H.-L. Pan, and D.Parrish, 1997: Changes to the 1995 NCEP operational medium-range forecast model analysis/forecast system. Wea. Forecast-ing, 12, 581–594.
Cunning, J. B., and S. F. Williams, 1993: U.S. Weather ResearchProgram STORM-FEST operations summary and data inventory.U.S. Weather Research Program Office, 389 pp.
Derber, J. C., D. F. Parrish, W.-S. Wu, Z. Pu, and S. R. H. Rizvi,1994: Improvements to the operational SSI global analysis sys-tem. Preprints, 10th Conf. on Numerical Weather Prediction,Portland, OR, Amer. Meteor. Soc., 149–150.
——, and W.-S. Wu, 1998: The use of TOVS cloud-cleared radiancesin the NCEP SSI analysis system. Mon. Wea. Rev., 126, 2287–2299.
——, D. F. Parrish, and S. J. Lord, 1991: The new global operationalanalysis system at the National Meteorological Center. Wea.Forecasting, 6, 538–547.
Emanuel, K., and Coauthors, 1997: Observations in aid of weatherprediction for North America: Report of Prospectus Develop-ment Team Seven. Bull. Amer. Meteor. Soc., 78, 2859–2868.
Fels, S. B., and M. D. Schwartzkopf, 1975: The simplified exchangeapproximation: A new method for radiative transfer calculations.J. Atmos. Sci., 32, 1475–1488.
Gelaro, R., R. Langland, G. D. Rohaly, and T. E. Rosmond, 1999:An assessment of the singular vector approach to targeted ob-servation using the FASTEX data set. Quart. J. Roy. Meteor.Soc., 125, 3299–3328.
Hirschberg, P. A., R. J. Lind, S. J. Bolduc, and R. L. Elsberry, 1995:The West Coast picket fence experiment during STORM-FEST.Bull. Amer. Meteor. Soc., 76, 1741–1757.
Janjic, Z. I., 1994: The step-mountain eta coordinate model: Furtherdevelopments of the convection, viscous sublayer, and turbu-lence closure schemes. Mon. Wea. Rev., 122, 927–945.
Joly, A., and Coauthors, 1999: Overview of the field phase of theFronts and Atlantic Storm-Track Experiment (FASTEX) project.Quart. J. Roy. Meteor. Soc., 125, 3131–3163.
Kalnay, E., and Coauthors, 1996: The NCEP/NCAR 40-Year Re-analysis Project. Bull. Amer. Meteor. Soc., 77, 437–471.

OCTOBER 2001 2599H I R S C H B E R G E T A L .
Kelly, G., 1997: Influence of observations on the operational ECMWFsystem. WMO Bull., 46, 336–341.
Lacis, A. A., and J. E. Hansen, 1974: A parameterization of theabsorption of solar radiation in the earth’s atmosphere. J. Atmos.Sci., 31, 118–131.
Langland, R. H., and Coauthors, 1999: The North Pacific Experiment(NORPEX-98): Targeted observations for improved NorthAmerican weather forecasts. Bull. Amer. Meteor. Soc., 80, 1363–1384.
Lind, R. J., P. A. Hirschberg, D. W. Titley, and R. L. Elsberry, 1992:West Coast picket fence feasibility study during STORM-FEST.I. Field program summary. Naval Postgraduate School Tech.Rep. NPS-MR-92-003, 140 pp.
Mellor, G. L., and T. Yamada, 1982: Development of a turbulenceclosure model for geophysical fluid problems. Rev. Geophys.Space Phys., 20, 851–875.
Mesinger, F., 1984: A blocking technique for representation of moun-tains in atmospheric models. Riv. Meteor. Aeronaut., 44, 195–202.
Palmer, T. N., R. Gelaro, J. Barkmeijer, and R. Buizza, 1998: Singularvectors, metrics, and adaptive observations. J. Atmos. Sci., 55,633–653.
Parrish, D., J. Purser, E. Rogers, and Y. Lin, 1996: The regional 3D-variational analysis for the Eta Model. Preprints, 11th Conf. onNumerical Weather Prediction, Norfolk, VA, Amer. Meteor.Soc., 454–455.
Pu, Z.-X., E. Kalnay, J. Sela, and I. Szunyogh, 1997: Sensitivity of
forecast error to initial conditions with a quasi-inverse linearmethod. Mon. Wea. Rev., 125, 2479–2503.
Ralph, F. M., and Coauthors, 1999: The California Land-Falling JetsExperiment (CALJET). Objectives and design of a coastal at-mosphere ocean observing system deployed during a strong ElNino. Preprints, Third Symp. on Integrated Observing Systems,Dallas, TX, Amer. Meteor. Soc., 78–81.
Rogers, E., D. G. Deaven, and G. J. DiMego, 1995: The RegionalAnalysis System for the operational Eta Model: Original 80-kmconfiguration, recent changes, and future plans. Wea. Forecast-ing, 10, 810–825.
Szunyogh, I., Z. Toth, K. A. Emanuel, C. H. Bishop, C. Snyder, R.E. Morss, J. Wollen, and T. Marchok, 1999: Ensemble-base tar-geting experiments during FASTEX: The impact of dropsondedata from the Learjet. Quart. J. Roy. Meteor. Soc., 125, 3189–3218.
——, ——, R. E. Morss, S. J. Majumdar, B. J. Etherton, and C.Bishop, 2000: The effect of targeted dropsonde observationsduring the 1999 Winter Storm Reconnaissance Program. Mon.Wea. Rev., 128, 3520–3537.
Tomassini, M., G. Kelly, and R. Saunders, 1998: Use and impact ofsatellite atmospheric motion winds on ECMWF analyses andforecasts. Mon. Wea. Rev., 127, 971–986.
Vukicevic, T., and R. M. Errico, 1990: The influence of artificial andphysical factors upon predictability estimates using a complexlimited-area model. Mon. Wea. Rev., 118, 1460–1482.
Zhao, Q., T. L. Black, and M. E. Baldwin, 1997: Implementation ofthe cloud prediction scheme in the Eta Model at NCEP. Wea.Forecasting, 12, 697–712.