An Observation of the Caesarean Section Rate at a Teaching ...
88
1 An Observation of the Caesarean Section Rate at a Teaching Hospital in Johannesburg Student: Dr Rizwana Ayob Student Number: 0201459J Supervisor: Dr K A Frank November 2014
Transcript of An Observation of the Caesarean Section Rate at a Teaching ...

1
An Observation of the Caesarean Section
Rate at a Teaching Hospital in Johannesburg
Student:
Dr Rizwana Ayob
Student Number:
0201459J
Supervisor:
Dr K A Frank
November 2014

2

3
Acknowledgments
I would like to express my deep gratitude to Dr K A Frank, my supervisor, for her patient
guidance, enthusiastic encouragement and useful critiques of this research work.
I would also like to express great appreciation to Dr E Bera for his valuable and constructive
suggestions during the planning and development of this research work.
My grateful thanks are extended to Prof E J Buchmann for his assistance with the data
analysis and for his professional guidance and support. His willingness to give his time so
generously has been very much appreciated.

4
Dedication
I dedicate this research report to my fellow clinicians. Public service is more
than doing a job efficiently and honestly. It is a complete dedication to people
and to the nation. May we dedicate our careers to ensuring safe childbirth and
motherhood.
5
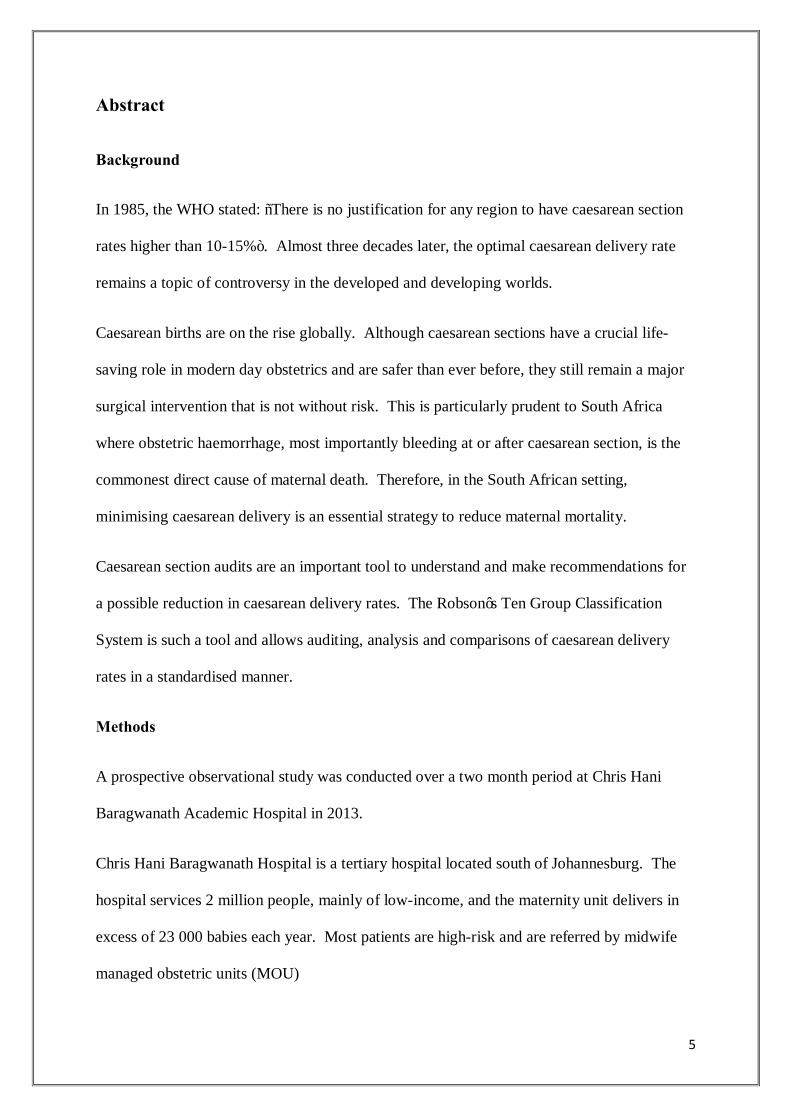
Abstract
Background
In 1985, the WHO stated: “There is no justification for any region to have caesarean section
rates higher than 10-15%”. Almost three decades later, the optimal caesarean delivery rate
remains a topic of controversy in the developed and developing worlds.
Caesarean births are on the rise globally. Although caesarean sections have a crucial life-
saving role in modern day obstetrics and are safer than ever before, they still remain a major
surgical intervention that is not without risk. This is particularly prudent to South Africa
where obstetric haemorrhage, most importantly bleeding at or after caesarean section, is the
commonest direct cause of maternal death. Therefore, in the South African setting,
minimising caesarean delivery is an essential strategy to reduce maternal mortality.
Caesarean section audits are an important tool to understand and make recommendations for
a possible reduction in caesarean delivery rates. The Robson’s Ten Group Classification
System is such a tool and allows auditing, analysis and comparisons of caesarean delivery
rates in a standardised manner.
Methods
A prospective observational study was conducted over a two month period at Chris Hani
Baragwanath Academic Hospital in 2013.
Chris Hani Baragwanath Hospital is a tertiary hospital located south of Johannesburg. The
hospital services 2 million people, mainly of low-income, and the maternity unit delivers in
excess of 23 000 babies each year. Most patients are high-risk and are referred by midwife
managed obstetric units (MOU)

6
Demographic, obstetric and delivery outcome data of women who delivered by caesarean
section during this period were collected and captured onto a data sheet. Each delivery was
also categorised according to the Robson’s Ten Group Classification System. The data was
entered onto an excel spread sheet and analysed using the STATA statistical program.
Results
There were 3898 deliveries during the two month period, of which 1534 were caesarean
sections resulting in a caesarean delivery rate of 39.4%.
The majority of patients underwent emergency caesarean sections after the onset of
spontaneous labour (60.9%). Fetal distress, previous caesarean section and dystocia were the
commonest indications for caesarean section in order of frequency.
In terms of the Robson’s Ten Group Classification System, the high caesarean section rate in
our institution is attributed to the women with previous caesarean deliveries at term (group 5)
and nulliparous patients in spontaneous labour at ≥ 37 weeks (group 1). Groups 3 and 10 are
also responsible for a significant amount of caesarean sections performed in this population.
The near-miss ratio was 24.7 cases per 1000 deliveries. The rate of comorbid disease
amongst patients that experienced near-miss was 84.6% and most (61.5%) patients required a
preterm delivery due to comorbid disease. Hypertension was the most commonly occurring
comorbidity (69.2%). Only 23.1% of near-miss was due to caesarean section. In most cases,
morbidity was due to the indication for caesarean delivery rather than to the operation itself.
The results demonstrate that pre-eclampsia and postpartum haemorrhage are the most
important initiating factors of near-miss occurring in 76.9% of patients.

7
Conclusion
Defining an optimal caesarean delivery rate in our setting may not be realistic, as CHBAH is
a tertiary, referral centre, with a wide range in the health status of patients. The World Health
Organisations recommendations of 15% for caesarean delivery rates globally may need to be
adapted to take into account the patient profile and morbidity in South Africa. Ensuring
equal access to good quality, medically appropriate obstetric care should be our primary
concern.

8
Table of Contents
Declaration 2
Acknowledgments 3
Dedication 4
Abstract 5
Table of Contents 8
List of Tables 9
List of Abbreviations 10
Definition of Medical Terms 11
Introduction 12
1. Literature Review 13
1.1 Caesarean Section: A Historic Perspective
1.2 The Optimal Caesarean Section Rate
1.3 Caesarean Section Trends
1.4 Rising Rates of Caesarean Sections…Reasons
1.5 Indications for Caesarean Section
1.6 Why is the Caesarean Section Rate Important
1.7 Classification of Caesarean Sections
1.8 Strategies for Decreasing Caesarean Delivery Rates
1.9 A South African Perspective
13
14
15
17
20
21
31
36
40
2. Problem Statement 43
3. Aims and Objectives 44
4. Methods 45
5. Results 48
6. Discussion 63
7. Limitations of the study 74
8. Strengths of the study 76
9. Conclusion 76
10. References 78
11. Appendix 83

9
List of Tables
No. Title of Table Page No.
1 Age range in years 48
2 Frequency distribution of parity before delivery of patients who had
caesarean sections at CHBAH
49
3 Gestational age, at time of delivery, in weeks 49
4 Classification of categories of the pregnancies 50
5 Previous obstetric history 51
6 Total number of comorbidities 51
7 Labour and delivery data resulting in caesarean section 52
8 Indications for caesarean section 53
9 The distribution of caesarean deliveries across the Robson’s ten groups 55
10 Indications for caesarean section in Robson’s groups 1 -4 56
11 Indications for caesarean section in patients with one previous caesarean
section
58
12 Indications for caesarean section in group 10 60
13 Near-miss 61

10
List of Abbreviations
APH Antepartum Haemorrhage
BBA Born Before Arrival
CHBAH Chris Hani Baragwanath Academic Hospital
CPD Cephalopelvic Disproportion
CTG Cardiotocograph
ECV External Cephalic Version
EFM Electronic Fetal Monitoring
GDP Gross Domestic Product
HCA High Care Area
HIV Human Immunodeficiency Virus
ICU Intensive Care Unit
IUGR Intrauterine Growth Restriction
LNMP Last Normal Menstrual Period
MOU Midwife Obstetric Unit
NCCEMD National Committee for the Confidential Enquiries into Maternal Deaths
NICE National Institute for Health and Clinical Excellence
NICU Neonatal Intensive Care Unit
PPH Postpartum Haemorrhage
SAMM Severe Acute Maternal Morbidity
TGCS Ten Group Classification System
VBAC Vaginal Birth After Caesarean
WHO World Health Organisation
WHOGS World Health Organisation Global Survey on Maternal and Perinatal Health

11
Definition of Medical terms1, 2
Medical Term Definition
Anaemia Haemoglobin < 11.0g/dL
Dystocia Abnormal progression of labour
Grand Multiparity Five or more pregnancies reaching gestational viability
Macrosomia Birth weight ≥ 4500g
Multiparous A woman who has given birth to at least one child at or
beyond viability
Nulliparous A woman who has never completed a pregnancy beyond
20 weeks.
Postpartum Haemorrhage Blood loss ≥ 500ml at vaginal delivery or ≥ 1000ml at
caesarean delivery
Post dates Pregnancy with gestational age ≥ 41 weeks
Preterm labour Labour before 37 weeks
Primigravid A woman in her first pregnancy
Near-miss or Severe Acute
Maternal Morbidity
Severe life-threatening obstetric complication necessitating
urgent medical intervention in order to prevent death of the
mother

12
Introduction
Birth may be a natural process but sometimes even low-risk pregnancies can give rise to
complications and a caesarean delivery may be required for optimum outcomes.
There is no dispute that caesarean sections are imperative in obstetrics but it is of concern that
they may be done unnecessarily. This is of concern, especially in a low and middle-income
country like South Africa, where haemorrhage at or during caesarean section is the most
important cause of direct maternal death.
The trends in caesarean section rates and the reasons for the increase in caesarean delivery
will be explored in this study as well as the potential benefits and risks associated with
caesarean birth.
13
1. Literature Review
1.1 Caesarean Section: A Historic Perspective
Caesarean section may be defined as the “surgical termination of pregnancy or delivery by
operative opening of the uterus.” 3
The origin of the term “caesarean section” was believed to be from the birth of well-known
Roman dictator, Julius Caesar. This speculation is false. More correctly, the term is derived
from the Latin word “caedere” which means “to cut”.4, 5
Caesarean sections have been practiced for ages with the very first documented evidence of
caesarean delivery as early as 1795 BCE. Originally caesarean delivery was a universally
post-mortem procedure which had its origins in social and religious requirements that mother
and infants are buried separately.4
The Law of the Kings or “Lex Regia” which forbid the burial of a pregnant woman until the
child was removed from her womb. Therefore, in the ancient times, the objective of
caesarean section was a cultural rather than a medical event and was undertaken as part of the
burial procedure.4, 5
Caesarean sections came to have medical implications upon realisation that the shorter the
interval between maternal death and caesarean delivery, the better the chance for infant
survival. Therefore the original medical objective for post-mortem caesarean section was
delivery of a living child upon death of its mother.
During the Renaissance the concept of caesarean section shifted from a cultural to a medical
procedure, with an emerging awareness of maternal and fetal safety. However until the 18th
century, the mortality rate from caesarean sections was nearly 100%. The mortality rate then
gradually declined as advances were made in the fields of anaesthesia, antiseptic and

14
antibiotic measures, blood transfusion policies and surgical technique which refined the
procedure of caesarean section. By the early 1900’s, maternal mortality from caesarean
section had decreased to around 3 -4%.4, 5
Caesarean sections continued to evolve during the 20th century and beyond with the objective
shifting towards saving the lives of mothers and infants. The associated morbidity and
mortality also decreased dramatically. Today an operation which began due to cultural and
religious reasons and then later as a vain attempt to rescue a fetus is now not only undertaken
for the health and safety of mother and infant, but also takes into consideration the mothers
desires, preferences and rights of the child.4, 5
1.2 The Optimal Caesarean Section Rate
In 1985, the World Health Organisation (WHO) stated: “There is no justification for any
region to have caesarean section rates higher than 10-15%”.6
Almost 3 decades later, the optimal caesarean section rate remains a topic of controversy in
the developed and developing worlds. There is no consensus about the ideal rate. In theory,
it is possible to calculate the caesarean section rate associated with minimal maternal and
foetal risk. In practice however, this may be difficult to quantify.
To avoid maternal morbidity and mortality, studies carried out by the WHO and others
recommend a minimum necessary caesarean section rate of between 1-5%.6, 7 However, rates
as high as 10% result in an improvement in neonatal outcomes.7-9 It is for these reasons that
the WHO has suggested an upper limit of 15% for caesarean section rates globally.6
These figures are theoretical estimates and were based on caesarean section rates in countries
with the lowest maternal and neonatal mortalities which were approximately 10%. As these
estimates were not validated with data from developing countries, the WHO suggested an

15
upper limit of 15% for caesarean section rates worldwide, taking into account poorer
countries with higher risk populations that may necessitate higher caesarean delivery rates.10
Many studies support the WHO recommendation. Research demonstrates an inverse
association between caesarean section rates and maternal and neonatal morbidity and
mortality in low income countries, but also proves that caesarean section rates above a certain
limit do not confer any additional benefit but may rather cause harm.11
The 15% suggested by the World Health Organisation in 1985 may be less valid today
considering the changes in population dynamics. An “optimal” caesarean section rate may
not exist but rather “appropriate” rates for different populations. The appropriate rate should
be defined through an outcome-based approach for individual countries and should be a rate
that is associated with minimal adverse outcomes for mother and fetus.7 The appropriate rate
should also take into account various factors regarding the population concerned for example,
general health, nutritional status and social security. Higher caesarean section rates may be
more appropriate in impoverished countries, where a large proportion of the population have
poor general health resulting in a greater proportion of high-risk pregnancies, which
ultimately necessitates more caesarean sections.12
1.3 Caesarean section trends
Caesarean section rates are on the rise globally.13 According to the World Health Report
Background Paper, 18.5 million caesarean sections were performed worldwide in 2008, of
which 6.20 million were “medically unnecessary”.7 Unnecessarily high rates of caesarean
sections are not confined to the developed world. Developing countries have also
demonstrated significant increases.

16
Although very unevenly distributed, the global caesarean section rate reached 25.7% in 2010
and the trend is steeply increasing.14 The rates vary across different birth settings and are
generally higher in developed countries. This steeply increasing trend reflects an increase in
the primary caesarean rate together with a decline in the vaginal birth after caesarean section
(VBAC) rate. Repeat caesarean section rates are as high as 91% in some settings.8, 14
The caesarean section rate in Africa is 3.5%, which is the lowest average rate worldwide.
This ranges from 15.4% in South Africa to 0.4% in Chad. Latin America and the Caribbean
have the highest rates of caesarean section with an average caesarean birth rate of 29.2%.
The average caesarean section rate in Asia is 15.9%, with a range between 40.5% in China to
just 1% in Nepal and Cambodia. In Europe the average rate of caesarean delivery is 19%,
with the highest rate in Italy (36%) and the lowest in Moldova (6.2%).8, 14
The pattern of caesarean section follows the worldwide trend of unequal distribution of
healthcare, with poor access in low income countries versus adequate to even excessive
intervention in higher income countries.8 Access to this life-saving obstetric surgery which is
necessary to achieve low levels of maternal mortality varies substantially between and within
countries and across different socio-economic groups. In many developed countries
caesarean section rates are on the rise and attention is being focused on strategies to reduce
the rate, whereas in the developing world lack of availability and access to essential maternal
health services is an important factor contributing to the high maternal and perinatal mortality
rates. These inequalities within countries are often masked by national caesarean section
rates.15

17
1.4 Rising Rates of Caesarean Sections...Reasons.
Numerous studies have been conducted to determine the causes of the dramatic increase in
the number of caesarean sections being performed. Various reasons have been cited which
may be grouped into medical, socio-economic and physician-related factors.12
1.4.1 Socio-economic factors
a. Patient characteristics and demographic changes
A study conducted in Washington demonstrated that changes in population demographics
like maternal age and parity may have accounted for an 18% increase in caesarean section
rates16, 17 Caesarean section increases with age and is shown to be 20% higher in nulliparous
patients. The pattern of childbearing is shifting towards a greater proportion of elderly
primigravid patients who may be more likely to require a caesarean section. Furthermore,
women are not only delaying their first pregnancies but also limiting the number of
pregnancies they have. These factors can account for some of the increases noted in
caesarean deliveries.18
b. Patient preferences
Many women prefer caesarean delivery due to the belief that caesarean section is safer for the
baby. At the same time, the increase in women’s dissatisfaction with long labours as well as
growing awareness about the possible adverse impact of vaginal delivery on
urogynaecological and sexual function may reduce the threshold for caesarean section.19
Also the care women want in labour may have changed from the common “demedicalisation”
of childbirth in the 1980s to the increased desire for the most sophisticated medical
technology in the twenty-first century.19-21
18
An article entitled “Too Posh to Push” appeared in tabloids in the United Kingdom many
years ago, explaining the high caesarean section rate there to be due to: tocophobia (fear of
labour & delivery), convenience, control & preservation of the pelvic floor. As more women
enter the workforce, more control is being exerted in daily living and so an elective caesarean
section with a specific date and time may be more acceptable to the woman concerned.21
c. Media Articles in leading journals support caesarean section on demand i.e.) offering
women without medical indications the right to choose the mode of delivery. The Changing
Childbirth Report also conveys women’s right to be involved in decisions regarding mode of
delivery. This may put further upward pressure on the already increasing caesarean section
rate.21-23
1.4.2 Medical reasons
In the last 50 years, there has been an increasing medicalization of birth with a huge increase
in the use of technologies to augment, accelerate, regulate & monitor labour. As highlighted
previously, the enhanced safety of caesarean sections was associated with an increased usage
of the procedure. Concurrent with increased safety & better maternal outcomes was an
increasing expectation regarding fetal outcomes. With techniques for fetal monitoring
advancing as well as the survival of very small infants, the fetus became the focus for
improving obstetric care.
Three specific indications for caesarean section namely, fetal distress, dystocia and previous
caesarean section account for most caesarean deliveries worldwide.
The use of electronic foetal monitoring which has a high false positive rate has been
implicated as a reason for the increase in caesarean birth.19, 23 Randomized control trials
have been conducted comparing deliveries that have been monitored electronically with those

19
not monitored. Continuous fetal monitoring (CFM) during labour was associated with an
increased incidence of caesarean section without improving neonatal outcomes.16, 22
Dystocia may be defined as abnormal progression of labour. In terms of primary caesarean
delivery, dystocia is the single most important contributor to the increase in caesarean
births.14 Caesarean section may also be replacing operative vaginal delivery, for example
high forceps delivery, in patients with abnormal labour progression.16, 22
Elective caesarean section in patients with a previous caesarean delivery has been a major
contributor to the increase in caesarean section rate. The traditional belief “once a caesarean,
always a caesarean” is still practiced by many.16 In 2001, 91% of women with a previous
caesarean section underwent repeat caesarean section. Risk of uterine rupture in subsequent
pregnancies and concerns over medical malpractice issues are suggested to be responsible for
the low Vaginal Birth After Caesarean Section (VBAC) rates.
There has also been a significant increase in the use of caesarean section for breech
presentation following studies like the Term Breech Trial.24 However, as breech presentation
is uncommon, accounting for only 3-4% of all births, the overall contribution of caesarean
section for breech presentation to the overall increase in caesarean section rate is minor. Also
the increasing use of caesarean section as the delivery method of choice for breech
presentation has resulted in difficulties for health care providers to acquire the skills for
vaginal breech delivery.16, 22
1.4.3 Physician-related factors
Physician-related factors are important determinants of the caesarean section rate. These are
factors resulting in physicians' preferences for caesarean section namely: fear of litigation;
lower risk-taking and practice of “defensive medicine”. The threat of malpractice is an

20
important factor responsible for increasing caesarean birth rates. Defensive obstetrics is
being practiced to avoid suboptimal outcomes and the subsequent risk of medico-legal action.
Financial incentives and convenience may also make physicians more likely to perform
caesarean sections enabling them to schedule elective procedures resulting in more effective
time management and less “after hours” deliveries. Lack of skills for various procedures
which may promote vaginal delivery like external cephalic version in the case of breech
presentation, or assisted vaginal delivery may also promote high caesarean rates. The casual
attitude of many physicians toward caesarean delivery with a false perception of safety and
limited awareness of the possible harm also contributes to the increase in caesarean birth.19, 22
1.5 Indications for caesarean section
The clinical indications for caesarean section are important tools to determine why the rates
of caesarean birth have changed. It is important to identify between an increasing incidence
of a particular indication for caesarean section as opposed to an increase in the use of
caesarean section as the intervention of choice for that indication.
Leitch et al compared the indications for caesarean section at the Glasgow Royal Maternity
Hospital, a large teaching hospital, in the years 1962 and 1992. Although they demonstrated
a significant increase in the caesarean section rate for all indications, the main indications for
caesarean section were similar between the years, namely: failure to progress and fetal
distress. However the largest increases were noted in the indications: previous caesarean
section and malpresentation. The study concluded that the rise in caesarean delivery is due to
a general lowering of the threshold for carrying out caesarean sections rather than changes in
the management of labour.25

21
The “Breakthrough Series” on caesarean section, which was organised in Norway, analysed
approximately 3000 caesarean births. The most common indications for caesarean sections
in this study were: fetal distress, prolonged labour, previous caesarean section, breech
presentation and elective caesarean section by patient request.26
In South Africa, research conducted at private institutions, which cater to patients from
middle to high socio-economic groups, demonstrates that 74.5% of caesarean sections are
elective. Indications for elective caesareans sections are previous caesarean section, doctor’s
choice and patient’s choice. The latter two indications represent new, non-classic indications.
In contrast, at a state owned, tertiary teaching hospital in Durban, South Africa, fetal distress
and CPD are the most common indications for caesarean section. This is followed by
hypertension-related complications like eclampsia and intrauterine growth restriction.27-29
A systematic review of caesarean sections conducted between 1970 -2000 in sub-Saharan
Africa indicated that 75% of caesarean sections were done for maternal rather than foetal
indications. The 6 main indications for caesarean section were: protracted labour, antepartum
haemorrhage due to placenta praevia and placental abruption, previous caesarean section,
hypertensive disorders particularly eclampsia and malpresentation.30
The observed rise in caesarean delivery rates seems to be due to both an expansion of medical
indications for caesarean section and liberalization of the threshold for these indications.31
1.6 Why is the Caesarean Section Rate Important?
Caesarean sections have a crucial life-saving role in modern day obstetrics and are safer than
ever before. However, it remains a major surgical intervention that is not without risk. In
many parts of the world, maternal and neonatal morbidity and mortality resulting from

22
caesarean sections remain a serious problem. Similarly, failure to perform a timely caesarean
section may also carry a significant risk.
1.6.1 Implications of caesarean sections on maternal health:
a. Maternal Advantages
The most important long-term benefit of caesarean sections is potential protection of the
pelvic floor. Fear of perineal trauma is often cited as the reason for maternal requests for
caesarean section.
Vaginal delivery may be associated with an episiotomy or perineal tear which, if inadequately
repaired, may cause dyspareunia. Other complications of episiotomies include haemorrhage
and infection as well as the possibility of extension into the anal sphincter. Trauma to the
pelvic floor, urethral and anal sphincters may subsequently result in pelvic organ prolapse,
urinary and anal incontinence.20, 32
Elective caesarean section may prevent the above complications by avoiding the need for
episiotomies, as well as the possibility of prolonged labour and instrumental delivery.33
A systematic review of 79 studies demonstrated that caesarean section was associated with
reduced incidence of urinary incontinence and perineal pain three months postpartum when
compared with vaginal delivery. Other studies also demonstrate an immediate protective
effect but report that these effects dissipate by three months, suggesting that postpartum
urinary incontinence is transient in nature.34
The evidence for the protective effects of caesarean section on pelvic floor function is
incomplete. Many of the studies conducted are compromised by small numbers, lack of long-
term follow-up and failure to consider the impact of other risk factors for pelvic floor
dysfunction such as connective tissue disorders, lifestyle and family history. A population-

23
based survey conducted in Australia showed that pelvic floor disorders are associated with
ageing, pregnancy and instrumental delivery, and that caesarean section is not associated with
a reduction in pelvic floor disorders in the long-term.20
However, most observational studies continue to support the protective effects of caesarean
delivery on the pelvic floor with maximal benefit for caesarean sections conducted before the
onset of labour.
b. Maternal Disadvantages:
Caesarean sections have an overall complication rate of between 11-14 %.35 The
complications associated with caesarean delivery range from minor complications to major
complications which include near-miss (to be discussed later) and even maternal mortality.
Short-term complications include intraoperative injury to the ureters, bladder and bowel,
lacerations to the cervix, vagina and broad ligaments and haemorrhage caused by injury to
blood vessels. Post-operatively, infection is the commonest complication and may range
from endometritis to urinary tract and wound infection.36 In the long-term, caesarean
sections predispose to adhesion formation, bladder injury, placenta praevia and uterine
rupture in subsequent pregnancies.32
Major complications of caesarean sections are post-partum haemorrhage, need for re-look
laparotomy, sepsis and pulmonary embolism.33, 35, 36 The risk of hysterectomy is 10 times
greater after caesarean section compared to vaginal delivery and the relative risk of maternal
mortality associated with caesarean section as opposed to vaginal delivery is 5:1.37 Causes
of death after caesarean section are similar for other types of abdominal surgery namely:
haemorrhage, sepsis, pulmonary embolism and anaesthesia related complications.36

24
The psychological and emotional impact of caesarean delivery should not be underestimated.
For many women, vaginal delivery is the cornerstone to the achievement of motherhood.
Caesarean birth may thus be associated with feelings of inadequacy, guilt and failure.32
c. Near-miss or Severe Acute Maternal Morbidity (SAMM)
“Near-miss” and “Severe Acute Maternal Morbidity (SAMM) are two terms often used
interchangeably. They may be defined as: “a severe life-threatening obstetric complication
necessitating an urgent medical intervention in order to prevent likely death of the mother”.38
In other words, they refer to a woman who has organ failure during pregnancy, labour or the
puerperium that could have resulted in death but did not.39 The term “near-miss” better
reflects the concept of nearly dying but surviving and therefore, the World Health
Organisation recommends the use of this term instead of SAMM.38
Traditionally, auditing maternal deaths was used to assess quality of care and identify
potential opportunities for improvement in maternal health care. For each maternal death,
there are large numbers of women that suffer severe illness or long-term disability. Women
who survive life-threatening complications related to pregnancy have many similarities to
women who die of these complications. Because they occur more frequently than maternal
deaths, near-miss or SAMM cases therefore provide a supplementary maternal outcome
measure and enable an understanding of the determinants of maternal mortality. They can
therefore provide valuable information regarding the quality of obstetric care in a particular
setting.40-42
Routine implementation of near-miss as a standard tool for evaluating the quality of obstetric
care has been limited traditionally by the lack of a standard definition and uniform case-
identification criteria.40, 41 The World Health Organisation (WHO) conducted a systematic

25
review of the literature in 2004. This systematic review found a wide variation in the
methods used to identify near-miss. Three different methods were identified, namely:40
1. Defining clinical or disease-specific criteria e.g. cyanosis or seizures.
2. Identifying organ dysfunction e.g. shock.
3. Intervention based criteria e.g. hysterectomy.
The WHO recognised the importance of developing a uniform set of identification criteria for
near-miss cases in order to facilitate the use of near-miss reviews for monitoring and
improving the quality of maternal health care. In 2007, the WHO established a working
group of experts to examine the existing literature and produce a standard definition and
identification criteria for maternal near-miss cases. A standard definition was developed,
tested and validated. The WHO working group defined maternal near-miss as: “a woman
who nearly died but survived a complication that occurred during pregnancy, childbirth or
within 42 days of termination of pregnancy”. 38,39, 40
Similarly uniform identification criteria were developed. The criteria used to identify near
miss are based on markers of organ dysfunction. This is shown in Appendix 1. The WHO
has recognised that these markers are not part of the traditional, routinely collected
information. Raising awareness and motivating health care professionals to contribute to the
identification of near-miss cases is essential.38, 39, 40,
The WHO near-miss approach has been implemented and validated in numerous studies. The
WHO Multicountry Survey on Maternal and Newborn Health (WHOMCS) is the largest
study to date assessing the management of severe maternal complications and the prevalence
of maternal near-miss. It was implemented in 359 hospitals from 29 countries located in the
5 WHO regions.43 A multicentre cross-sectional study which was carried out in 27 referral
maternity hospitals in Brazil, found the WHO criteria for maternal near-miss to be highly

26
associated with maternal death. Near-miss cases were accurately identified using the WHO
near-miss approach. 44
d. Caesarean sections and Near-miss
Caesarean sections are more commonly associated with near-miss when compared to vaginal
deliveries. A study conducted in the Netherlands found that 19.3% of women who had
experienced SAMM had a prior caesarean section, but more importantly 43.6% of these
women had delivered via caesarean section in the index pregnancy.45
However, it is important to bear in mind that maternal morbidity and mortality after
caesarean section is not always directly attributable to the procedure. The caesarean section
may indeed save many lives. The intrinsic risk of caesarean sections may not be easy to
separate from the medical and obstetric indications that lead to the procedure being
performed.36, 46, 47 Furthermore, the risks of caesarean section are also associated with
surgical skill, quality of care from support staff e.g. nursing and anaesthesia and
characteristics of the patient. This complicates attempts to define a mortality risk: benefit
ratio for caesarean sections.36
The use of a randomised controlled trial to compare the benefits and harms of caesarean
section compared to spontaneous vaginal delivery is prevented by ethical and practical
constraints. Several large studies have been conducted in order to more accurately define the
relationship between mode of delivery and maternal outcomes while taking into account
confounding factors like maternal diseases.
The World Health Organisation Global Survey on Maternal and Perinatal Health (WHOGS)
is a multi-country, facility-based survey with the aim of determining the rates of the different
modes of delivery and examining the association between mode of delivery and maternal and

27
perinatal outcomes across 24 countries. It was conducted in three phases between the years
2004-2008 across three continents: America, Asia and Africa.
The third phase of the WHOGS, conducted in Asia, is one of the largest observational studies
examining the risks and benefits associated with caesarean section. This study demonstrated
that caesarean sections were associated with an increased risk of adverse maternal outcomes
namely maternal death, hysterectomy, blood transfusion and ICU admission. Even though
these adverse outcomes occurred with low frequency, they were still more common with
caesarean section when compared to vaginal delivery.46
Similarly, the first phase of the WHOGS which was conducted in Latin America also
demonstrated a positive association between caesarean section and severe acute maternal
morbidity and mortality even after adjustment for demographic characteristics, risk factors
and general medical and pregnancy associated complications.9
Souza et al merged the data from the three-continent analysis conducted by the WHOGS in
order to study the association between mode of delivery and severe maternal and perinatal
outcomes. In this study, severe maternal outcome was defined as the occurrence of any of the
following: death, ICU admission, blood transfusion or hysterectomy within 7 days of
delivery. The overall prevalence of severe maternal morbidity was 37 per 1000 deliveries. In
addition, all other modes of delivery, besides spontaneous vaginal delivery, were associated
with an increased risk of severe maternal morbidity. Also, it was found that this association
was stronger in Africa as compared to Asia and Latin America.48
Similarly, Villar et al conducted a prospective cohort study within the WHOGS in Latin
America in order to evaluate the benefits and risks of caesarean versus vaginal delivery.
They concluded that both elective and intrapartum caesarean sections doubled the risk for
SAMM even after adjustment for confounding factors.49
28
In an attempt to isolate maternal mortality due to caesarean delivery, Lilford et al conducted a
study in South Africa between 1975 -1986. In this study an attempt was made to identify
attributable risks of caesarean section compared with vaginal delivery by excluding patients
with pre-existing medical or obstetric complications that may necessitate a caesarean section.
They demonstrated that the risk of maternal mortality is five times greater for caesarean
section compared to vaginal delivery. Intrapartum caesarean section is four times more likely
to result in maternal mortality when compared to antepartum caesarean section.37 Several
other publications demonstrate congruent results in that caesarean sections are more
commonly associated with near-miss when compared with vaginal delivery and that adverse
outcomes occur more commonly with emergency rather than elective procedures.50, 51
It is thus evident that caesarean sections should only be conducted when they are medically
indicated in order to improve maternal outcomes. Prophylactic caesarean sections should still
be considered unjustifiable due to the considerable maternal morbidity and mortality that is
associated with them. It is only when clear benefit is anticipated that a caesarean section
may justify the additional risks.
1.6.2 Implications of caesarean section on fetal well-being
a. Perinatal Advantages
Elective caesarean section performed at 39 weeks of gestation may prevent several adverse
neonatal outcomes. The risk of intrauterine fetal death after 39 weeks is approximately 2 in
1000 which could be prevented by elective caesarean section. Other adverse outcomes such
as meconium aspiration and the need for neonatal intubation, which increase after 39 weeks,
may also be prevented.20
29
Furthermore, in the event of poor progress during labour, women who attempt vaginal birth
may be subjected to assisted delivery which is associated with intracranial injury to the fetus.
By obviating the possibility of assisted delivery, caesarean section reduces the rates of
intracranial and other birth injuries.20
The risk of mother-to-child transmission of various infections e.g. HIV, Hepatitis B and C
and Human Papillomavirus may be minimised by caesarean delivery. However, with the
introduction of anti-retroviral therapy to all HIV-infected pregnant women in the public
health sector in South Africa, appropriate prevention of HIV transmission does not include
elective caesarean section.20
Caesarean delivery cannot guarantee normality, but it can avoid problems associated with
labour and prolonged pregnancy. However, these advantages do not support routine
recommendation of caesarean section because the overall incidence of these adverse events is
low and do not justify the risks that are associated with prophylactic caesarean section.
b. Perinatal disadvantages
Caesarean delivery rates of greater than 10% are not associated with any additional benefit
for the baby but have been shown to increase neonatal morbidity and mortality. Morbidity
and mortality in the neonatal period are largely due to respiratory and cerebral complications
especially when associated with preterm birth.49, 52
Caesarean delivery before 39 weeks of gestation is associated with increased risk of neonatal
pulmonary complications especially respiratory distress syndrome and transient tachypnoea
of the new-born. This is thought to be due to the lack of mechanical compression of the fetal
lungs during labour which is necessary for neonatal adaptation to life. Caesarean section is

30
also associated with reduced release of catecholamines and prostaglandins which may
contribute to respiratory distress syndrome.20, 52
Fetal injuries including scalpel lacerations, brachial plexus palsy, fractures and blunt intra-
abdominal injury are other potential complications of caesarean birth. Also the need for
resuscitation at birth is more commonly associated with caesarean delivery.32
The WHOGS in Latin America and Asia demonstrated an association between caesarean
delivery and adverse perinatal outcomes. These outcomes included admission to neonatal
ICU (NICU), preterm delivery and neonatal death.9, 46
After reviewing approximately 97000 deliveries within the WHOGS, Villar et al concluded
that both elective and intrapartum caesarean sections were associated with an increased risk
of neonatal morbidity and mortality. Caesarean section almost doubled the risk of admission
to NICU for 7 or more days. The preterm delivery rates were also higher in the caesarean
groups. On the other hand, for breech presentation, caesarean birth was associated with a
significant reduction in the risk of intrapartum fetal death.49
In a prospective survey, caesarean delivery was shown to double the risk of admission to
NICU as well as the risks of pulmonary disorders already mentioned. No significant
improvements were noted in neurological outcomes or Apgar scores which is often cited as a
justification for elective caesarean section.52
From the above, it may be concluded that high caesarean delivery rates do not improve
perinatal outcomes neither do they indicate good quality of care.
1.6.3 Socioeconomic Implications
Caesarean sections increase the cost of health care as compared to vaginal deliveries. This
includes direct costs namely the use of theatre facilities, anaesthesia, human resources and
31
postoperative care as well as indirect costs: maternal and neonatal morbidity and mortality,
implications on future pregnancies and future health of patients undergoing caesarean section.
Excessive, unnecessary caesarean sections may represent a burden to countries with health
systems that need to function within a limited budget and it is therefore important to limit
caesarean delivery to medical indications and avoid unnecessary use so that resources are not
taken from other parts of the health system.53
1.7 Classification of caesarean sections
Rising caesarean sections rates have become a public health concern. The disparities in
caesarean rates across various settings and the reasons for the increase in caesarean delivery
are not well understood. Most obstetric facilities can report their caesarean delivery rates.
However this information in isolation is of limited value. Obstetric facilities differ in terms
of the characteristics of the patients they care for and the services they provide for instance
tertiary referral hospitals versus primary health care clinics.
Systematic collection of further data, aside from the caesarean section rate, and the
subsequent classification of caesarean sections is valuable to gain a better understanding of
the underlying determinants of the caesarean birth rate.54, 55
Several caesarean section classification systems exist. These may be divided into 4
categories:
• Indication based classification systems
These are the most common classification systems and are easy to implement
but are not mutually exclusive, totally inclusive or reproducible.
• Urgency based classification systems

32
Caesarean deliveries are categorised according to the degree of urgency e.g.
emergency, urgent, elective, peri-mortem. These type of classification
systems are easy to understand and use but they are poorly reproducible and
have limited utility in clinical practice.
• Woman-based classification systems
Caesarean sections are classified according to the characteristics of the
pregnancy and the patient. These classification systems are easy to use,
mutually exclusive, totally inclusive and reproducible. The weakness of these
systems however, is that the indications for the caesarean section and the
degree of urgency are not included.
• Other systems
Many of the classification systems that fall into this category are only
theoretical and have never been tested in clinical practice.
A systematic review of the literature conducted by Torloni et al critically evaluated the
various existing caesarean section classification systems. Although they noted that there
exists no single ideal classification system for all settings, the study concluded that Woman-
based classification systems, particularly the Robson Ten Group Classification System
(TGCS), is optimally suited to fulfil current needs.54
The systematic review acknowledged that although the TGCS identified where the difference
in caesarean section rates lay, it did not explain the reason for the differences. It was
suggested that a hybrid model based on the woman-based classification systems be used with
additional layers from other classification systems within the individual categories.54

33
1.7.1 The Robson Ten Group Classification System (TGCS)
In 2001, Robson proposed the Ten Group Classification System based on 4 key obstetric
concepts: the category of the pregnancy, previous obstetric record, current course of labour
and delivery and the gestational age as shown in Tables 1-4 of Appendix 2. These 4 concepts
were then combined to create ten well-defined, clinically relevant groups which are described
in Appendix 3.55
For many of the ten groups, further analysis is required in order to interpret the caesarean
section rate in that particular group. It is for these reasons that Farine et al proposed a
modification to the Robson’s criteria in which the ten groups are further sub classified
according to the course of labour. The resulting modified Robson classification assists to
identify reasons for the variations in caesarean section rates within each of the ten groups.56
The Robson classification system provides a framework for auditing, analysing and
monitoring caesarean sections. It gives an initial overview of caesarean birth rates, allows for
comparisons of the caesarean section rate within a particular facility over time or between
health facilities nationally, internationally and globally. Each of the ten groups may then be
studied further which will enable identification of the determinants and implications of
caesarean sections. The TGCS may thus be used to analyse the current trends in caesarean
sections with the impetus to improve health care.55, 57
1.7.2 The Ten Group Classification System in Practice
The TGCS has already been shown to be useful in monitoring caesarean sections globally. It
has been introduced in a number of institutions worldwide and incorporated into their
respective audit processes in order to monitor trends in caesarean section over time.58

34
Application of TGCS in a variety of institutions across the world has yielded similar results
with some significant differences. This includes studies done in Australia, Singapore, Brazil,
Oman, Egypt and South Africa.31, 57, 59-63 Larger studies include the application of the TGCS
to a multi-country dataset of 97 095 women across 120 facilities in 8 different countries as
part of the WHOGS in Latin America.64 Also Brennan et al collated data from 9 obstetric
facilities across 9 countries and classified the resulting study group consisting of 47 402
deliveries according to the TGCS. The countries involved in this study were Ireland, New
Zealand, Australia, Canada, Belgium, Norway, Sweden, Iceland and the United Kingdom.58
In most general obstetric populations, as evidenced by the above research, group 5 makes the
largest contribution to the caesarean section rate. Group 5 consists of pregnant women at
term who have had at least one previous caesarean section. The size of group 5 also indicates
the magnitude of caesarean delivery within a particular setting.
Group 1 and 3 are very important because they are usually the 2 largest groups in most
obstetric populations. Group 1, which consists of nulliparous patients with term pregnancies
in spontaneous labour, is traditionally a low risk population. Because this group accounts for
a large proportion of the obstetric population, it makes a significant contribution to the
caesarean delivery rate. In the research undertaken as described, group 1 is usually the
second largest contributor to the caesarean section rate.
Group 3 is made up of multiparous patients with singleton pregnancies at term in spontaneous
labour. These patients are usually of low risk and require standard management. Group 3 is
the most consistent of the ten groups and the caesarean section rate in this group should not
be higher than 1 -2%.55 Auditing groups 1 and 3 is a useful tool for assessing how a
maternity unit manages labour.

35
Group 2 is the third most significant contributor to the caesarean rate in most of the facilities
analysed. This group is made up of nulliparous patients, with term pregnancies, who either
had an induction of labour or a caesarean section before the onset of labour. Groups 2 and 4
have been subdivided into induction of labour and caesarean delivery before labour in the
modified Robson classification. This provides useful information regarding the success of
induction of labour in a particular facility.56
Groups 6-9 generally have high caesarean section rates which are anticipated due to the
obstetric conditions in these groups. However, as the size of these groups is usually small,
their contribution to the caesarean section rate is not significant.
Group 10 includes all preterm deliveries with a singleton cephalic presentation, irrespective
of previous obstetric record. The contribution of this group to the caesarean section rate
depends on the size of the group because management practices tend to be consistent in this
group. Group 10 is cited as the reason for the high caesarean section rate at tertiary referral
hospitals. In the study conducted at a University Hospital in Singapore, group 10 made the
third largest contribution to the caesarean delivery rate.60
In South Africa, the TGCS was also applied to a dataset at Kalafong hospital in 2005 and
compared to results from the National Maternity Hospital in Dublin, Ireland. Both Kalafong
and Dublin identified group 5 as the major contributor to the caesarean delivery rate.
However, in South Africa the caesarean section rate in group 5 was 85.2% which is very high
compared to Ireland at 50.4%. This high caesarean rate seemed to be associated with an
inability to offer adequate analgesia to labouring patients as well as the lack of proper
monitoring for patients attempting VBAC.31
Groups 1 and 3 had demonstrated the lowest caesarean delivery rates but nevertheless the
caesarean section rates in these groups were still much higher when compared to caesarean

36
rates in Dublin i.e. 15.1% and 8.3% compared to 7.3% and 1.1% respectively. The relatively
high caesarean delivery rates in these traditionally low risk groups indicate that an
improvement in the diagnosis of labour and monitoring during labour is required at Kalafong
Hospital. Group 9 in contrast had a caesarean delivery rate of 30% at Kalafong compared to
100% in Dublin. This may suggest that obstetric skills in assessing the lie of the fetus may
need improvement.31
Most of the research discussed above concluded that the TGCS was practical, easily
applicable and allowed identification of specific groups of women as the main contributors to
the caesarean section rate. The TGCS also assisted in the formulating and planning of
interventions to improve maternal and perinatal health care.58, 59
1.8 Strategies for decreasing caesarean delivery rates
To decrease the caesarean delivery rate, a clear perception regarding the various contributing
factors is critical. Caesarean sections have a self-perpetuating effect. The most common
contributing factor to caesarean delivery is a prior caesarean section. Nulliparous patients are
the next most important contributory group. Therefore, programs designed to reduce
caesarean rates must address both primary and repeat caesarean sections.
Several countries have attempted to contain the use of this procedure using various strategies
with varying degrees of success. Walker et al conducted a literature review on the success of
strategies to reduce caesarean section rates between 1985 and 2001. Interventions that have
been used in an attempt to reduce caesarean sections can be categorised into psychosocial,
clinical and structural strategies. Structural strategies include education of local opinion
leaders, development of practice guidelines and quality improvement strategies, midwifery
care and financial incentives. Clinical and psychosocial strategies will be discussed below.
Strategies that were effective in some settings were not beneficial in others. VBAC,

37
supportive care during labour and ECV were shown to have level 1 evidence for reducing the
caesarean section rate.65, 66
1.8.1 Clinical and Psychosocial Strategies
a. Active management of labour
Active management of labour was developed for nulliparous patients with term, singleton,
cephalic pregnancies. The basic premise is strict criteria for the management of labour and
aggressive response to dystocia. The protocol includes appropriate diagnosis of labour,
amniotomy, early recognition of dystocia and treatment with oxytocin. A meta-analysis of 18
studies found active management of labour resulted in a 34% reduction in caesarean delivery
for dystocia amongst nulliparous patients. Other studies however, noted only a modest
impact and found supportive care in labour to be more effective at reducing caesarean
delivery.67
A randomised controlled trial conducted by Pattinson et al in Pretoria in South Africa at 2
hospitals: Pretoria Academic Hospital and Kalafong Hospital demonstrated that aggressive
management of labour is associated with a significant reduction in caesarean delivery without
impacting adversely on neonatal outcomes. However, aggressive management was noted to
be more labour intensive and difficult to conduct in facilities where staffing shortages are a
reality.68
b. Supportive care
A Cochrane review of 15 trials found that women who had one-to-one supportive care during
labour were less likely to require analgesia, anaesthesia, caesarean or operative vaginal
delivery.65 Supportive care was also found to be more beneficial in settings where epidural
analgesia was not routinely available. Brown et al conducted a pilot randomised, controlled

38
trial to promote childbirth companions in South African state hospitals. The study found that
most women in South Africa are not allowed companions during labour. Despite a general
willingness by the health care team to implement supportive care, introduction of birthing
companions required a substantial level of organisation leading the authors to conclude that
introduction of supportive care during labour is difficult especially in under resourced health
systems.69
c. Induction of Labour
Induction of labour is associated with an increased risk of caesarean section in nulliparous
women. Studies show that nulliparous patients who undergo elective induction of labour are
1.5 to 2.5 times more likely to deliver via caesarean section than women in spontaneous
labour even when birth weight, maternal age and gestational age are controlled. In South
Africa, “failed induction of labour” is a common indication for caesarean section. Induction
of labour should therefore only be considered when the benefits of delivery outweigh
potential maternal & fetal risks and policies and practices to reduce induction of labour
should be put into place.67, 70
d. Encouraging Vaginal Birth after Caesarean Section (VBAC)
A meta-analysis of VBAC has provided level 1 evidence that VBAC is a safe alternative to
repeat caesarean section for both mother and infant. The major risk of trial of labour is
uterine rupture and haemorrhage and possible hysterectomy. The risk of uterine rupture is
1% but this can be reduced by careful patient selection.65, 71, 72
A systematic review of the literature from the year 2000 until 2007 assessed maternal
morbidity after VBAC compared to elective caesarean section. VBAC was successful in
73% of patients and the outcomes of patients with successful VBAC were more favourable.

39
Maternal morbidity was similar in both groups of patients but uterine rupture or scar
dehiscence was more common after failed VBAC.71
It may thus be concluded that the famous dictum, “once a caesarean, always a caesarean” be
changed to “once a caesarean, a trial of labour should precede a second caesarean except in
the most unusual circumstances”.16, 73
e. External Cephalic Version (ECV)
Vaginal breech delivery is a contested issue since the initial results of The Term Breech trial
were published in the year 2000. This trial showed that planned caesarean delivery is safer,
for the fetus, than planned vaginal delivery at term. Elective caesareans section for breech
presentation is therefore accepted practice at many institutions, including South African
hospitals, with up to 80% of breech presentations delivered by caesarean section. This has
resulted in a diminishing skill base for vaginal breech delivery.70, 74
External cephalic version is a well-researched intervention that demonstrates level 1 evidence
to reduce the caesarean section rate in patients with breech presentation.74
f. Electronic Fetal Monitoring (EFM)
Fetal distress is a common indication for caesarean section. The use of continuous electronic
fetal monitoring (EFM) during labour to detect fetal distress is widespread. In South Africa,
cardiotocography (CTG) is the predominant method for fetal monitoring during labour, even
in low-risk patients. However EFM without fetal blood pH sampling has been shown to
increase caesarean delivery rates without improving maternal or perinatal outcomes. Ideally
low-risk patients should be monitored by intermittent auscultation of the fetal heart or
intermittent doptone. EFM should only be carried out in carefully selected patients with high
risk for perinatal mortality.70

40
In order to make a significant impact on caesarean delivery rates, multiple strategies which
address various aspects contributing to caesarean section rates are required. Most
importantly the culture of promoting vaginal delivery needs to be instilled in all members of
health care team, patients, families and communities at large.
1.9 A South African perspective
The WHOGS in Africa noted marked inter-country differences in caesarean section rates in
sub-Saharan Africa.75 Caesarean delivery rates ranged from between 5 -21.8% with
significant socio-economic differences. Elective caesarean sections were uncommon and
maternal indications were most often the reason for caesarean delivery. A similar situation
exists in the public health system in South Africa.
In South Africa, health care is delivered through public and private sectors. A gross
dichotomy exists between the two with obvious social and economic disparities in access to
healthcare. The public health system delivers health care to about 80% of the population and
is stretched and under resourced. On the other hand, the private health sector is utilised by
members of the population who can afford to pay for these services and are mainly members
of private medical aid schemes.76A similar pattern is emerging in South Africa as in the rest
of the world, in that the private health sector has a much higher caesarean section rate
compared to their publicly funded counterparts.
The World Health Report (2010) Background Paper, cites an overall caesarean section rate of
20.6% in South Africa for the year 2008, which includes caesarean sections done in private
and public hospitals.7 However, there is a wide variation in caesarean delivery rates between
facilities as well as provinces. In terms of the public health sector, in 2011/2012, the national
average for district hospitals was 18.4%, 29% in regional hospitals and as high as 37% for
tertiary hospitals. This ranges from as low as 3.2% in some settings to 32.5% in others.

41
Rates as high as 40.7% have been quoted in specialist maternity hospitals. On the other hand,
the private health sector rates have been cited at 57%. It may therefore be appreciated from
the above figures that national caesarean delivery rates are often misleading and may mask
inequalities in access to health care and unequal allocation of resources.76, 77
In the public health sector in South Africa, vaginal deliveries are carried out at a network of
various primary health care clinics with minimal intervention. Medium and high-risk patients
are referred to secondary and tertiary hospitals as appropriate. Caesarean sections are
performed at every hospital level in the public sector. Primary caesarean sections are not
carried out upon request. Even patients who require elective caesarean sections may wait
many days for the procedure. HIV infection is not an indication for caesarean section. The
private health sector, on the contrary, is well equipped and offers caesarean sections on
demand.78
The South African National Committee on Confidential Enquiries into Maternal Deaths
(NCCEMD) was established in 1997. The committee publishes triennial Saving Mothers
Reports. Despite a high average caesarean section rate, the maternal mortality ratio in South
Africa is 176/100 000 live births as compared to just 17/100 000 in the United States.55, 79
According to the recent Saving Mothers Report, obstetric haemorrhage has overtaken
hypertensive disorders and is now the commonest cause of direct maternal deaths in South
Africa. Amongst the 688 maternal deaths, bleeding at or after caesarean section, was the
commonest cause accounting for 26.2% of deaths due to obstetric haemorrhage. Of these
deaths, 80.1% were probably or, at least, possibly avoidable. They occurred as a result of
inadequate post-operative monitoring, failure to recognise PPH timeously, lack of appropriate
re-look laparotomy, and inappropriate management of uterine atony.79

42
This has prompted the NCCEMD to release an “Alert on Maternal Deaths due to Obstetric
Haemorrhage” which focuses on particular aspects in order to reduce maternal mortality from
haemorrhage. These include: health facility requirements for safe caesarean delivery,
surgical technique, postoperative care as well as algorithms for managing bleeding.80, 81
Due to the massive problem of haemorrhage at caesarean section in South Africa, high
caesarean section rates represent a burden to the already struggling public health system,
without improving maternal mortality. The high caesarean section rate may also function as
a barrier to necessary health services and therefore affect health equity within the country.
Reducing caesarean delivery rates is an important strategy to reduce maternal mortality.
Action therefore needs to be taken to offer timely, safe caesarean sections to women in need
and advocate for rational use of caesarean sections in institutions with excessive use of this
procedure.

43
2. Problem Statement
Caesarean section is a vital tool in modern day obstetrics and although it is often life-saving,
each caesarean delivery represents a risk to both mother and new-born.
This has prompted the WHO, in 1985, to provide recommendations regarding caesarean
delivery rates. National caesarean section rates in South Africa are acceptable according to
the World Health Organisation. However the burden of maternal mortality in South Africa
remains unacceptably high.6
The triennial Saving Mothers Reports published by the National Committee for Confidential
Enquiries into Maternal deaths (NCCEMD) has identified obstetric haemorrhage, particularly
at caesarean section, as an important preventable cause of maternal death. This has led the
NCCEMD to release an “Alert on Maternal Deaths due to Obstetric Haemorrhage” which
includes recommendations to prevent haemorrhage-related maternal deaths in South Africa.
One of the recommendations is that strict indications for caesarean section are followed.80, 81
In most of the developed world, caesarean section is a relatively safe mode of delivery.
However, in the South African setting, with the unacceptably high rates of maternal
mortality, minimising caesarean delivery is an essential strategy to reduce maternal mortality.
The caesarean section rate at CHBAH is in excess of 30%. With the view to advocating
“Safe Motherhood” in South Africa, this study aims to identify the common indications for
caesarean section at CHBAH. This may stimulate debate as to whether these indications for
caesarean delivery are valid as well as aid discussion into potential strategies to reduce the
caesarean section rate for these indications. The study also aims to audit morbidity and
mortality arising from caesarean delivery.

44
3. Aims and Objectives
3.1 Aims:
This study aims to identify the common indications for caesarean section at CHBAH as well
as audit the maternal morbidity and mortality arising from caesarean delivery. The above
findings will aid identification of strategies to reduce caesarean section rates.
3.2 Objectives:
1. To determine the caesarean section rate at Chris Hani Baragwanath Academic
Hospital.
2. To classify the caesarean sections done according to the Robson Ten Group
Classification System.
3. To determine the most common indications for caesarean section at Chris Hani
Baragwanath Academic Hospital.
4. To describe severe acute maternal morbidity associated with caesarean section within
48 hours.
45
4. Methods
Study design
This was a prospective, observational study carried out over a two month period.
Setting
Chris Hani Baragwanath Academic Hospital is a tertiary hospital located south of
Johannesburg, in the Gauteng Province. The largest proportion of the South African
population, approximately 11.9 million people, resides in Gauteng. The province has a
22.3% unemployment rate and almost a quarter of households are informal dwellings. The
hospital services 2 million people, mainly of low-income, and the maternity unit delivers in
excess of 23 000 babies each year.
Most of the patients are high-risk and are referred by midwife managed obstetric units
(MOU). However about 20% of patients are low-risk, self-referrals.
The maternity department at Chris Hani Baragwanath Academic Hospital is staffed by
midwives, intern doctors, medical officers, registrars and specialists. The labour ward has 20
beds. There is an area for patients that are in early labour, which compromises 16 beds as
well as an admission ward. The department is also equipped with a 7 bed High Care Area
(HCA) which has one ventilator. There are 2 operating theatres for obstetrics which are
available 24 hours a day. The maternity department is well-supported by a tertiary level
neonatal unit. A blood bank is located on the premises.
Study population
All patients with viable pregnancies (i.e. ≥ 24 weeks gestation) who delivered at Chris Hani
Baragwanath Academic Hospital via caesarean section during a fixed period of two months,
46
July and August 2013, were included in this study. Fetuses less than 500 grams or 24 weeks
gestation were excluded as these are considered non-viable in our setting.
Inclusion criteria
All women with viable pregnancies ( ≥ 24 weeks gestation) who delivered at Chris Hani
Baragwanath Academic Hospital by caesarean section were included in the study.
Exclusion criteria
Patients that had spontaneous or assisted vaginal deliveries were not included in this study.
Non-viable pregnancies (< 24 weeks gestation) and patients who presented already delivered
i.e. born before arrival (BBA) were excluded.
Sample size
The study intended to include approximately 500 participants. Approximately 500 caesarean
sections are performed at Chris Hani Baragwanath Academic Hospital each month. A sample
size of 500 patients was chosen due to the expected period of the study as well as the
historical numbers of caesarean sections done at CHBAH. The researcher sampled patients
every alternate day over a two month period to ensure that there was no overlap of patients.
The study was therefore intended to be conducted over 2 months but 500 participants were
obtained by 7 weeks and therefore data collection was stopped at that point.
Data collection
Before proceeding, necessary permission was obtained from the hospital, as well as the
relevant ethics and research committees. The researcher collected data from the post-
caesarean section wards every alternate day. The researcher also collected data from the high
care and intensive care areas. Once informed consent was obtained, patient’s case files were

47
perused. Demographic, obstetric and delivery outcome data of women who have delivered
by caesarean section was collected and captured onto a data sheet (Appendix 4) and then
transferred to a computer database for analysis. In the case of patients who were unable to
give informed consent, e.g. patients admitted to ICU, consent was obtained from the next of
kin. In the case of minors, parental consent was obtained. Patients were followed up for a
period of two days after caesarean section in order to identify SAMM. In addition to patient-
specific data, the researcher determined the total number of caesarean sections and vaginal
deliveries during the study period by examining the theatre and labour ward registers
respectively. In this way the caesarean section rate was determined.
Data Analysis
The data was captured on a data sheet and then tabulated into a Microsoft Excel spread sheet.
The data was then exported for analysis into Stata 11 statistical software package. Results
were calculated at the end of the period. Continuous data was described using means ±
standard deviation. Categorical data is reported in terms of frequencies and percentages with
a 95% confidence interval. Data was also categorised according to the Robson Ten Group
Classification System (as shown in Appendix 3).
Ethics Approval
Ethics approval was obtained from The University of the Witwatersrand Health Science
Research Ethics committee (HREC), approval number M130521, attached as Appendix 5.

48
5. Results
There were 3898 deliveries during the two month period. There were 1534 caesarean
sections resulting in a caesarean delivery rate of 39.4%.
A total of 533 caesarean sections were performed on the data collection days. However, 6
patients were excluded. Four patients declined participation in the study, 1 patient refused
hospital treatment post-caesarean section and was therefore lost to follow-up and in one case
involving a minor, the parents could not be contacted to obtain informed consent. Finally
527 participants were included in the study.
Table 1: Age range in years:
Age Number of women (N= 527) Percentage
≤ 19 52 9.9
20 – 24 143 27.1
25 – 29 152 28.8
30 – 34 100 19.0
35 – 39 59 11.2
40 – 44 20 3.8
45 – 49 1 0.2
The youngest patient in the study population was 14 years old and the oldest patient was 47
years old. The mean age of women in the study was 27.4 years (SD ± 6.45). The most
frequent age in years was 24. Most patients (56.0%) were between the ages of 20 to 29 years.
The teenage pregnancy rate in this population was 9.9%.

49
Table 2: Frequency distribution of parity before delivery of patients who had caesarean
sections at CHBAH
Parity Number of patients (N= 527) Percentage
0 183 34.7
1 174 33.0
2 115 21.8
3 36 6.8
4 12 2.3
5 3 0.6
6 3 0.6
7 1 0.2
In this study, 34.7% of patients were nulliparous. The mean parity was 1.1 (SD ± 1.2). The
highest parity was 7. The mean gravidity was 2.4 (SD ± 1.3).
Table 3: Gestational age, at time of delivery, in weeks:
Gestational age Frequency (N= 527) Percentage
24 – 36 131 24.9
37 – 40 313 59.4
41-42 82 15.6
>42 1 0.19
The gestational age was determined by one of the following: last normal menstrual period
(LNMP), early ultrasound (≤ 24 weeks), late ultrasound (> 24 weeks) or first palpation. In

50
this study population, 225 (42.7%) patients expressed certainty about the LNMP and 117
(22.2%) patients had an early ultrasound.
The mean gestational age was 37.5 weeks (SD ± 3.4). The most frequent gestational age was
38 weeks. There were 131 (24.9%) preterm deliveries (< 37 weeks) and 83(15.8%) patients
were postdates (≥41 weeks). The shortest gestational period was 24 weeks and the longest
pregnancy was 43 weeks.
Table 4: Classification of categories of the pregnancies:
Number of foetuses Frequency (N = 527) Percentage
Single cephalic pregnancy 467 88.6
Single breech pregnancy 27 5.1
Single oblique or transverse lie 9 1.7
Multiple pregnancy 24 4.6
Breech presentation occurred in 5.1% of singleton pregnancies and 1.7% of patients had an
abnormal lie. There were 24 patients with twin pregnancies in the study population. There
was no triplet or other higher order pregnancies. In terms of multiple pregnancies, data was
analysed using the presentation of the leading twin. There were 8 twin pregnancies with
breech presentation and one abnormal lie.

51
Table 5: Previous obstetric history
Number of previous caesarean sections Frequency (N= 527) Percentage
0 362 68.7
1 123 23.3
2 37 7.0
3 5 1.0
One hundred and sixty-five patients (31.3%) had previous caesarean sections. Of the patients
with previous caesarean sections, 74.5% had one previous caesarean section.
Table 6: Total number of comorbidities:
Comorbid disease Frequency Percentage
Hypertension 102 19.4
Imminent Eclampsia 6 1.1
Eclampsia 9 1.7
HELLP syndrome 8 1.5
Abruptio Placentae 4 0.8
Diabetes Mellitus 14 2.7
Epilepsy 3 0.6
Asthma 3 0.6
Anaemia 5 0.1
Other Comorbidities 12 2.3
No Comorbid disease 406 77.0

52
One hundred and twenty-one (23.0%) patients had comorbid disease. Hypertension was the
most frequently occurring comorbid disease occurring in 19.4% of patients. Eight patients
had intrauterine fetal deaths due to various causes. Other comorbidities found in the study
population include stroke, venous thromboembolic disease, myasthenia gravis, poliomyelitis,
cardiac disease, ruptured appendicitis and spinal muscular atrophy.
Table 7: Labour and delivery data resulting in caesarean section:
Labour Frequency (N =527) Percentage
Spontaneous Labour 321 60.9
Elective Caesarean Section 62 11.8
Induced Labour 54 10.2
Emergency Caesarean Section Before Labour 90 17.1
The majority of patients (60.9%) underwent emergency caesarean section after the onset of
spontaneous labour. Sixty-two patients had an elective caesarean section. Fifty-four patients
who had induced labour required caesarean delivery.

53
Table 8: Indications for caesarean section:
Indication for Caesarean Section Frequency (N=527) Percentage
Fetal Distress 236 44.8
Dystocia 67 12.7
Failed Vacuum Delivery 2 0.4
Previous Caesarean Section x 1 50 9.5
Failed Vaginal Birth After Caesarean Section (VBAC) 32 6.1
Previous Caesarean Section x 2 36 6.8
Previous Caesarean Section x 3 5 0.9
Breech Presentation 19 3.6
Other Presentation (includes Oblique, Transverse Lie) 8 1.5
Multiple Pregnancy 22 4.2
Failed Induction Of Labour 5 0.9
Chorioamnionitis 6 1.1
HELLP syndrome 7 1.3
Eclampsia 9 1.7
Fetal Abnormalities 5 0.9
Antepartum Haemorrhage 12 2.3
Cord Prolapse 1 0.2
Grand Multiparity 2 0.4
Ruptured Uterus 1 0.2
Poor Obstetric History 2 0.4

54
Upon analysis of indications for caesarean section, there were patients with more than one
indication for caesarean birth. In this instance, the indication chosen was the one that most
urgently required caesarean delivery. Fetal distress accounted for 44.8% of caesarean
sections. A history of a previous caesarean section was the second most common indication
for caesarean delivery. This includes caesarean sections done for one, two and three previous
caesareans, failed vaginal birth after caesarean section (VBAC), as well as patients who
presented in labour but requested caesarean section. Dystocia was the third commonest
indication for caesarean section and included patients with the indications: cephalopelvic
disproportion (CPD), failed augmentation of labour and poor progress. Antepartum
Haemorrhage (APH) accounted for 2.3% of the indications for caesarean section. This
includes APH due to placental abruption, placenta praevia as well as antepartum
haemorrhage of unknown origin.

55
Robson’s Ten Group Classification System
Table 9: The distribution of caesarean deliveries across the Robson’s Ten Groups:
Robson’s Category Frequency (N= 527) Percentage
1 89 16.9
2 44 8.3
3 84 15.9
4 42 8.0
5 125 23.7
6 9 1.7
7 18 3.4
8 24 4.6
9 9 1.7
10 83 15.8
Table 10 shows the total number of caesarean deliveries distributed across the Robson’s Ten
Groups as well as the contribution of each group to the overall caesarean section rate. It can
be appreciated that group 5, which consists of multiparous patients with at least one previous
caesarean section and singleton cephalic pregnancies at term, is the largest contributor to the
overall caesarean section rate. This is then followed by groups 1 and 3.
Group 1 and 3 consists of nulliparous and multiparous patients respectively with singleton,
cephalic pregnancies at ≥ 37 weeks in spontaneous labour. Group 3 does not include women
with previous caesarean sections. Both groups 1 and 3 generally represent uncomplicated
labour and are the largest groups in most obstetric populations.
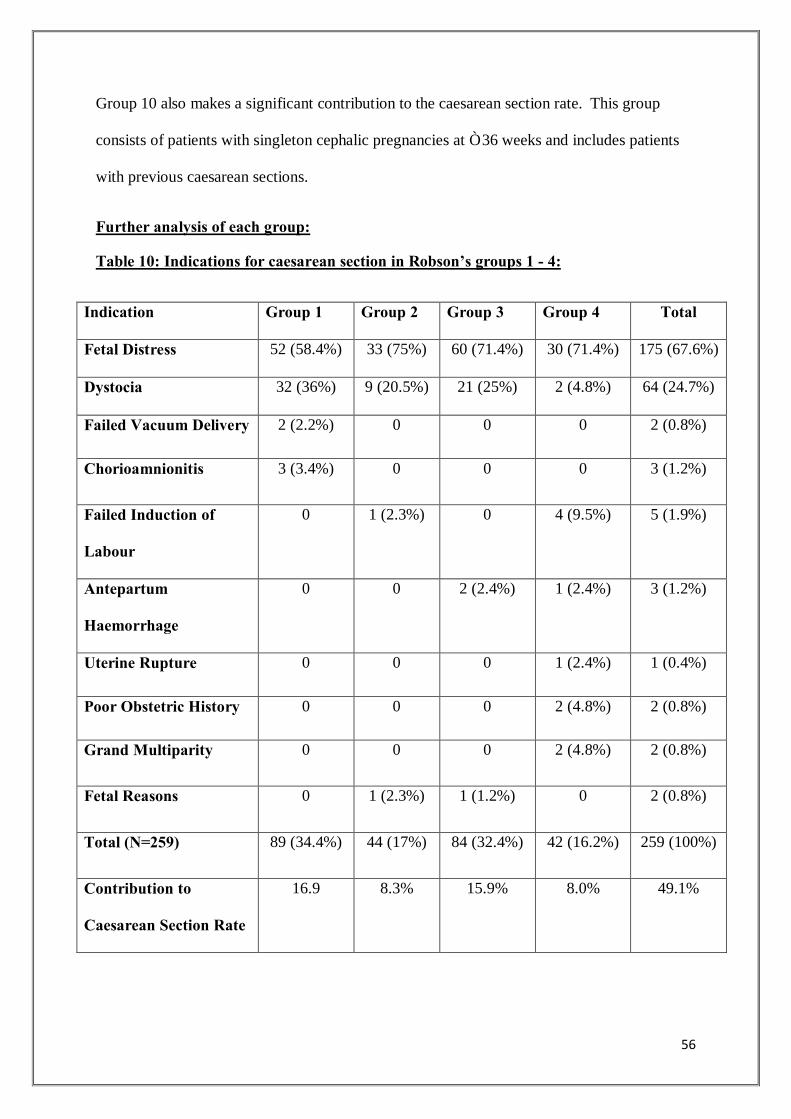
56
Group 10 also makes a significant contribution to the caesarean section rate. This group
consists of patients with singleton cephalic pregnancies at ≤ 36 weeks and includes patients
with previous caesarean sections.
Further analysis of each group:
Table 10: Indications for caesarean section in Robson’s groups 1 - 4:
Indication Group 1 Group 2 Group 3 Group 4 Total
Fetal Distress 52 (58.4%) 33 (75%) 60 (71.4%) 30 (71.4%) 175 (67.6%)
Dystocia 32 (36%) 9 (20.5%) 21 (25%) 2 (4.8%) 64 (24.7%)
Failed Vacuum Delivery 2 (2.2%) 0 0 0 2 (0.8%)
Chorioamnionitis 3 (3.4%) 0 0 0 3 (1.2%)
Failed Induction of
Labour
0 1 (2.3%) 0 4 (9.5%) 5 (1.9%)
Antepartum
Haemorrhage
0 0 2 (2.4%) 1 (2.4%) 3 (1.2%)
Uterine Rupture 0 0 0 1 (2.4%) 1 (0.4%)
Poor Obstetric History 0 0 0 2 (4.8%) 2 (0.8%)
Grand Multiparity 0 0 0 2 (4.8%) 2 (0.8%)
Fetal Reasons 0 1 (2.3%) 1 (1.2%) 0 2 (0.8%)
Total (N=259) 89 (34.4%) 44 (17%) 84 (32.4%) 42 (16.2%) 259 (100%)
Contribution to
Caesarean Section Rate
16.9 8.3% 15.9% 8.0% 49.1%

57
Groups 1 and 2 consist of nulliparous patients with singleton cephalic pregnancies at ≥ 37
weeks, whereas groups 3 and 4 consist of multiparous patients with similar characteristics.
The difference between the groups is that the patients in groups 1 and 3 are in spontaneous
labour, while those in groups 2 and 4 undergo induction of labour or caesarean section before
the onset of labour.
In this study, group 1 was the second largest contributor to the caesarean section rate
followed by group 3. Amongst the 44 patients in group 2, 27 patients had an induction of
labour and the remaining 17 patients had a caesarean section before the onset of labour. In
group 4, 24 patients underwent induction of labour while 18 patients had a caesarean delivery
before the onset of spontaneous labour.
Fetal distress was the most common indication for caesarean sections in all 4 groups
followed by dystocia. Failed induction of labour was diagnosed after the patient failed to
initiate labour after 2 cycles of induction.
There were also 2 caesarean sections for poor obstetric history. Both patients had previous
intrauterine fetal deaths at term. Due to the lack of facilities for continuous electronic fetal
monitoring throughout induction of labour, elective caesarean section were performed. The
category “fetal reasons” constitutes 2 caesarean sections that were conducted upon maternal
request for anencephaly and hydrocephalus.
Group 5
Group 5 represents all patients with singleton, cephalic pregnancies at ≥ 37 weeks with at
least one previous caesarean delivery.
Group 5 made the largest contribution to the caesarean section rate accounting for 23.7% of
caesarean sections performed with 125 patients in this group. Seventy-three patients were in

58
spontaneous labour and 52 patients underwent caesarean section before labour. None of the
patients in group 5 had an induction of labour as per hospital protocol.
Of the 125 patients in this group, 94 patients had one previous caesarean section, 27 patients
had two previous caesarean sections and 4 patients had three previous caesarean sections. .
Ten patients with two previous caesarean sections and 2 patients with three previous
caesarean sections presented in spontaneous labour.
Table 11: Indications for caesarean section in patients with one previous caesarean
section.
Indication Absolute Number Percentage
Patient request 33 35.1
Failed VBAC 24 25.5
Fetal distress 22 23.4
Other 15 16.0
Total 94 100
The commonest indication for caesarean section in patients with one previous caesarean
delivery was patient request (35.1%). Eight of these patients presented in spontaneous labour
and declined vaginal delivery. Twenty-four patients (25.5%) with a previous caesarean
section attempted vaginal delivery but were unsuccessful. Fetal distress was the indication
for caesarean section in 22 patients in group 5.
Fifteen caesarean sections were done for other reasons. One caesarean section was
undertaken electively for a patient with spinal muscular atrophy. Another was performed for
a patient with a previous classical uterine incision who presented in labour. Delivery was

59
necessary in 2 patients for postdates, 1 for prolonged pre-labour rupture of membranes, 2 for
fetal reasons namely intrauterine fetal death and oligohydramnios and 7 patients required
delivery due to hypertension and associated complications.
Groups 6, 7, 8 & 9
All these groups include women with previous caesarean section.
Groups 6 and 7 represent all nulliparous and multiparous patients with breech presentations,
irrespective of gestation. Group 6 and 7 made up 1.7% and 3.4% of caesarean sections
performed. There were 9 patients in group 6. Six of these patients presented in spontaneous
labour and 2 patients underwent caesarean section prior to labour. There was one induction
of labour in group 6. This was undertaken as the patient in question had HELLP syndrome
and an intrauterine fetal death requiring urgent delivery at 27 weeks of gestation.
Group 7 consisted of 18 patients, 12 patients presented in labour and 6 underwent elective
caesarean section before the onset of labour.
Group 8 consists of multiple pregnancies irrespective of gestational age or parity. There were
24 twin pregnancies and no higher order pregnancies in this study population. Of the 24
patients in group 8, 19 were in spontaneous labour. Seven patients had previous caesarean
sections. Six patients underwent caesarean section due to breech presentation of first twin.
There was one caesarean section for twin to twin transfusion syndrome.
Group 9 consists of patients with singleton pregnancies with an abnormal lie irrespective of
gestational age. There were 9 patients in this group which contributed 1.7% to the caesarean
section rate. Eight patients were in spontaneous labour and one patient had an elective
caesarean section before labour. Three patients (33.3%) presented in preterm labour.

60
Group 10
Table 12: Indications for caesarean section in group 10:
Indication Absolute number Percentage
Fetal distress 39 47.0
Dystocia 3 3.6
Previous caesarean section x 1 10 12.0
Previous caesarean section x 2 4 4.8
Previous caesarean section x 3 1 1.2
Eclampsia 7 8.4
HELLP syndrome 5 6.0
Antepartum haemorrhage 8 9.6
Chorioamnionitis 3 3.6
Fetal reasons 3 3.6
Total 83 99.8
Group 10 consists of patients with singleton, cephalic pregnancies at ≤ 36 weeks gestation.
This group includes nulliparous and multiparous patients as well as patients with previous
caesarean sections. Forty-four patients had comorbid diseases in this category (53.0%).

61
Near-miss
Table 13: Near-miss
Near-miss Frequency Percentage
ICU admission 8 1.5
Blood Transfusion 5 1.0
Surgical Intervention 1 0.2
Intubated & Ventilated 8 1.5
There was one maternal death (0.2%) and twelve near-miss cases (2.3%) were identified.
The near-miss ratio was 24.7 cases per 1000 deliveries.
The mean age of the patients with a near-miss was 26.8 years. The mean gestational age at
the time of delivery was 32.1 weeks and 61.5% (8/13) of patients had a preterm delivery (≤
36 weeks). Four patients (30.8%) had a previous caesarean delivery.
Eight patients were admitted to ICU. The remaining patients were admitted to HCA due to
shortage of ICU beds. Eleven patients had pre-existing comorbid disease (84.6%). The most
common comorbidity was hypertension and its related complications (81.8%).
Five patients had caesarean sections for eclampsia. These patients required intubation and
ventilation for various reasons namely: metabolic acidosis, cardiac arrest due to magnesium
sulphate toxicity and intractable seizures with associated aspiration pneumonia.
Five patients had primary postpartum haemorrhage requiring blood transfusion. Three of
these patients underwent caesarean sections for abruptio placentae one of whom required
intubation and ventilation. The fourth patient had 2 previous caesarean sections and

62
presented in spontaneous labour. She developed PPH due to uterine atony after an
emergency caesarean section and required a total abdominal hysterectomy. The fifth patient
developed PPH as a result of uterine rupture due to a previous classical caesarean section.
The remaining two patients required ventilation in ICU post caesarean section. One patient
was known with rheumatic heart disease and developed a lower respiratory tract infection and
the other patient suffered a cardiac arrest in theatre while undergoing caesarean section for
fetal distress. The cardiac arrest was presumed to be anaesthetic related.
The maternal death occurred in a patient with spinal muscular atrophy III and one previous
caesarean section who underwent an elective caesarean section and was admitted to ICU
postoperatively for monitoring. She was extubated in theatre. However, she developed a
pulmonary embolus on day 1 post caesarean section and demised in ICU.
63
6. Discussion
6.1 Caesarean section rate
The caesarean section rate is an important indicator of access to essential obstetric care.
Similar to the global phenomenon of escalating caesarean delivery, there is concern that
caesarean birth rates are increasing in the public health sector in South Africa.
In the current study the caesarean section rate was 39.4% at CHBAH. However, this is not
the true caesarean delivery rate as it is not reflective of the population studied. CHBAH
receives referrals from numerous MOUs and primary health care clinics in the area.
Therefore the true caesarean section rate would need to take into account the number of live
vaginal births occurring at these referral centres. However, the caesarean delivery rate of
39.4% is consistent with published data citing national rates of caesarean section of
approximately 37% at tertiary centres in 2011/2012. The national average caesarean birth
rates are in fact much lower as discussed.76, 77
The caesarean section rate, on its own, is an insufficient indicator of health care and is
determined by maternal and fetal well-being. As CHBAH is a tertiary referral centre which
manages high-risk pregnancies, the 15% suggested by the WHO may be less realistic in our
setting.7, 12, 55
6.2 Indications for caesarean section
Caesarean sections have important long-term implications for women of reproductive age yet
they remain a common surgical procedure. It is therefore important to determine the reasons
for caesarean section at an institutional level which provides data about the management of
labour and delivery in a particular facility.74
64
Demographic and history of index pregnancy
The average age of women undergoing caesarean section at CHBAH was 27.4 years. Similar
to data from other countries, the majority of caesarean sections were performed in the 20-29
year age group which represents the most reproductively active group.63 In addition most
patients (34.7%) who had a caesarean delivery were nulliparous. Caesarean sections in these
women may have future implications on health care by increasing the number of women with
scarred uteri thereby potentially increasing future caesarean delivery rates.32
Indications for caesarean sections in the study
The 3 main clinical indications for caesarean section in this study were fetal distress (44.8%),
previous caesarean section (23.3%) and dystocia (12.7%).
These results are not dissimilar to research undertaken in the public health sector in South
Africa and across the world in which fetal distress, dystocia, previous caesarean section and
breech presentation made up the majority of indications for caesarean section.25, 26, 29, 74
However, the results are different to studies conducted at private institutions in South Africa
where 74.5% of caesarean sections are for maternal request.27, 28
a. Fetal distress:
Although fetal distress is a frequent indication for caesarean section worldwide, the rates of
fetal distress are significantly higher in South Africa. At CHBAH, fetal distress is the most
common indication for caesarean section accounting for 44.8% of caesarean deliveries
compared to 9.1% in the United Kingdom.28 This stark difference can be attributed to the
method of diagnosis of fetal distress. At CHBAH, electronic fetal monitoring is used to
diagnose fetal distress. Randomised controlled trials have demonstrated that electronic fetal
monitoring results in higher caesarean delivery rates without improving neonatal outcomes.

65
According to the World Health Organisation, the fetal heart rate should be monitored by
intermittent auscultation during the first stage of labour and this should be done more
frequently during the second stage. EFM should be used in carefully selected patients e.g.
patients undergoing induction of labour.6 The protocol at CHBAH is consistent with the
WHO recommendations. However, due to the risk profile of the patients managed at this
referral facility, the majority of patients have electronic fetal monitoring during labour.82
Improving fetal monitoring during labour may potentially reduce the caesarean delivery rate.
b. Previous caesarean section:
The results of this study emphasise the self-perpetuating effect of caesarean sections.
Previous caesarean section was responsible for 23.3% of caesarean sections performed in our
study. The practice of elective repeat caesarean section has been difficult to dispel and has
been cited as being a major factor in the increase in caesarean deliveries worldwide.16
Previous caesarean deliveries and its role in the caesarean section rate will be addressed later.
c. Dystocia:
Dystocia was the indication for caesarean section in 12.7% of patients. Nulliparous patients
have a greater risk of dystocia as evidenced in the above study where 61.2% of caesarean
sections for dystocia were performed in nulliparous patients. Of concern is the fact that
dystocia was the indication for caesarean delivery in 25% of multiparous women in
spontaneous labour when it well known that dystocia is relatively uncommon in parous
patients. The diagnosis and standard management of labour in these patients may require
review as this is traditionally a low-risk group.16, 55Dystocia may also be targeted as an
indication to reduce caesarean section rates. Skilled pelvic examination to exclude CPD, the
use of the partogram to monitor and manage labour, judicious administration of oxytocin to
augment labour, as well as the presence of a trained labour companion may reduce caesarean

66
sections for dystocia.7-9, 28 As discussed previously, the presence of a supportive companion
during labour not only shortens labour duration but also reduces the likelihood of emergency
caesarean delivery. Current policy at Chris Hani Baragwanath Academic Hospital does not
allow for the presence of a companion in labour and this may be a strategy to consider in
reducing caesarean section rates, as well as improving patient satisfaction.
d. HIV:
The impact of HIV infection on caesarean sections at CHBAH should not be underestimated.
Although, HIV infection, on its own, is not an indication for caesarean section in our setting,
it may influence an individual’s decision with regard to repeat caesarean delivery. HIV
infection may also have a substantial impact on caesarean sections for dystocia. Artificial
rupture of membranes which is an effective technique in the induction and augmentation of
labour is avoided in HIV-infected patients where imminent delivery cannot be guaranteed due
to the higher risk of perinatal transmission. This may increase the number of caesarean
sections performed for failure to progress or dystocia.7, 8, 82
e. Other:
Other common indications for caesarean section, in particular hypertensive complications and
antepartum haemorrhage, further allude to the possibility that the caesarean section rate at
CHBAH may be appropriate due to the high risk profile of the patients that are managed at
this institution.
The analysis of the indications for caesarean section at CHBAH has suggested important
areas of focus for research for example; it may prove useful to evaluate the efficacy of
caesarean delivery for particular indications. The findings also suggest the need to put into

67
place clinical protocols for common indications for caesareans section to ensure caesarean
sections are conducted when appropriate and to enhance clinical effectiveness.
6.3 The Robson Ten Group Classification System: Analysis
This study used the Robson Ten Group Classification System to highlight the particular
subgroups of women who make the most significant contributions to the caesarean section
rate within the study setting.
The high caesarean section rate in our institution is attributed to the women with previous
caesarean deliveries at term (group 5) and nulliparous patients in spontaneous labour at ≥ 37
weeks (group 1). Groups 3 and 10 are also responsible for a significant amount caesarean
sections performed in this population. Similar findings were reported in previous studies
with the exception of group 3 which is usually associated with a low rate of caesarean birth.31,
55, 60
Data from Kalafong Hospital, also in the Gauteng Province in South Africa, demonstrated
high caesarean section rates in groups 1, 3 and 5. The Baltimore Group on Caesarean Section
suggested that the high rates of caesarean delivery in these groups could be attributed to poor
pain relief in labour. It was also suggested that an improvement in the diagnosis and routine
management of labour is required.31
The previous caesarean section group (group 5) and primigravid groups (groups 1 & 2)
accounted for almost half (48.9%) of caesarean sections performed. This is in keeping with
other institutions where these groups account for 50% of caesarean sections.58, 62
The contribution of the primary caesarean section rate to the overall caesarean rate by single,
cephalic, term pregnancies namely groups 1, 2, 3 & 4 was 49.1% in this study which
68
correlates with other research from centres across the globe where the primary caesarean rate
was approaching 50%.58, 62
6.3.1 Analysis of Each group
a. Groups 1 and 2 (nulliparous, singleton, cephalic pregnancy ≥ 37 weeks in spontaneous
labour and on induction of labour or caesarean section before the onset of labour).
Nulliparous patients at term made up a quarter (25.2%) of caesarean sections (groups 1 and
2). In most studies conducted using the TGCS, groups 1 and 2 were the second and third
largest contributors to the caesarean section rate.
Group 1 is the most important group in any obstetric population because it has the most
variation in terms of management and outcomes. In both groups 1 and 2 fetal distress and
dystocia were the commonest indications for caesarean section. Research shows that almost
99% of the variation in the caesarean delivery rate can be explained by the caesarean section
rate in groups 1 and 2. Research also indicates that a reduction in induction of labour in
nulliparous patients (group 2) is associated with a reduction in the caesarean rate. Non-
medicalization, especially in the first pregnancy is therefore an important strategy in reducing
the caesarean section rate.55, 57-59
b. Group 3: (multiparous patients without a previous caesarean section who enter labour
spontaneously at term).
This group usually constitutes the largest proportion of the obstetric population as has been
discussed in the literature review.55, 64
In the current study, group 3 was the third largest contributor to the caesarean rate accounting
for 15.9% of cases performed. Fetal distress and dystocia were the indications for caesarean
section in 96.4% of patients in this group. Therefore the large contribution to the caesarean

69
section rate made by this group could be because of the large number of patients in this group
in the general obstetric population or because caesarean sections are being unnecessarily
performed, for example over-diagnosis of fetal distress or mismanagement of the active stage
of labour
c. Group 5 (previous caesarean section, singleton, cephalic pregnancy ≥ 37 weeks).
Group 5, on its own, is the largest contributor to the caesarean section rate accounting for
almost a quarter (23.7%) of caesarean sections performed. This is consistent with institutions
around the world.55, 57-59
As per protocol at Chris Hani Baragwanath Hospital, only patients with one previous lower
segment caesarean section are eligible for VBAC. These patients are offered a choice of
mode of delivery, if suitable for VBAC, after comprehensive antenatal counselling. Patients
who opt for elective repeat caesarean section may present in labour and are booked for
emergency caesarean section but may deliver vaginally while awaiting caesarean section.
In the current study there were 125 patients in group 5. Ninety-four (75.2%) of these patients
had one previous caesarean section. Fetal distress and failed VBAC was responsible for the
majority of caesarean sections in patients with one previous caesarean delivery (57.4%).
Group 5 contributes most significantly to the caesarean section rate, as discussed in the
literature review. VBAC should be encouraged in patients with a single low transverse
caesarean scar.65, 71, 72 The large number of patients with failed VBAC in this study is of
concern.
The Baltimore Group on Caesarean Sections suggests that the high rates of caesarean
delivery in patients with a previous caesarean section in South Africa appear to be due to
poor pain control in labour.31 At Chris Hani Baragwanath Academic Hospital, opiates

70
(pethidine) are predominantly used for analgesia in labour. Epidural analgesia is limited by
human resources. Appropriate analgesia should be prioritised in these patients and the
presence of a doula (labour companion) should be advocated.
d. Groups 6-9 (deliveries complicated by breech presentation, abnormal lie and multiple
pregnancies).
Although the caesarean rates in these groups may be high, the groups account for a small
proportion of the obstetric population and therefore their contribution to the caesarean section
rate is low. For instance, group 9 was only responsible for 1.7% of caesarean sections in the
current study but a 100% caesarean delivery rate within the group is expected. Almost all
studies internationally showed comparable results in these groups.62, 64
External cephalic version is an important clinical procedure to reduce the caesarean section
rate in this population and is encouraged from 36 weeks gestation unless contraindications
exist as per hospital protocol.16, 22, 24, 82 HIV infection may again have an impact on caesarean
sections in this category because in our setting, external cephalic version is contraindicated in
HIV-infected patients who are not on anti-retroviral therapy.
Interventions to reduce caesarean delivery rates in groups 6-9 may result in only a modest
impact on the overall caesarean birth rate due to the small size of these groups in the general
population.55
e. Group 10 (patients with single, cephalic pregnancies at ≤ 36 weeks).
This group includes patients with previous caesarean section. Group 10 was the 4th largest
contributor to the caesarean section rate at CHBAH (15.8%). Similar results were noted at a
tertiary university hospital in Singapore.61. Of interest, in our study, 53.0% of patients in
group 10 had comorbid disease. There were an additional 7 (8.4%) caesarean sections for

71
fetal complications such as abnormal liquor volumes and abnormal umbilical artery Doppler
studies etc. Due to the vast range of maternal and fetal complications in group 10, it may be
difficult to safely reduce the caesarean section rate in this group.55, 60
Application of the TGCS enabled a detailed analysis of the caesarean sections conducted at
CHBAH. The TGCS with additional data regarding indications for caesarean delivery
provided detailed information about the delivery unit. Stratification of caesarean deliveries
using the TGCS also provided baseline data from which further analysis can be undertaken.
It is anticipated that the results will aid in the development of initiatives to reduce the
caesarean section rates in the largest groups.
6.4 Near-miss
The near-miss ratio was 24.7 cases per 1000 deliveries. This ratio falls within the wide range
of near-miss ratios quoted in the literature of between 0.7 - 119.9 cases per 1000 deliveries.41
It is important to bear in mind that the near-miss ratio is influenced by the definition of near-
miss used.
The rate of comorbid disease amongst patients that experienced near-miss was 84.6% and
most (61.5%) patients required a preterm delivery due to comorbid disease. Hypertension
was the most commonly occurring comorbidity (69.2%). These results are supported by
findings at a tertiary centre in Brazil where women with near-miss were found to have an
earlier interruption of the pregnancy and a higher caesarean section rate when compared to
other patients. In addition, 46% of women with near-miss had a significant comorbid disease
most commonly pre-eclampsia.41 The WHOGS in Africa, found that pre-eclampsia was a
significant risk factor for maternal mortality as well as neonatal morbidity and mortality.75
72
An important finding in this study is the low complication rate associated with caesarean
delivery at CHBAH. This is in contrast to the Saving Mothers Report in which 26.2% of
maternal deaths were due to bleeding at or after caesarean delivery.79 This low complication
rate indicates the high level of skill that is available at CHBAH. In terms of near-miss, the
caesarean section was rarely causative (n=3; 23.1%). In most cases, morbidity was due to the
indication for caesarean delivery rather than to the operation itself. There were 3 cases in
which the caesarean section could be considered contributory to the near-miss:
a) Primary PPH requiring peri-partum hysterectomy following a caesarean
section performed in a patient with two previous caesarean sections.
b) Primary PPH due to emergency caesarean section for a ruptured uterus in a
patient with a previous classical uterine incision.
c) Cardiac arrest in a patient requiring caesarean section due to fetal distress
which was considered to be due to anaesthetic related complications.
Interestingly both patients, whose morbidity was directly related to caesarean section, had a
previous caesarean delivery. This highlights the significant impact of repeat caesarean
delivery on maternal morbidity.
The above results demonstrate that pre-eclampsia and postpartum haemorrhage are the most
important initiating factors of near-miss occurring in 76.9% of patients. These findings are
not dissimilar to other studies conducted in South Africa and around the world with regard to
near-miss. A prospective multicentre 2 year audit of near-misses in 3 cities in South Africa
revealed that the most common initiating conditions of near-miss were hypertension,
haemorrhage, abortion and puerperal sepsis.39 Similarly, PPH, abortion, pre-existing
maternal disease and non-pregnancy related infections were responsible for most cases of
near-miss in another study in South Africa.42
73
Evaluating near-miss in addition to maternal mortality significantly increased the amount of
cases identified in this study. This provided valuable information about the disease profile of
the population as well as major obstetric complications experienced.
We may conclude that caesarean delivery may be a marker for serious existing comorbid
disease, which are associated with increased mortality and morbidity, rather than a risk itself.
Often urgent delivery is required in these patients and vaginal delivery may prove difficult.
High caesarean section rates may therefore be acceptable in these patients. Severe comorbid
disease may therefore actually be a determinant for near-miss as well as a determinant of the
caesarean section rate.
6.5 Future Research
Future research into alternative methods of fetal monitoring for high-risk patients and its
effect on the caesarean section rate should be considered. Research should also evaluate
near-miss on an intention to treat basis.

74
7. Limitations of the study
The high rate of caesarean delivery observed in this study cannot be directly extrapolated to
the whole country or region because the study population is not representative of South
Africa as a whole. Rather, it reflects the situation in tertiary institutions which typically cater
to patients with a high-risk profile.
In terms of The Robson Ten Group Classification System, one of the major limitations of this
study was failure to analyse spontaneous and operative vaginal deliveries. By including
patients who delivered vaginally in this study, valuable information could have been gained
regarding the size of each group in the population as well as the caesarean delivery rate
within each group. Future studies at CHBAH should assess vaginal deliveries as well as
calculate the proportion of patients undergoing caesarean section for each category.
With regard to the analysis of near-miss, a limitation of this study is that data was restricted
to morbidity that occurred in hospital for a period of 48 hours after caesarean section. As a
result some outcomes may have been underestimated and the Severe Acute Maternal
Morbidity that occurs in the population cannot be inferred. A causal relationship between
caesarean delivery and near-miss cannot be established due to the design of the current study.
An ideal study design would compare near-miss in patients undergoing elective caesarean
section with those undergoing planned vaginal delivery.
Coexisting HIV infection was not included in this study. HIV infection may have a
substantial impact on caesarean delivery rates as well as Severe Acute Maternal Morbidity.
Confounding by indication was not avoidable in this study. Identifying complications caused
by the procedure itself versus those caused by the conditions that required caesarean delivery

75
was challenging. The health status of the patients in this study may have been a determinant
for caesarean delivery as well as a determinant of the health outcomes.
76
8. Strengths of the study
This study has several strengths. Data was collected prospectively and by a single researcher
which meant consistency in collection and interpretation of data. Unlike other studies using
the Robson’s TGCS, our study analysed the ten groups in conjunction with the clinical
indications for caesarean delivery which enabled a clearer understanding of the
characteristics of patients undergoing caesarean birth as well as the reasons for surgery.
Finally, the results of our study are in agreement with those observed both locally and
internationally, which further elucidates the areas where improvement can be made in
lowering the caesarean birth rate.
9. Conclusion
Defining an optimal caesarean delivery rate in our setting may not be realistic due to the wide
range in the health status of patients. The World Health Organisations recommendations of
15% for caesarean delivery rates globally may need to be adapted to take into account the
patient profile and morbidity in South Africa.
Improving access to quality medical services rather than focusing on the mode of delivery
should be our primary concern. What matters most is that women who require caesarean
section should receive one timeously and under optimal conditions. Those who do not
require caesarean delivery, should receive appropriate care and support during labour. Not
only will this improve patient satisfaction, but will also minimise maternal and perinatal
morbidity and mortality
The caesarean section rate cannot be preordained as it is determined by the health status of
patients as well as subjective clinical decisions. Ensuring equal access to good quality,

77
medically appropriate obstetric care should be our primary concern. We should not pursue a
statistical ideal.
In the meanwhile we may conclude that to achieve optimal outcomes we should “Let
everyone practise the best obstetrics they know, and let the caesarean sections rate seek its
own level”.83

78
10. References
1. Cronjé HS, Cilliers JBF, Pretorius MS (Eds.). Clinical Obstetrics a South African perspective. 3rd ed. Pretoria: Van Schaik Publishers; 2011.
2. Sarris I, Bewley S, Agnihotri S (Eds.). Training in obstetrics and gynaecology the essential curriculum. New Work: Oxford University Press; 2009.
3. Zink, Christoph (Ed.). Dictionary of Obstetrics and Gynecology. Berlin, Boston: De Gruyter, 1988.
4. Lurie S. The changing motives of caesarean section: from ancient world to the twenty-first century. Arch Gynecol Obstet 2005; 271: 281-285.
5. Todman D. A history of caesarean section: from ancient world to the modern era. Aust N Z J Obstet Gynaecol 2007; 47: 357-361.
6. World Health Organisation. Appropriate technology for birth. Lancet 1985; 2(8452): 436-7.
7. Gibbons L, Belizán JM, Lauer JA, Betrán AP, Merialdi M, Althabe F. The global numbers and costs of additionally needed and unnecessary caesarean sections performed per year: overuse as a barrier to universal coverage. In World Health Report 2010 Background Paper, No 30. Edited by: World Health Organisation. Geneva.
8. Betrán AP, Merialdi M, Lauer JA, Bing-Shun W, Thomas J, Van Look P, et al. Rates of caesarean section: analysis of global, regional and national estimates. Paediatr Perinat Epidemiol 2007; 21(2): 98-113.
9. Villar J, Valladares E, Wojdyla D, Zavaleta N, Shah A, Campodónico L, et al. Caesarean delivery rates and pregnancy outcomes: the 2005 WHO global survey on maternal and perinatal health in Latin America. Lancet 2006; 367(9525): 1819-29.
10. Althabe F, Sosa C, Belizán JM, Gibbons L, Jacquerioz F, Bergel E. Caesarean section rates and maternal and neonatal mortality in low-, medium-, and high-income countries: An ecological study. Birth 2006; 33(4): 270-277.
11. Gibbons L, Belizan JM, Lauer JA, Betrán AP, Merialdi M, Althabe F. Inequalities in the use of caesarean section deliveries in the world. Am J Obstet Gynecol 2012; 206 (4): 331.
12. Pai M. Unnecessary medical interventions: caesarean sections as a case study. Economic and Political Weekly 2000; 35: 2755-61.
13. FC Notzon, PJ Placek, SM Taffel. Comparison of national caesarean section rates. N Engl J Med 1987; 316: 386-389.
14. Niino Y. The increasing cesarean rate globally and what we can do about it. Biosci Trends 2011; 5(4): 139-150.
15. Ronsmans C, Holtz S, Stanton C. Socioeconomic differentials in caesarean rates in developing countries: a retrospective analysis. Lancet 2006; 368: 1516-23.
16. Porreco RP, Thorp JA. The caesarean birth epidemic: trends, causes, solutions. Am J Obstet Gynecol 1996; 175: 369-74.
17. Parrish KM, Holt VL, Easterling TR, Connell FA, LoGerfo JP. Effect of changes in maternal age, parity, and birth weight distribution on primary caesarean delivery rates. JAMA 1994; 271: 443-47.
18. Thomas J, Callwood A, Brocklehurst P, Walker J. The national sentinel caesarean section audit. Br J Obstet Gynaecol 2000; 107(5): 579-80.
19. Kaimal AJ, Kuppermann M. Decision making for primary caesarean delivery: the role of patient and provider preferences. Seminars in Perinatology 2012; 36(5): 384-89.

79
20. Minkoff H, Chervenak FA. Elective primary caesarean delivery. N Engl J Med 2003; 348: 946-50.
21. Anderson GM. Making sense of rising caesarean section rates: time to change our goals. BMJ 2004; 329(7468): 696-97.
22. Placek PJ, Taffel SM. Trends in caesarean section rates for the United States, 1970-78. Public Health Reports 1974; 95(6): 540-48.
23. Department of Health. Changing Childbirth: The report of the expert maternity group. London: HSMO, 1993.
24. Haanah ME, Haanah WJ, Hewson SA, Hodnett ED, Saigal S, Willan AR. Planned caesarean section versus planned vaginal birth for breech presentation at term: A randomized multicentre trial. Lancet 2000; 356: 1375- 1382.
25. Leitch CR, Walker JJ. The rise in caesarean section rate: the same indications but a lower threshold. Br J Obstet Gynaecol 1998; 105(6): 621-6.
26. Häger R, Øian P, Nilsen ST, Holm HA, Berg AB. The breakthrough series on caesarean section. Tidsskr Nor Laegeforen 2006; 126(2): 173-5.
27. Tshibangu KC, de Jongh MA, de Villiers DJ, du Toit JJ, Shah SMH. Incidence and outcome of caesarean section in the private sector- 3-year experience at Pretoria Gynaecological Hospital. S Afr Med J 2002; 92(12): 956-9.
28. Naidoo N, Moodley J. Rising rates of caesarean sections: an audit of caesarean sections in a specialist private practice. SA Fam Pract 2009; 51(3): 254-8.
29. Moodliar M, Moodley J. Complications following caesarean delivery at King Edward VIII hospital, Durban, South Africa. Obstetrics & Gynaecology Forum 2004; 14(3): 21-26.
30. Dumont A, de Bernis L, Bouvier-olle MH, Bréart G. Caesarean section rate for maternal indication in sub-Saharan Africa: a systematic review. Lancet 2001; 358: 1328-334.
31. Stanton, C., Ronsmans, C. and the Baltimore Group on Cesarean. Recommendations for Routine Reporting on Indications for Cesarean Delivery in Developing Countries. Birth 2008; 35: 204–211.
32. Sultan AH, Stanton SL. Preserving the pelvic floor and perineum during childbirth-elective caesarean section? Br J Obstet Gynaecol 1996; 103(8): 731-34.
33. Amu O, Rajendran S, Bolaji II. Maternal choice alone should not determine method of delivery. BMJ 1998; 317(7156): 463-5.
34. Belizán JM, Althabe F, Cafferata ML. Health consequences of the increasing caesarean section rates. Epidemiology 2007; 18(4): 485-6.
35. Snyman L. Is the high caesarean section rate a cause for concern? Obstet Gynaecol Forum 2002; 12(2): 8-13.
36. Petitti DB. Maternal mortality and morbidity in caesarean section. Clin Obstet Gynecol 1985; 28(4): 763-69.
37. Lilford RJ, Van Coeverden De Groot HA, Moore PJ, Bingham P. The relative risks of caesarean section (intrapartum and elective) and vaginal delivery: a detailed analysis to exclude the effects of medical disorders and other acute pre-existing physiological disturbances. Br J Obstet Gynaecol 1990; 97: 883-92.
38. Say L, Souza JP, Pattinson RC. Maternal near miss- towards a standard tool for monitoring quality of maternal health care. Best Pract Res Clin Obstet Gynaecol 2009; 23: 287-296.
39. Mantel GD, Buchmann E, Rees H, Pattinson RC. Severe acute maternal morbidity: a pilot study of a definition for a near-miss. Br J Obstet Gynaecol 1998; 105: 985-990.

80
40. Souza JP, Gülmezoglu AM, Carroli G, Lumbiganon P, Qureshi Z. The World Health Organisation multicountry survey on maternal and newborn health: study protocol. BMC Health Serv Res 2011; 11: 286.
41. Souza JP, Cecatti JG, Parpinelli MA, Serruya SJ, Amaral E. Appropriate criteria for identification of near-miss maternal morbidity in tertiary care facilities: a cross sectional study. BMC Pregnancy and Childbirth 2007; 7: 20.
42. Cochet L, Pattinson RC, Macdonald AP. Severe acute maternal morbidity and maternal death audit -a rapid diagnostic tool for evaluating maternal care. SAMJ 2003; 93(9): 700.
43. Souza JP, Gülmezoglu AM, Vogel JV, Carroli G, Lumbiganon P, Qureshi Z et al. Moving beyond essential interventions for reduction of maternal mortality (the WHO Multicountry Survey on Maternal and Newborn Health): a cross-sectional study. Lancet 2013; 381: 1747-55.
44. Souza JP, Cecatti JG, Haddad SM, Parpinelli MA, Costa MA, Katz L et al. The WHO Maternal Near-Miss Approach and the Maternal Severity Index Model (MSI): Tools for Assessing the Management of Severe Maternal Morbidity. PLoS ONE 2012; 7(8): e44129.
45. van Roosmalen J, Zwart J. Severe acute maternal morbidity in high-income countries. Best practice & Research Clin Obstet Gynecol 2009; 23: 297-304.
46. Lumbiganon P, Laopaiboon M, Gülmezoglu AM, Souza JP, Taneepanichskul S, Ruyan P, et al. Method of delivery and pregnancy outcomes in Asia: the WHO global survey on maternal and perinatal health 2007-08. Lancet 2010; 375: 490-99.
47. Clark SL, Belfort MA, Dildy GA, Herbst MA, Meyers JA, Hankins GD. Maternal death in the 21st century: causes, prevention, and relationship to caesarean delivery. Am J Obstet Gynecol 2008; 199(1): 36.e1-36.e5.
48. Souza JP, Gülmezoglu AM, Lumbiganon P, Laopaiboon M, Carroli G, Fawole B, et al. Caesarean section without medical indications is associated with an increased risk of adverse short-term maternal outcomes: the 2004-2008 WHO Global Survey on Maternal and Perinatal Health. BMC Medicine 2010; 8: 71.
49. Villar J, Carroli G, Zavaleta N, Donner A, Wojdyla D, Faundes A, et al. Maternal and neonatal individual risks and benefits associated with caesarean delivery: multicentre prospective study. BMJ 2007; 335: 1025-29.
50. National Collaborating Centre for Women’s and Children’s Health. Commissioned by the National Institute for Clinical Excellence. Caesarean Section Clinical Guideline. April 2004.
51. Pallasmaa N, Ekblad U, Gissler M. Severe maternal morbidity and the mode of delivery. Acta Obstet Gynecol Scand 2008; 87: 662-68.
52. Kolas T, Saugstad OD, Daltveit AK, Nilsen ST, Øian P. Planned caesarean versus planned vaginal delivery at term: Comparison of newborn infant outcomes. Am J Obstet Gynecol 2006; 195(6): 1538-43.
53. Shearer EL. Cesarean section: medical benefits and costs. Soc Sci Med 1993; 37: 1223-31.
54. Torloni MR, Betrán AP, Souza JP, Widmer M, Allen T, Gulmezoglu M, et al. Classifications for caesarean section: a systematic review. PLoS ONE 2011; 6(1): e14566.
55. Robson MS. Can we reduce the caesarean section rate? Best Practice and Research Clinical Obstetrics & Gynaecology 2001; 15(1): 179-194.
56. Farine D, Shepherd D. Classification of caesarean sections in Canada: the Modified Robson Criteria. J Obstet Gynaecol Can 2012; 34(10): 976-79.
81
57. Slavin V, Fenwick J. Use of a classification tool to determine groups of women that contribute to the caesarean section rate: establishing a baseline for clinical decision making and quality improvement. International Journal of Childbirth 2012; 2(2): 85-94.
58. Brennan DJ, Robson MS, Murphy M, O’Herlihy C. Comparative analysis of international caesarean delivery rates using 10-group classification identifies significant variation in spontaneous labour. Am J Obstet Gynecol 2009; 201: 308.e1-8.
59. Stavrou EP, Ford JB, Shand AW, Morris JM, Roberts CL. Epidemiology and trends for caesarean section births in New South Wales, Australia: A population-based study. BMC Pregnancy and Childbirth 2011; 11:8.
60. Chong C, Su LL, Biswas A. Changing trends of caesarean section births by the Robson Ten Group Classification in a tertiary teaching hospital. Acta Obstet Gynecol Scand 2012; 91: 1422-27.
61. Costa ML, Cecatti JG, Souza JP, Milanez HM, Gülmezoglu MA. Using a caesarean section classification system based on characteristics of the population as a way of monitoring obstetric practice. Reprod Health 2010; 7: 13.
62. Kazmi T, Sarva Saiseema V, Khan S. Analysis of caesarean section rate- according to Robson’s 10-group classification. Oman Med J 2012; 27(5): 415-7.
63. Ebrashy AE, Kassab A, Nada A, Saleh WF, Soliman A. Caesarean section in a university and general tertiary hospitals in Cairo; Egypt: rates, indications and limits. KAJOG 2011; 2(1): 20-26.
64. Betrán AP, Gulmezoglu AM, Robson M, Merialdi M, Souza JP, Wojdyla D et al. WHO global survey on maternal and perinatal health in Latin America: classifying caesarean sections. Reprod Health 2009; 6: 18.
65. Walker R, Turnbull D, Wilkinson C. Strategies to address global caesarean section rates: A review of the evidence. Birth 2002; 29(1): 28-39.
66. Sachs BP, Kobelin C, Castro MA, Frigoletto F. The risks of lowering the caesarean delivery rate. N Engl J Med 1999; 340(1): 54-7.
67. Lowe NK. A review of factors associated with dystocia and caesarean section in nulliparous women. Journal of Midwifery & Women’s Health 2007; 52: 216-28.
68. Pattinson RC, Howarth GR, Mdluli W, Macdonald AP, Makin JD, Funk M. Aggressive or expectant management of labour: a randomised clinical trial. BJOG 2003; 110: 457-61.
69. Brown H, Hofmeyr JG, Nikodem CV, Smith H, Garner P. Promoting childbirth companions in South Africa: a randomised pilot study. BMC Medicine 2007; 5: 7
70. Moran NF. Avoiding unnecessary caesarean sections: a key strategy for reducing obstetric haemorrhage deaths. O&G Forum 2013; 23: 21-6.
71. Rossi CA, D’Addario V. Maternal Morbidity following a trial of labor after caesarean section vs elective repeat caesarean delivery: a systematic review with metaanalysis. Am J Obstet Gynecol 2008; 199(3): 224-31.
72. McMahon MJ, Luther ER, Bowes WA, Olshan AF. Comparison of a trial of labour with an elective second caesarean section. N Engl J Med 1996; 335: 689-95.
73. Paul RH, Miller DA. Caesarean birth: How to reduce the rate. Am J Obstet Gynecol 1995; 172: 1903-11.
74. Anderson GM, Lomas J. Determinants of the increasing caesarean birth rate-Ontario Data 1979 to 1982. N Engl J Med 1984; 311: 887-92.
75. Shah A, Fawole B, M’Imunya JM, Amokrane F, Nafiou I, Wolomby JJ, et al. Cesarean delivery outcomes from the WHO global survey on maternal and perinatal health in Africa. Int J Gynaecol Obstet 2009; 107(3): 191-7.

82
76. Ataguba JE, McIntyre D. Paying for and receiving benefits from health services in South Africa: is the health system equitable? Health Policy and Planning 2012; 27: 135-145.
77. Hogan M, Foreman KJ, Naghavi M, Ahn SY, Wang M, Makela SM. Maternal Mortality for 181 countries, 1980-2008: a systematic analysis of progress towards Millennium Development Goal 5. Lancet 2010; 375 (9726): 1609-1623.
78. Childbirth in South Africa. Available at: http://www.birthways.co.za/inspired.php Accessed 8 February 2013.
79. National Committee for Confidential Enquiry into Maternal Deaths. Saving Mothers 2008-2010. Fifth Report on the Confidential Enquiries into Maternal Deaths in South Africa. Pretoria: National Department of Health; 2012.
80. Fawcus S, Moodley J. Haemorrhage associated with caesarean section in South Africa: be aware. S Afr Med J 2011; 101(5): 306-9.
81. Moran NF. Avoiding unnecessary caesarean sections: a key Strategy for reducing obstetric haemorrhage deaths. O&G Forum 2013; 23: 21-26.
82. Buchmann EJ (Ed.). Guidelines for the Department of Obstetrics and Gynaecology at Chris Hani Baragwanath Hospital. 3rd ed, Department of Obstetrics and Gynaecology, School of Clinical Medicine, Faculty of Health Sciences, University of the Witwatersrand; 2007.
83. Cyr RM. Myth of the ideal caesarean section rate: Commentary and historic perspective. Am J Obstet Gynecol 2006; 194:932-6.

83
11. Appendix
Appendix 1: The WHO maternal near-miss criteria.
Organ Dysfunction Identification Criteria
Cardiovascular Dysfunction • Shock • Use of continuous vasoactive drugs • Cardiac arrest • Cardio-pulmonary resuscitation • Sever hypoperfusion (lactate > 5mmol/L) • Sever acidosis (pH < 7.1)
Respiratory Dysfunction • Acute cyanosis
• Gasping • Severe tachypnoea (respiratory rate > 40bpm) • Severe bradypnoea (respiratory rate< 6bpm) • Severe hypoxemia (PAO2/FIO2 , 200 or SaO2
< 90% for ≥ 60 min) • Intubation and ventilation not related to
anaesthesia
Renal Dysfunction • Oliguria non-responsive to fluids/ diuretics • Dialysis for acute renal failure • Sever acute azotaemia (creatinine ≥
300µmol/L)
Coagulation/ Haematologic Dysfunction • Failure to form clots • Massive transfusion of blood or red cells (≥ 5
units) • Severe acute thrombocytopenia (< 50 000
platelets/ml)
Hepatic Dysfunction • Jaundice in the presence of pre-eclampsia. • Sever acute hyperbilirubinaemia (bilirubin
>100µmol/L)
Neurologic Dysfunction • Prolonged unconsciousness (lasting ≥12 hours)/ coma (including metabolic coma)
• Stroke • Status epilepticus/ uncontrollable fits • Total paralysis
Uterine Dysfunction • Haemorrhage or infection leading to
hysterectomy

84
Appendix 2: The Four Key Obstetric Concepts which form the basis for the Robson TGCS
Table 1:
The Category of the Pregnancy
Single cephalic pregnancy
Single breech pregnancy
Single oblique or transverse lie
Multiple pregnancy
Table 2:
Previous Obstetric Record
Nulliparous
Multiparous (without a uterine scar)
Multiparous (with a uterine scar)
Table 3:
Current Course of Labour and Delivery
Spontaneous labour
Induced labour
Caesarean section before labour
Table 4:
Gestational Age
The gestational age in completed weeks at the time of delivery

85
Appendix 3: The Robson Ten Group Classification System
The Robson Ten Group Classification System
1 Nulliparous, single, cephalic, ≥ 37 weeks, in spontaneous labour.
2 Nulliparous, single, cephalic, ≥ 37 weeks, induced or caesarean section before labour.
3 Multiparous, single, cephalic, ≥ 37 weeks, in spontaneous labour.
4 Multiparous, single, cephalic, ≥ 37 weeks, induced or caesarean section before labour.
5 Previous caesarean section, single, cephalic, ≥ 37 weeks.
6 All nulliparous, single, breech presentation.
7 All multiparous, single, breech presentation, including previous caesarean section.
8 All multiple pregnancies, including previous caesarean section.
9 All abnormal lies, including previous caesarean section.
10 All single, cephalic, ≤ 36 weeks, including previous caesarean section.

86
Appendix 4: Data Sheet
Demographic Data:
• Study number: ___________________ • Age ___________________ • Parity: ___________________ • Gravidity: ___________________
Obstetric history:
• Gestational age: Ø Last Normal Menstrual Period (LNMP): ___________________ Ø Early ultrasound (<20/40): ___________________ Ø Late ultrasound (≥20/40): ___________________ Ø Palpation: ___________________
• Number of foetuses: ___________________
• Presentation: Cephalic/Breech/Transverse
• Previous caesarean sections:
• Number of previous caesarean sections: ___________________
• Comorbid Disease ___________________
Labour and delivery data:
o Spontaneous labour o Elective caesarean section o Induced labour:
SAMM:
• ICU admission (includes intubation and ventilation in HCA):
• Blood transfusion (> 3 units): Ø Number of units: ___________________
• Surgical intervention: Ø Re-look laparotomy:
o Indication for re-look laparotomy: ___________________
Ø Hysterectomy:
o Indication for hysterectomy: ___________________
• Prolonged intubation (> 12 hours)
• Mortality
Cause of Death ___________________
N Y
Y N
Y N

87
Appendix 5: Ethics Approval
88
Appendix 6: Turnitin Report