Caesarean section delivery in India: causes and concerns · Caesarean section delivery in India:...
20
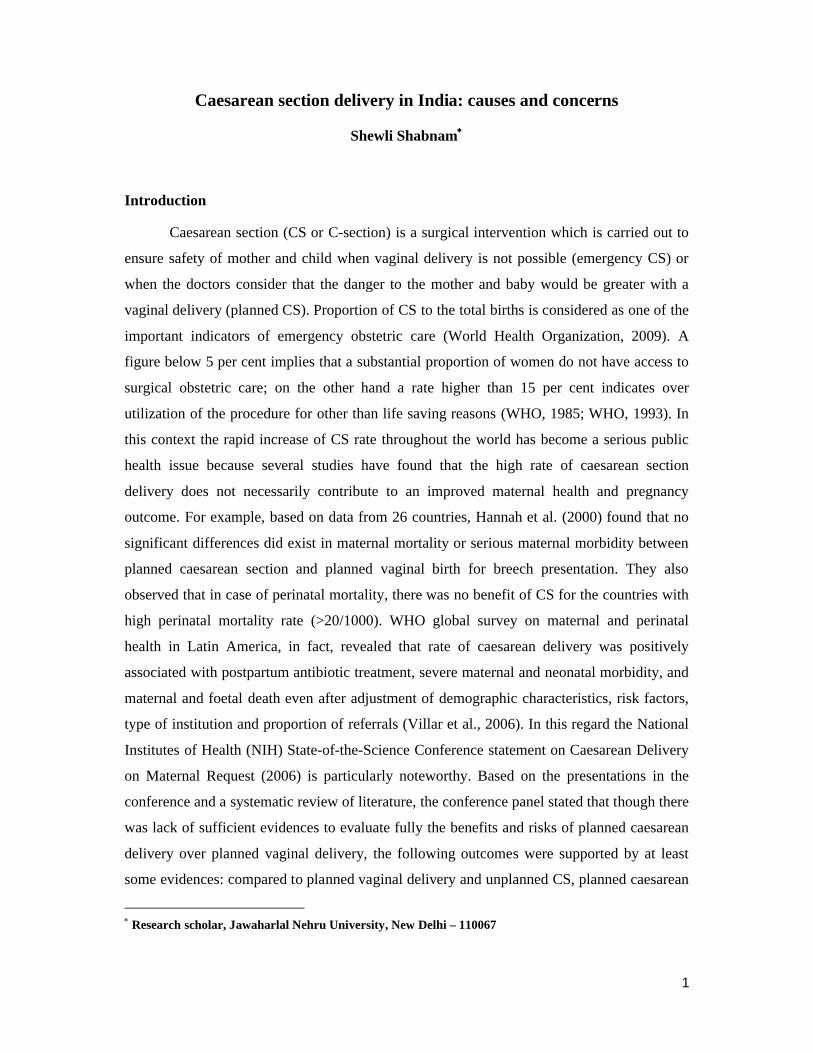
1 Caesarean section delivery in India: causes and concerns Shewli Shabnam Introduction Caesarean section (CS or C-section) is a surgical intervention which is carried out to ensure safety of mother and child when vaginal delivery is not possible (emergency CS) or when the doctors consider that the danger to the mother and baby would be greater with a vaginal delivery (planned CS). Proportion of CS to the total births is considered as one of the important indicators of emergency obstetric care (World Health Organization, 2009). A figure below 5 per cent implies that a substantial proportion of women do not have access to surgical obstetric care; on the other hand a rate higher than 15 per cent indicates over utilization of the procedure for other than life saving reasons (WHO, 1985; WHO, 1993). In this context the rapid increase of CS rate throughout the world has become a serious public health issue because several studies have found that the high rate of caesarean section delivery does not necessarily contribute to an improved maternal health and pregnancy outcome. For example, based on data from 26 countries, Hannah et al. (2000) found that no significant differences did exist in maternal mortality or serious maternal morbidity between planned caesarean section and planned vaginal birth for breech presentation. They also observed that in case of perinatal mortality, there was no benefit of CS for the countries with high perinatal mortality rate (>20/1000). WHO global survey on maternal and perinatal health in Latin America, in fact, revealed that rate of caesarean delivery was positively associated with postpartum antibiotic treatment, severe maternal and neonatal morbidity, and maternal and foetal death even after adjustment of demographic characteristics, risk factors, type of institution and proportion of referrals (Villar et al., 2006). In this regard the National Institutes of Health (NIH) State-of-the-Science Conference statement on Caesarean Delivery on Maternal Request (2006) is particularly noteworthy. Based on the presentations in the conference and a systematic review of literature, the conference panel stated that though there was lack of sufficient evidences to evaluate fully the benefits and risks of planned caesarean delivery over planned vaginal delivery, the following outcomes were supported by at least some evidences: compared to planned vaginal delivery and unplanned CS, planned caesarean Research scholar, Jawaharlal Nehru University, New Delhi – 110067
Transcript of Caesarean section delivery in India: causes and concerns · Caesarean section delivery in India:...
1
Caesarean section delivery in India: causes and concerns
Shewli Shabnam
Introduction
Caesarean section (CS or C-section) is a surgical intervention which is carried out to
ensure safety of mother and child when vaginal delivery is not possible (emergency CS) or
when the doctors consider that the danger to the mother and baby would be greater with a
vaginal delivery (planned CS). Proportion of CS to the total births is considered as one of the
important indicators of emergency obstetric care (World Health Organization, 2009). A
figure below 5 per cent implies that a substantial proportion of women do not have access to
surgical obstetric care; on the other hand a rate higher than 15 per cent indicates over
utilization of the procedure for other than life saving reasons (WHO, 1985; WHO, 1993). In
this context the rapid increase of CS rate throughout the world has become a serious public
health issue because several studies have found that the high rate of caesarean section
delivery does not necessarily contribute to an improved maternal health and pregnancy
outcome. For example, based on data from 26 countries, Hannah et al. (2000) found that no
significant differences did exist in maternal mortality or serious maternal morbidity between
planned caesarean section and planned vaginal birth for breech presentation. They also
observed that in case of perinatal mortality, there was no benefit of CS for the countries with
high perinatal mortality rate (>20/1000). WHO global survey on maternal and perinatal
health in Latin America, in fact, revealed that rate of caesarean delivery was positively
associated with postpartum antibiotic treatment, severe maternal and neonatal morbidity, and
maternal and foetal death even after adjustment of demographic characteristics, risk factors,
type of institution and proportion of referrals (Villar et al., 2006). In this regard the National
Institutes of Health (NIH) State-of-the-Science Conference statement on Caesarean Delivery
on Maternal Request (2006) is particularly noteworthy. Based on the presentations in the
conference and a systematic review of literature, the conference panel stated that though there
was lack of sufficient evidences to evaluate fully the benefits and risks of planned caesarean
delivery over planned vaginal delivery, the following outcomes were supported by at least
some evidences: compared to planned vaginal delivery and unplanned CS, planned caesarean
Research scholar, Jawaharlal Nehru University, New Delhi – 110067
2
delivery was associated with (1) a lesser risk of postpartum haemorrhage and stress urinary
incontinence, (2) an increased risk of infection, anaesthetic complications and placenta
previa, (3) greater complications in subsequent pregnancies, (4) longer hospital stay of
mothers and neonates, (5) higher risk of respiratory morbidity for infants and (6) a lower rate
of foetal mortality, birth injury, neonatal asphyxia and encephalopathy. The above findings
are also supported by some recent studies done by Tollanes (2009), Guise et al. (2010) and
Ecker J. (2013). Besides, unnecessary caesareans generate higher expenditure at individual
and national levels and have the potential to divert human and financial resources from higher
priority intervention (Lauer et al., 2010). In 2008, the cost of the global excess/unnecessary
C-section delivery was estimated approximately 2.32 billion US dollar (Gibbons et al., 2010).
In spite of these facts, CS is high and continues to rise in the developed world and in many
developing countries.
Betran and her colleagues (2007) estimated that at the beginning of twenty first
century the average CS rate was 3.5 per cent in Africa, 14.9 per cent in Oceania and in all
other continents, it was above the 15 per cent mark (15.9 per cent in Asia, 19 per cent in
Europe, 24.3 per cent in North America and 29.2 per cent Latin America and the Caribbean).
However, they observed striking variations in the rate of CS among the countries of the same
continent. In the United States of America, the proportion of caesarean birth to total births
increased from 20.7 per cent in 1996 to 31.1 per cent in 2006 (MacDorman et al., 2008). In
Brazil, C-section delivery rate has jumped from 15 per cent in 1974 to 45.9 per cent in 2008
(Chacham and Perpetuo, 1998, Gibbons et al., 2010). Many of the developing countries (e.g.,
China, Nigeria, Bangladesh etc.) have seen rapid increase in caesarean section birth in the
past two decades (Ibekwe, 2004; Sufang et al., 2007; Leone et al., 2008).
The increasing trend of CS has generated much controversy regarding the causes of
such tendency. In developing nations like China, one important reason of growing rate of CS
can be attributed to the increase of institutional births (Sufang et. al., 2007). Among other
reasons, demographic profiles of mothers (Chacham and Perpetuo, 1998; Declercq et al.,
2005), fear of litigation among caregivers (Vimercati et al., 2000; Tollanes, 2009),
physician’s convenience (Gomes et al., 1999), insurance facility and mode of hospital
payment (Remez, 1991; Bertollini et al., 1992) and profit-oriented private health care system
(Chacham and Perpetuo, 1998; Hopkins, 2000; Potter, 2001) are found to be associated to the
rise of C-section delivery. Patients’ preference for CS is regarded as a common cause behind
increasing elective caesarean delivery rate (MacDorman et al., 2008). However, a number of
studies have found that caesarean cases on maternal request are actually rare (Hopkins, 2000;
3
Potter, 2001) and many personal and societal reasons including fear of labour pain and future
sexual dissatisfaction, perceived unsympathetic and inadequate care during vaginal delivery
underpinned these requests (Mello e Souza, 1994; Oumachigui, 2006; McCourt et al., 2007).
In India the rate of caesarean section delivery has increased from 3 per cent to 10 per
cent between 1992-93 and 2005-06 (IIPS, 2007) which is lower compared to some
developing nations like Brazil and China. But as India is the second most populous country in
the world, a small percentage increase affects a huge number of people. If we follow the 1985
guideline of WHO (as in 2009 WHO stated that ‘optimum rate is unknown’ and world
regions might want to continue to use a range of 5-15% or set their own standard), at national
level the present rate of CS does not seem to be alarming but at regional level the scenario is
quite opposite. Using the data of National Family Health Survey, India, 1992-93, Mishra and
Ramanathan (2002) found that among 18 large states, two states had CS rate near 15 per cent
and the rest had less than 5 per cent. The works of Biswas et al. (2005) established that the
basic emergency obstetric care (EmOC) were inadequate and causing maternal death in many
parts of India. On the other hand, data from a large teaching hospital of Kolkata shows that
between 1990 and 1995, of all deliveries, caesarean deliveries were carried out in 50 per cent
cases (Pahari and Ghosh, 1997). Kambo et al. (2002) analyzing the data of 30 medical
colleges found that the rate of CS increased from 21.8 percent in 1993-94 to 25.4 per cent in
1998-99. Another study by Sreevidya and Sathiyasekaran (2003) revealed that in Madras city
(Chennai), between June 1997 and May 1999, the CS rate was 32.6 per cent. They also found
that private sector deliveries had a higher odds ratio of a primary C-section delivery in
comparison with public sector after covariate adjustment. Similar findings are indicated in
several other studies (Padamdas et al., 2000; Mishra and Ramanathan, 2002).
Objectives
Keeping in view the above background, present study seeks to examine the level and
trend of the caesarean section delivery in India and its states. It also tries to indentify various
factors associated with caesarean delivery in Indian context. Another objective of this study is
to understand the possible reasons of very high rate CS in some parts of India.
Data base and methodology
The dataset of District Level Household and Facility Survey (DLHS-3), 2007-08 has
been analyzed for the purpose of this study. The analysis is based on information regarding
the latest birth of ever-married women aged 15-49, who had given birth (both live and still
birth) since January 1, 2004 and reported the type of delivery. To understand the trend of the
rates of C-section delivery, along with DLHS-3, data from 1st, 2nd and 3rd round of National
4
Family Health Survey (NFHS) has been used. A logistic regression model has been used to
identify the net impact of demographic, socio-economic and institutional factors on woman’s
experience of caesarean section delivery. To understand the possible reasons of very high CS
rate, informal conversation was carried out with some doctors and patients from different
government and private hospitals.
Results
Level of caesarean section delivery in India
Based on DLHS-3 data, the caesarean section delivery rate in India is 9.2 per cent.
However, a substantial inter-state variation of CS exists in India (Table 1). Among the large
states (population 10 million and above as per 2001 census), the proportion of women who
have undergone caesarean deliveries is the highest in Kerala (31.8 per cent) followed by
Andhra Pradesh (29.3 per cent) and Tamil Nadu (23.2 per cent) and the lowest in Rajasthan
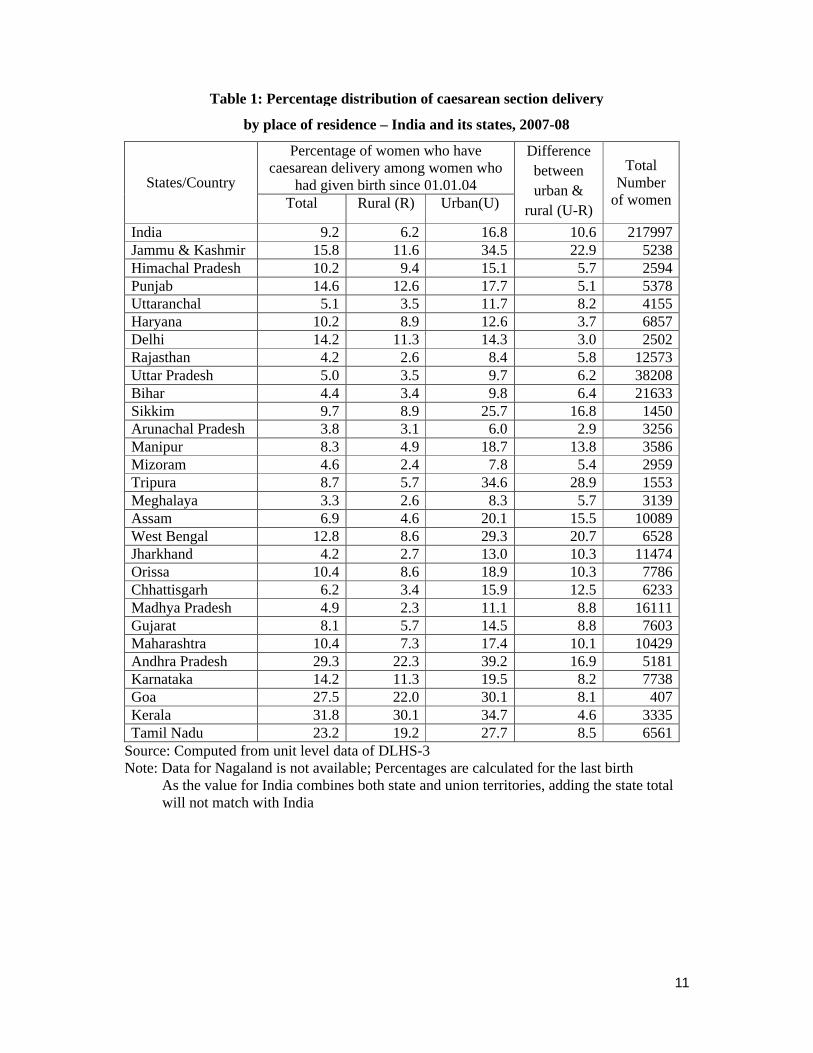
and Jharkhand (4.2 per cent in both the states). Fig 1 shows a distinct regional pattern in the
distribution of C-section birth in India. Except Karnataka, in all other southern states, C-
section delivery has crossed the WHO recommended level of 15 per cent. Among major
states, CS rate of 5 percent or lower prevails in Bihar, Jharkhand, Uttar Pradesh, Madhya
Pradesh and Rajasthan. During 2007-09, the maternal mortality ratio (MMR)1 and in 2008 the
infant mortality rate (IMR)2 in these states were also very high (Registrar General, India,
2009 and Office of Registrar General, India, 2011). So, it can be argued that these states
suffer from lack of health facilities to meet surgical obstetric needs which partly explain
higher mortality and ill health of mothers and their babies in these states.
In India the rural-urban difference between C-section rates is quite conspicuous. The
rate of CS is higher in urban areas than their rural counterparts for all the states (Table 1).
The rural-urban gap is relatively low in the states of Haryana, Delhi, Arunachal Pradesh and
Kerala (below 5 percentage points). On the other hand, the gap is very high in the states of
Jammu & Kashmir, West Bengal and Tripura (above 20 percentage points). The higher urban
rates may be a reflection of combination of factors like higher availability and utilization of
maternal health care services, larger concentration of private health institutions in the cities
and towns etc. Moreover, the demographic and socio-economic backgrounds of the persons
living in the rural and urban places affect the CS rate to a great extent. Here it should be
1 MMR measures the number of women aged 15-49 years dying due to maternal causes per 1,00,000 live births. MMR of Rajasthan, Bihar/Jharkhand, Uttar Pradesh and Madhya Pradesh during 2007-09 was 318, 261, 359and 269 respectively while the national average was 212.2 IMR (number of child died before age one per 1000 live births) in Rajasthan, Bihar, Jharkhand, Uttar Pradesh and Madhya Pradesh in 2008 was 63, 56, 46, 67 and 70 respectively while the national average was 36.
5
mentioned that among large states, Jammu and Kashmir, West Bengal, Andhra Pradesh,
Kerala and Tamil Nadu report alarmingly high (above or close to 30 percent) CS rate in urban
areas. In Andhra Pradesh, Kerala and Tamil Nadu, even in rural areas, caesarean delivery
rates are much higher than WHO recommended standard of 15 percent.
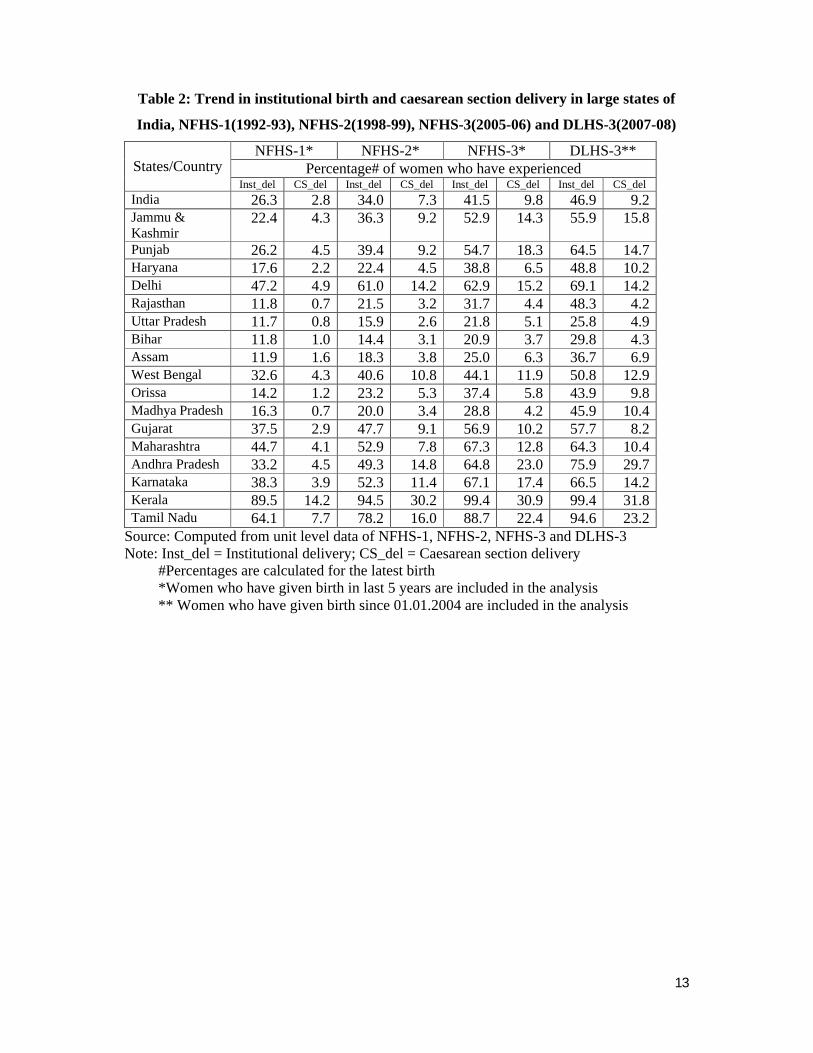
Trend in CS and institutional delivery in India
The trend in institutional delivery and CS is shown in table 2. It shows that Jammu &
Kashmir, Punjab, Haryana, Rajasthan, Orissa, Madhya Pradesh, Andhra Pradesh, and Tamil
Nadu have experienced considerable increase in institutional delivery between 1992-93 and
2007-08. Except Rajasthan and Madhya Pradesh, all these states also show the evidence of
significant rise in caesarean section births during these 15 years. Andhra Pradesh requires
special mention for the highest increase of institutional delivery and caesarean births in the
aforesaid period. In fact, the present analysis indicates that the rate of caesarean delivery is
more in the states where institutional delivery is also high. Institutional delivery assures better
maternal and child health care. In the institutional set up if complications arise during
pregnancy or delivery time, the physicians resort to caesarean sections to save the lives of
mother and child. Therefore, usually there is a positive correlation between institutional
delivery and rate of CS.
However it should be mentioned here that the sampling techniques used in DLHS and
NFHS are different. Therefore, some variations are found in the results of DLHS-3 and
NHFS-3 though in most of the cases the variations are not large.
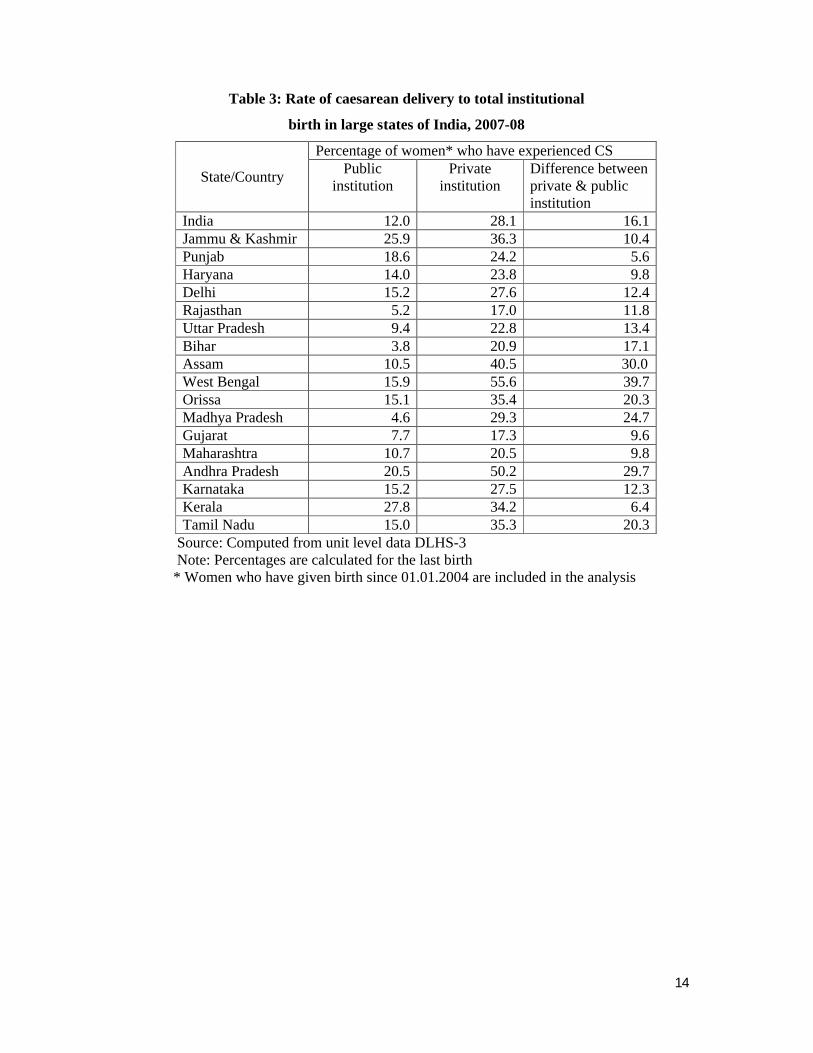
Role of Private sector
In India the rate of CS is substantially higher in private health care institutions
compared to public health care institutions. There are six states where the caesarean section
delivery rate between the private and public medical institutions is above 20 percentage
points. In West Bengal and Andhra Pradesh one in every two mothers experience CS in the
private health care institutions. The rate is even higher than Turkey and Brazil and a matter of
serious concern. These findings indicate the incidence of unnecessary medical intervention
during delivery in private medical institutions. As caesarean delivery remains profitable for
both the doctor and the institution, CS is always higher in private medical centres. However,
there are several states where caesarean delivery in government institutions is nearly or above
15 per cent (Table 3). In Kerala, though the difference in CS rate is 6.4 percent points
between private and public medical institutions, the rate in public institutions is as high as
27.8 percent. Therefore, private institutions alone should not be blamed for the increasing rate
of CS.
6
Factors associated with caesarean delivery in India – results from bivariate and
multivariate analysis
A combination of demographic, socio-economic and institutional factors determines
the rate of caesarean section delivery in any region. As the process of surgical intervention is
possible only in a proper medical set up, therefore it is obvious to have caesarean delivery in
an institute. Here I will discuss various factors associated with CS under institutional set up.
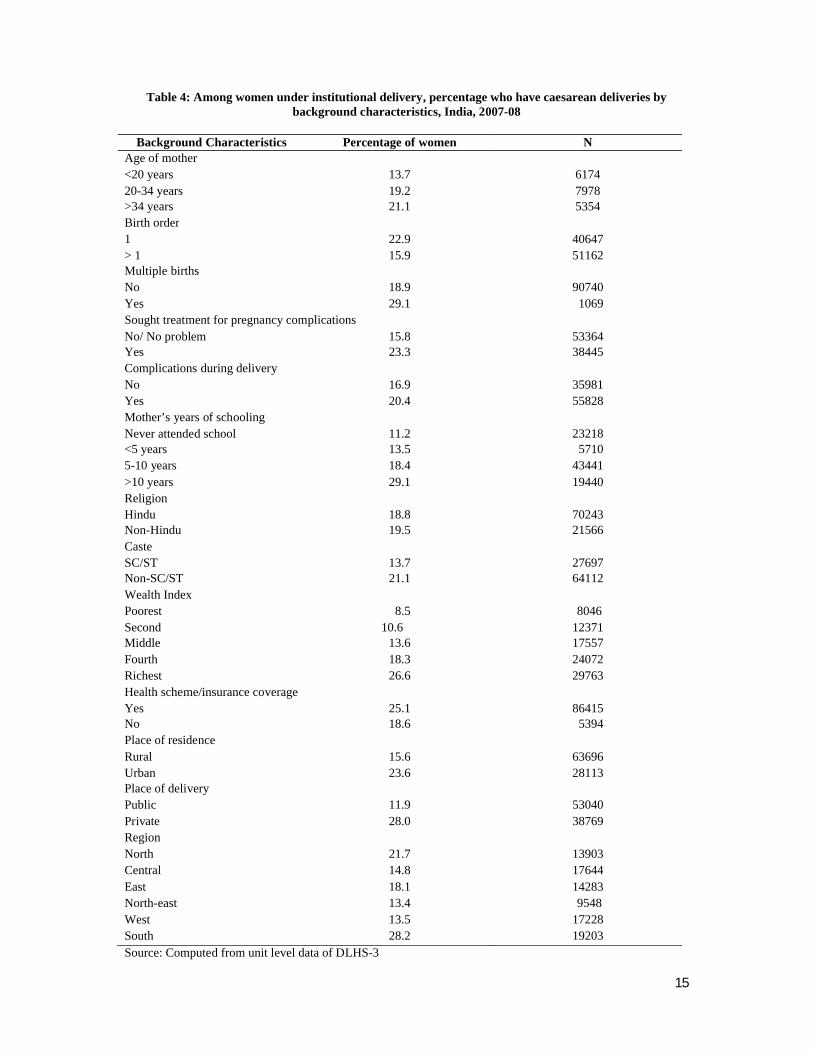
The bivariate analysis (Table 4) reveals that caesarean delivery is highest among
mothers of age group above 34 years. CS rate is higher for women having multiple births and
having baby for the first time. Also the percentage of women who have undergone C-section
delivery is higher among those who sought treatment for pregnancy complication or suffered
from delivery-related complications. There is a steady rise in percentage of women
experiencing caesarean delivery with increasing wealth index and years of schooling of
mothers. Higher percentage of CS is observed among non SC/ST (SC-Scheduled Caste, ST-
Scheduled Tribe) women than the SC/ST group. Further, the percentage of women who have
caesarean delivery is higher among those who are under any insurance coverage/health
scheme and living in urban areas. It is found that while only 11.9 per cent of women have
undergone CS in public medical institution, the figure is more than double (28 per cent) in
case of private health care institution. In India distinct regional variation is found in caesarean
delivery rates. In west and north-east India around 13 per cent women experience CS while in
south India 28.2 per cent women have caesarean deliveries.
To examine the net effect of the explanatory variables on women’s experience of
caesarean section delivery (dependent variable), a logistic regression model has been used
(Table 5). Here the dependent variable is coded as ‘0’ when the woman has not experienced
CS and coded as ‘1’ if the woman has undergone CS. Odds ratio greater than one indicates a
positive relationship between the predictor variable and the probability of experiencing CS,
and odds ratio less than one indicates a negative relationship.
The logistic regression analysis reveals that caesarean section delivery is significantly
associated with maternal age, birth order, multiple births, treatment of pregnancy
complications and complications during delivery. Controlling for other factors, caesarean
section delivery is more likely to occur among the mothers aged more than 34 years
compared to mothers below 20 years. It is because the chances of pregnancy complication are
more at higher age. This finding corroborates the findings of Rosenthal and Paterson (1998)
and Padmadas et al. (2000). Peipert and Bracken (1993) also points out that both physicians
and patients remain concerned about pregnancy outcome at older age. So the doctors opt for
7
CS for older women even if there is no pregnancy complication. Birth order is a significant
determinant of CS because primiparity is associated with greater pregnancy complications
(Mishra and Ramanathan, 2002). Multiple births also increase the possibility of undergoing
C-section delivery. Present analysis supports both the facts. Complications during pregnancy
are important factors that may raise the chances of planned caesarean delivery. The logistic
regression shows that compared to those who did not suffer from pregnancy complications or
did not seek for treatment for pregnancy complications, those who sought for treatment are
more likely to have caesarean baby. As expected, the chance of CS is higher among those
who have experienced delivery complications (excessive bleeding, hypertension, prolonged
labour, obstructed labour, breech presentation, convulsion etc.) than those who did not
experience any delivery complication.
The present study finds that after covariate adjustment, women who have completed
5-10 years schooling or higher are significantly more likely to experience caesarean delivery
than those who never attended school. In fact, education increases women’s decision making
power regarding their own health care and it is believed that many highly educated women
prefer elective caesarean. The work of Chacham and Perpetuo (1998) and Ghosh and James
(2010) also depict that higher education is associated with greater incidence of CS.
Among social factors religion and caste have small but significant impact on
caesarean delivery.
Mothers with high standard of living are usually inclined to utilise health institutions,
especially private hospitals (Padamadas et al., 2000). Families with higher socioeconomic
status can easily access and afford the cost of CS. The present study also depicts that women
from rich families are significantly more likely to undergo C-section than women from poor
families. The regression analysis shows that, those who are not under any insurance
coverage/health scheme are significantly less likely to have C-section delivery. However, the
impact is small. When other factors are controlled for, the rate of caesarean section deliveries
is significantly higher in private health institutions compared to the public health institutions.
The profit motivated private health institutions are often blamed for higher rate of CS.
Compared to rural areas, caesarean section delivery is more likely to occur at urban
areas. It is because of higher concentration of medical institutions particularly private medical
institutions in urban areas which facilitates greater institutional deliveries as well as C-section
births. The result of the logistic regression analysis also supports this hypothesis.
Finally, the regional factor has been included in this study considering the combining
effects of geographical location, cultural setting and socio-economic characteristics on
8
practice and acceptance of CS. In the present analysis India is divided into six regions,
namely, northern, central, eastern, north-eastern, western and southern. After covariate
adjustment, compared to the north Indian women, south Indian women are more likely to
undergone CS and women from central and west India are less likely to experience caesarean
delivery.
Possible reasons for high rate of CS
The informal discussions with some doctors and patients revealed a number of
reasons for high incidence of CS. Observations from some hospitals in West Bengal
corroborate the findings on trends in CS. The oldest Department of Obstetrics and
Gynaecology in India, the Eden Hospital of Calcutta Medical College, Kolkata has seen rise
in CS from 9.5 per cent in 1973 to 40.1 per cent in 2012 (Medical College, Kolkata, 1974 and
2013). Data obtained from Ideal Hospital, a private hospital situated near a sub-divisional
hospital in West Bengal (and representative of many such hospitals and nursing homes of
urban fringe area) shows excessively high rate of caesarean delivery. In 2006-07 the rate was
55 per cent. Within five years the rate has increased 17 percentage point to become 72 per
cent in 2011-12. The manager of a private hospital clearly admitted the nexus between the
doctors of sub-divisional hospital and the owners of the surrounding nursing homes/private
hospitals. Two patients informed the researcher that the doctor of the government hospital
told them they needed CS and proper CS facility was unavailable there; so they must go to
Calcutta Medical College (which was 45 km away) or get admitted at nearby good nursing
home chosen by the doctor. According to the manager, the sub-divisional hospital usually
remains dirty and the dais and nurses in the hospitals often behave very rudely with the
patients, particularly during labour pain. These well-known facts discourage the patients to go
to government hospital. It is interesting to note that all the patients whom I met were from
lower, lower-middle or middle class background and none of them opted for elective
caesarean. The finding is quite similar with the findings from Brazil (Hopkins, 2000; Potter,
2001). These women were quite aware that CS would be painful after birth. Family members
of few patients said that as recovery after CS would take longer time than normal delivery
they did not want CS because “who will do household chores for a long time?”
Discussions with doctors are also important to understand the high rate of CS in many
parts of India. According to the doctors caesarean section is normally justified under certain
situations such as dystocia, cephalopelvic disproportion, placenta previa, breech presentation,
foetal distress, multiple births, preveious caesarean section, pre-eclampsia/eclampsia, active
genital herpes of mother etc. However, when there is no pregnancy or delivery related
9
complications, even then, some doctors perform CS as is it is less time consuming and more
profitable. The following facts are also pointed out by some doctors:
In a country where there is extreme shortfall of obstetricians and anaesthetists and
they are not available round the clock in medical institutions, physician’s convenience is an
important contributing factor for high CS.
Caesarean delivery involves an extended stay in the hospital or nursing homes
compared to vaginal delivery and this, results in extra costs for the stay and other related
services. Since the sole concern of private health institutions is to earn profit, it is often
possible that CS is performed unnecessarily. Similar views were expressed by Mishra and
Ramanathan (2002). In India, many doctors have their own medical institutions. They even
admit the patient under them and earn enormous profit from CS.
In teaching hospitals the CS rate is generally high. To learn the caesarean technique,
students particularly those doing post graduation in gynaecology and obstetrics may perform
caesarean when it is not required. It is not an absurd possibility and in one article this was
supported by Pai (2000).
In many European countries like England, France, Netherland etc. midwives are
responsible for attending normal deliveries and population-midwife ratio is very low. In India
doctors are accounted for any delivery. To avoid harassment and litigation they may choose
caesarean delivery. Besides, in India the population pressure is so high and the proper vaginal
delivery related infrastructure (e.g., bed, electronic foetal monitoring system, skilled neonatal
intensive care, blood transfusion facility etc.) is so lacking in many private as well as public
health institutions that doctors sometimes favour CS over vaginal delivery. The difficulty in
arranging for an emergency CS within short period is another factor that may be important in
Indian context (Pahari and Ghosh, 1997).
The demand for elective CS from highly educated rich urban women who want to
avoid labour pain is increasing. Sometimes a woman or her family wants a specific
obstetrician to conduct the delivery because of the doctor’s reputation. In this situation
elective caesarean may be a more common option for a doctor with enormously busy
schedule.
In developed countries painless vaginal delivery is the most common delivery
procedure but in India the facility of painless labour is not available or extremely rare. There
is a dearth of anaesthetists and other manpower for conducting this type of delivery. The
procedure is also time-consuming for doctors and also for patients.
10
In India day and time of birth has astrological significance. Through caesarean
delivery many parents have their baby at the auspicious moment. For example, Janmastami is
such an auspicious day. This trend is also increasing.
Finally the capitation fees for admission in the private medical schools have increased
at an alarming rate. Several newspapers report that in many private institutions the fee for
admitting one student to the medical course is more than 7 million rupees. Government is
reluctant to act to these issues. The students who study paying such huge money may try to
recover the amount by any means. It is not surprising if they perform unnecessary caesareans.
So in future it may further accelerate the rising trend of CS.
It is important to note that In India government expenditure in health sector is
extremely low. For example, in 2011, total health expenditure as % of GDP was only 4 for
India and 18 for U.S.A. In the same year the general government expenditure on health as %
of the total health expenditure for U.S.A., France, Germany, Brazil, Sri Lanka, China and
India were 46, 77, 76, 46, 45, 56 and 31 respectively (WHO, 2013). To curtail the problems
of over- medicalization of CS, government must spend more money to develop maternal and
child health care infrastructure. Seats for medical students in government colleges must be
increased.
Conclusion
A significant rise in institutional and C-section delivery is found between 1992-93
(NFHS-1) and 2007-08 (DLHS-3) in most of the states in India. The scheme like Janani
Suraksha Yajona (JSY) may have a great impact on accepting institutional deliveries by poor
women. Rising institutional delivery may be a reason of the increase of CS in India. Among
all other factors, perhaps place of delivery (private or public medical institution) is becoming
the strongest one influencing CS. An increase in the rates of caesarean section delivery is a
burden on health system. Unnecessary caesarean delivery also put strain on family and may
complicate maternal and child health. Therefore, the decision to perform a C-section delivery
must be chosen carefully and should not be profit oriented. Utilization of ANC, better doctor-
patient communication, doctor’s commitment to reduce the rate of CS, government’s
intention to develop better health care infrastructure and strict vigil on the private health
institutions may help to reduce the high and increasing rate of caesarean delivery.
11
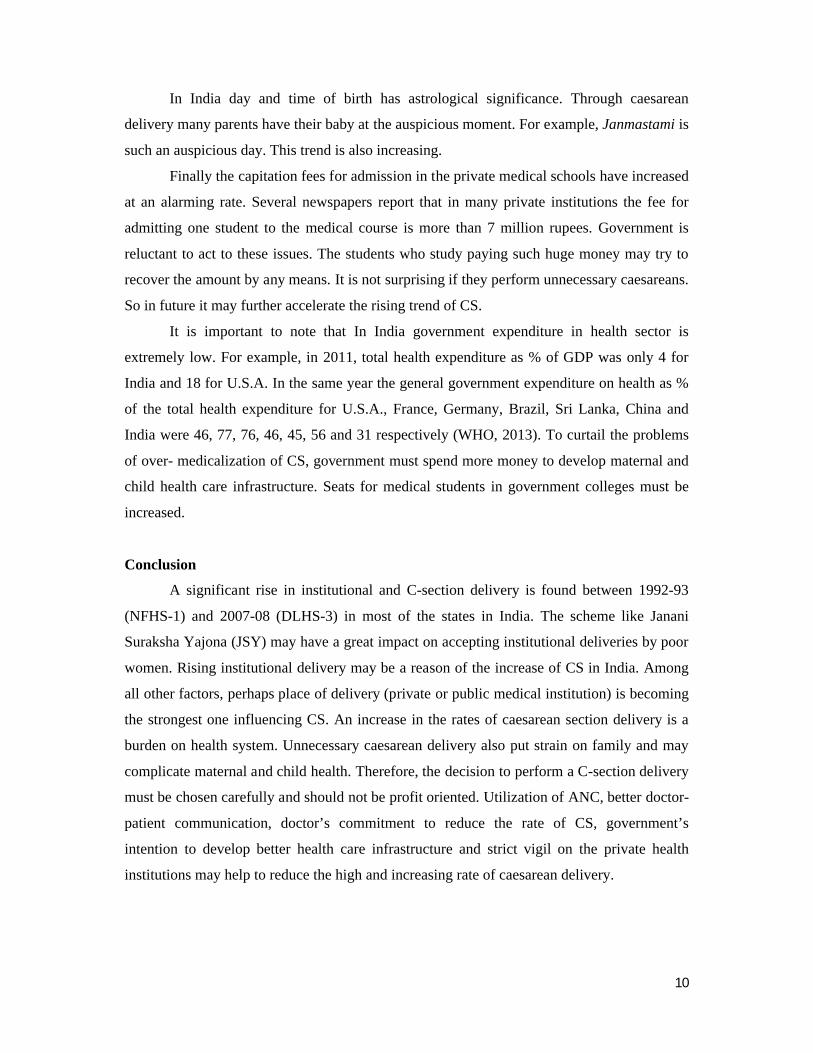
Table 1: Percentage distribution of caesarean section delivery
by place of residence – India and its states, 2007-08
States/Country
Percentage of women who have caesarean delivery among women who
had given birth since 01.01.04
Difference between urban &
rural (U-R)
Total Number
of womenTotal Rural (R) Urban(U)
India 9.2 6.2 16.8 10.6 217997Jammu & Kashmir 15.8 11.6 34.5 22.9 5238Himachal Pradesh 10.2 9.4 15.1 5.7 2594Punjab 14.6 12.6 17.7 5.1 5378Uttaranchal 5.1 3.5 11.7 8.2 4155Haryana 10.2 8.9 12.6 3.7 6857Delhi 14.2 11.3 14.3 3.0 2502Rajasthan 4.2 2.6 8.4 5.8 12573Uttar Pradesh 5.0 3.5 9.7 6.2 38208Bihar 4.4 3.4 9.8 6.4 21633Sikkim 9.7 8.9 25.7 16.8 1450Arunachal Pradesh 3.8 3.1 6.0 2.9 3256Manipur 8.3 4.9 18.7 13.8 3586Mizoram 4.6 2.4 7.8 5.4 2959Tripura 8.7 5.7 34.6 28.9 1553Meghalaya 3.3 2.6 8.3 5.7 3139Assam 6.9 4.6 20.1 15.5 10089West Bengal 12.8 8.6 29.3 20.7 6528Jharkhand 4.2 2.7 13.0 10.3 11474Orissa 10.4 8.6 18.9 10.3 7786Chhattisgarh 6.2 3.4 15.9 12.5 6233Madhya Pradesh 4.9 2.3 11.1 8.8 16111Gujarat 8.1 5.7 14.5 8.8 7603Maharashtra 10.4 7.3 17.4 10.1 10429Andhra Pradesh 29.3 22.3 39.2 16.9 5181Karnataka 14.2 11.3 19.5 8.2 7738Goa 27.5 22.0 30.1 8.1 407Kerala 31.8 30.1 34.7 4.6 3335Tamil Nadu 23.2 19.2 27.7 8.5 6561
Source: Computed from unit level data of DLHS-3Note: Data for Nagaland is not available; Percentages are calculated for the last birth As the value for India combines both state and union territories, adding the state total will not match with India

Fig 1: Spatial Variation in Caesarean Section Delivery in India, 2007Fig 1: Spatial Variation in Caesarean Section Delivery in India, 2007
12
Fig 1: Spatial Variation in Caesarean Section Delivery in India, 2007-08
13
Table 2: Trend in institutional birth and caesarean section delivery in large states of
India, NFHS-1(1992-93), NFHS-2(1998-99), NFHS-3(2005-06) and DLHS-3(2007-08)
States/CountryNFHS-1* NFHS-2* NFHS-3* DLHS-3**
Percentage# of women who have experiencedInst_del CS_del Inst_del CS_del Inst_del CS_del Inst_del CS_del
India 26.3 2.8 34.0 7.3 41.5 9.8 46.9 9.2Jammu & Kashmir
22.4 4.3 36.3 9.2 52.9 14.3 55.9 15.8
Punjab 26.2 4.5 39.4 9.2 54.7 18.3 64.5 14.7Haryana 17.6 2.2 22.4 4.5 38.8 6.5 48.8 10.2Delhi 47.2 4.9 61.0 14.2 62.9 15.2 69.1 14.2Rajasthan 11.8 0.7 21.5 3.2 31.7 4.4 48.3 4.2Uttar Pradesh 11.7 0.8 15.9 2.6 21.8 5.1 25.8 4.9Bihar 11.8 1.0 14.4 3.1 20.9 3.7 29.8 4.3Assam 11.9 1.6 18.3 3.8 25.0 6.3 36.7 6.9West Bengal 32.6 4.3 40.6 10.8 44.1 11.9 50.8 12.9Orissa 14.2 1.2 23.2 5.3 37.4 5.8 43.9 9.8Madhya Pradesh 16.3 0.7 20.0 3.4 28.8 4.2 45.9 10.4Gujarat 37.5 2.9 47.7 9.1 56.9 10.2 57.7 8.2Maharashtra 44.7 4.1 52.9 7.8 67.3 12.8 64.3 10.4Andhra Pradesh 33.2 4.5 49.3 14.8 64.8 23.0 75.9 29.7Karnataka 38.3 3.9 52.3 11.4 67.1 17.4 66.5 14.2Kerala 89.5 14.2 94.5 30.2 99.4 30.9 99.4 31.8Tamil Nadu 64.1 7.7 78.2 16.0 88.7 22.4 94.6 23.2
Source: Computed from unit level data of NFHS-1, NFHS-2, NFHS-3 and DLHS-3Note: Inst_del = Institutional delivery; CS_del = Caesarean section delivery #Percentages are calculated for the latest birth *Women who have given birth in last 5 years are included in the analysis ** Women who have given birth since 01.01.2004 are included in the analysis
14
Table 3: Rate of caesarean delivery to total institutional
birth in large states of India, 2007-08
State/Country
Percentage of women* who have experienced CSPublic
institutionPrivate
institutionDifference between private & public institution
India 12.0 28.1 16.1Jammu & Kashmir 25.9 36.3 10.4Punjab 18.6 24.2 5.6Haryana 14.0 23.8 9.8Delhi 15.2 27.6 12.4Rajasthan 5.2 17.0 11.8Uttar Pradesh 9.4 22.8 13.4Bihar 3.8 20.9 17.1Assam 10.5 40.5 30.0West Bengal 15.9 55.6 39.7Orissa 15.1 35.4 20.3Madhya Pradesh 4.6 29.3 24.7Gujarat 7.7 17.3 9.6Maharashtra 10.7 20.5 9.8Andhra Pradesh 20.5 50.2 29.7Karnataka 15.2 27.5 12.3Kerala 27.8 34.2 6.4Tamil Nadu 15.0 35.3 20.3
Source: Computed from unit level data DLHS-3 Note: Percentages are calculated for the last birth * Women who have given birth since 01.01.2004 are included in the analysis
15
Table 4: Among women under institutional delivery, percentage who have caesarean deliveries by background characteristics, India, 2007-08
Background Characteristics Percentage of women NAge of mother<20 years 13.7 617420-34 years 19.2 7978>34 years 21.1 5354Birth order1 22.9 40647> 1 15.9 51162Multiple birthsNo 18.9 90740Yes 29.1 1069Sought treatment for pregnancy complicationsNo/ No problem 15.8 53364Yes 23.3 38445Complications during deliveryNo 16.9 35981Yes 20.4 55828Mother’s years of schoolingNever attended school 11.2 23218<5 years 13.5 57105-10 years 18.4 43441>10 years 29.1 19440ReligionHindu 18.8 70243Non-Hindu 19.5 21566CasteSC/ST 13.7 27697Non-SC/ST 21.1 64112Wealth IndexPoorest 8.5 8046Second 10.6 12371Middle 13.6 17557Fourth 18.3 24072Richest 26.6 29763Health scheme/insurance coverageYes 25.1 86415No 18.6 5394Place of residenceRural 15.6 63696Urban 23.6 28113Place of deliveryPublic 11.9 53040Private 28.0 38769RegionNorth 21.7 13903Central 14.8 17644East 18.1 14283North-east 13.4 9548West 13.5 17228South 28.2 19203Source: Computed from unit level data of DLHS-3

16
Table 5: Logistic regression results for experiencing caesarean deliveries among institutional deliveries, India, 2007-08
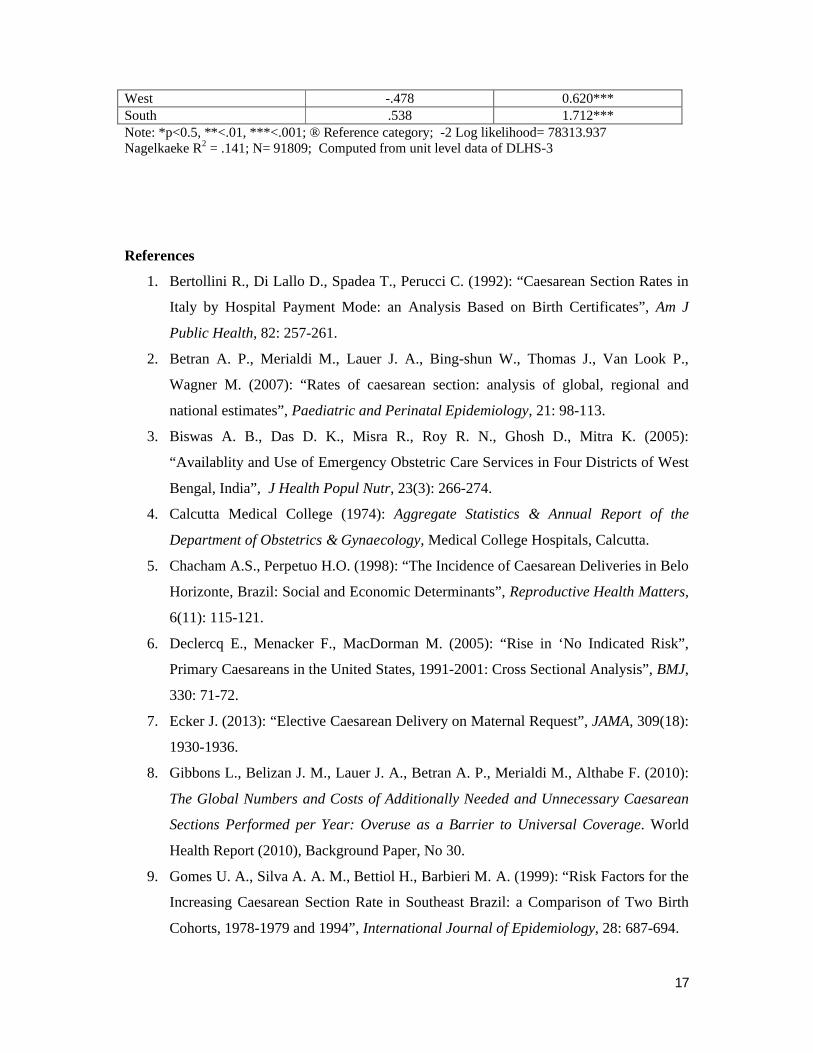
Background Characteristics Regression coefficient (b) Odds RatioAge of mother<20 years ®20-34 years .335 1.397***>34 years .646 1.908***Birth order1®> 1 -.449 0.638***Multiple birthsNo ®Yes .629 1.876***Sought treatment for pregnancy complicationsNo/ No problem ®Yes .337 1.401***Complications during deliveryNo ®Yes .406 1.501***Mother’s years of schoolingNever attended school ®<5 years .075 1.0775-10 years .138 1.148***>10 years .357 1.429***ReligionHindu ®Non-Hindu -.044 0.957*CasteSC/ST ®Non-SC/ST .083 1.086***Wealth IndexPoorest ®Second .093 1.097Middle .230 1.259***Fourth .415 1.515***Richest .610 1.840***Health scheme/insurance coverageYes ®No -.080 .923*Place of residenceRural ®Urban .125 1.133***Place of deliveryPublic ®Private .830 2.294***RegionNorth ®Central -.326 .722***East .033 1.034North-east -.089 .915*
17
West -.478 0.620***South .538 1.712***Note: *p<0.5, **<.01, ***<.001; ® Reference category; -2 Log likelihood= 78313.937Nagelkaeke R2 = .141; N= 91809; Computed from unit level data of DLHS-3
References
1. Bertollini R., Di Lallo D., Spadea T., Perucci C. (1992): “Caesarean Section Rates in
Italy by Hospital Payment Mode: an Analysis Based on Birth Certificates”, Am J
Public Health, 82: 257-261.
2. Betran A. P., Merialdi M., Lauer J. A., Bing-shun W., Thomas J., Van Look P.,
Wagner M. (2007): “Rates of caesarean section: analysis of global, regional and
national estimates”, Paediatric and Perinatal Epidemiology, 21: 98-113.
3. Biswas A. B., Das D. K., Misra R., Roy R. N., Ghosh D., Mitra K. (2005):
“Availablity and Use of Emergency Obstetric Care Services in Four Districts of West
Bengal, India”, J Health Popul Nutr, 23(3): 266-274.
4. Calcutta Medical College (1974): Aggregate Statistics & Annual Report of the
Department of Obstetrics & Gynaecology, Medical College Hospitals, Calcutta.
5. Chacham A.S., Perpetuo H.O. (1998): “The Incidence of Caesarean Deliveries in Belo
Horizonte, Brazil: Social and Economic Determinants”, Reproductive Health Matters,
6(11): 115-121.
6. Declercq E., Menacker F., MacDorman M. (2005): “Rise in ‘No Indicated Risk”,
Primary Caesareans in the United States, 1991-2001: Cross Sectional Analysis”, BMJ,
330: 71-72.
7. Ecker J. (2013): “Elective Caesarean Delivery on Maternal Request”, JAMA, 309(18):
1930-1936.
8. Gibbons L., Belizan J. M., Lauer J. A., Betran A. P., Merialdi M., Althabe F. (2010):
The Global Numbers and Costs of Additionally Needed and Unnecessary Caesarean
Sections Performed per Year: Overuse as a Barrier to Universal Coverage. World
Health Report (2010), Background Paper, No 30.
9. Gomes U. A., Silva A. A. M., Bettiol H., Barbieri M. A. (1999): “Risk Factors for the
Increasing Caesarean Section Rate in Southeast Brazil: a Comparison of Two Birth
Cohorts, 1978-1979 and 1994”, International Journal of Epidemiology, 28: 687-694.
18
10. Guise J.M., Eden K., Emeis C., Denman M. A., Marshall N., Fu R. R., Janik R.,
Nygren P., Walker M., McDongah M. (2010): “Vaginal Birth After Caesarean: New
Insights”, Evid Rep Technol Assess, 191:391-397.
11. Hannah M. E., Hannah W. J., Hewson S. A., Hodnett E. D., Saigal S., Willan A. R.
(2000): “Planned Caesarean Section versus Planned Vaginal Birth for Breech
Presentation at Term: a Randomised Multicentre Trial, Lancet, 356: 1375-1383.
12. Hopkins K. (2000): “Are Brazilian Women Really Choosing to Deliver by
Caesarean?”, Social Science and Medicine, 51: 725-740.
13. Hueston W. J. (1995): “Site-to-site Variation in the Factors Affecting Caesarean
Section Rates”, Arch Fam Med, 4(4): 346-351.
14. IIPS and Macro International (2007): National Family Health Survey (NFHS-3),2005-
06, India, Vol. I andVol. II, International Institute for Population Sciences, Mumbai.
15. Kambo I., Bedi N., Dhillon B. S., Saxena N. C. (2002): “A Critical Appraisal of
Caesarean Section Rates at Teaching Hospitals in India”, Int J Gynecol and Obstet,
79(2): 151-158.
16. Leone T., Padmadas S. S., Mathews Z. (2008): “Community Factors Affecting Rising
Caesarean Section Rates in Developing Countries: an Analysis of Six Countries”,
Social Science & Medicine, 67: 1236-1246.
17. MacDorman, M. F., Menacker F., Declercq E. (2008): “Caesarean Birth in the United
States: Epidemology, Trends, and Outcomes”, Clin Perinatol, 35: 293-307.
18. McCourt C., Weaver J., Statham H., Beake S., Gamble J., Creedy D.K. (2007):
“Elective Caesarean Section and Decision Making: A Critical Review of Literature”,
Birth, 34(1): 65-79.
19. Medical College, Kolkata (2013): Annual Report 2012.
20. Mello e Souza C. (1994): “C-sections as Ideal Births: the Cultural Constructions of
Beneficence and Patients’ Rights in Brazil”, Cambridge Quarterly of Healthcare
Ethics, 3: 358-366.
21. Mishra, U.S., Ramanathan M. (2002): “Delivery-related complications and
determinants of caesarean section rates in India”. Health Policy and Planning,
17(1):90-98.
22. NIH State-of-the-Science Conference statement on Caesarean Delivery on Maternal
Request – NIH Consens Sci Statements. (2006): March 27-29, 23(1): 1-29.
23. No authors listed (1985): Appropriate Technology for Birth. The Lancet , 326 ( 8452):
436-437.
19
24. Office of Registrar General, India (2011): Maternal and Child Mortality and Total
Fertility Rates, Sample registration system (SRS).
25. Oumachigui, A. (2006): “Rising rates of caesarean section: the way ahead”, Indian J
Med Res, 124: 119-122.
26. Padmadas, S. S., Kumar S. S., Nair S. B., Kumari A. K. R. (2000): “Caesarean section
delivery in Kerala, India: evidence from a National Health Survey”. Social Science
and Medicine, 51:511-521.
27. Pahari K., Ghosh A. (1997): “Study of Pregnancy Outcome over a Period of Five
Years in a Postgraduate Institute of West Bengal”, J Indian Med Assoc, 95(6): 172-
174.
28. Pai M. (2000): “Unnecessary Medical Interventions: Caesarean Sections as a Case
Study”, Economic and Political Weekly, 35(31): 2755-2761.
29. Peipert J F., Bracken M. B., (1993): “Maternal Age: an Independent Risk Factor for
Caesarean Delivery”, Obstet Gynecol, 81(2): 200-205.
30. Potter J. E., Berquo E., Perpetuo I. H. O., Leal O. F., Hopkins K., Souza M. R.,
Formiga M. C. C. (2001): “Unwanted Caesarean Sections among Public and Private
patients in Brazil: Prospective Study”, BMJ, 323: 1155-1158.
31. Registrar General, India (2009): SRS Bulletin, Sample Registration System, Volume
44, No1.
32. Remez L. (1991): “ Decision on Caesarean Can Often be Influenced by Nonclinical
Factors”, Family Planning Perspectives”, 23(4): 191.
33. Rosenthal, A. N., Paterson-Brown, S. (1998): “Is there an incremental rise in the risk
of obstetric intervention with increasing maternal age?”, British Journal of Obstetrics
and Gynecology, 105:1064-1069.
34. Sreevidya S., Sathiyasekaran B.W. C. (2003): “High Caesarean Rates in Madras
(India): a Population-based Cross Sectional Study”, BJOG: an International Journal
of Gynecology and Obstetrics, 110: 106-111.
35. Sufang G., Padmadas S. S., Fengmin Z., Brown J. J., Stones R. W. (2007): “Delivery
Setting and Caesarean Section Rates in China”, Bulletin of the world Health
Organisation, 85(10): 755-762.
36. Tollanes M.C. (2009): “Increased Rate of Caesarean sections – Causes and
consequences”, Tidsskr Nor Laegeforen, 129(13): 1329-1331.
20
37. Villar J., Valladares E., Wojdyla D., Zavaleta N., Carroli G., Velazco A. et al. (2006):
Caesarean Delivery Rates and Pregnancy Outcomes: the 2005 WHO Global Survey
on Maternal and Perinatal Health in Latin America, Lancet, 367: 1819-1829.
38. Vimercati A., Greco P., Kardashi A., Rossi C., Loizzi V., Scioscia M., Loverro G.
(2000): “Choice of Caesarean Section and Perception of Legal Pressure”. J Perinat
Med., 28(2): 111-117.
39. WHO. 1994. Indicators to Monitor Maternal Health Goals. Report of a Technical
Working Group, Geneva, 8-12 Nov, 1993.
40. World Health Organization, UNFPA, UNICEF and AMDD (2009): “Monitoring
Emergency Obstetric Care: a Handbook”, WHO, Geneva.