AN INVESTIGATION INTO IPO UNDERPRICING IN CHINA · investment without risk an investigation into...
53
INVESTMENT WITHOUT RISK AN INVESTIGATION INTO IPO UNDERPRICING IN CHINA INVESTMENT WITHOUT RISK AN INVESTIGATION INTO IPO UNDERPRICING IN CHINA A Report from The China Project Liu Ti August 2003 A Report from The China Project Liu Ti August 2003 Asia Programme
Transcript of AN INVESTIGATION INTO IPO UNDERPRICING IN CHINA · investment without risk an investigation into...
INVESTMENT WITHOUT RISKAN INVESTIGATION INTO IPOUNDERPRICING IN CHINA
INVESTMENT WITHOUT RISKAN INVESTIGATION INTO IPOUNDERPRICING IN CHINA
A Report from The China Project
Liu TiAugust 2003
A Report from The China Project
Liu TiAugust 2003
AsiaProgramme

INVESTMENT WITHOUT RISK
AN INVESTIGATION INTO IPO UNDERPRICING IN CHINA
THE CHINA PROJECT REPORT NO. 4
RIIA / CAMBRIDGE UNIVERSITY
August 2003
Liu Ti Visiting Scholar Asia Programme The Royal Institute of International Affairs London, UK
&
Senior Research Fellow/Executive Manager Research Center Shanghai Stock Exchange Shanghai, China
This report is published by the China Project, a research project run jointly by the Royal Institute of International Affairs at Chatham House in London and the Centre of International Studies at Cambridge University. China research at the RIIA focuses on the country's economic reforms. Original research projects looking at privatization, mergers and acquisitions (M&A) policy and financial reform in China are planned. For more information, please visit our website www.riia.org/asia.

© Liu Ti 2003
All rights reserved. No part of this publication may be reproduced, stored in a retrieval system, or transmitted by any others means without the prior permission of the copyright holder.
Acknowledgments
I am grateful to Stephen Green, Situ Danian, Wang Fenghua, Zeng Gang, and Zhang Bo for their valuable comments. I would also like to acknowledge financial support from the Mansion House Scholarship of the Lord Mayor of the City of London. The China Project is generously supported by BP. Royal Institute of International Affairs 10 St James's Square London, SW1Y 4LE United Kingdom www.riia.org Contact: Stephen Green, Head of Asia Programme, [email protected]
The Royal Institute of International Affairs is an independent body which promotes therigorous study of international questions and does not express opinions of its own. Theopinions expressed in this publication are the responsibility of the author.

Summary
China enjoys the highest level of initial returns of initial public offerings (IPOs) in the world, with an average market-adjusted initial return of 132.49%, using data on 354 new issues in China from 1 January 1999 to 31 December 2002. This paper advances an explanation of this phenomenon. It proposes some possible reasons for the high returns and finds that most of the hypotheses based on information asymmetry, such as the winner's curse, signalling, market feedback and the bandwagon hypothesis, fail to fully explain the phenomenon of underpricing. The paper finds only weak evidence for the winner's curse hypothesis. Only the IPO size has a statistically significant positive relationship with the level of the market-adjusted initial returns.
The paper argues that the underpricing of IPOs is the result of the interactive process between the offer price and the trading price on the secondary market, while the information asymmetry hypotheses only focus on the determination of the offer price. A new explanation focusing on the interplay of supply and demand in both primary and secondary markets is advanced and tested using the sample data. The results show that IPO underpricing in China is the result of overpriced secondary market shares under the condition of de facto segmented markets. IPO underpricing is positively related to the trading price in the secondary market, i.e., the higher the P/E ratio of the market (used as a proxy for trading price level in the secondary market), the more underpricing that occurred in the IPO. China's primary and secondary markets are in practice segmented, i.e., in general money from one does not flow to the other. Under these conditions, the returns in the two markets show little tendency to converge. This theory suggests that secondary market reform is essential to mature the primary market. Among all the reform measures, making non-tradable shares tradable and introducing shortselling or a day-trading mechanism are most important to lowering secondary market prices to more reasonable levels.

Contents
1 Introduction 1
2 A History and Institutional Framework 2
3 Key Statistical Characteristics 4
3.1 Data and Methodology 4
3.2 Descriptive Statistics 8
3.3 Key Features Compared to Other Markets 10
4 Empirical Analysis Based on Information Asymmetry 10
4.1 Hypothesis Explaining IPO Underpricing 10
4.2 Models and Empirical Results 14
5 Towards a New Explanation 16
6 Conclusion and Policy Implications 21
References 24

List of tables and figures
Tables 1 Equity Structures of China's Listed Companies, 1997-2002 27 2 Number of IPOs in China by the year of issuing, 1999-2002 27 3 Number of IPOs in China by the month of issuing, 1999-2002 28 4 Correlations between Monthly IPO Number and Monthly Return of Shanghai A
Index, 1999-2002 28 5 Number of IPOs by Industry, 1999-2002 29 6 Number of IPOs by Pricing Method, 1999-2002 30 7 Number of IPOs by Share Allocation Method, 1999-2002 31 8 Key Descriptive Statistics of IPOs in China, 1999-2002 32 8 Key Descriptive Statistics of IPOs in China, 1999-2002 (Continued) 33 9 Initial Returns and Market-Adjusted Initial Returns of IPOs in China, 1999-2002 34 10 Odds-Adjusted Initial Returns and Odds-&-Market- Adjusted Initial Returns
of IPOs in China, 1999-2002 34 11 Annual Return and Market-Adjusted Annual Return of IPOs in China, 1999-2002 35 12 Weighted IPO Initial Returns in China (weighted by IPO Value), 1999-2002 35 13 Market-Adjusted Initial Return and Market-Adjusted Annual Return of IPOs in
China by Industries, 1999-2002 36 14 Market-Adjusted Initial Return and Market-Adjusted Annual Return of IPOs in
China by Pricing Method, 1999-2002 37 15 Market-Adjusted Initial Return and Market-Adjusted Annual Return of IPOs in
China by Share Allocation Method, 1999-2002 38 16 Average Initial Returns of IPOs in 33 countries or markets 39 17 Distribution of IPO Initial Return in the US from 1980-2000 40 18 Correlation Matrix of the Variables used in Model 1 and Model 2 40 19 Estimates for Model 1 and Model 2 of IPO Underpricing in China 41 20 Correlation Matrix of the Variables used in Model 3 and Model 4 42 21 Estimates for Model 3 and Model 4 of IPO Underpricing in China 43 Figure 1 Equity Structures of China's Listed Companies, 2002 44 Figure 2 Number of IPOs in China by the year of issuing, 1999-2002 44 Figure 3 Number of IPOs in China by the month of issuing, 1999-2002 45 Figure 4 Monthly IPO Number and Return of Shanghai A Index, 1999-2002 45 Figure 5 Distribution of IPO Market-adjusted Initial Returns in China, 1999-2002 46 Figure 6 Distribution of IPO Market-adjusted Annual Returns in China, 1999-2002 46 Figure 7 Distribution of IPO Initial Returns in the US from 1990-1996 47

1
1 Introduction
Initial public offering (IPO) underpricing exists in almost every stock market, although the degree of underpricing varies from country to country. Numerous studies document the phenomenon, showing that investors in IPOs, on average, earn abnormally high first day return, and a number of hypotheses have been advanced and tested against the data of both developed and emerging markets. IPO underpricing has been noted as one of the ten puzzles facing financial research since there is little consensus in this field (Brealey & Myers, 1991).
This paper studies IPO underpricing in China's stock market. IPO underpricing in China is severe compared with other countries. The average amount of underpricing (measured by the first day or initial return, which is defined as the difference between first day closing price minus the IPO price divided by the IPO price) of 354 IPOs during the period from 1 January 1999 to 31 December 2002 was 135.01%, while the market-adjusted initial return was 132.49%.1 Another striking feature is that there is absolutely no risk in China's IPO market. In the same period, all IPOs had positive initial returns. 59% of the 354 new issues had returns above 100%. 86.4% got initial returns more than 50%. Only 3.7% of the 354 new issues got first day positive returns below 25%.
This paper attempts to explain why IPO underpricing in China is so severe by first testing the main hypotheses advanced for mature markets. The results show that theories based on information asymmetry fail to explain China's IPO underpricing, though the winner's curse does exist in China. The paper advances a new explanation by focusing on the interplay of supply and demand in both
1 Other studies have found higher returns for the early stage of China's stock markets. For example, Su and Fleisher
(1999) found the average initial return was 948.59% in 1990-1995, while Datar and Mao (1998) found 388% for
1990-1996.

2
the primary and secondary markets. The results show that IPO underpricing in China is the result of overpriced secondary market prices under the condition of de facto segmentation between the primary and secondary markets. IPO underpricing is positively related to the trading price in the secondary market, i.e., the higher the P/E ratio of the market (used as a proxy for trading price level in the secondary market), the more underpricing that occurred in the IPO. China's primary and secondary markets are in practice segmented, i.e., in general money from one does not flow to the other. Under these conditions, the returns in the two markets show little tendency to converge.
The remainder of the paper is organized as follows. A brief history and some institutional details are provided in Section II. Section III introduces some of the key statistical characteristics of IPO underpricing in China, compared with other markets. Section IV examines the main hypotheses and tests them against a data set of 354 new issues. In Section V, the paper adopts a new approach to explain China's IPO underpricng phenomenon. Section VI concludes with summary of the findings and their policy implications.
2 A History and Institutional Framework
China's stock markets date back to the 1860s when brokerage firms emerged in Shanghai to market and trade shares of foreign companies (Liu, 1999). In the 1930s, the Shanghai stock market was the largest in Asia for a time. After the founding of the socialist People's Republic of China, the Shanghai Stock Exchange and two other exchanges were closed in 1949 and 1952 respectively. Along with China's reform and opening policy, firms began to issue shares again in mid-1980s and two stock exchanges – the Shanghai Stock Exchange and the Shenzhen Stock Exchange – were established in 1990.
There are several characteristics of the share issuance and listing processes which distinguish China's IPO market from that of other countries.
First and foremost, most stock sales are partial sales. This may be explained by the fact that the government still needs to control listed companies to maintain the country as a socialist country. However, the privately controlled companies also do the same. As a result of the partial sale method, shares of listed companies in China are categorized into two types: tradable shares and non-tradable shares. Non-tradable shares can be classified in terms of ownership into three main types: state-owned shares, legal-entity-owned shares, and employee-owned shares. There are two types of shares listed and traded in China's stock exchanges: A-shares and B-shares. Originally, A-shares were designed for domestic Chinese investors and B-shares were exclusively for foreigners. However, recent developments have allowed domestic Chinese investors to trade B-shares and qualified foreign institutional investors (QFII) to invest in A-shares. A-shares are

3
traded in domestic currency (RMB Yuan), while B-shares are traded in US dollars on the Shanghai Stock Exchange and Hong Kong dollars on the Shenzhen Stock Exchange.
Table 1 presents the various proportion of the different kinds of shares in China's listed companies. At the end of 2002, non-tradable shares comprised about two-thirds of the total shares. Most of the non-tradable shares were state-owned shares, accounting for more than 70% of the non-tradable shares. 17.3% of the total shares were legal-entity shares, which are owned by state-owned enterprises (SOEs) and, in some cases, private companies. The tradable A and B shares make up, respectively, about 26% and 3% of the total shares.
It is worth noting that the tradable and non-tradable markets are segmented, and the A-share and B-share markets are segmented too. Non-tradable shares are usually traded at a price around the net asset value per share, which was 2.75 RMB Yuan per share on average at the end of 2002, while the average last day closing price of A shares in 2002 was 9.20 RMB Yuan per share. That is to say, the average A-share price is 3.35 times that of the non-tradable share. The situation in the B share is similar. On average, the price of an A-share is more than two times that of the B-share of the same company.
Second, the government controls the total IPO size and process. China used a quota system for new share issues before 2000. The quota (the aggregate amount of IPOs) was determined by the State Planning Commission and China Securities Regulatory Commission (CSRC) (or the People's Bank of China, theCentral Bank, in the early stages of the stock market). The quota was then allocated among the provinces and national ministries and commissions, who chose which firms could go public. The CSRC made the final decision about whether an IPO was permitted. Seasoned equity offerings (SEOs) also required permission from the CSRC. In 2000, the process was changed. China's Securities Law (enacted in December 1998 but brought into effect in July 1999) abolished the quota system, though the CSRC's permission is still necessary for an IPO to take place. The new rules are called the 'sanction system'. Investment banks can choose or recommend firms to the CSRC for issuing and listing. The CSRC does the formal examination. If the firm meets the formal criteria set by the CRSC, the CSRC will then send the IPO application to the IPO Auditing Committee. The IPO Auditing Committee is composed of CSRC officials and outside experts. The IPO Auditing Committee will decide whether or not to approve the IPO.
Third, in terms of the pricing method of IPOs, the fixed P/E ratio method was used before mid-1999. Most IPOs' P/E ratio was between 12 and 15. In July 1999, in the spirit of the Securities Law, the CSRC enacted a rule which permitted companies which were intending to issue more than 400 million total shares to negotiate the IPO price with the underwriter. The 400 million total shares limitation was removed in April 2000, allowing all firms to negotiate the IPO price. Since 2001, the bookbuilding method has also become popular in China's primary market. This involves
4
the company and the underwriter determining the preliminary offer prices range (file price range). The underwriter will then measure the demand of institutional investors for these particular shares, and revise the offer price according to demand.
Fourth, the allocation mechanism for IPO shares is very particular compared with other countries. There were numerous methods used to allocate new shares before 1996, such as application forms, subscriptions related with bank deposits, online blind auctions, etc. From 1996 to mid-1998, a lottery mechanism was used to allocate new shares, in which subscribers bid for a quantity of shares at a fixed offer price. The odds of winning the lottery depends on how much money the subscriber used in his subscription. The CSRC introduced another allocation method during 1998 and 1999 which gave investment funds and strategic long-term investors (usually SOEs) the priority in purchases of IPO shares.1 Without joining the online lottery, they were allocated about 25 -75 of total new shares. However, the lottery method was also needed for these preferential
investors when there was a strong demand for the IPO. A preferential method for secondary market investors was implemented in 2000. Investors who already owned tradable shares could subscribe to a quantity of new shares, this quantity dependent upon the market value of their shareholdings. The lottery system also functions in the case of oversubscription. Few IPOs adopted the market value allocation method in 2000 and 2001, but since mid-2002, most IPOs have used this method.
3 Key Statistical Characteristics
3.1 Data and Methodology
The sample data-set used in this paper is comprised of 354 companies which issued and listed their A-shares in China's stock market, either at the Shanghai Stock Exchange or the Shenzhen Stock Exchange, from 1 January 1999 to 31 December 2002.2 This time period has chosen since it was only from 1999 that IPO prices were negotiated and not set administratively. Before this, the IPO price was fixed and determined by the government, and the underpricing of IPOs was not a market phenomenon. Companies which issued shares before 1999 but listed them in the sample period are
1 There are exceptions for IPOs of less than 50 million total shares, where investment funds were not given the priority
for IPO allocation. For strategic investors, the situation was true for IPOs with less than 400 million total shares. The
restriction for strategic investors was removed in April 2000.Strategic investors were given preferential treatment for
all IPOs. 2 I do not distinguish shares listed in the two exchanges in the following analysis as the listing criteria for both stock
exchanges are the same, and it is the government, not exchanges, who decide the issuing or listing processes.
5
excluded from the sample. Three companies which issued shares in December 2002 but listed in 2003 are included. The primary data source is from Guo Tai An (GTA) Information Technology Company's China's IPO Database, and the Wind Information Company's Securities Markets Database. I have also made thousands of corrections to their data, and compiled missing information for hundreds of observations from other sources, using data from the Information Centre and Listing Department of the Shanghai Stock Exchange, as well as from direct inspection of the firms' IPO prospectuses.
Table 2, Figure 2, Table 3 and Figure 3 summarize the number of IPOs on an annual and monthly basis. During the sample period, there were an average of 88.5 IPOs per year. The number of IPOs peaked in 2000 with a record of 124. Most IPO shares were listed on the Shanghai Stock Exchange since the Shenzhen Stock Exchange was not allowed to list new shares after late 2000. The number of IPOs usually reach their lowest number in February because of the two-week Chinese Spring Festival holiday, and reach their peak usually in July following the disclosure of annual report from January to April and the one-week Labor Day holiday in May.
Contrary to the finding of Chi and Padgett (2002), I find that there was a weak relationship between the monthly index returns and the number of monthly IPOs, as shown in Table 4 and Figure 4. The hypothesis that the CSRC chooses to launch IPOs when the market is performing well (i.e., a bull market) is thus not supported by the evidence.
The 354 companies are divided into six industries, finance, public utilities, real estate, diversified conglomerate, manufacturing, and commerce and services. Table 5 reports the number of IPOs by industry during 1999-2002. There were 222 manufacturing firms in the 354 sample IPOs, accounting for 62.7% of the total. The second largest industry was the diversified conglomerates with 68 IPOs, accounting for 19.2% of the total. Commerce and services, and real estate companies follow the conglomerates, accounting for 8.5% and 6.2% of the total, respectively. The finance industry ranks last with only 5 IPOs in the sample.
During the sample period, companies used two methods to price their IPOs: the fixed price and the bookbuilding methods. Bookbuilding became popular in China after late 2001. Table 6 reports the number of IPOs by pricing method in the sample. There were 269 IPOs with fixed price, accounting for 76% of the total, while there were 85 IPOs using bookbuilding method, accounting for 24% of the total.
Two main methods were used to allocate the offered shares when there was a huge demand. One was the lottery mechanism based on the amount of money subscribers used to bid for IPO shares. The other was the lottery mechanism based on the market value of the tradable shares the subscribers held. Many IPOs used both methods at the same time. Table 7 presents the number of

6
IPOs by the share allocation method. 239 IPOs (67.5% of the total) used the lottery by money, 47 IPOs (13.3%) used the lottery by market value, 66 IPOs (18.6% of the total) used both methods, and only two IPOs used other methods not mentioned here.
Initial returns to IPOs are measured using the standard methodology, though I also introduce four other measures to explain China's special situation.
The initial return of the IPO of stock 'i' is defined as:
001 /)( iiii PPPR −=
where iR is the initial return of the IPO of the stock "i", 0iP is the IPO offering price of stock "i", and 1iP is the first trading day's closing price of stock "i".
The market-adjusted (abnormal) initial return of the IPO of stock "i" is defined as:
1)1/()1( −++= mii RRMAR
where iMAR is market-adjusted initial return, mR is the market index return during the period
between the IPO and the first trading date, which is defined as:
1/)( 001 −−= mmmm PPPR
where 0mP is market's closing index on the day of the IPO, and 1mP is the market's closing
index on the first trading day of the stock. In this paper, Shanghai A-share Index and Shenzhen A-share Index are used as corresponding benchmarks.
The initial returns weighted by the market value of the IPOs are also calculated. The weighted initial returns are defined as:
)1/(1∑=
⋅=n
iiiii MV
nMVRWR
)1/(1∑=
⋅=n
iiimm MV
nMVRWR
where iWR and mWR are, respectively, the weighted initial return and the weighted market-adjusted initial return of stock "i", while iMV is the market value of the IPO of stock "i",
which equals the offer price multiplied by the number of new shares issued of stock "i".
Four new measures are introduced in the following analysis which are essential for measuring IPO underpricing in China. Since there is always a large demand for IPO shares (as a result of high

7
initial returns), the lottery mechanism is used to allocate IPO shares. The odds of winning the lottery are very low (usually below 1%). From the investors' point of view, the return on their investment is not calculated by the initial return on the IPOs, but by the initial return on IPOs divided by the total money they used to apply IPO shares. Therefore, the odds of winning the lottery become an important determinant of their total returns. In China, the average subscription time for an IPO is 4-5 days. That means investors need to put their money in the primary market for about one week (excluding the weekend when the market is closed) to apply for one IPO. Hence, an investor can apply to buy IPO shares many times with the same money in a year. As a result, the annual investment return, which undoubtedly interests investors, can be calculated.
For the above reasons, the concept of the odds-adjusted initial return, odds-&-market-adjusted initial return, annual return, and market-adjusted annual return are used in this paper. These four measures are calculated as follows:
iii LotRateROAR ⋅=
iii LotRateMAROMAR ⋅=
∑=
⋅⋅=n
jjiii XLotRateRAnnR
1
∑=
⋅⋅=n
jjiii XLotRateMARMAAnnR
1
where iLotRate is the odds of winning the lottery, iOAR is the odds-adjusted initial return,
iOMAR is the odds-&-market-adjusted initial return, iAnnR is the annual return, and
iMAAnnR is the market-adjusted annual return, while jX is the money an investor can use to
apply for an IPO at time j, and n is the total times an investor can apply for IPOs in a year. jX is
defined as:
)1(
)1(1
1
12
1
inn
i
LotRateXX
LotRateXXX
−=⋅⋅⋅⋅⋅⋅⋅
−==
−
There are about 240 trading days in a year in China, so n can be define as 48, that is, an investor can apply for IPOs 48 times with the same money (minus the money used to buy allotted IPO

8
shares when successful) in a year.1
3.2 Descriptive Statistics
Table 8 presents the key statistics on the 354 sample IPOs. The average IPO price during the four years was 7.71 Chinese RMB Yuan, with a maximum of 36.68 Yuan and a minimum of 2.2 Yuan. The average IPO quantity was 116.6 million shares, with a maximum of 5 billion shares and a minimum of 4 million shares. As to IPO's price-earning ratio, the average P/E ratio was 25.3, with a maximum of 74.2 and a minimum of 12.1. The first day closing price was, on average, 2.3 times the average offer price.
There are several interesting features of the odds of winning the lottery and the first day turnover rates. The average winning probability for the four years was 1.06%. The year 2001 saw the highest rate of 2.59%, while the lowest was only 0.17% in 2002. The main reason for the low lottery-winning rate in 2002 was a change in the share allocation method. Before 2002, the vast majority of IPOs were allocated by the amount of money subscribers used for the subscription, while most IPOs in 2002 were allocated by the market value of the tradable shares held by subscribers. The average amount of money used for one IPO in China was 155.28 billion Yuan, while the average market value of the tradable shares subscribers held was 510.25 billion Yuan, and 224.84 billion Yuan for the mixed method.
As Table 8 shows, China may have the highest turnover rate for the first trading day of new shares in the world. The average turnover rate was 60%, with a maximum of 84.6% and a minimum of 5.2%. This phenomenon suggests that most investors in China's primary market are only interested in the primary market itself, and not in long-term investment.
In the early stages of China's stock market, the average time elapsing between the IPO announcement and the first day of listing and trading was quite long. In Su and Fleisher's (1999) samples, it was 260 days for A-shares from 1990 to 1995. The figure has dropped in recent years. As shown in Table 8, the average time between the IPO announcement and the first day trading between 1999 and 2002 was 23 days, and 15 days for 2002.
Table 9 reports the initial returns and market-adjusted initial returns of the sample offerings. The average market-adjusted initial return of the 354 IPOs was 132.49% with a maximum of 478.41%
1 Investors may subscribe to more than 48 new issues as they can divide their money into several parts to apply for
several new issues at the same tine. The reinvestment return of the initial returns is not included in the calculation as
the time elapsing between an IPO and the first trading day varies between different IPOs.

9
and a minimum of 3.47%. On average, the market-adjusted initial returns are slightly lower than the initial returns. However, the situation was different for the years of 2001 and 2002. This suggests that most IPOs suffered from the market decline in 2001 and 2002 though they benefited from the market rise in 1999 and 2000.
However, the return was very low when one considers the odds involved in the lottery. As shown in Table 10, the average odds-&-market-adjusted initial return of the 354 IPOs was 0.79% with a maximum of 31.15% and a minimum of 0.02%.
Table 11 reports the annual returns and market-adjusted annual returns. The average annual returns and market-adjusted annual returns of the 354 samples were, respectively, 35.7% and 38.0%. These rates were very high compared with other types of investment in China. The time-weighted one-year savings interest rate was only 2.36% during the sample period.
The weighted returns of the above six measures were also calculated, as Table 12 shows. The average weighted initial return, market-adjusted return, odds-adjusted return, odds-&-market- adjusted return, annual return and market-adjusted annual return were 88.19%, 88.28%, 2.73%, 3.02%, 121.81% and 144.18%. It is interesting that the weighted returns and market-adjusted returns were considerably lower than the unweighted ones, while the weighted odds-adjusted and annual returns are significantly higher than the unweighted ones. This may be explained by the fact that IPOs with large market values usually have lower initial returns, and that IPOs with a large market value have higher lottery-winning rates.
The average market-adjusted initial returns and market-adjusted annual returns classified by industries, pricing method and share allocation method are presented in Tables 13, 14 and 15. In terms of market-adjusted initial returns ranked in terms of industries, conglomerates rank first and public utilities rank last, while manufacturing ranks first and commercial and service industry ranks last for the market-adjusted annual returns.
There was no significant difference for market-adjusted initial returns between the fixed price offering and bookbuilding methods, though a large difference existed for market-adjusted annual returns. The average market-adjusted annual return of IPOs using the bookbuilding exercise was 2.4 times that of IPOs using the fixed price method.
The situation for share allocation method was similar. There were little differences for market- adjusted initial returns among the various share allocation methods, while the market-adjusted annual returns for lottery by money, lottery by the market value of tradable shares, lottery both by money and market value, and other methods were, respectively, 24.98%, 4.71%, 109.23%, and 23.02%.

10
3.3 Key Features Compared to Other Markets
High returns and an absence of any risk are the two statistical characteristics that distinguish China from other markets. Su and Fleisher (1999) found that the average initial return of 308 IPOs in China during 1990-1995 was 948.59%. Datar and Mao (1998) found that the average initial return of 226 A-share issues in China during 1990-1996 was 388.0%. Liu and Li (2000) found that the average market-adjusted return for the 781 stocks listed on the Shanghai and Shenzhen Stock Exchanges during 1991-1999 was 139.4%. Chi & Padgett (2002) studied 668 new issues in China from 1 January 1996 to 31 December 2000 and found an average market-adjusted initial return of 129.16%. The average market-adjusted initial return of my sample form 1999 to 2002 was 132.49%. Though all these findings show that IPO underpricing has been improving over the time, it is still very high compared with other markets.
Table 16 gives a summary of the average initial returns (equally weighted) of IPOs in various markets around the world. China ranks first. The average initial return of IPOs in China during 1999-2002 was 3.3 times the average emerging markets' initial return (excluding China) and 6.9 times that of developed countries.
Another striking feature of China's primary market is that there is absolutely no risk at all. Figure 5 and Figure 6 present the distribution of the market-adjusted returns and the market-adjusted annual returns in the 354 samples. No company had negative market-adjusted returns. Only 13 IPOs (3.7% of the total sample) got a return below 25%. 306 IPOs (86.4%) got a return over 50%, 209 IPOs (59.0%) got a return over 100%, and 61 IPOs (17.2%) got a return over 200%. As to market adjusted annual returns, 42 IPOs (11.9%) got a return below 5%, 141 IPOs (39.8%) got a return over 20%, while 171 IPOs (48.3%) had a return between 5% and 20%. This situation is completely different from other markets, such as the United States where many IPOs have negative initial returns as shown in Table 17 and Figure 7.
4 Empirical Analysis Based on Information Asymmetry
4.1 Hypotheses Explaining IPO Underpricing
Academics agree that fundamental market risk, liquidity constraints and asset-pricing risk premium are unlikely to explain the unusual phenomenon of IPO underpricing, and have offered a number of different hypotheses since Stoll and Curley (1970), Reilly (1973), and Logue (1973) first documented the phenomenon. Most of the hypotheses, which will be tested in this paper, are based on the problem of information asymmetry.
4.1.1 Differentially-informed Investors and the Winner's Curse
11
One important explanation for IPO underpricing is the 'winner's curse'. Rock (1986) argues that information asymmetries exit between informed and uninformed investors. Since informed investors are more likely to buy new shares when they are underpriced, then the amount of excess demand will be higher for the more underpriced IPOs. So the uninformed investors face a winner's curse: they are allocated only a fraction of the most desirable new issues, while they are allocated a large proportion of the least desirable issues. That is to say, if they win the allocation, it is because the informed investors do not want the shares. To keep the uninformed investors in the market, therefore, requires an additional premium (the underpricing of IPOs) sufficient to compensate them. The evidence of numerous studies is consistent with the winner’s curse hypothesis, though other explanations also exist.
Beatty and Ritter (1986) extend Rock’s hypothesis by introducing uncertainty about an IPO's market clearing price. Beatty and Ritter argue that higher uncertainty results in higher underpricing. This theory suggests that small firms should have higher IPO initial returns since the risk associated with smaller firms is higher than with larger firms.
In China, most IPOs are partial sales. Government or the legal entities (most of them state-owned-enterprises, SOEs) own about two-thirds of a company's total equity after the IPO. The tradable shares are purchased by individuals, investment funds, and strategic long-term investors. As Chi and Padgett (2002) point out, to keep the uninformed individual investors in the market, the government has to underprice IPOs and leave much money on the table for the further development of the IPO market.
To test the above theory, I adopted a similar method used by Chi and Padgett (2002), defining the percentage of tradable shares as the proxy for the size of the information asymmetry, and the IPO size as a proxy for the firm's risk.1 The offer size is calculated by the offer price multiplied by the quantity of share issued. According to the winner's curse theory, IPOs with the fewer tradable shares or/and involving smaller firms will experience high underpricing.
Hypothesis 1: There is a positive relationship between the percentage of tradable shares and the market-adjusted initial return.
Hypothesis 2:
1 Chi and Padgett (2002) define the percentage of shares owned by the government and government-owned companies
as a proxy for the size of the information asymmetry.

12
There is a negative relationship between the offer size and the market-adjusted initial return.
4.1.2 Information Asymmetry and the Signaling Hypothesis
Welch (1989), Allen and Faulhaber (1989), Grinblatt and Hwang (1989), and Chemmanur (1993) have developed a series of signaling models to explain IPO underpricing. These models are based on the information asymmetries that exist between the issuers and the investors. If the issuers have superior information than investors about the value of the IPO, rational investors fear a lemon problem: only issuers with a worse-than-average quality will be willing to sell their shares at the average price (Welch and Ritter, 2002). Underpricing, which is a cost that bad firms cannot profitably sustain and which deters lower-quality issuers from imitating, is an equilibrium outcome for issuers to distinguish themselves from the pool of low-quality issuers and signal their quality to the investors.
Some signaling models have examined the government's behavior in SOE IPOs and have argued that government issuers underprice IPOs to signal the owner's faith and its commitment to pro-market privatization policies (Perotti, 1995; Mok and Hui, 1998). Perotti argues that the government may choose to retain a large percentage of a listed companies and underprice a partial sale to signal its intent to commit to future pro-market privatization policies. Mok and Hui argue that a high level of equity retention by the government may reflect the owner’s faith in the business and thus lowers the ex-ante uncertainty, though it may also signal the inefficiency of the firm's management.
The testable hypotheses deduced from the signaling theories are as follows:1
Hypothesis 3: There is a positive relationship between the profitability of the issuing firm and the market-adjusted initial return.
Hypothesis 4: There is a negative relationship between the percentage of government-owned or SOE-owned shares and the market-adjusted initial return. In other words, there is a positive relationship between the percentage of tradable shares and the market-adjusted initial return, as stated in
1 Many empirical studies examined the relationship between the number of subsequent equity offerings (SEOs) and the
initial returns of IPOs. I do not consider SEOs for two reasons. First, it is difficult to examine the SEOs effects in the 4
year sample. Second, almost every SEO in China is a right issue for the shareholders, not for the public, and it is
underpriced severely too.
13
Hypothesis 1.
4.1.3 Information Gathering and the Market Feedback Hypothesis
Another approach based on information asymmetries is assuming that investors are more informed than the issuer, for example about the market demand for shares. In this situation, the issuer faces a placement problem. Benveniste and Spindt (1989), Benveniste and Wilhelm (1990), and Spatt and Srivastava (1991) argue that the underwriter may underprice the IPO to induce investors to reveal their valuations of the company during the pre-sale bookbuilding period. Hanley (1993) also finds that the underwriter does not fully adjust the IPO price when demand is strong. As Welch and Ritter (2002) point out, the underwriter must underprice issues for which favourable information is revealed by more than those for which unfavourable information is revealed, and there will only be a partial adjustment of the offer price from the original file price ranges. That is to say, those IPOs for which the offer price is revised upwards will be more underpriced than those for which the offer price is revised downwards.
In China, the bookbuilding method was introduced in 2000. 24% of the IPOs in the 354 sample adopted this method. It is interesting that the underwriter adjusted the offer price upward for almost all IPOs. This increases the difficulty of analysing the bookbuilding effect on IPOs. On the assumption that the initial price ranges of IPOs with bookbuilding were determined using the same method as IPOs which used fixed prices, it can be inferred that IPOs with fixed prices should be more underpriced than the IPOs which used bookbuilding. In other words, IPOs using a fixed price method will be also adjusted upward if they adopt the bookbuilding method.
Hypothesis 5: IPOs which use the fixed price method are more underpriced than IPOs which use bookbuilding.
4.1.4 Information Cascade and the Bandwagon Hypothesis
Welch (1992) argues that an issuer may underprice its IPO to avoid a negative cascade. In an informational cascade, investors make their decisions by judging the interest of other investors. They only subscribe to new shares when they believe that the offering is going to be popular. That is to say, the IPO market may be subject to bandwagon effects (Ritter, 1998). A positive bandwagon or cascade means that the IPO is underpriced, and vice versa. The hypothesis is supported by Amihud, Hauser, and Kirsh (2001). They found that IPOs tend to be either undersubscribed or hugely oversubscribed, with very few moderately oversubscribed.
The share allocation method and investors' demand for shares can be used as proxies for the bandwagon effect in China's IPOs. The odds of the lottery reflect the investors' demand for the IPOs. It should be negatively related to the degree of IPO underpricing. The lottery mechanisms
14
themselves may contribute to underpricing for the cost to investors of the lottery based on money is different from the cost of the lottery based on the market value of tradable shares held.
Hypothesis 6: There is a negative relationship between the odds of winning the lottery and the market-adjusted initial return.
Hypothesis 7: IPOs using a lottery method based on money should have a higher return than IPOs which use the lottery based on the market value of tradable shares held by subscribers.
The above four hypotheses are based on information asymmetries. There are other theories based on symmetric information, such as the investment banker's monopoly power hypothesis, the lawsuit avoidance hypothesis, the ownership dispersion hypothesis, the trading volume in the aftermarket hypothesis, etc. (Ritter, 1998; Welch and Ritter, 2002) However, these hypotheses are not used in this paper since the institutional framework is sufficiently different in China to make them redundant.1
4.2 Models and Empirical Results
To test the above seven hypotheses, the following empirical models are used.
Model 1:
ikii
iiiii
kIndusLotMoneyiceFix
LotRateROEPubOwnIPOSIZEMAR
)(Pr )(765
43210
βββ
βββββ
++
+++++=
Model 2:
iiki
iiiii
kIndusLotMoney
iceFixROEPubOwnIPOSIZEOMAR
)(
Pr
)(65
43210
ββ
βββββ
+
+++++=
In the first regression, I use the market-adjusted initial return (MAR) as the dependent variable, while odds-&-market-adjusted returns (OMAR) is used as the dependent variable in Model 2. The
1 The trading volume in the aftermarket hypothesis, investment banker's monopoly power hypothesis and the lawsuit
avoidance hypothesis are not applicable because the market-making system, investment banker's monopoly power,
class action and derivative lawsuit arrangements do not exist in China. The ownership dispersion hypothesis is also
less useful in China since nearly all IPOs in China are partial sales and the issuer still controls the company after IPO.
15
LotRate is omitted in Model 2 since the OMAR is calculated by MAR multiplied by the odds of winning. The correlation coefficients of the variables are provided in Table 18.
The independent variables used in the regression are defined as follows:
IPOSIZE (1-) The logarithm of the offer value of an IPO, calculated as the issuing quantity of shares multiplied by the offer price
PubOwn (2, 4 +) The percentage of tradable shares ROE (3+) The return on equity of the firm a year before the IPO date FixPrice (5+) The dummy to show whether a firm adopts the fixed-price method to price
its IPO, 1-yes, 0-no LotRate (6-) The odds of winning the lottery, calculated as a percentage LotMoney (7+) The dummy to show whether an IPO is allocated based on a lottery by
money, including IPOs based on lotteries by both money and the market value of the tradable shares, 1-yes, 0-no
Indus(k) Industry dummy, k = 1, 2, …, 6, where 1 represents the finance industry, 2 the public utility industry, 3 the real estate industry, 4 the diversified conglomerates, 5 manufacturing, 6 commerce and service industry, 1-yes, 0-no
Note: figures in ( ) are the related hypotheses to be tested. '+' represents an expected positive relationship, while '-' represents an expected negative relationship.
The left-hand side of Table 19 presents the OLS estimates for Model 1. The results are disappointing. Only IPO size has a significantly positive relationship to the market-adjusted initial return. This means that the winner's curse hypothesis does hold in China's primary market. I also find a positive relationship between the lottery mechanism by money and the market-adjusted initial return at the significance level of 0.07. This indicates that there are bandwagon effects to some extent in China. However, I do not find a negative relationship between the lottery-winning rate and the initial return as others did (Liu and Li, 2000; Chi and Padgett, 2002).1 This can be explained by the fact that the lottery-winning rate itself is determined by other variables used in the regression. The argument is illustrated in the results of Model 2.
I do not find any significant relationship between the percentages of tradable shares, the firm's ROE, the IPO pricing method and the market-adjusted initial returns. The results allow us to reject
1 In fact, the lottery-winning rate is not a good variable for IPO underpricing as the odds itself may be determined by
other variables used in the explanation, as shown in the empirical estimates in Model 2.

16
the signaling and market feedback hypotheses.
The right side of Table 19 reports the OLS estimates for Model 2. In fact, Model 2 is useful to test the relationship between the lottery-winning rate and other independent variables used in the regression since the odds-&-market-adjusted initial return is determined by the market- adjusted initial returns multiplied by the lottery-winning rate. The lottery-winning rate is a sign of investors' demand for IPOs and contributes a great deal to the odds-&-market-adjusted initial return.
All independent variables except the industry dummies are significant in Model 2. There are positive relationships between the percentages of tradable shares, the IPO size, the lottery by money and the odds-&-market-adjusted initial return. The results show that there are higher lottery-winning rates or lower demand for the IPOs with a larger IPO size, a larger tradable shares ratio, and IPOs which use the lottery money method.
There are negative relationships between the firm's ROE and the odds-&-market-adjusted initial return. This indicates that there are higher demand or lower lottery-winning rate for the issuing firms with higher profitability. The estimates of Model 2 also show IPOs which use the fixed pricing method have a lower winning lottery rate than IPOs which use bookbuilding. The reason for this is the prices of IPOs with fixed prices are relatively low since the offer prices of nearly all bookbuilding IPOs are adjusted upwards.
5 Towards a New Explanation
Academics have so far explained the underpricing puzzle by focusing on the determination of the offer price. Since the theories based on information asymmetries cannot give a reasonable explanation of IPO underpricing in China, I try to advance a new explanation by focusing on the interplay of supply and demand in both the primary and secondary markets, i.e., focusing on both the offer price and the trading price of the secondary markets.
The hypothesis advanced here is that IPO underpricing in China is the result of over-valued secondary market prices under the condition of segmented markets.1 This explanation has three interrelated theoretical assumptions.
1 It is difficult to say whether the secondary market shares are over-valued. However, the market P/E ratios can be used
for comparing the price levels of different markets. The average year-end market P/E ratio in the Shanghai Stock
Exchange during 1999-2002 is 41.86, while the market P/E ratio in the developed markets such as the New York
Stock Exchange, the London Stock Exchange, the Frankfurt Stock Exchange and the Euronext, is usually around 20.

17
First, that the secondary market trading prices are overpriced compared to the IPO prices. That is, IPO underpricing is positively related to the trading price in the secondary market by controlling for other variables. If the market P/E ratio is used as a proxy for the level of the secondary market price, the higher the P/E ratio of the market, the more underpricing that occurred in the IPO.
Hypothesis 8: There is a positive relationship between secondary market P/E ratio and the market-adjusted initial return on IPOs.
Secondly, IPO prices are not adjusted (or fully adjusted) to the secondary market trading prices when the latter are overpriced. Why does the issuing firm not raise its offer price when there is a very high initial return for the new issue? There are two possible explanations. On the one hand, the IPO price is closely related to demand. If the IPO is priced too high, demand for it will decrease accordingly. The success of a new issue then will not be assured. The IPO P/E ratio is used here as a proxy for the IPO price level. According to this argument, there should be a negative relationship between the IPO P/E ratio and the odds-&-market-adjusted initial return (or lottery-winning rate).
On the other hand, the main purpose of firms going public in China is to raise money. However firms care less about how much money they raise than the money raising itself, as argued by some Chinese scholars (Hu, 2003). The reason is that there is little dilution of control rights, since most issuing firms remain controlled by the government or SOEs. A private company will pay more attention to the dilution effect on control than the government. So a private company will try to raise its offer price when the secondary market price is relatively very high. In other words, if a large percentage of shares are sold to private investors, then the government or SOEs will try to get as much money as possible from the IPO.
Hypothesis 9: There is a negative relationship between the IPO P/E ratio and the odds-&-market-adjusted initial return.
Hypothesis 10: Issuing firms controlled by private companies have higher market-adjusted initial returns than issuing firms controlled by the government or SOEs.
Thirdly, the primary market and the secondary market are segmented in practice, though law does not segregate them. Investors in the primary market are mainly interested in the IPO market and are not interested in the secondary market trading, and vice versa. In general, money in the secondary market will not move to the primary market when there are higher returns in the

18
primary market. Under these conditions, the returns in the two markets show little tendency to converge. There is considerable evidence for this market segmentation hypothesis.
(a) The average turnover rate of more than 60% on the first trading day, as shown in Table 8, shows that most investors are only interested in the primary market.1 They sell the new shares once they are listed.
(b) The expected returns of secondary market investors are also very high since the market is highly speculative. The turnover rate in Shanghai Stock Exchange from 1999 to 2002 was, respectively, 399.22%, 449.06%, 244.27%, and 197.40%, which are among the highest in the world. Besides, the Chinese are extremely short-term investors. According to a survey by the Shanghai Stock Exchange (SSE, 1999), 12.68% of individual investors hold shares for less than one week, 61.46% of them hold shares for one to three months, 20.49% of them hold for about half a year, and only 4.88% of them hold for about one year. For institutional investors, the average percentage of share holding period for less than one week, one to three months, six months, one year are, respectively, 6.45%, 64.52%, 29.03% and 9.68%. The survey also shows that almost no investors hold a firm's shares for two years. As a result of the highly speculative market, the expected returns of the secondary market investors are also very high. They wish to become rich overnight. So many investors are unwilling to divert their money to the primary market.
(c) The fact that the lottery-winning rate is positively related to the IPO size, i.e., the bigger the IPO, the more chance subscribers have of winning, as shown in table 18, suggests that money in the primary market is relatively stable, a sign that little money moves in or out of the IPO market for different new issues.
(d) Investors are restricted by their cash flow. Investing in the primary market require more money than investing in the secondary market. An investor is given one lottery number when he put aside enough money for 1000 shares. There is little chance to get the new shares for investors with only one lottery number since the odds of winning the lottery are very low. This also deters secondary market investors from investing in the primary markets.
(e) In the case of lottery based on the market value of the tradable shares owned by secondary
1 All sales on the first trading day must be done by primary market investors because the shares other investors bought
(e.g., from the IPO investors in the first day) cannot be sold on the same day. In fact, almost all investors in the
primary market who are entitled to sell the new shares on the first day do so, since the long-term investors who receive
blocks of IPO shares must hold their new shares for at least six months.

19
market investors, the money put into the secondary market is a qualification for subscribing to the IPO. Then there is no need for the money to be transferred to the primary market. If investors in the secondary market sell shares in the secondary market, they will lose the entry qualification to IPO market.
(f) Liquidity is also important. Since there are many days between the IPO date and the trading date, liquidity-sensitive investors prefer to remain in the secondary market where they can buy today and sell tomorrow, or sell and then buy on the same day.
The turnover rate of the issuing firm's shares on the first day and the IPO size are used to test the segmented market hypothesis. According to the above analysis, the turnover rate should be positively related to the market-adjusted initial return, while the IPO size should be negatively related to the odds-&-market-adjusted initial return.
Hypothesis 11: There is a positive relationship between the first day turnover rates and the market-adjusted initial return.
Hypothesis 12: There is a negative relationship between the offering size and the odds-&-market-adjusted initial return.
To test the above hypotheses, the following models are used.
Model 3:
ii
iikii
iiiii
TurnoverivateIPOPE
MarketPEkIndusLotMoneyiceFix
LotRateROEPubOwnIPOSIZEMAR
11109
8)(765
43210
Pr
)(Pr
βββ
ββββ
βββββ
++
++++
+++++=
Model 4:
ii
iiiiki
iiiii
Turnoverivate
IPOPEMarketPEkIndusLotMoney
iceFixROEPubOwnIPOSIZEOMAR
109
87)(65
43210
Pr
)(
Pr
ββ
ββββ
βββββ
+
++++
+++++=
In addition to the independent variables used in Model 1 and Model 2, the turnover rate on the first trading day of an IPO (Turnover), the price-earning ratio of an IPO (IPOPE), the weighted price-earning ratio for all listed companies in the Shanghai Stock Exchange (MarketPE), and the dummy of whether an issuing company is controlled by a private company (Private) are added to

20
the enlarged models. The correlation coefficients of the variables are provided in Table 20. The additional independent variables used in the enlarged models are defined as follows:
MarketPE (8+) The P/E ratio of all companies listed at the stock exchanges weighted by the market value of the firms. I use the weighted P/E of listed companies in the Shanghai Stock Exchange instead of the P/E of all Chinese listed companies because of the unavailable data and because there is little difference in terms of the average market P/E ratios of the two stock exchanges
IOPPE (9+) The P/E ratio of an IPO, calculated as the offer price divided by the earnings per share
Private (10+) The dummy to show whether an issuing firm is controlled by a private company, 1-yes, 0-no
Turnover (11+) The turnover rate of a firm in the first trading day IPOSIZE (12+) Note: figures in ( ) are the related hypotheses to be tested. '+' represents an expected positive
relationship, while '-' represents an expected negative relationship.
Table 21 presents the OLS estimates for Model 3 and Model 4. The adjusted R-squares for the enlarged models are improved to a considerable extent compared with Model 1 and Model 2. The left-hand side of Table 21 shows the estimation results for Model 3. I find a significant positive relationship between the market P/E ratio and the market-adjusted initial returns, which is consistent with the secondary market overpricing hypothesis. The same relationship exists for the first day turnover rate, indicating that the primary and secondary markets are segmented.
The relationship between the issuing firms controlled by private companies and the market-adjusted initial returns are insignificant. This shows that privately owned firms also do not care much about how much money they raise since there is little dilution in control rights as a result of a partial sale. It is also reasonable considering the difficulty of going public of the privately owned companies in China. They felicitate themselves for going public even less money is raised. Hypothesis 10 is thus rejected.
The right-hand side of Table 21 reports the estimation results for Model 4. I find a significant positive relationship between the IPO P/E ratio and the odds-&-market-adjusted initial return, showing that there is low demand when the IPO price is highly priced. That is to say, the IPO price is not adjusted (or fully adjusted) to the trading price even the latter is high.
There is a significant positive relationship between the market P/E ratio and the odds-&-market- adjusted initial return, which is consistent with hypothesis 8. I also find a significantly positive relationship between the IPO size and the odds-&-market-adjusted initial return, which means the
21
lottery-winning rate is positively related to the IPO size, and shows that the money in the primary market is relatively stable, a sign of the segmented markets.
6 Conclusion and Policy Implications
This paper has focused on explaining the phenomenon of underpricing of IPOs in China. I confirm that China's IPOs enjoy some of highest initial returns in the world. I suggest that share allocation method plays a crucial role in IPO underpricing by introducing new measures of initial returns based on the lottery-winning rate: odds-adjusted and annual returns of IPOs. I have also empirically identified some of the causes of the high initial returns using data from 354 IPOs from 1999 to 2002.
I test four main hypotheses evolved form theories of information asymmetries and find that most of the hypotheses fail to explain underpricing in China's IPO market. Only the IPO size has a statistically significant positive relationship with the market-adjusted initial return, which means that the winner's curse hypothesis does hold. However, contrary to the findings of Mok and Hui (1998), Gu (2000) and Chi and Padgett (2002), I do not find a significant relationship between the ownership stake of informed investors, measured by the percentage of government-owned shares, and the market-adjusted initial return. This is further evidence that the winner's curse hypothesis does not hold. The results also show that the firm's ROE and the IPO pricing method do not have any significant relationship with the market-adjusted initial return, which means we can reject the signaling and market feedback hypothesis. I find a positive relationship between the lottery mechanism using money and the market-adjusted initial return at a significance level of 0.07. This indicates that there are bandwagon effects to some extent in China. However, I do not find a negative relationship between the lottery-winning rate and the initial returns as others have found (Liu and Li, 2000; Chi and Padgett, 2002). This suggests that the lottery-winning rate is not a good variable to explain IPO underpricing since the lottery-winning rate itself may be determined by other variables used in the explanation. The veracity of this argument is illustrated in the test of the causes of the odds-&-market- adjusted initial returns.
The lottery-winning rate is a sign of investors' demand for IPOs and is significantly related to the odds-&-market-adjusted initial return. Thus, the model for the odds-&-market-adjusted initial return is useful to test the relationship between the lottery-winning rate and other independent variables used in the model. I find that all independent variables except the industry dummies are statistically significant. The percentages of tradable shares, the IPO size, and the lottery using money method all have a significant positive relationships with the odds-&-market-adjusted initial return, showing that there are higher lottery-winning rates or lower demand for larger IPOs, IPOs with larger tradable share ratios, and IPOs which use the money-based lottery mechanism. There
22
are negative relationships between the firm's ROE and the odds-adjusted initial return, showing that investors have a higher demand for issuing firms with better profitability. The results also show that IPOs using the fixed pricing method have a lower odds-adjusted initial return than IPOs which use the bookbuilding method. The reason for this is the prices of IPOs sold with a fixed price are relatively low since the offer prices of nearly all IPOs using bookbuilding are adjusted upwards.
Theories based on information asymmetries cannot explain the extremely high initial returns of IPOs in China. These hypotheses only focus on the determination of the offer price. However, the underpricing of an IPO is in practice the result of an interactive process between the offer price and the trading price on the secondary market. Therefore, I advance a new explanation by focusing on the interplay of supply and demand in both the primary and secondary markets. I argue that IPO underpricing is the result of over-valued secondary market prices under the condition of the de facto segmented markets. The empirical results support my argument. I find a significant, positive relationship between the market P/E ratio and the market-adjusted or odds-&-market-adjusted initial return, which shows that the level of IPO underpricing changes with the price level on the secondary market.
China's primary and secondary markets are in practice segmented, i.e., in general money from one does not flow to the other. The returns in the two markets show little tendency to converge. The results show that the IPO P/E ratio has a significant, positive relationship with the odds-&- market-adjusted initial return. This evidence indicates that there is lower demand when the IPO price is set high. In other words, in order to ensure the success of the issuance, firms and underwriters do not adjust the IPO price upwards above the average if they believe the secondary market price of the shares will be higher than average. The same relationship exists for the first day turnover rate, indicating that the primary and secondary markets are in practice segmented. I also find a significantly positive relationship between the IPO size and the odds-&-market- adjusted initial return, which means the lottery-winning rate is positively related to IPO size, and shows that the amount of money in the primary market is relatively stable, a sign of segmented markets.
This new explanation provides important information for policy makers. The only way to mature the primary market is to reform the secondary market. If the secondary market over-pricing can be reduced, then the evidence of this paper suggests that the degree of IPO underpricing will also be reduced. Among all the reform measures, making non-tradable shares tradable and introducing shortselling or a day-trading mechanism are most important to lowering secondary prices to more reasonable level. In addition, this new theory will be useful for future studies on China's IPO market. It might also be useful to test IPO underpricing in other markets when there are overpriced

23
bubbles, such as the underpricing of Internet IPOs in the United States in the late 1990s, since prices of Internet stocks in the secondary markets were usually considered overpriced during that period.
24
References
Aggarwal, Reena and Patrick Conway, 2000, Price discovery in initial public offerings and the role of the lead underwriter, Journal of Finance 55, 2093-2922.
Allen, Franklin and Gerald R. Faulhaber, 1989, Signaling by underpricing in the IPO market, Journal of Financial Economics 23, 303-324.
Amihud, Yakov, Shmuel Hauser and Amir Kirsh. 2001 Allocations, adverse selection and cascades in IPOs: Evidence from Israel, working paper.
Beatty, Randolph P. and Ivo Welch, 1996, Issuer expenses and legal liability in initial public offerings, Journal of Law and Economics 39, 545-602.
Beatty, Randolph P. and Jay R. Ritter, 1986, Investment banking, reputation, and the underpricing of initial public offerings, Journal of Financial Economics 15, 213-232.
Benveniste, Lawrence M. and Paul A. Spindt, 1989, How investment bankers determine the offer price and allocation of new issues, Journal of Financial Economics 24, 343-362.
Benveniste, Lawrence M. and William J. Wilhelm, 1990, A comparative analysis of IPO proceeds under alternative regulatory environments, Journal of Financial Economics 28, 173-208.
Benveniste, Lawrence M., and Walid Y. Busaba, 1997, Bookbuilding vs. fixed price: An analysis of competing strategies for marketing IPOs, Journal of Financial and Quantitative Analysis 32, 383-403.
Carter, Richard B., Frederick H. Dark and Alan K. Singh, 1998, Underwriter reputation, initial returns, and the long-run performance of IPO stocks, Journal of Finance 53, 285-311.
Chemmanur, Thomas J., 1993, The pricing of initial public offers: A dynamic model with information production, Journal of Finance 48, 285-304.
Chi, Jing and Carol Padgett, 2002, Short-run underpricing and its characteristics in Chinese IPO markets, ISMA Discussion Papers in Finance 2001-12, University of Reading, UK.
Cornelli, Francesca and David Goldreich, 2001, Bookbuilding and strategic allocation, Journal of Finance, 2337-2369.
Datar, V. and D. Mao., 1998, Initial public offerings in China: Why is underpricing so severe, Seattle University Working Paper.
Drake, Philip D. and Michael R. Vetsuypens, 1993, IPO underpricing and insurance against legal liability, Financial Management 22, 64-73.

25
DuCharme, Larry L., Shivaram Rajgopal, and Stephan E. Sefcik, 2001, Why was internet underpricing so severe?, University of Washington working paper.
Field, Laura C. and Dennis P. Sheehan, 2001, Underpricing in IPOs: Control, monitoring, or liquidity? Penn State working paper.
Grinblatt, M. and C. Y. Hwang, 1989, Signalling and the pricing of new issues. Journal of Finance 44, 393-420.
Gu, Y. X., 2000, Privatization, firm size, and IPO performance: Evidence from Chinese A share issues, Seattle University Working Paper.
Hanley, Kathleen Weiss, 1993, The underpricing of initial public offerings and the partial adjustment phenomenon, Journal of Financial Economics 34, 231-250.
Hu, Ruyin and Liu Ti, eds., 2003, Zhong Guo Shang Shi Gong Si Cheng Bai Shi Zheng Yan Jiu (An Empirical Study of the Failure and Success of China's Listed Companies), Shanghai: Fudan University Press.
Jain, Bharat A. and Omesh Kini, 1994, The post-issue operating performance of IPO firms, Journal of Finance 49, 1699-1726.
Kim, Moonchul and Jay R. Ritter, 1999, Valuing IPOs, Journal of Financial Economics 53, 409-437.
Lee, Philip J., Stephen L. Taylor and Terry S. Walter, 1999, IPO underpricing explanations: Implications from investor application and allocation schedules, Journal of Financial and Quantitative Analysis 34, 425-444.
Liu, L. and Li W.D., 2000, Research on first day’s abnormal returns of IPOs in China's securities market, China Accounting and Finance Review 2, 4, 26-53.
Liu, Ti, 1999, Zhong Wai Gu Shi Shi Hua: Cong Hua Er Jie Dao Wai Tan (A Brief History of Stock Markets: From Wall Street to the Bunds), Shanghai: Shanghai Fareast Publishing House.
Ljungqvist, Alexander, and William Wilhelm, 2002, IPO pricing in the dot-com bubble: Complacency or incentives? NYU working paper.
Logue, Dennis E., 1973, On the pricing of unseasoned equity issues: 1965-1969, Journal of Financial and Quantitative Analysis 8, 91-103.
Loughran, Tim and Jay R. Ritter, 2002, Why has IPO underpricing increased over time? University of Florida working paper.
Loughran, Tim, Jay R. Ritter and Kristian Rydqvist, 1994, Initial public offerings: International insights, Pacific-Basin Finance Journal 2, 165-199.

26
Maksimovic, Vojislav and Pegaret Pichler, 2001, Technological innovation and initial public offerings, Review of Financial Studies 14, 459-494.
Mello, Antonio and John Parsons, 1998, Going public and the ownership structure of the firm, Journal of Financial Economics 49, 79-109.
Michaely, Roni and Wayne H. Shaw, 1994, The pricing of initial public offerings: Tests of adverse-selection and signaling theories, Review of Financial Studies 7, 279-319.
Mok, H.M.K. and Y.V. Hui, 1998, Underpricing and after market performance of IPOs in Shanghai, China, Pacific-Basin Finance Journal 6, 5, 453-474.
Perotti, Enrico C., 1995, Credible privatization, American Economic Review 85, 847-859.
Reilly, Frank K., 1973, Further evidence on short-run results for new issues investors, Journal of Financial and Quantitative Analysis 8, 83-90.
Ritter, Jay R., 1998, Initial public offerings, Contemporary Finance Digest 2, 1 (Spring), 5-30
Rock, Kevin, 1986, Why new issues are underpriced, Journal of Financial Economics 15, 187-212.
Shanghai Stock Exchange (SSE), 1999, Shanghai Zheng Quan Jiao Yi Suo A Gu Tou Zi Zhe Diao Cha (A Survey of A-share Investors of Shanghai Stock Exchange), Working Paper.
Shanghai Stock Exchange (SSE), 2003, Zhong Guo Gong Si Zhi Li Bao Gao 2003 (China Corporate Governance Report 2003), Shanghai: Fudan University Press.
Sherman, Ann, 2000, IPOs and long-term relationships: An advantage of bookbuilding, Review of Financial Studies 13, 697-714.
Spatt, Chester and Sanjay Srivastava, 1991, Preplay communication, participation restrictions, and efficiency in initial public offerings, Review of Financial Studies 4, 709-726.
Stoll, Hans R. and Anthony J. Curley, 1970, Small business and the new issues market for equities, Journal of Financial and Quantitative Analysis 5, 309-322.
Su, Dongwei and Belton M. Fleisher, 1999, An empirical investigation of underpricing in Chinese IPOs, Pacific-Basin Finance Journal 7, 2, 173-202.
Welch, Ivo, 1989, Seasoned offerings, imitation costs, and the underpricing of initial public offerings, Journal of Finance 44, 421-450.
Welch, Ivo, 1992, Sequential sales, learning, and cascades, Journal of Finance 47, 695-732.
Welch, Ivo, and Jay Ritter, 2002, A review of IPO activity, pricing and allocations, Yale ICF Working Paper, No. 02-01.

27
Table 1 Equity Structures of China's Listed Companies, 1997-2002
1997 1998 1999 2000 2001 2002
Number of Listed Companies 745 851 949 1088 1160 1224
Non-tradable shares 65.44% 65.90% 64.98% 64.28% 65.25% 65.33%
State shares 31.52% 34.25% 36.13% 38.90% 46.20% 47.20%
Legal-entity shares 30.70% 28.35% 26.58% 23.81% 18.29% 17.32%
Employee shares 2.04% 2.05% 1.19% 0.64% 0.46% 0.27%
Others 1.18% 1.25% 1.07% 0.92% 0.31% 0.54%
Tradable shares 34.56% 34.11% 34.95% 35.72% 34.75% 34.67%
A shares 22.79% 24.06% 26.33% 28.43% 25.26% 25.69%
B shares 6.04% 5.30% 4.59% 4.00% 3.13% 2.85%
Others 5.74% 4.75% 4.03% 3.28% 6.36% 6.13%
Total 100% 100% 100% 100% 100% 100%
Source: China Corporate Governance Report, 2003, Shanghai: Fudan University Press, 2003. Notes: Other non-tradable shares include right issues that government transfers to other firms, etc. Other tradable shares
include H shares (shares traded in Hong Kong), N shares (shares traded in NYSE), etc.
Table 2 Number of IPOs in China by the year of issuing, 1999-2002
No. of IPOs Percentage
Total Shanghai Shenzhen Total Shanghai Shenzhen
1999 94 48 46 26.55 17.98 52.87
2000 124 83 41 35.03 31.09 47.13
2001 68 68 19.21 25.47
2002 68 68 19.21 25.47
Total 354 267 87 100 100 100
Mean 88.50 66.75 21.75

28
Table 3 Number of IPOs in China by the month of issuing, 1999-2002
No. of IPOs Percentage Total Shanghai Shenzhen Total Shanghai Shenzhen
Jan 22 20 2 6.21 7.49 2.30 Feb 15 13 2 4.24 4.87 2.30 Mar 27 18 9 7.63 6.74 10.34 Apr 30 19 11 8.47 7.12 12.64 May 36 25 11 10.17 9.36 12.64 Jun 32 23 9 9.04 8.61 10.34 Jul 50 33 17 14.12 12.36 19.54
Aug 35 26 9 9.89 9.74 10.34 Sept 35 24 11 9.89 8.99 12.64 Oct 17 15 2 4.80 5.62 2.30 Nov 28 26 2 7.91 9.74 2.30 Dec 27 25 2 7.63 9.36 2.30
Total 354 267 87 100 100 100 Table 4 Correlations between Monthly Number of IPOs and Monthly Returns of Shanghai A Index, 1999-2002
Number of IPOs
Pearson Correlation 0.085804 Return of Shanghai A Index Sig. (2-tailed) 0.562001 N 48

29
Table 5 Number of IPOs by Industry, 1999-2002
Industry
1 2 3 4 5 6 Total
1999 Count 1 8 2 11 68 4 94
% within IPO year 1.06 8.51 2.13 11.70 72.34 4.26 100.00
% within Industry 20.00 36.36 28.57 16.18 30.63 13.33 26.55
% of Total 0.28 2.26 0.56 3.11 19.21 1.13 26.55
2000 Count 1 10 56 51 6 124
% within IPO year 0.81 8.06 45.16 41.13 4.84 100.00
% within Industry 20.00 45.45 82.35 22.97 20.00 35.03
% of Total 0.28 2.82 15.82 14.41 1.69 35.03
2001 Count 2 3 1 56 6 68
% within IPO year 2.94 4.41 1.47 82.35 8.82 100.00
% within Industry 9.09 42.86 1.47 25.23 20.00 19.21
% of Total 0.56 0.85 0.28 15.82 1.69 19.21
2002 Count 3 2 2 47 14 68
% within IPO year 4.41 2.94 2.94 69.12 20.59 100.00
% within Industry 60.00 9.09 28.57 21.17 46.67 19.21
% of Total 0.85 0.56 0.56 13.28 3.95 19.21
Total Count 5 22 7 68 222 30 354
% within IPO year 1.41 6.21 1.98 19.21 62.71 8.47 100.00
% within Industry 100.00 100.00 100.00 100.00 100.00 100.00 100.00
% of Total 1.41 6.21 1.98 19.21 62.71 8.47 100.00
Note: The meaning of the figures in the second line represent the following industry: 1 for finance, 2 public utilities, 3
real estate, 4 diversified conglomerates, 5 manufacturing, 6 commerce and services.

30
Table 6 Number of IPOs by Pricing Method, 1999-2002
Pricing method
Fixed Price Bookbuilding Total
1999 Count 94 94 % within IPO year 100.00 100.00 % within pricing method 34.94 26.55 % of Total 26.55 26.55
2000 Count 121 3 124 % within IPO year 97.58 2.42 100.00 % within pricing method 44.98 3.53 35.03 % of Total 34.18 0.85 35.03
2001 Count 54 14 68 % within IPO year 79.41 20.59 100.00 % within pricing method 20.07 16.47 19.21 % of Total 15.25 3.95 19.21
2002 Count 68 68 % within IPO year 100.00 100.00 % within pricing method 80.00 19.21 % of Total 19.21 19.21
Total Count 269 85 354 % within IPO year 75.99 24.01 100.00 % within pricing method 100.00 100.00 100.00 % of Total 75.99 24.01 100.00

31
Table 7 Number of IPOs by Share Allocation Method, 1999-2002
Share Allocation Method
1 2 3 4 Total
1999 Count 93 1 94
% within IPO year 98.94 1.06 100.00
% within issuing method 38.91 1.52 26.55
% of Total 26.27 0.28 26.55
2000 Count 64 58 2 124
% within IPO year 51.61 46.77 1.61 100.00
% within issuing method 26.78 87.88 100.00 35.03
% of Total 18.08 16.38 0.56 35.03
2001 Count 63 5 68
% within IPO year 92.65 7.35 100.00
% within issuing method 26.36 7.58 19.21
% of Total 17.80 1.41 19.21
2002 Count 19 47 2 68
% within IPO year 27.94 69.12 2.94 100.00
% within issuing method 7.95 100.00 3.03 19.21
% of Total 5.37 13.28 0.56 19.21
Total Count 239 47 66 2 354
% within IPO year 67.51 13.28 18.64 0.56 100.00
% within issuing method 100.00 100.00 100.00 100.00 100.00
% of Total 67.51 13.28 18.64 0.56 100.00
Note: The meaning of the figures in the second line represent the following share allocation method: 1 for lottery using
money, 2 for lottery based on the market value of tradable shares subscribers held, 3 both 1 and 2, 4 other methods.

32
Table 8 Key Descriptive Statistics of IPOs in China, 1999-2002
Year Number of
IPOs Mean Median Minimum Maximum Std. Deviation Std. Error of
Mean IPO Price (RMB Yuan)
1999 94 6.16 5.78 3.05 13.20 2.00 0.21 2000 124 8.23 7.70 3.78 20.00 3.20 0.29 2001 68 9.40 8.27 2.27 36.68 5.84 0.71 2002 68 7.19 6.55 2.20 16.18 3.33 0.40 Total 354 7.71 6.80 2.20 36.68 3.81 0.20
IPO Quantity (million shares)
1999 94 90.27 65.00 13.34 400.00 77.46 7.98 2000 124 83.89 58.00 25.00 1877.00 169.78 15.24 2001 68 163.66 57.50 18.00 2800.00 401.62 48.70 2002 68 165.59 42.50 4.00 5000.00 625.62 75.87 Total 354 116.60 58.00 4.00 5000.00 343.48 18.26
IPO Market Value (million RMB Yuan)
1999 94 538.27 351.65 108.80 4000.00 513.81 53.00 2000 124 614.19 444.55 144.00 7845.86 817.54 73.42 2001 68 1222.99 509.38 133.20 13440.00 2366.47 286.98 2002 68 739.81 306.53 32.40 11500.00 1871.08 226.90 Total 354 735.10 407.75 32.40 13440.00 1446.09 76.86
IPO P/E Ratio
1999 94 17.0462 17.0000 12.0800 22.7000 1.8440 0.1902
2000 124 30.4335 29.1450 17.0600 71.4500 9.5217 0.8551
2001 68 33.3860 32.7800 16.1500 74.2000 12.0671 1.4633
2002 68 19.3112 20.0000 12.2200 21.4700 1.7325 0.2101
Total 354 25.3093 20.0000 12.0800 74.2000 10.3728 0.5513
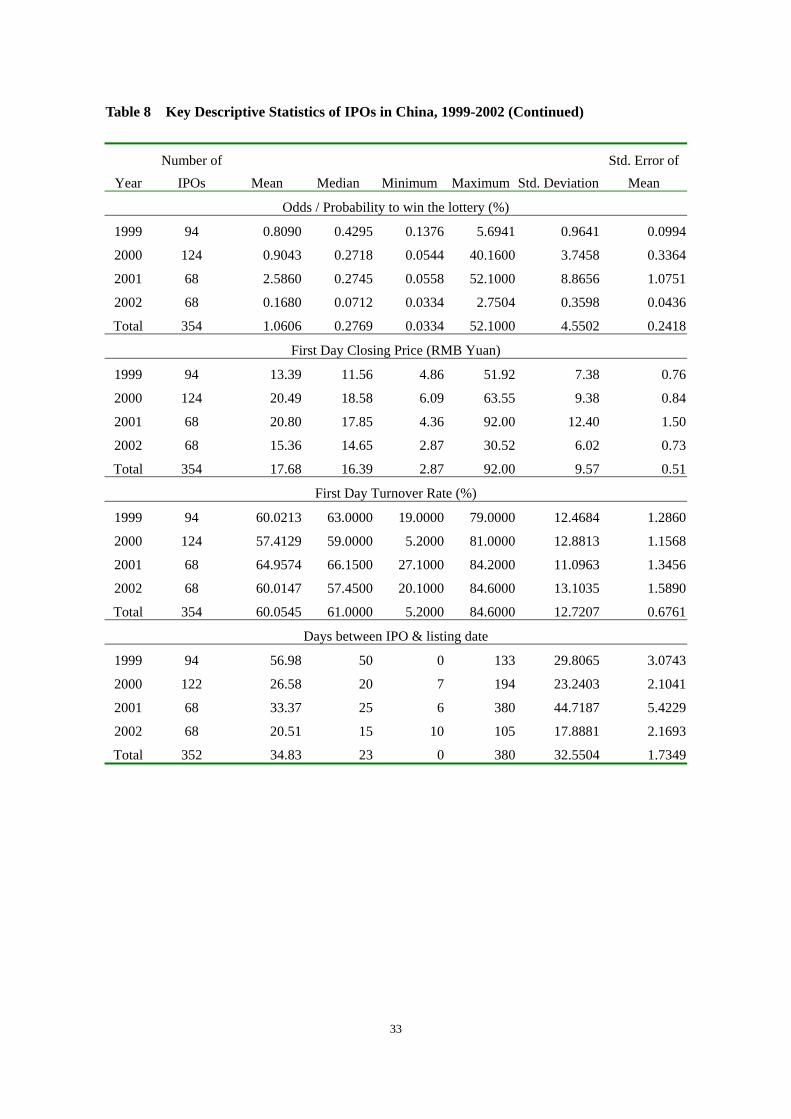
33
Table 8 Key Descriptive Statistics of IPOs in China, 1999-2002 (Continued)
Year Number of
IPOs Mean Median Minimum Maximum Std. Deviation Std. Error of
Mean Odds / Probability to win the lottery (%)
1999 94 0.8090 0.4295 0.1376 5.6941 0.9641 0.0994 2000 124 0.9043 0.2718 0.0544 40.1600 3.7458 0.3364 2001 68 2.5860 0.2745 0.0558 52.1000 8.8656 1.0751 2002 68 0.1680 0.0712 0.0334 2.7504 0.3598 0.0436 Total 354 1.0606 0.2769 0.0334 52.1000 4.5502 0.2418
First Day Closing Price (RMB Yuan)
1999 94 13.39 11.56 4.86 51.92 7.38 0.76 2000 124 20.49 18.58 6.09 63.55 9.38 0.84 2001 68 20.80 17.85 4.36 92.00 12.40 1.50 2002 68 15.36 14.65 2.87 30.52 6.02 0.73 Total 354 17.68 16.39 2.87 92.00 9.57 0.51
First Day Turnover Rate (%)
1999 94 60.0213 63.0000 19.0000 79.0000 12.4684 1.2860 2000 124 57.4129 59.0000 5.2000 81.0000 12.8813 1.1568 2001 68 64.9574 66.1500 27.1000 84.2000 11.0963 1.3456 2002 68 60.0147 57.4500 20.1000 84.6000 13.1035 1.5890 Total 354 60.0545 61.0000 5.2000 84.6000 12.7207 0.6761
Days between IPO & listing date
1999 94 56.98 50 0 133 29.8065 3.0743
2000 122 26.58 20 7 194 23.2403 2.1041
2001 68 33.37 25 6 380 44.7187 5.4229
2002 68 20.51 15 10 105 17.8881 2.1693
Total 352 34.83 23 0 380 32.5504 1.7349

34
Table 9 Initial Returns and Market-Adjusted Initial Returns of IPOs in China, 1999-2002
Year Number of Cases
Mean Median Minimum Maximum Std. Deviation
Std. Error of Mean
Initial Return (%)
1999 94 113.1943 103.8132 7.1429 341.8723 72.9382 7.5230
2000 124 155.4353 141.6428 21.8182 476.7726 85.2153 7.6526
2001 68 136.1010 117.4548 0.7353 413.7931 90.2868 10.9489
2002 68 126.8354 113.9295 24.7826 428.2500 78.1570 9.4779
Total 354 135.0111 123.8835 0.7353 476.7726 83.2157 4.4229
Market-adjusted Initial Return (%)
1999 94 107.5434 91.9204 6.0138 386.2034 70.7564 7.2980
2000 124 149.8867 138.5667 21.7793 478.4055 80.9288 7.2676
2001 68 140.5123 122.2114 3.4660 411.8761 89.5395 10.8583
2002 68 127.2473 117.4633 25.0691 429.9360 79.7601 9.6723
Total 354 132.4935 120.7939 3.4660 478.4055 81.3632 4.3244
Table 10 Odds-Adjusted Initial Returns and Odds-&-Market- Adjusted Initial Returns of IPOs in China, 1999-2002
Year Number of
Cases Mean Median Minimum Maximum Std.
Deviation Std. Error of
Mean Odds-adjusted Initial Return (%)
1999 94 0.6588 0.5226 0.0659 6.0354 0.7244 0.0747 2000 124 0.8038 0.4327 0.0757 18.5638 1.9897 0.1787 2001 68 1.4892 0.3186 0.0370 26.0500 4.7415 0.5750 2002 68 0.1369 0.0942 0.0183 0.6816 0.1238 0.0150 Total 354 0.7689 0.3313 0.0183 26.0500 2.4430 0.1298
Odds-&-market-adjusted Initial Return (%)
1999 94 0.6523 0.4597 0.0555 6.7587 0.7989 0.0824 2000 124 0.7714 0.4132 0.0857 17.8340 1.9295 0.1733 2001 68 1.6923 0.3392 0.1156 31.1534 5.5976 0.6788 2002 68 0.1365 0.0930 0.0161 0.8371 0.1310 0.0159 Total 354 0.7947 0.3391 0.0161 31.1534 2.7677 0.1471
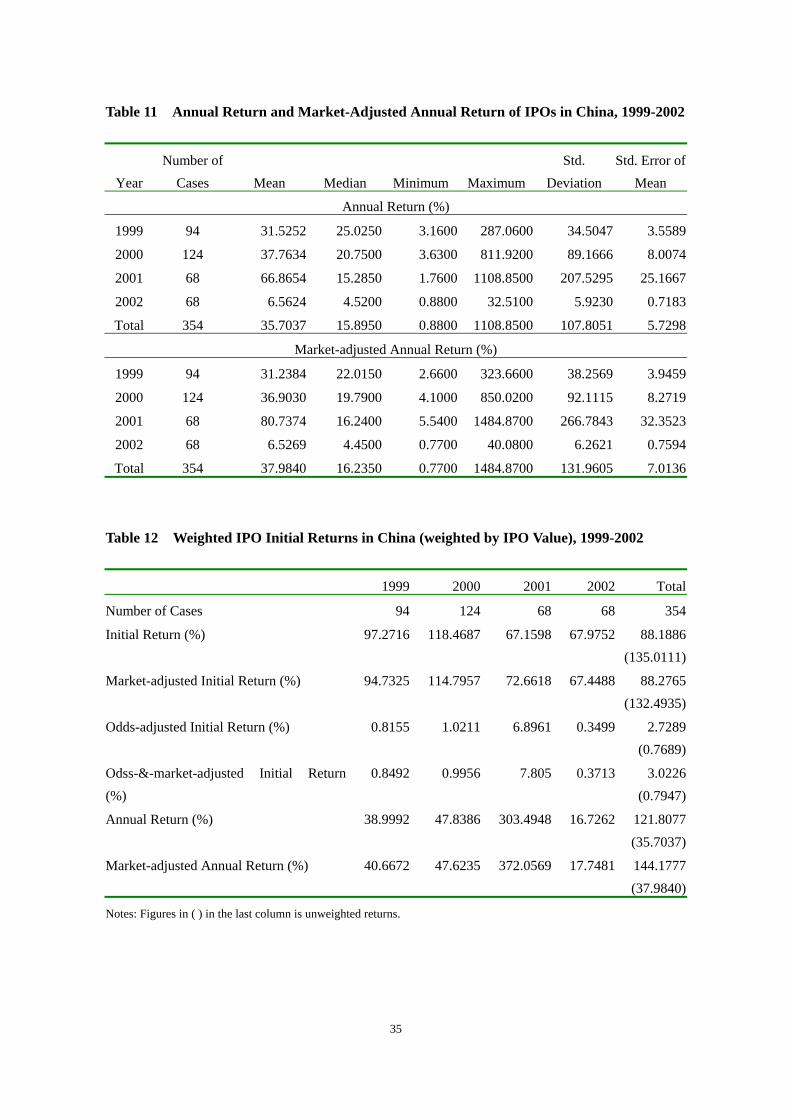
35
Table 11 Annual Return and Market-Adjusted Annual Return of IPOs in China, 1999-2002
Year Number of
Cases Mean Median Minimum Maximum Std.
Deviation Std. Error of
Mean Annual Return (%)
1999 94 31.5252 25.0250 3.1600 287.0600 34.5047 3.5589 2000 124 37.7634 20.7500 3.6300 811.9200 89.1666 8.0074 2001 68 66.8654 15.2850 1.7600 1108.8500 207.5295 25.1667 2002 68 6.5624 4.5200 0.8800 32.5100 5.9230 0.7183 Total 354 35.7037 15.8950 0.8800 1108.8500 107.8051 5.7298
Market-adjusted Annual Return (%)
1999 94 31.2384 22.0150 2.6600 323.6600 38.2569 3.9459 2000 124 36.9030 19.7900 4.1000 850.0200 92.1115 8.2719 2001 68 80.7374 16.2400 5.5400 1484.8700 266.7843 32.3523 2002 68 6.5269 4.4500 0.7700 40.0800 6.2621 0.7594 Total 354 37.9840 16.2350 0.7700 1484.8700 131.9605 7.0136
Table 12 Weighted IPO Initial Returns in China (weighted by IPO Value), 1999-2002
1999 2000 2001 2002 Total Number of Cases 94 124 68 68 354 Initial Return (%) 97.2716 118.4687 67.1598 67.9752 88.1886
(135.0111)
Market-adjusted Initial Return (%) 94.7325 114.7957 72.6618 67.4488 88.2765 (132.4935)
Odds-adjusted Initial Return (%) 0.8155 1.0211 6.8961 0.3499 2.7289 (0.7689)
Odss-&-market-adjusted Initial Return (%)
0.8492 0.9956 7.805 0.3713 3.0226 (0.7947)
Annual Return (%) 38.9992 47.8386 303.4948 16.7262 121.8077 (35.7037)
Market-adjusted Annual Return (%) 40.6672 47.6235 372.0569 17.7481 144.1777 (37.9840)
Notes: Figures in ( ) in the last column is unweighted returns.
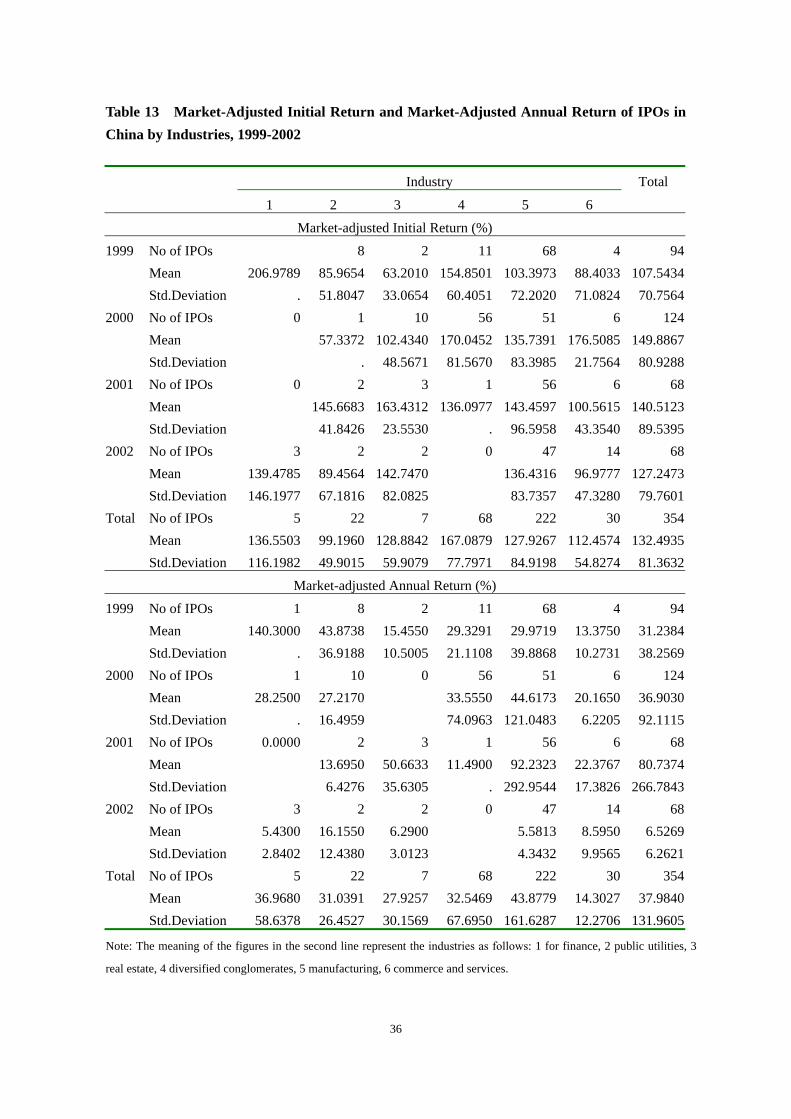
36
Table 13 Market-Adjusted Initial Return and Market-Adjusted Annual Return of IPOs in China by Industries, 1999-2002
Industry Total
1 2 3 4 5 6
Market-adjusted Initial Return (%)
1999 No of IPOs 8 2 11 68 4 94 Mean 206.9789 85.9654 63.2010 154.8501 103.3973 88.4033 107.5434 Std.Deviation . 51.8047 33.0654 60.4051 72.2020 71.0824 70.7564 2000 No of IPOs 0 1 10 56 51 6 124 Mean 57.3372 102.4340 170.0452 135.7391 176.5085 149.8867 Std.Deviation . 48.5671 81.5670 83.3985 21.7564 80.9288 2001 No of IPOs 0 2 3 1 56 6 68 Mean 145.6683 163.4312 136.0977 143.4597 100.5615 140.5123 Std.Deviation 41.8426 23.5530 . 96.5958 43.3540 89.5395 2002 No of IPOs 3 2 2 0 47 14 68 Mean 139.4785 89.4564 142.7470 136.4316 96.9777 127.2473 Std.Deviation 146.1977 67.1816 82.0825 83.7357 47.3280 79.7601 Total No of IPOs 5 22 7 68 222 30 354 Mean 136.5503 99.1960 128.8842 167.0879 127.9267 112.4574 132.4935 Std.Deviation 116.1982 49.9015 59.9079 77.7971 84.9198 54.8274 81.3632
Market-adjusted Annual Return (%)
1999 No of IPOs 1 8 2 11 68 4 94 Mean 140.3000 43.8738 15.4550 29.3291 29.9719 13.3750 31.2384 Std.Deviation . 36.9188 10.5005 21.1108 39.8868 10.2731 38.2569 2000 No of IPOs 1 10 0 56 51 6 124 Mean 28.2500 27.2170 33.5550 44.6173 20.1650 36.9030 Std.Deviation . 16.4959 74.0963 121.0483 6.2205 92.1115 2001 No of IPOs 0.0000 2 3 1 56 6 68 Mean 13.6950 50.6633 11.4900 92.2323 22.3767 80.7374 Std.Deviation 6.4276 35.6305 . 292.9544 17.3826 266.7843 2002 No of IPOs 3 2 2 0 47 14 68 Mean 5.4300 16.1550 6.2900 5.5813 8.5950 6.5269 Std.Deviation 2.8402 12.4380 3.0123 4.3432 9.9565 6.2621 Total No of IPOs 5 22 7 68 222 30 354 Mean 36.9680 31.0391 27.9257 32.5469 43.8779 14.3027 37.9840 Std.Deviation 58.6378 26.4527 30.1569 67.6950 161.6287 12.2706 131.9605
Note: The meaning of the figures in the second line represent the industries as follows: 1 for finance, 2 public utilities, 3
real estate, 4 diversified conglomerates, 5 manufacturing, 6 commerce and services.
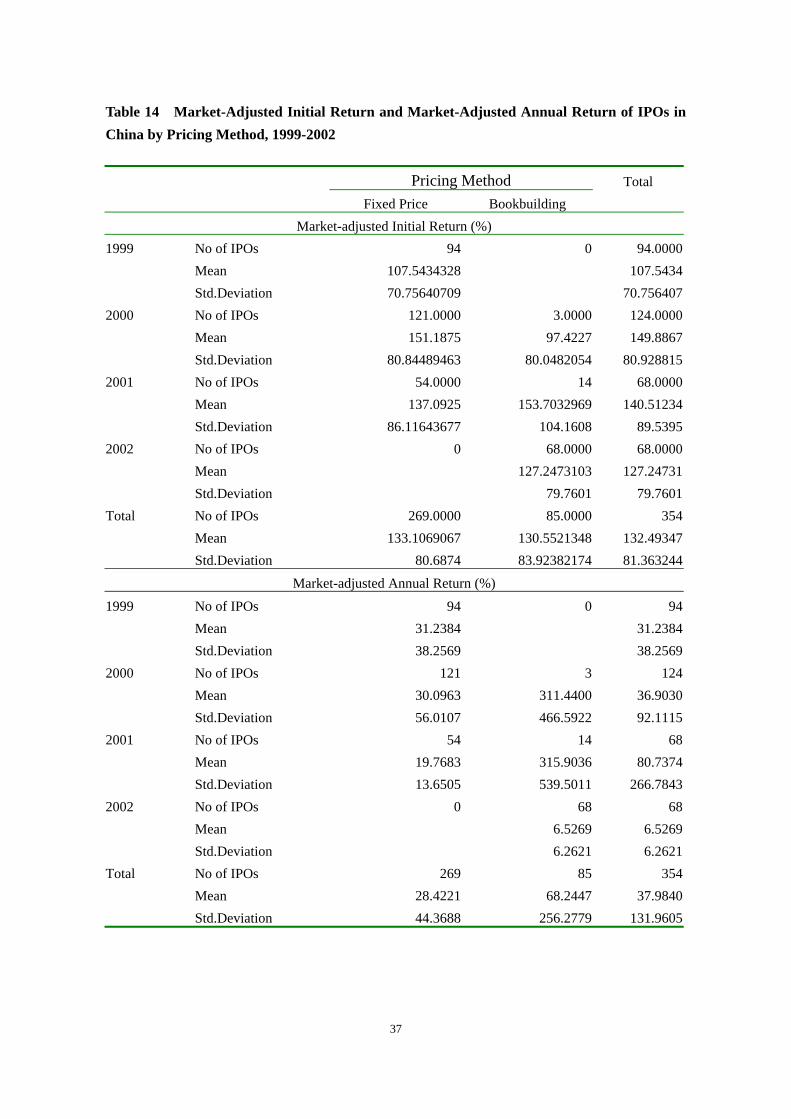
37
Table 14 Market-Adjusted Initial Return and Market-Adjusted Annual Return of IPOs in China by Pricing Method, 1999-2002
Pricing Method Total Fixed Price Bookbuilding
Market-adjusted Initial Return (%) 1999 No of IPOs 94 0 94.0000 Mean 107.5434328 107.5434 Std.Deviation 70.75640709 70.756407 2000 No of IPOs 121.0000 3.0000 124.0000 Mean 151.1875 97.4227 149.8867 Std.Deviation 80.84489463 80.0482054 80.928815 2001 No of IPOs 54.0000 14 68.0000 Mean 137.0925 153.7032969 140.51234 Std.Deviation 86.11643677 104.1608 89.5395 2002 No of IPOs 0 68.0000 68.0000 Mean 127.2473103 127.24731 Std.Deviation 79.7601 79.7601 Total No of IPOs 269.0000 85.0000 354 Mean 133.1069067 130.5521348 132.49347 Std.Deviation 80.6874 83.92382174 81.363244
Market-adjusted Annual Return (%) 1999 No of IPOs 94 0 94 Mean 31.2384 31.2384 Std.Deviation 38.2569 38.2569 2000 No of IPOs 121 3 124 Mean 30.0963 311.4400 36.9030 Std.Deviation 56.0107 466.5922 92.1115 2001 No of IPOs 54 14 68 Mean 19.7683 315.9036 80.7374 Std.Deviation 13.6505 539.5011 266.7843 2002 No of IPOs 0 68 68 Mean 6.5269 6.5269 Std.Deviation 6.2621 6.2621 Total No of IPOs 269 85 354 Mean 28.4221 68.2447 37.9840 Std.Deviation 44.3688 256.2779 131.9605

38
Table 15 Market-Adjusted Initial Return and Market-Adjusted Annual Return of IPOs in China by Share Allocation Method, 1999-2002
Share Allocation Method Total
1 2 3 4
Market-adjusted Initial Return (%) 1999 No of IPOs 93 0 1 0 94 Mean 107.1529 143.8617 107.5434 Std.Deviation 71.0380 . 70.7564 2000 No of IPOs 64 0 58 2 124 Mean 155.2652 144.3889 137.2110 149.8867 Std.Deviation 86.1219 76.2964 50.8453 80.9288 2001 No of IPOs 63 0 5 0 68 Mean 146.5252 64.7502 140.5123 Std.Deviation 90.1492 24.0668 89.5395 2002 No of IPOs 19 47 2 0 68 Mean 129.7293 126.5332 120.4503 127.2473 Std.Deviation 78.9370 82.5973 3.6038 79.7601 Total No of IPOs 239 47 66 2 354 Mean 132.2098 126.5332 137.6223 137.2110 132.4935 Std.Deviation 83.3389 82.5973 74.8301 50.8453 81.3632
Market-adjusted Annual Return (%) 1999 No of IPOs 93 0 1 0 94 Mean 31.3704 18.9600 31.2384 Std.Deviation 38.4427 . 38.2569 2000 No of IPOs 64 0 58 2 124 Mean 26.3948 48.9769 23.0200 36.9030 Std.Deviation 16.6089 133.1254 11.6531 92.1115 2001 No of IPOs 63 0 5 0 68 Mean 18.4613 865.4160 80.7374 Std.Deviation 13.0746 598.9811 266.7843 2002 No of IPOs 19 47 2 0 68 Mean 10.5216 4.7087 11.3050 6.5269 Std.Deviation 5.6746 5.6580 8.4216 6.2621 Total No of IPOs 239 47 66 2 354 Mean 24.9778 4.7087 109.2320 23.0200 37.9840 Std.Deviation 27.1236 5.6580 292.0047 11.6531 131.9605
Note: The meaning of the figures in the second line represent the following share allocation method: 1 for lottery using
money, 2 for lottery based on the market value of tradable shares subscribers held, 3 both 1 and 2, 4 other methods.

39
Table 16 Average Initial Returns of IPOs in 33 countries or markets
Country/ Market Time Period Sample Size
Initial Return
Country/ Market Time Period Sample Size
Initial Return
Emerging Markets (13) Developed Markets (20)
Israel 1993-1994 28 4.5% France 1983-1992 187 4.2%
Turkey 1990-1995 138 13.6% Canada 1971-1992 258 5.4%
Hong Kong China 1980-1996 334 15.9% United States 1980-2000 6,169 6.3%
Chile 1982-1990 19 16.3% Austria 1964-1996 67 6.5%
Singapore 1973-1992 128 31.4% Netherlands 1982-1991 72 7.2%
Mexico 1987-1990 37 33.0% Denmark 1989-1997 32 7.7%
India 1992-1993 98 35.3% Finland 1984-1992 85 9.6%
Taiwan China 1971-1990 168 45.0% Belgium 1984-1990 28 10.1%
Thailand 1988-1989 32 58.1% Germany 1978-1992 170 10.9%
Korea 1980-1990 347 78.1% Australia 1976-1989 266 11.9%
Brazil 1979-1990 62 78.5% United Kingdom 1959-1990 2,133 12.0%
Malaysia 1980-1991 132 80.3% Norway 1984-1996 68 12.5%
China 1999-2002 354 135.0% Japan 1970-1996 975 24.0%
China 1990-1996 226 388.0% Italy 1985-1991 75 27.1%
New Zealand 1979-1991 149 28.8% Sweden 1980-1994 251 34.1% Spain 1985-1990 71 35.0%
Switzerland 1983-1989 42 35.8%
Greece 1987-1991 79 48.5% Portugal 1986-1987 62 54.4%
Average (excluding China) 40.8% Average 19.6%
Average (including China 1999-2002) 48.1%
Total Average (excluding China) 27.6%
Total Average (including China 1999-2002) 30.8%
Source: Ritter (1998), Loughran & Ritter (2002).
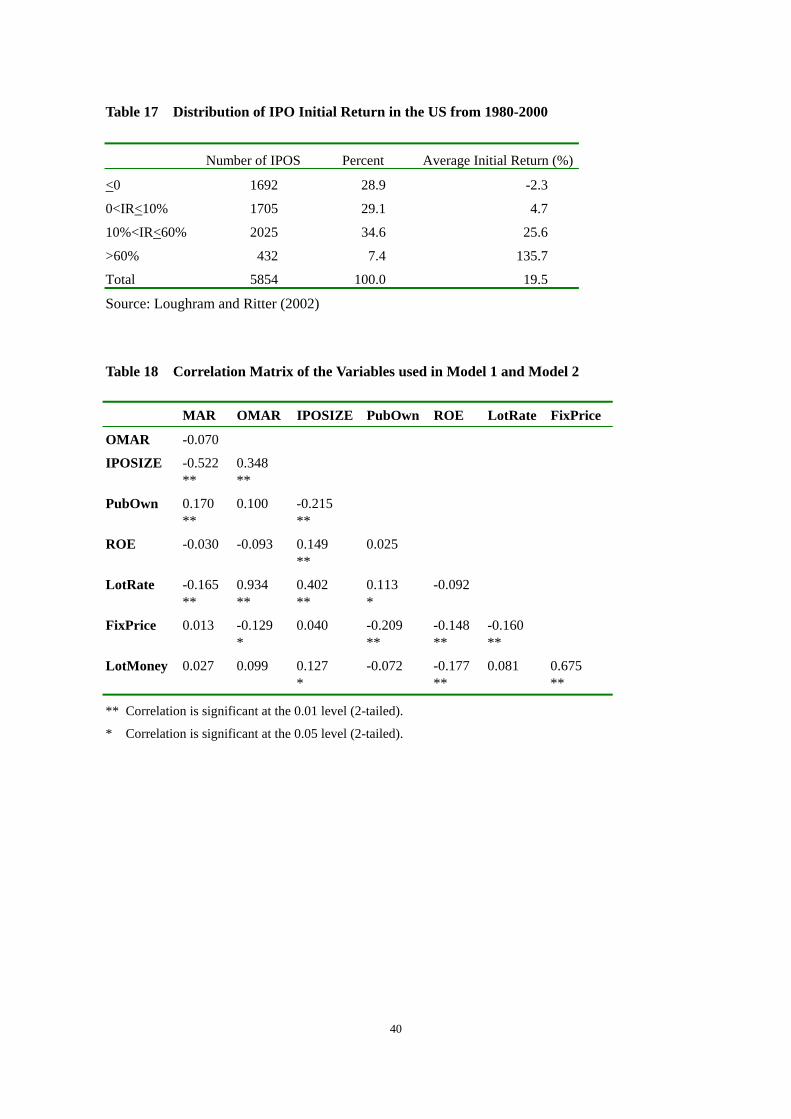
40
Table 17 Distribution of IPO Initial Return in the US from 1980-2000
Number of IPOS Percent Average Initial Return (%)
<0 1692 28.9 -2.3
0<IR<10% 1705 29.1 4.7
10%<IR<60% 2025 34.6 25.6
>60% 432 7.4 135.7
Total 5854 100.0 19.5
Source: Loughram and Ritter (2002) Table 18 Correlation Matrix of the Variables used in Model 1 and Model 2 MAR OMAR IPOSIZE PubOwn ROE LotRate FixPrice
OMAR -0.070
IPOSIZE -0.522 **
0.348 **
PubOwn 0.170 **
0.100 -0.215 **
ROE -0.030 -0.093 0.149 **
0.025
LotRate -0.165 **
0.934 **
0.402 **
0.113 *
-0.092
FixPrice 0.013 -0.129 *
0.040 -0.209 **
-0.148 **
-0.160 **
LotMoney 0.027 0.099 0.127 *
-0.072 -0.177 **
0.081 0.675 **
** Correlation is significant at the 0.01 level (2-tailed).
* Correlation is significant at the 0.05 level (2-tailed).

41
Table 19 Estimates for Model 1 and Model 2 of IPO Underpricing in China All regressions use 354 observations when the sample period is from January 1999 to December 2002. The dependent variables are market-adjusted initial returns and odds-&-market-adjusted initial returns. The independent variables are the logarithm of the offer size measured in RMB Yuan (IPOSIZE), The percentage of tradable shares (PubOwn), Return on equity a year before IPO date (ROE), the odds of winning the lottery (LotRate), the pricing method dummy to show whether a firm adopts fix-price method (FixPrice), the share allocation method dummy to show whether an IPO is allocated based on the lottery using money (includes IPOs based on the lottery based on both money and market value of the tradable shares subscribers held) (LotMoney), and the industry dummies (indus1 for finance, indus2 public utilities, indus3 real estate, indus4 diversified conglomerates, indus5 manufacturing, indus6 commerce and services). The estimation method is the ordinary least squares. The t-statistics and significance are provided.
Model 1
Dependent Variable: MAR Model 2
Dependent Variable: OMAR
Coefficients t Sig. Coefficients t Sig.
(Constant) 1316.575 12.264 0.000 -26.209 -7.189 .000
IPOSIZE -60.412 -11.613 0.000 1.333 7.620 .000
PubOwn 0.140 0.289 0.773 0.050 2.783 .006
ROE -0.325 -0.790 0.430 -0.047 -3.090 .002
LotRate 0.915 1.007 0.315
FixPrice 9.473 0.775 0.439 -1.915 -4.306 .000
LotMoney 30.304 1.806 0.072 1.478 2.358 .019
Indus1 -93.980 -3.110 0.002 -.876 -.771 .441
Indus2 -91.304 -5.745 0.000 -0.020 -.033 .973
Indus3 -70.809 -2.743 0.006 -0.028 -.029 .977
Indus4 -24.200 -2.322 0.021 -.142 -.362 .717
Indus6 2.201 0.124 0.902 -.713 -1.068 .286
Adjusted R Square Std. Error of the Estimate F-statistics Sig.
0.351 65.569 18.332
0.000
0.205 2.468
10.100 0.000
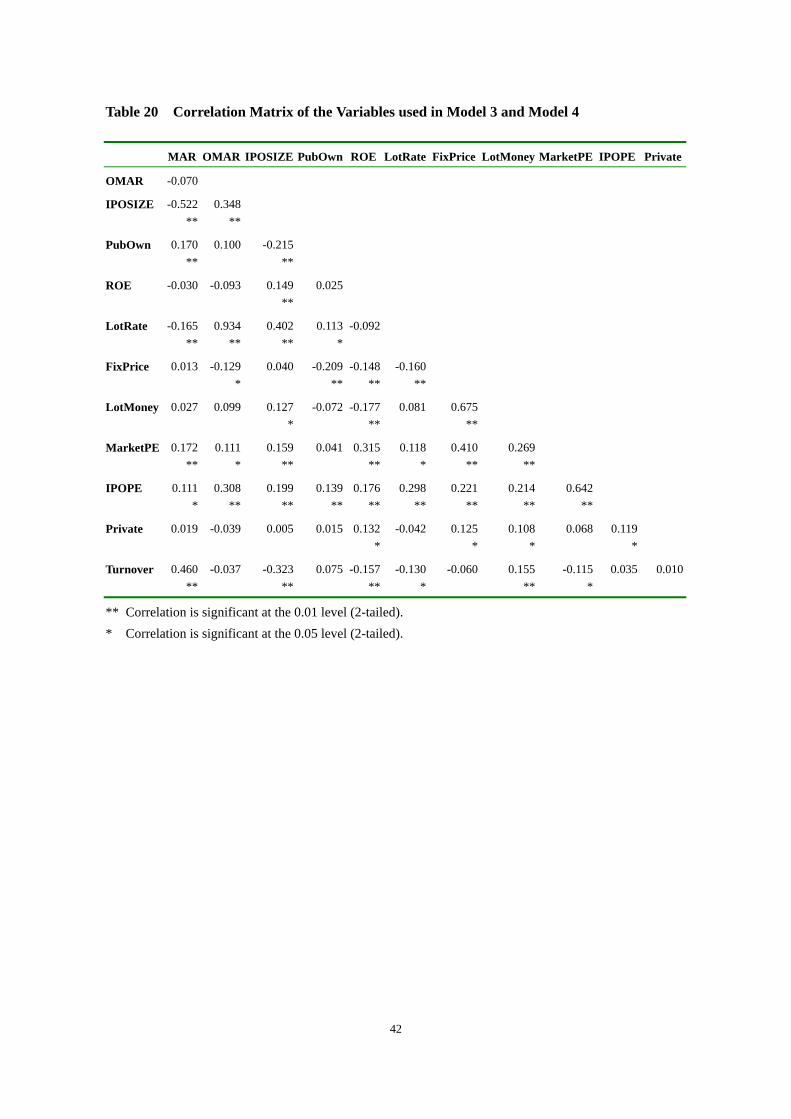
42
Table 20 Correlation Matrix of the Variables used in Model 3 and Model 4
MAR OMAR IPOSIZE PubOwn ROE LotRate FixPrice LotMoney MarketPE IPOPE Private
OMAR -0.070
IPOSIZE -0.522 **
0.348 **
PubOwn 0.170 **
0.100 -0.215 **
ROE -0.030 -0.093 0.149 **
0.025
LotRate -0.165 **
0.934 **
0.402 **
0.113 *
-0.092
FixPrice 0.013 -0.129 *
0.040 -0.209 **
-0.148 **
-0.160 **
LotMoney 0.027 0.099 0.127 *
-0.072 -0.177 **
0.081 0.675 **
MarketPE 0.172 **
0.111 *
0.159 **
0.041 0.315 **
0.118 *
0.410 **
0.269 **
IPOPE 0.111 *
0.308 **
0.199 **
0.139 **
0.176 **
0.298 **
0.221 **
0.214 **
0.642 **
Private 0.019 -0.039 0.005 0.015 0.132 *
-0.042 0.125 *
0.108 *
0.068 0.119 *
Turnover 0.460 **
-0.037 -0.323 **
0.075 -0.157 **
-0.130 *
-0.060 0.155 **
-0.115 *
0.035 0.010
** Correlation is significant at the 0.01 level (2-tailed). * Correlation is significant at the 0.05 level (2-tailed).

43
Table 21 Estimates for Model 3 and Model 4 of IPO Underpricing in China All regressions use 354 observations when the sample period is from January 1999 to December 2002. The dependent variables are market-adjusted initial returns and odds-&-market-adjusted initial returns. In addition to the independent variables used in Model 1 and Model 2, the turnover rate in the first trading day of an IPO (Turnover), the price-earning ratio of an IPO (IPOPE), the weighted price-earning ratio for all listed companies in Shanghai Stock Exchange (MarketPE), the dummy of whether an issuing company is controlled by a private company (Private) are added to the enlarged models. The estimation method is the ordinary least squares. The t-statistics and significance are provided.
Model 3
Dependent Variable: MAR Model 4
Dependent Variable: OMAR
Coefficients t Sig. Coefficients t Sig.
(Constant) 839.681 7.163 0.000 -25.705 -6.429 0.000
IPOSIZE -48.599 -9.710 0.000 0.962 5.549 0.000
PubOwn 0.161 0.359 0.720 0.021 1.261 0.208
ROE -0.040 -0.102 0.919 -0.035 -2.435 0.015
LotRate 0.553 0.573 0.567
FixPrice -3.363 -0.189 0.850 -4.884 -8.634 0.000
LotMoney 7.708 0.482 0.630 1.654 2.857 0.005
MarketPE 2.356 2.823 0.005 0.132 4.510 0.000
IPOPE 0.151 0.316 0.753 0.109 6.572 0.000
Private 4.048 0.305 0.761 -0.676 -1.385 0.167
Turnover 2.274 7.721 0.000 -0.005 -0.506 0.613
Indus1 -24.620 -0.740 0.460 3.645 3.037 0.003
Indus2 -41.792 -1.823 0.069 4.332 5.492 0.000
Indus3 -34.278 -1.286 0.199 3.451 3.603 0.000
Indus4 13.270 0.876 0.382 3.179 6.094 0.000
Indus6 23.981 1.445 0.149 -0.207 -0.338 0.736
Adjusted R Square Std. Error of the Estimate F-statistics Sig.
0.454 60.110 20.584
0.000
0.359 2.216 15.123
0.000

44
Figure 1 Equity Structures of China's Listed Companies, 2002
B shares3%
Others7%
A shares26%
Legal-entityshares17%
State shares47%
Source: China Corporate Governance Report, 2003, Shanghai: Fudan University Press, 2003. Figure 2 Number of IPOs in China by the year of issuing, 1999-2002
����������������������������������
������
�������������������������������
������������������
��������������������������������������
��������
������������������������������
����������������
0
30
60
90
120
150
1999 2000 2001 2002
Total��������������
�� Shanghai
Shenzhen

45
Figure 3 Number of IPOs in China by the month of issuing, 1999-2002
0
10
20
30
40
50
60
Jan Feb Mar Apr May Jun Jul Aug Sept Oct Nov Dec
Total
Shanghai
Shenzhen
Figure 4 Monthly Number of IPOs and Returns of Shanghai A Index, 1999-2002
-15
0
15
30
45
199901 199907 200001 200007 200101 200107 200201 200207
Number of IPOs
Monthly Return of Shanghai A Index (%)
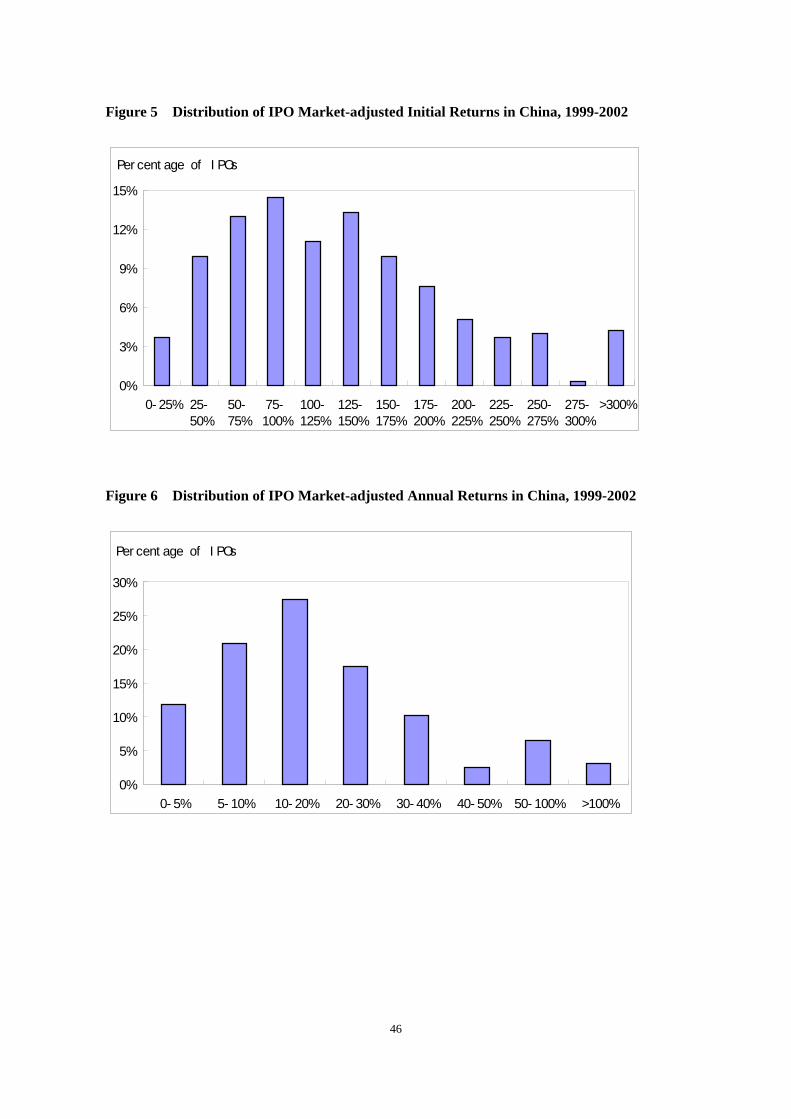
46
Figure 5 Distribution of IPO Market-adjusted Initial Returns in China, 1999-2002
Percentage of IPOs
0%
3%
6%
9%
12%
15%
0-25% 25-50%
50-75%
75-100%
100-125%
125-150%
150-175%
175-200%
200-225%
225-250%
250-275%
275-300%
>300%
Figure 6 Distribution of IPO Market-adjusted Annual Returns in China, 1999-2002
Percentage of IPOs
0%
5%
10%
15%
20%
25%
30%
0-5% 5-10% 10-20% 20-30% 30-40% 40-50% 50-100% >100%
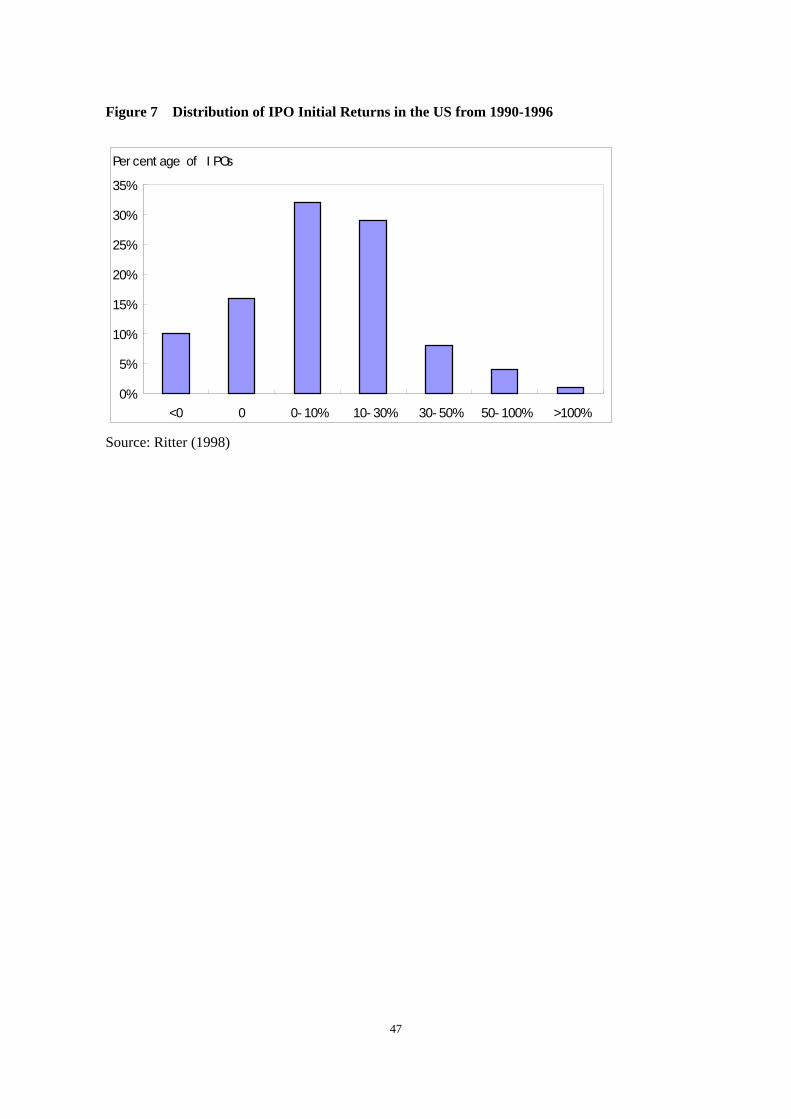
47
Figure 7 Distribution of IPO Initial Returns in the US from 1990-1996
Percentage of IPOs
0%
5%
10%
15%
20%
25%
30%
35%
<0 0 0-10% 10-30% 30-50% 50-100% >100%
Source: Ritter (1998)