IPO underpricing based on the asymmetric information theories

Auctions vs. Bookbuilding and the Controlof Underpricing in Hot IPO Markets
François DerrienRotman School of Management, University of Toronto
Kent L. WomackDartmouth College
Market returns before the offer price is set affect the amount and variability of initialpublic offering (IPO) underpricing. Thus an important question is “What IPO procedureis best adapted for controlling underpricing in “hot” versus “cold” market conditions?”The French stock market offers a unique arena for empirical research on this topic, sincethree substantially different issuing mechanisms (auctions, bookbuilding, and fixed price)are used there. Using 1992–1998 data, we find that the auction mechanism is associatedwith less underpricing and lower variance of underpricing. We show that the auctionprocedure’s ability to incorporate more information from recent market conditions intothe IPO price is an important reason.
Offerings of initial public offering (IPO) shares appear to follow a “boomor bust” cyclical pattern in recent decades, not only in the United States,but also in virtually all countries. In “hot” markets, issuers all “want to getthrough the window at the same time.” In “cold” markets, on the other hand,it is sometimes difficult for issuers to sell stock at any reasonable price.1
Ibbotson, Sindelar, and Ritter (1994) and others have documented severalaspects of this IPO cyclicality. For IPOs, the market’s “temperature” not onlyaffects the number of successful offerings but also the amount and variabilityof IPO underpricing. In hot markets, double- or even triple-digit underpricingis common, but in cold markets, underpricing is more subdued.
This article addresses the question of what kind of selling and underwritingprocedure might be preferred for controlling the amount and volatility ofunderpricing. For IPOs in the United States, this issue is relatively unexploredsince one selling procedure, namely “bookbuilding” by underwriters, haspredominated for several decades. However, the existence of other issuingmechanisms, especially in Europe, raises the question of whether these other
We thank François Degeorge for spurring us to undertake this study and for his constant encouragement.We also thank Larry Glosten (the editor), Bruno Biais, Michel Habib, Bruno Husson, Augustin Landier,Terence Lim, Roger Lynch, Jay Ritter, Michael Rockinger, Ann Sherman, and an anonymous referee forhelpful comments. The article was previously titled “IPO Selling Procedures and the Control of IPO Under-pricing in Various Market Conditions: Evidence from the French IPO Market.” Address correspondence toKent Womack, Amos Tuck School of Business, Dartmouth College, Hanover, NH 03755-9023, or e-mail:[email protected].
1 An interesting and extreme example occurred in the last months of 1998. In a “hot market” in July andAugust, 47 IPOs were issued in the United States, whereas in the next two months, September and October,only 5 issues came public.
The Review of Financial Studies Spring 2003 Vol. 16, No. 1, pp. 31–61© 2003 The Society for Financial Studies
The Review of Financial Studies / v 16 n 1 2003
methods have advantages relative to the (American) bookbuilding procedure.The French stock market offers a unique arena for empirical research on thistopic, since three basic and substantially different issuing mechanisms havebeen used there. Besides the bookbuilding procedure dominant in the UnitedStates, the French market provides the additional choices of an auction anda fixed-price procedure to the issuer.
First, we should ask the question of how one should measure IPO pric-ing efficiency. Underpricing is an almost universal feature of the IPO mar-ket. Loughran, Ritter, and Rydqvist (1994) report that underpricing generallyoccurs in virtually all of the IPO markets around the world. In effect, under-pricing appears to be an obligatory cost to the issuer. Not surprisingly, theacademic finance literature has examined the underpricing question exten-sively. Clearly, from most issuers’ points of view, excessive underpricing isnot optimal since proceeds “left on the table” are a cost and not availablefor the issuer’s or earlier investors’ use. However, some positive amount ofunderpricing appears to have positive benefits.2
The question, of course, is “how much underpricing is too much?” Theredo not appear to be firm answers to that question. Practitioners in the UnitedStates suggest that an unconditional target range of 10% to 20% is optimal forfirst-day underpricing. In the United States, underpricing has averaged about15% in the last two decades.3 However, such an average belies significantvariance in first-day returns. This underpricing variance, which we will study,appears to relate to market conditions.
Practitioners (underwriters, issuers, and investors) also suggest that anotherimportant quality of successful IPO pricing (say, when one compares the“quality” of pricing by various underwriters or procedures) is relatively lowcross-sectional variance of underpricing. If the market “demands” underpric-ing of approximately 15% on average, it is the issuer whose stock is under-priced by, say, 60% or more that is likely to be unhappy when consideringforegone proceeds.
Some of the IPO literature has focused on the relationship between initialmarket reactions and the selling mechanism used.4 Benveniste and Spindt(1989) suggest that the American bookbuilding procedure is efficient, sinceit encourages investors to reveal their beliefs about the issue’s value, at a costof initial underpricing. On the other hand, Welch (1992) focuses on the fixed-price procedure used in some European countries, and shows that this proce-dure can cause informational cascades: investors who observe the investment
2 Krigman, Shaw, and Womack (1999) show that “cold” IPOs (that open at or below their offering price) and“extra hot” IPOs (that open up 60% or more above the offer price on the first day) are poor risk-adjustedperformers over the next year compared with those that open up in a range of + 10% to + 60% on thefirst day. Habib and Ljungqvist (2001) show that underpricing obtains as a result of issuers’ minimization ofwealth losses.
3 Ritter (1998) documents a 15.8% underpricing in the period 1960 to 1996.4 In the rest of the article we will use the expressions “selling mechanism,” “mechanism,” “offering procedure,”
and “procedure” equivalently.
32
Auctions Versus Bookbuilding
choice made by previous investors can update their beliefs about the valueof the issued shares. This possibility forces issuing firms to underprice theirshares, choosing a price that is likely to create positive informational andprice cascades. Benveniste and Busaba (1997) present a theoretical compar-ison of those two listing mechanisms. They conclude that the bookbuildingprocedure generates higher expected proceeds (and more variable proceeds)than if a fixed-price method is used.
Another strand of the IPO literature focuses on the phenomenon of “hotissue markets,” that is, periods that are characterized by a large number ofofferings and a high average underpricing [Ritter (1984)]. Big differencesin IPO underpricing occur in these cycles, depending on the time perioda firm chooses to go public. Market conditions can then make the goal ofcontrolling the underpricing of the shares they issue a difficult task for theunderwriters.
We compare the three underwriting/selling mechanisms available on theFrench market. One is very similar to the bookbuilding mechanism used inthe United States. Another is a fixed-price procedure. The third one is anauction-like procedure. We show that the auction procedure is better thanthe others at controlling underpricing in general, as well as the variance ofunderpricing of the issued shares in “hot” versus “cold” markets. This resultprovides empirical support for the theoretical work by Biais, Bossaerts, andRochet (2002), who suggest the auction procedure is optimal.
In the next section we describe the three important French selling pro-cedures and the main features of the French IPO market. In Section 2 wedescribe the data and methodology we used in our empirical tests. Section 3documents the relationship between market conditions and number andunderpricing of IPOs. In Section 4 we describe the important results weobtain evaluating the mechanisms. In Section 5 we evaluate theoreticalconclusions in light of our findings. Section 6 concludes.
1. The French IPO Market Selling Procedures
Relative to the U.S. markets, where underwriting has been primarily basedon the bookbuilding mechanism, the French IPO market gives issuers andtheir underwriters a choice of mechanisms. This choice is typically madebefore the preliminary documents announcing the IPO are published, that is,approximately 2 months before the IPO date.5 In the 1992–1998 period, threeIPO selling mechanisms have been most common in France:
- Offre à prix ferme (OPF), a fixed-price offer,
- Offre à Prix Minimal (OPM), an auction procedure, and
5 In the rest of the paper, the expressions “IPO date,” “offering date,” “trading date,” and “first-trade date” referto the date when IPO shares are actually traded for the first time. The expression “pricing date” refers to thedate when the IPO price is chosen.
33
The Review of Financial Studies / v 16 n 1 2003
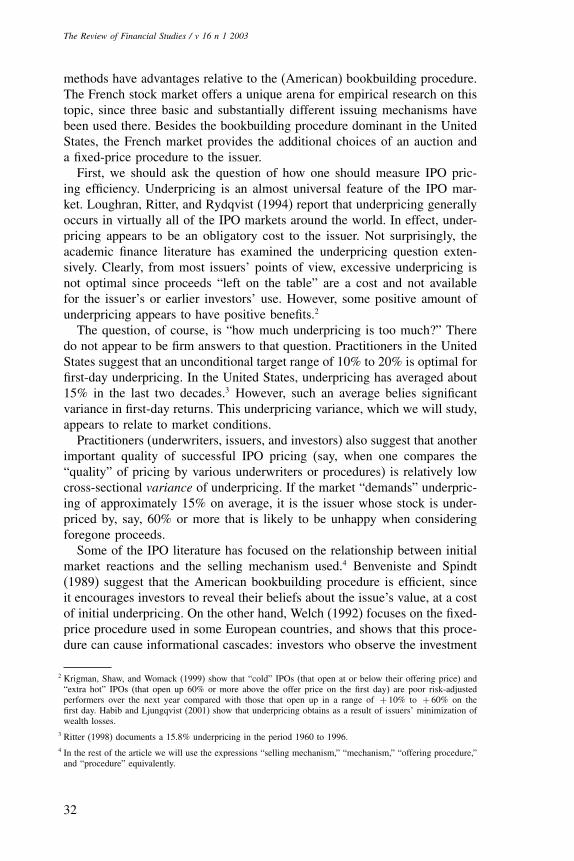
Figure 1Timing of the fixed-price procedure (OPF)Step 1: IPO prices is chosenStep 2: Investors submit quantity bidsStep 3: Non-discriminatory pro rata allocation
- Placement Garanti (PG), similar to the American bookbuilding proce-dure.
The main difference between these three procedures lies in the role ofthe different actors: OPF and OPM are investor-driven mechanisms, aimedat giving significant decision making to investors. The market authority (theSBF or Société des Bourses Françaises6) plays a pivotal role in guaranteeingthe fairness of these procedures. The bookbuilding procedure, on the otherhand, gives the central role to the underwriter, who presumably has the bestunderstanding of the market as well as the desire and ability to place theshares in “good” hands. The legal and institutional details of those proceduresare presented below.
1.1 OPF: the fixed-price offeringIn French OPF (Offre à prix ferme) offerings (Figure 1), the offer price isset approximately one week (8.27 calendar days, on average, in our sam-ple) before the IPO (first trading) date. This price results from a negotia-tion between the firm and its underwriter. The day before the IPO, potentialinvestors place orders, specifying the number of shares they desire at thefixed offering price. The SBF collects bids and allocates shares on a prorata basis.
1.2 OPM: the auction procedureIn French OPM (Offre à Prix Minimal, formerly called Mise en vente) offer-ings (Figure 2), a minimum acceptable price is set by the underwriter and
6 The Société des Bourses Françaises (SBF, 39 Rue Cambon, 75001 Paris) manages the French stock markets.
34

Auctions Versus Bookbuilding
Figure 2Timing of the auction procedure (OPM)Step 1: The minimum price is chosenStep 2: Investors submit price / quantity bidsStep 3: IPO price and upper limit are chosenStep 4: Non-discriminatory pro rata allocation to investors with bids between IPO price and upper limit
issuer, generally one week before the IPO date (see Figure). On the daybefore the IPO is slated for trading, investors make price/quantity bids, justas in a sealed-bid auction. After collecting the bids, the SBF computes acumulative demand curve. The issuer and the underwriter then negotiate withthe SBF to choose the offer price and a maximum price.7 The offer price isa common price that every selected investor will pay for his shares. All bidsgreater than the maximum price are eliminated. Although there is no writtenrule, it appears that this maximum price is chosen so that “unrealistic bids”are eliminated. The bids that are considered unrealistic are the ones that arewell over the clearing price. This rule is aimed at preventing investors fromplacing bids at very high prices to make sure that they will obtain shares.This is coherent with the goal of the procedure: that investors place bids thatreveal their true valuation of the IPO firm. Investors that have made bids atprices between the offer price and the maximum price receive shares on apro rata basis. However, if demand is too high, the IPO can be postponed andchanged to a fixed-price offering. This generally happens when the ratio ofdemand to supply is more than 20. This postponement occurred 20 times outof 99 OPM offerings in the 1992–1998 period [see the TOPM (TransformedOPMs) column in Table 1 for details about the characteristics of those offer-ings]. In the following, those postponed OPM offerings are combined withthe other OPM IPOs, because they are similar ex ante.
7 In this negotiation, the SBF defends the investors’ interests in pushing for an IPO price that both reflectsinvestors’ bids and offers a “reasonable” amount of underpricing to bidders.
35

The Review of Financial Studies / v 16 n 1 2003
Table 1Descriptive statistics of the sample
All OPMs POPMa TOPMa PG OPF Totalb
IPOs by exchange SM 99 79 20 62 24 191NM 0 0 0 73 0 73Total 99 79 20 135 24 264
IPOs by IPO year 1998 33 28 5 72 3 1081997 21 15 6 30 3 541996 23 16 7 19 3 451995 8 8 0 1 3 131994 11 9 2 11 7 321993 1 1 0 1 5 91992 2 2 0 1 0 3Total 99 79 20 135 24 264
Hi-tech 0 (# of IPOs) 47 39 8 63 15 1311 (# of IPOs) 52 40 12 72 9 133
Market Mean 272�4 253�4 347�4 563�1 642�0 467�1capitalization
Std deviation 253�9 248�6 267�3 891�8 838�7 722�4Median 184�9 163�2 214�4 257�8 379�8 235�0
Price range Mean 12�82% 10�45% 22�18% 13�16%adjustment
Std deviation 9�47% 8�78% 5�52% 8�30%Median 11�76% 9�09% 20�92% 11�69%
First-day return Mean 9�68% 6�55% 22�07% 16�89% 8�88% 13�23%(underpricing) Std deviation 12�25% 9�43% 14�38% 24�49% 10�98% 19�69%
Median 6�25% 4�80% 20�81% 9�80% 5�82% 7�80%
Days between 1�99 1�25 5�00 5�53 8�27 4�50pricing andfirst trade
Market Returnc 1�33% 1�24% 1�67% 2�06% 0�41% 1�55%Market Volatilityc 0�59% 0�60% 0�53% 0�67% 0�53% 0�62%
The sample contains all IPOs from 1992 to 1998 on the French “Second Marché” (SM) and “Nouveau Marché” (NM).OPM is the auction-like IPO procedure, PG is the bookbuilding procedure, OPF is the fixed-price procedure. Hi-tech is ahigh-technology dummy variable. Price range adjustment is the percentage change between the minimum price set initially(or the lower bound of the price range for PG offerings) and the offer price. IPO year is the calendar year in which thecompany went public. First-day return (underpricing) is the simple return calculated between IPO price and the closingprice at the end of the first day of quotation. Market capitalization is calculated at offer price in millions of French Francs.Days between pricing and first trade is the number of calendar days between the day when the offering price is chosenand the IPO date. Market Return is a weighted average of the returns of the MIDCAC stock index for the 3 months beforethe IPO pricing date. The weights are 3 for the most recent month, 2 for the next month, and 1 for the third month beforethe offering. Market Volatility is the standard deviation of the 1-month return of the MIDCAC index in the month before the IPO.a We present separately the results for “pure” OPMs (POPM), and the ones that are finally transformed into OPFs (TOPM.)Although those two categories exhibit different characteristics, we combine them in the subsequent tables, because they aresimilar ex ante.b We include in the total number of offerings five IPOs, which used procedures that are not used anymore.c These two variables have a negative correlation due to some outliers with high Market Volatility and low Market Return. Whenwe remove these outliers from the original sample, the correlation coefficient is 0.21, with no significant differences betweenthe three procedures. Removing these observations does not change the results presented hereafter.
1.3 PG: the bookbuilding procedureIn the PG (Placement Garanti) procedure (Figure 3), the price is chosenvia the typical American bookbuilding approach:8 first, the issuing firm andunderwriter set a price range. Then, in a marketing phase (the “road show”),
8 Actually, two types of bookbuilding procedures are available: one is strictly equivalent to the Americanprocedure, the other is a mixed bookbuilding/fixed-price procedure in which the price and allocation rules arethe same as in the bookbuilding, except for a small fraction of the shares. Those shares, which are reservedfor retail investors, are sold via a fixed-price procedure, at the price chosen in the bookbuilding part of the
36

Auctions Versus Bookbuilding
Figure 3Timing of the bookbuilding procedure (PG)Step 1: Underwriter sets initial price range, advertises offering through road-showStep 2: Investors submit price/quantity indications of interest during roadshowStep 3: Underwriter sets price and allocates with complete discreation.
the firm is presented to institutional investors, who transmit nonbinding indi-cations of interest to the underwriter. Once this bookbuilding period is over(on average 5.53 calendar days before the IPO date in our sample), the issu-ing firm and the underwriter set a price, taking into account the indicationsof interest received.9 Once the offer price has been set, the underwriter, whoselectively chooses among investors, allocates the shares.
The main difference between this procedure and the previous mechanismslies in the underwriter’s role in all stages of the IPO. First, in the roadshow, a step that does not exist in other mechanisms, underwriters marketthe offering to potential investors. Second, the underwriter has much moreprice-setting power than in other procedures. Third, underwriters allocateshares in a discretionary manner.
1.4 Setting the first-day priceWhichever mechanism is used, once the shares have been allocated to inves-tors, a call market system sets the potential opening price. The SBF collectssell and buy orders. This leads to a clearing price, which may be the firsttransaction price. However, if the potential clearing price is higher than theoffer price by more than a set percentage (this set percentage is often 10%),then no transaction occurs and the same call market procedure is repeatedthe next business day, beginning at the augmented (+10%) clearing price.
offering. In the rest of this study we do not separate the two procedures because they are similar in terms ofprice setting.
9 The major difference between the French and American types of bookbuilding lies in the fact that, in France,the price range is rarely changed. Most of the time the IPO price is chosen within the initial price range.
37

The Review of Financial Studies / v 16 n 1 2003
2. Data and Methodology
We analyze 264 French equity offerings, comprising all firms initially listedon the “Second Marché” and “Nouveau Marché” during the period fromJanuary 1992 to December 1998.10 We collect institutional information fromthe preliminary prospectuses and the IPO reports published by the SBF a fewdays after every IPO. Aftermarket price data come from two sources. Dailyprices on the Second Marché were provided by the SBF, whereas for theNouveau Marché, we used data from the BDM database, a high-frequencytrade and quotes database produced by the SBF. The financial characteristicsof the firms come from preliminary prospectuses and SBF reports. Table 1presents descriptive statistics of the offerings in our sample.
We observe in Table 1 that the numbers of OPM and PG offerings areapproximately comparable (99 versus 135), whereas there are fewer fixed-price (OPF) offerings in our sample (24). The OPF fixed-price procedurehas fallen into disuse in recent years: there were 15 total OPF offerings in1992–1995, but there have only been 9 since the beginning of 1996. Thusour main comparisons in this article are between the two main procedures(OPM, auction: PG, bookbuilding) currently in use.
We also note that, so far, all IPOs on the Nouveau Marché have usedthe PG (bookbuilding) procedure, though this is not explicitly required. Onereason for the PG choice on the Nouveau Marché is that those offeringsare generally smaller-size IPOs, with 279 million French Francs in marketcapitalization on average versus 539 million for Second Marché offerings.One explanation for this use of PG on the Nouveau Marché is that otherprocedures do not offer sufficient compensation to the underwriters [the PGprocedure (bookbuilding) is characterized by higher underwriter fees]. Whilethe average PG offering has a larger market capitalization compared to thetwo other procedures, the PG distribution is bimodal: there are a substantialnumber of both relatively small and relatively large PG IPOs. Their medianmarket capitalization is less different from that of OPM (auction) offerings.
Underwriters explain this distribution of PG offerings as follows: foreigninvestors are reluctant to participate in auction-like OPMs because they areless familiar with this procedure.11 Consequently firms that want to attractforeign investors (generally the largest issuers) use the PG (bookbuilding)procedure. So the PG mechanism is used in two distinct situations: first, bylarge firms issuing shares on the Second Marché, which are typically attempt-ing to attract foreign investors. Second, by all the firms issuing shares on the
10 We do not consider firms that transfer from “Le Marché hors-cote” (an exchange with very low volume) toanother exchange as an IPO. Indeed, in those transfers, the price discovery function of selling mechanismsis made less important by the fact that those firms already had a market price. We also eliminated from oursample the firms that were already listed on other exchanges, for the same reason.
11 Foreign institutional investors also dislike the fact that the OPM procedure gives them no advantage over“normal investors” in terms of share allocation (as opposed to bookbuilding, in which they are usually givena better allocation by the underwriters).
38

Auctions Versus Bookbuilding
Table 2Short-term and long-term performance of the French IPOs
All OPMs POPMa TOPMa PG OPF Total
10th-day cumulative Mean 14�20% 9�63% 32�26% 19�03% 12�99% 16�48%return (underpricing) Std deviation 25�83% 21�77% 32�64% 31�62% 20�40% 28�38%
Median 6�30% 3�45% 26�20% 8�78% 9�25% 7�66%
6-month Mean −3�64% −4�34% −1�06% −5�30% −1�16% −3�90%performance Std deviation 37�12% 39�78% 25�63% 43�83% 14�77% 38�28%
Median −4�55% −5�53% −2�46% −7�32% 0�82% −4�20%
12-month Mean 1�29% 0�26% 4�96% −4�96% −0�59% −1�31%performance Std deviation 53�39% 58�55% 37�18% 62�55% 34�03% 54�53%
Median −7�38% −8�31% −4�70% −7�10% 5�95% −5�02%
18-month Mean −8�68% −12�53% 5�34% −13�22%∗ −13�36% −9�48%∗performance Std deviation 66�39% 69�59% 52�11% 67�93% 43�52% 64�15%
Median −7�00% −10�87% 17�00% −15�87%∗ −4�83% −10�87%∗
24-month Mean −9�03% −10�53% −3�45% −4�94% −4�18% −6�27%performance Std deviation 79�52% 82�10% 70�81% 82�82% 52�03% 77�76%
Median −11�17% −13�98% 4�06% −17�67% −14�11% −13�21%∗
The sample contains all IPOs from January 1992 to December 1998 on the French “Second Marché” and “Nouveau Marché”(the two exchanges on which most companies go public in France.) 10th-day cumulative return (underpricing) is the simplereturn calculated between IPO price and the closing price at the end of the 10th day of quotation. Long-term performances(6-month performance, 12-month performance, 18-month performance, 24-month performance) are calculated as cumulatedaverage returns starting on the 11th trading day. These returns are adjusted using a benchmark of non-IPO firms in thesame size and book-to-market quintiles. OPM is the auction-like IPO procedure, PG is the bookbuilding procedure, OPF isthe fixed-price procedure. We include in the total number of offerings five IPOs which used procedures that are not used anymore.a We present separately the results for “pure” OPMs (POPM), and the ones that are finally transformed into OPFs (TOPM.)Though those two categories exhibit different characteristics, we combine them in the subsequent tables, because they aresimilar ex ante.∗ Significantly different from 0 at 5% level, assuming independence across IPOs.
Nouveau Marché, that is, the smallest firms in our sample. This accounts forthe high variance in the market capitalization of PG offerings.
Table 1 also shows that the number of days between the pricing date (i.e.,the date on which the offering price is chosen) and the trading date (thedate on which the shares first trade) varies depending on which procedureis used. OPF and PG offerings average 8.27 and 5.53 days, respectively,between those two dates, whereas OPM offerings have on average only 1.99days. We will show later that this difference has an important impact on theunderpricing of newly listed firms.
In Table 1 we also note that the average first day underpricing is equalto 13.23%, in line with other countries’ figures [see Loughran, Ritter, andRydqvist (1994)]. Table 2 shows the longer-run performance of IPO stocks.Long-term performance is calculated using cumulative average benchmarkportfolio-adjusted returns. Every year each IPO firm is assigned to one of16 portfolios of non-IPO firms on the basis of size and book-to-market.Eighteen-month mean and median-adjusted excess returns (beginning afterthe 10th trading day) are significantly negative for the entire sample.12 We
12 However, significance is probably overestimated due to clustering among IPOs.
39

The Review of Financial Studies / v 16 n 1 2003
also note that no procedure leads to systematic underperformance in the(two-year) long run.
3. Market Return and Its Effect on IPO Underpricing
In this section we document a strong relationship between recent returns inthe overall market and the underpricing of IPOs. Market return is often saidto play an important role in determining an IPO’s underpricing.
In order to confirm the hypothesis that recent market return influencesunderpricing, we compute regressions where the mean and, separately, thevariance of the underpricing of the IPO firms in our sample is explainedby firm-specific and recent market return independent factors.We focus onfactors known before pricing in order to avoid the influence of factors thatplay a role once the firm has been listed (such as market conditions after theIPO date or price support by the underwriter). In these regressions we usetwo different dependent variables: first day underpricing, and the “squareddeviation” of first day underpricing constructed as the squared residuals fromthe first regression (the one with first day underpricing as dependent variable).
We use the following firm and industry control variables: Exchange is adummy variable equal to 1 if the firm is listed on the Second Marché, 0otherwise.13 Hi-tech is a dummy variable equal to 1 if the firm is a high-technology firm, 0 otherwise. Ln_mktcap is equal to the natural logarithm ofmarket capitalization (postissue shares times offer price) at IPO date.14
In order to examine market conditions, we construct a series of MarketReturn and Market Volatility variables. The Market Return variables are con-structed using a market index provided by the SBF (the MIDCAC stockindex). To construct this variable, the market stock index return for eachtrading day in the preoffering period for each IPO is calculated. Then, foreach individual offering, the Market Return variable is constructed for the3-month, 1-month, and 1-week periods before the IPO offering date (or alter-natively, pricing date) as a buy-and-hold return.15 These returns are normal-ized to produce an average monthly return over each of these periods. A3-month weighted Market Return variable is constructed as a weighted aver-age of the buy-and-hold returns of the MIDCAC index in the 3 months before
13 “Le Second Marché” was created in 1983 to allow small firms to go public and is often seen as a transitionbefore reaching the main exchange (“La cote officielle”). Its listing requirements are less stringent than on themain market. Its alternative, “Le Nouveau Marché,” was created in 1996 on the model of NASDAQ, to attractstart-up companies, especially in high-technology industries. Between 1992 and 1998, most of the Frenchequity offerings occurred on those two smaller markets; a few large or special offerings, like privatizations,occurred on the main exchange.
14 We run the same regressions including other firm-specific variables (age of the firm at IPO date, book-to-market value of the firm at IPO date, dummies corresponding to the announced goals of the IPO, rank of thelead underwriter). These variables do not significantly affect the results presented hereafter.
15 We had no specific priors on the length of the preoffering period that might affect underpricing. Hence weinvestigated four different time periods which encompass the time frame when an IPO is being planned andimplemented. The impact of market momentum was very significant in all of them.
40

Auctions Versus Bookbuilding
the IPO date. The weights are three for the most recent month, two for thenext, and one for the third month before the offering. This weighted sum isdivided by six, so that the observed coefficient is also a weighted monthlymarket return. (By assigning these weights, we hypothesize that investors’perceptions take the last three months into account, but give more weightto recent periods.) Similarly we calculate a Market Volatility variable which,for each observation, is equal to the standard deviation of the daily return ofthe MIDCAC market index over the period considered.
Table 1 presents the mean values of our 3-month weighted Market Returnand 1-month Market Volatility variables, calculated for each IPO as of itspricing date. The mean Market Return before an IPO is equal to 1.55%, andthe average Market Volatility is equal to 0.62%. One should compare thosenumbers to the average values of those variables over the entire 1992–1998period: 0.58% and 0.55% for Market Return and Market Volatility, respec-tively. The big difference in Market Return confirms the well-documentedidea that firms prefer to go public in “hot” markets. However, Market Volatil-ity appears less important in triggering IPO decisions. We find this logical,in that higher market return implies a higher valuation level attainable forthe prospective new issue, while higher market volatility, at least in tradi-tional models like Beatty and Ritter (1986), is associated with a more riskyenvironment for issuance.
We first regress the first-day return (underpricing) of the 264 French IPOsin our sample on firm-specific control variables and on each of the fourMarket Return variables described previously. Table 3 presents the results ofthose regressions.
The results in Table 3 show that Market Return is the most significant vari-able in all regressions. Market capitalization and the high-technology dummyvariable also exhibit significant t statistics, but the explanatory power of theweighted model (adjusted R2 = 0�254 in column 4) is driven by the MarketReturn variable. When this variable is removed, the adjusted R2 is 0.047.Moreover, we note that the economic significance of the Market Return vari-able is very large: a market increase of 1% (monthly) in Market Returnresults, on average, in an additional 2.32% of first-day underpricing.
Next, in Table 4, we regress first-day IPO underpricing and, in addition,“squared deviation” of underpricing on market return and volatility variables.From this table on, we continue to use the 3-month weighted Market Returnvariable from Table 3 because we believe that this variable adequately andmost completely summarizes the effects of market return, but our resultsare still valid with the other specifications. In Table 3 we test whether thissecond market condition variable, Market Volatility, measured as the standarddeviation of daily returns in the period before the offering, can also explain
41

The Review of Financial Studies / v 16 n 1 2003
Table 3Regressions of first-day return (underpricing) on the preoffering market conditions (Market Return)and firm-specific variables for 1992–1998 French IPOs [Dependent variable: first-day IPO return(underpricing)]
Four specifications of the Market Return variable below
3-month 1-month 1-week 3-month weightedMarket Return Market Return Market Return Market Return
Intercept, firm, and industry control variablesIntercept −0�350 −0�400 −0�355 −0�392
�−2�363�∗∗ �−2�549�∗∗ �−2�177�∗∗ �−2�649�∗∗∗Exchange −0�033 −0�041 −0�055 −0�032
�−1�181� �−1�384� �−1�781�∗ �−1�117�Ln_ mktcap 0�035 0�041 0�040 0�038
�3�101�∗∗∗ �3�337�∗∗∗ �3�107�∗∗∗ �3�357�∗∗∗Hi-tech 0�060 0�061 0�057 0�063
�2�686�∗∗∗ �2�697�∗∗∗ �2�440�∗∗ �2�827�∗∗∗
Market Return variable (buy-and-hold MIDCAC stock index returns)ending on IPO first trading date
Market Return 2�122 1�442 0�617 2�322�6�741�∗∗∗ �5�489�∗∗∗ �4�074�∗∗∗ �6�590�∗∗∗
Adjusted R2 0�246 0�190 0�119 0�254
The sample contains all IPOs from January 1992 to December 1998 on the French “Second Marché” and “Nouveau Marché”(the two exchanges on which most companies go public in France.) First-day underpricing is the simple return calculatedbetween IPO price and the closing price at the end of the first day of quotation. Exchange is a dummy variable equal to1 if the firm is listed on the “Second Marché”; Hi-tech is a dummy variable equal to 1 if the firm is a high-technologyfirm; Ln_ mktcap is equal to the natural logarithm of the market capitalization at the IPO first trading date. Market Return isconstructed as buy-and-hold returns of the market index (MIDCAC index) chosen in the given period before the IPO first-tradedate. 3-month and 1-week indices are, respectively, divided by 3 and multiplied by 4 so that the coefficients are comparableto the 1-month index. The 3-month weighted Market Return index is constructed as a weighted average of the returns of theMIDCAC index in the 3 months before the IPO date. The weights are 3 for the most recent month, 2 for the next month,and 1 for the third month before the offering. This weighted sum is divided by 6. The number of observations is 264. (Whiteheteroscedasticity-consistent t-statistics are in parentheses.)∗ Significant at a 10% level.∗∗ Significant at a 5% level.∗∗∗ Significant at a 1% level.
mean underpricing (column 1) and the variance of first-day underpricing(column 2).16
We observe that Market Volatility also plays a big role in explaining thelevel of first-day mean and variance of underpricing, with very large coeffi-cients that are all significantly positive (9.765 and 2.524 in columns 1 and 2,respectively, with t statistics of 3.439 and 2.224).
In Table 5, we analyze the timing risk due to the number of days betweenthe price announcement and the offering (or first-trade) date. In Table 1 weshow that the average number of calendar days between pricing and offeringis larger for PGs (5.53 days) and OPFs (8.27) than for OPMs (1.99). Doesthis matter? In other words, does a change in market conditions occurringbetween the pricing and offering dates affect underpricing?
To answer this question we construct two more variables, TransactionInterval Return (TIM) and Transaction Interval Volatility (TIV). TIM is
16 For this Market Volatility variable, we choose a 1-month period before the offering date by a similar procedureas the one presented in Table 1, eliminating 3-month and one-week periods that have smaller explanatorypower.
42

Auctions Versus Bookbuilding
Table 4Regressions of first-day return (underpricing) and “squared deviation” of return on market preofferingconditions (Market Return and Market Volatility) and firm-specific variables for 1992–1998 French IPOs
Dependent variable First-day return (underpricing) “Squared deviation” of return
Intercept, firm, and industry control variablesIntercept −0�489 −0�019
�−3�122�∗∗∗ �−1�917�∗Exchange −0�022 −0�030
�−0�769� �−1�560�Ln_ mktcap 0�040 0�006
�3�514�∗∗∗ �1�487�Hi-tech 0�064 0�009
�2�930�∗∗∗ �1�053�
Market Return variable (buy-and-hold MIDCAC stock index returnsending on first trading date)
Market Return 2�544 0�657�6�915�∗∗∗ �3�884�∗∗∗
Market Volatility variable (standard deviation of daily MIDCAC stock indexreturns ending on the first trading date)
Market Volatility 9�765 2�525�3�439�∗∗∗ �2�224�∗∗
Adjusted R2 0�285 0�178
The sample contains all IPOs from January 1992 to December 1998 on the French “Second Marché” and “Nouveau Marché”(the two exchanges on which most companies go public in France.) First-day return (underpricing) is the unadjusted returnfrom IPO price to the closing price at the end of the first trading day. “Squared deviation” of return is defined, for eachobservation, as the squared difference between observed underpricing and underpricing predicted using coefficients from thefirst column regression. Exchange is a dummy variable equal to 1 if the firm is listed on the “Second Marché”; Hi-tech is adummy variable equal to 1 if the firm is a high-technology firm; Ln_ mktcap is equal to the natural logarithm of the marketcapitalization at IPO date. The Market Return variable is constructed as a weighted average of the returns of the MIDCACstock index in the 3 months before the IPO first trading date. The weights are 3 for the most recent month, 2 for the nextmonth, and 1 for the third month before the offering. The Market Volatility variable is constructed as the standard deviation ofthe 1-month returns of the MIDCAC index in the immediate month before the IPO first-trade date. The number of observationsis 264. (White heteroscedasticity-consistent t-statistics are in parentheses.)∗ Significant at a 10% level.∗∗ Significant at a 5% level.∗∗∗ Significant at a 1% level.
constructed as the buy-and-hold return for the MIDCAC index betweenpricing and offering dates. Similarly TIV is constructed as the standarddeviation of the returns for the MIDCAC index over the period betweenpricing and offering dates.17 We run the same regressions as previously inTable 4. But this time we also include TIM and TIV in the Market Returnand Market Volatility variables that are calculated as of the pricing date(instead of the first-trade date in the previous tables).
We observe in Table 5 that the short-run Transaction Interval Return has asignificant impact on first-day underpricing (with coefficients equal to 0.298and 0.075 in columns 1 and 2, respectively, and t-statistics equal to 3.809and 2.384). In the same regressions, TIV has a significant, negative impactonly on average underpricing.
These results show that market return in the near-term months before aswell as between pricing and offering dates has a significant impact on the
17 When this period was only one day, we took the standard deviation of the return for this day and the daybefore.
43

The Review of Financial Studies / v 16 n 1 2003
Table 5The impact of Market Return and Market Volatility between pricing day and offering day on the meanand “squared deviation” of first day underpricing for French IPOs
Dependent variable First-day return (underpricing) “Squared deviation” of return
Intercept, firm, and industry control variablesIntercept −0�427 −0�084
�−2�568�∗∗ �−1�071�Exchange −0�014 −0�017
�−0�521� �−1�884�∗Ln_ mktcap 0�036 0�007
�2�943�∗∗∗ �1�331�Hi-tech 0�063 0�009
�2�769�∗∗∗ �1�055�
Market Return (buy-and-hold MIDCAC stock index returns)Market Return as of pricing date 2�387 0�650
�6�676�∗∗∗ �3�936�∗∗∗Transaction interval return (TIM) 0�298 0�075
�3�809�∗∗∗ �2�384�∗∗
Market Volatility (standard deviation of daily MIDCAC stock index returns)Market Volatility as of pricing date 10�694 2�940
�3�609�∗∗∗ �2�856�∗∗∗Transaction interval volatility (TIV) −1�312 −0�107
�−2�023�∗∗ �−0�428�Adjusted R2 0�291 0�191
The sample contains all IPOs from January 1992 to December 1998 on the French “Second Marché” and “Nouveau Marché”(the two exchanges on which most companies go public in France.) First-day return is the unadjusted return from IPO priceto the closing price at the end of the first day of quotation. “Squared deviation” of return is defined, for each observation,as the squared difference between observed underpricing and underpricing predicted using coefficients from the first columnregression in Table 3. Other firm and control variables are as in Tables 2 and 3. Market Return as of pricing date is constructedas a weighted average of the returns of the MIDCAC stock index in the 3 months before the pricing date as in Table 2. MarketVolatility as of pricing date is constructed as the standard deviation of the returns of the MIDCAC stock index in the 1-monthperiod before the IPO. Transaction interval return (TIM) is constructed as the buy-and-hold return for the MIDCAC indexbetween pricing and offering dates multiplied by 22 and divided by the number of days between pricing and offering dates (toobtain a figure comparable to our other “monthly” returns.) Similarly, Transaction interval volatility (TIV) is constructed as thestandard deviation of the returns for the MIDCAC index over the period between pricing and offering dates (when this periodwas only one day, we took the standard deviation of the return for this day and the day before) multiplied by the square rootof 22 and divided by the square root of the number of days between pricing and offering. The number of observations is 256.(White heteroscedasticity-consistent t-statistics are in parentheses.)∗ Significant at a 10% level.∗∗ Significant at a 5% level.∗∗∗ Significant at a 1% level.
outcome of an offering. Thus, in sum, market return and volatility leading upto an IPO have substantial explanatory power for the level and variance ofunderpricing. The next section asks an additional question: are certain under-writing/selling procedures better than others in controlling these statisticalmoments of underpricing?
4. IPO Procedures and Their Control of Underpricingin Hot Market Conditions
One important goal of most owners of an IPO firm is to obtain the highestpossible proceeds from an equity offering.18 On the other hand, discussions
18 This is not universally true. For example, Broadcast.com, a recent Internet IPO, intentionally asked under-writers to substantially underprice the shares. The shares opened up +277%, creating substantial attention inthe financial press for the company as “the hottest IPO ever” (at that time).
44

Auctions Versus Bookbuilding
with practitioners suggest that the typical aim of underwriters is to under-price (at least) modestly and to control aftermarket price variation (especiallyon the downside). If we accept those two objectives, we can define, for ourpurposes, an “efficient” selling mechanism as a mechanism that will under-price less and/or with lower cross-sectional squared deviations of first-dayunderpricing.19 Hence we will focus throughout this analysis on these twoaspects of the aftermarket behavior of newly listed firms: first, the averagelevel of first-day underpricing of the IPO, and second, the variance of thisunderpricing (proxied by our “squared deviation” of return variable).20
Our first hypothesis, discussed and confirmed in Section 3, was that previ-ous market conditions are a very significant driver of the level and variabilityof initial underpricing. We now consider IPO selling mechanisms: which pro-cedure is most efficient in adjusting to recent market conditions in the pricingof IPOs?
In Table 1 we presented underpricing results conditional upon the IPOprocedure used. First, we observe an unconditional average level of initialunderpricing of 13.23%, consistent with previous studies on the French mar-ket.21 We also showed that the PG procedure (bookbuilding) had both thehighest average underpricing and the highest variance of underpricing in ourtime period [� = 16�89% and � = 24�49% versus 8.88% and 10.98% forOPF (fixed-price) and 9.68% and 12.25% for OPM (auction-like offerings)].However, these are unconditional differences in underpricing mean and vari-ance and do not control for the known effects of some issuer differences suchas size, industry, and the impact noted in the previous section, recent marketreturn and variability.
Is one of the three underwriting procedures in the French markets moreefficient in controlling the impact of market return and uncertainty on short-term underpricing? We test this carefully in Tables 6–11. In these tables, asin the previous ones, we use two types of explanatory variables. First, weuse a set of firm-specific control variables as proxies for size and industryfactors (Exchange, Ln_mktcap, and Hi-tech) that have been motivated by pre-vious work and are known to have an impact on the aftermarket behavior of
19 In this definition we focus on pricing issues; we do not consider questions related to the composition ofshareholding after the IPO, as Brennan and Franks (1997) or Stoughton and Zechner (1998) do, or any otheraspects of the outcome of equity offerings.
20 We also examined the results of the cumulative underpricing from offer price to 10 days after the offerdate. The results are essentially the same, suggesting that this is not a “first-day” temporary price-pressurephenomenon that drives any of the differences.
21 See, for instance, Leleux (1993) for a summary of the results found in previous studies, and Biais andFaugeron-Crouzet (2002) for more recent results. If we compare our results conditioning on the procedureused with those presented in Biais and Faugeron-Crouzet (2002), we note that, although results are comparablefor fixed-price (OPF) offerings, their study presents a higher average underpricing for OPM offerings (15%versus 10.5% in our sample of OPM offerings). This might be explained by the fact that they study the1983–1996 period, and institutional changes at the end of this period potentially had a substantial effect oninitial underpricing. In Loughran, Ritter, and Rydqvist (1994), offering mechanisms are categorized on thebasis of how the offer price is set and how the shares are allocated. They find levels of underpricing of 9%,12%, and 27%, respectively, for auctions, bookbuilding, and fixed-price offerings.
45

The Review of Financial Studies / v 16 n 1 2003
Table 6Regressions of mean and “squared deviation” of first-day underpricing on firm-specific variables, MarketReturn and Market Volatility variables, splitting by procedure
First-day First-dayDependent return return “Squared deviation” “Squared deviation”variable (underpricing) (underpricing) of return of return
Intercept, firm, and industry control variablesIntercept −0�428 −0�415 −0�098 −0�085
�−2�542�∗∗ �−2�526�∗∗ �−1�335� �−1�248�Exchange 0�007 0�015 −0�012 −0�008
�0�188� �0�404� �−0�793� �−0�534�Ln_ mktcap 0�033 0�032 0�007 0�007
�2�671�∗∗∗ �2�651�∗∗ �1�496� �1�427�Hi-tech 0�065 0�068 0�008 0�010
�2�784�∗∗∗ �2�892�∗∗∗ �0�896� �1�094�
IPO procedure dummiesOPM (auction) −0�013 0�036b 0�004 0�009
�−0�482� �0�817� �0�639� �1�412�PG (book-building) 0�024 −0�068b 0�011 0�017
�0�783� �−1�268� �1�096� �1�516�
Market Return (buy-and-hold MIDCAC stock index returns)ending at pricing date
Market Return 2�333 0�667�6�491�∗∗∗ �3�907�∗∗∗
Market Return∗OPF 1�873 0�183a
�2�320�∗∗ �1�496�Market Return∗OPM 1�062a 0�184a
�3�460�∗∗∗ �3�889�∗Market Return∗PG 3�277a 1�059a�a
�5�739�∗∗∗ �3�648�∗∗∗
Market Volatility (standard deviation of daily MIDCAC stock index returns)ending at pricing date
Market Volatility 10�685 3�421�3�547�∗∗∗ �3�101�∗∗∗
Market Volatility∗OPF 8�197 1�640b
�1�226� �2�171�∗∗Market Volatility∗OPM 2�677a 0�402a
�0�746� �0�675�Market Volatility∗PG 19�315a 6�640a�b
�3�589�∗∗∗ �3�083�∗∗∗
Adjusted R2 0�261 0�303 0�176 0�232
The sample contains IPOs from 1992 to 1998 on the French “Second Marché” and “Nouveau Marché.” First-day return(underpricing) is the simple return calculated between IPO price and the closing price at the end of the first day of quotation.“Squared deviation” of return is defined, for each observation, as the squared difference between observed underpricingand underpricing predicted using coefficients from the first column regression. Other firm and control variables are as inTables 2 and 3. OPM, PG, and OPF are IPO procedure dummies. Market Return is a weighted average of the returns of theMIDCAC stock index in the 3 months before the date of pricing as in Table 2. Market Volatility is the standard deviation ofthe returns of the MIDCAC stock index in the 1-month period ending at pricing date. Those indices are split by procedure,by multiplying them by the procedure dummies. We only consider IPOs that used one of the three procedures and for whichwe know the pricing date. The number of observations is 252. (White heteroscedasticity-consistent t-statistics are in parentheses.)a�b� c Coefficients are significantly different from each other at a 1% level (and, respectively, at a 5% level or a 10% level).∗ Significant at a 10% level.∗∗ Significant at a 5% level.∗∗∗ Significant at a 1% level.
an offering. Second, we use the Market Return and Market Volatility vari-ables constructed previously to reflect recent market return and uncertainty.However, in Table 6, we calculate these variables as of pricing date (versusthe slightly later first-trade date previously) to focus on the ability of each
46

Auctions Versus Bookbuilding
Table 7Sensitivity of underpricing to market “hotness” depending on the IPO procedure used (auction orbook-building) and on the reaction to investors’ bids
Procedure
Market PGU PGL“hotness” (PG priced at (PG priced belowquintile Measure upper bound) upper bound) OPM
1 No. of IPOs 1 9 9Mean UP 0�00% −0�02% 3�12%Median UP 0�00% 0�00% 0�07%
2 No. of IPOs 5 10 20Mean UP 14�56% 6�42% 3�29%Median UP 12�12% 4�05% 2�52%
3 No. of IPOs 13 13 25Mean UP 8�56% 6�96% 11�35%Median UP 3�52% 5�56% 10�00%
4 No. of IPOs 20 12 22Mean UP 14�85% 14�79% 11�08%Median UP 14�81% 12�78% 7�01%
5 No. of IPOs 31 16 23Mean UP 40�23% 12�65% 14�65%Median UP 34�62% 5�16% 10�00%
The sample contains IPOs from January 1992 to December 1998 on the French “Second Marché” and “Nouveau Marché.” UP(underpricing) is the simple return calculated between IPO price and the closing price at the end of the first day of quotation.PGU, PGL, and OPM are procedure dummies. PGU is equal to 1 for bookbuilt IPOs priced at the upper bound of the initialprice range. PGL is equal to 1 for bookbuilt IPOs priced within the bounds of the initial price range. The Market Return variableis constructed as a 3-month weighted average of the returns of the MIDCAC stock index in the 3 months before the IPO pricingdate as in Table 2. This variable is used to determine Market “hotness” quintiles. We remove from our previous sample theIPOs that did not use the PG (bookbuilding) or OPM (auction) procedure and the ones for which information on reservationprice or initial price range is missing. The number of observations is 229.
procedure to incorporate all relevant market “hotness” information into IPOpricing.
The underpricing differences for the three different listing mechanisms(measured by the impact of the procedure dummies in Table 6, columns 1and 3) are small and statistically insignificant when examined uncondition-ally. That is, the procedures do not have different impacts on underpricinguntil one conditions on Market Return or Market Volatility. The second setof regressions (columns 2 and 4) shows the differential impact of marketconditions given each listing procedure.
In Table 6 column 2, our key finding is that the Market Return variablehas a significantly larger impact on underpricing in bookbuilt (PG) and fixed-price (OPF) IPOs (3.277% and 1.873% per 1% market change, respectively)than in auction (OPM) offerings (1.062% per 1% market change). Differencetests indicate that the coefficients for auction and bookbuilding procedures arestatistically different at a 1% level. This shows that the auction mechanism ismore efficient in controlling the effects of market conditions on underpricing.
If we look at the impact of recent market volatility on average under-pricing, we observe that only bookbuilding exhibits a significantly positivecoefficient (19.315, with a t-statistic of 3.589). A difference test also showsthat the coefficients for auction and bookbuilding procedures are statistically
47

The Review of Financial Studies / v 16 n 1 2003
Table 8The impact of Market Return and Market Volatility on Price Range Adjustment, Underpricing, and TotalPrice Adjustment: a comparison between OPM and PG procedures
Dependent Price range First-day Total pricevariable adjustment underpricing adjustment
Intercept, firm, and industry control variablesIntercept 0�155 −0�274 −0�123
�1�854�∗ �−1�333� �−0�436�Exchange −0�047 0�052 0�001
�−3�245�∗∗∗ �1�242� �0�013�Ln_mktcap 0�002 0�020 0�023
�0�343� �1�316� �1�105�Hi-tech 0�027 0�072 0�113
�2�691�∗∗∗ �2�882�∗∗∗ �3�278�∗∗∗
IPO procedure dummiesOPM −0�022 0�007 −0�015
�−0�629� �0�090� �−0�137�PGL (PG priced within range) −0�097 −0�053 −0�168
�−2�999�∗∗∗ �−0�666� �−1�525�
Market Return (buy-and-hold MIDCAC stock index returns) ending at pricing dateMarket Return∗OPM 0�740b 1�064a 2�006b
�3�847�∗∗∗ �3�461�∗∗∗ �3�871�∗∗∗Market Return∗PGL 0�718c 2�000c 3�041
�2�964�∗∗∗ �2�317�∗∗ �2�870�∗∗∗Market Return∗PGU 0�101b� c 4�268a� c 5�086b
�0�385� �4�645�∗∗∗ �4�362�∗∗∗
Market Volatility (standard deviation of daily MIDCAC stock index returns) ending at pricing dateMarket Volatility∗OPM −3�214 2�472 −0�437
�−1�186� �0�676� �−0�067�Market Volatility∗PGL 1�811 13�140 17�027
�0�698� �1�654� �1�671�∗Market Volatility∗PGU −3�552 8�015 4�333
�−0�866� �0�801� �0�758�Adjusted R2 0�261 0�342 0�341
The sample contains IPOs from January 1992 to December 1998 on the French “Second Marché” and “Nouveau Marché.”Price range adjustment is equal to the difference, in percent, between the minimum price set before the pricing (or the lowerbound of the price range for PG offerings) and the offering price. First-day underpricing is equal to the difference, in percent,between the offering price and the closing price at the end of the first day of quotation. Total price adjustment is equal tothe difference, in percent, between the minimum price set before the pricing (or the lower bound of the price range for PGofferings) and the closing price at the end of the first day of quotation. Other firm and control variables are as in Tables 2and 3. The Market Return variable is constructed as a weighted average of the returns of the MIDCAC stock index in the3 months before pricing date as in Table 2. Market Volatility is constructed as the standard deviation of the returns of theMIDCAC index in the 1-month period before pricing date. OPM, PGL, and PGU are IPO procedure dummies. PGU is equalto 1 if PG = 1 and the IPO was priced at the upper bound of the initial price range. PGL is equal to 1 if PG = 1 and the IPOwas priced within the bounds of the initial price range. We only consider IPOs that used the PG or OPM procedure and forwhich we have information about initial price range (for PGs) or reservation price (for OPMs.) This restricts our sample to 225observations. (White heteroscedasticity-consistent t-statistics are in parentheses.)a�b� c Coefficients are significantly different from each other at a 10% (and, respectively, 5% or 1% level).∗ Significant at a 10% level.∗∗ Significant at a 5% level.∗∗∗ Significant at a 1% level.
different at a 1% level. Underpricing when the bookbuilding procedure (PG)is used is more sensitive to market volatility than when the auction mecha-nism (OPM) is used.
In the regressions explaining “squared deviation” of first-day return(Table 6, columns 3 and 4), we find that positive Market Return and MarketVolatility are correlated with the variability of underpricing. But this result
48
Auctions Versus Bookbuilding
Table 9Test for endogeneity of the choice of procedure, isolating “Second Marché” offerings
Dependent First-day return First-day return “Squared deviation” “Squared deviation”variable (underpricing) (underpricing) of return of return
Intercept, firm, and industry control variablesIntercept −0�404 −0�406 −0�113 −0�101
�−2�222�∗∗ �−2�350�∗∗ �−1�389� �−1�386�Exchange X X X XLn_mktcap 0�034 0�033 0�008 0�007
�2�578�∗∗∗ �2�617�∗∗∗ �1�407� �1�356�Hi-tech 0�035 0�039 0�012 0�015
�1�420� �1�576� �1�107� �1�266�
IPO procedure dummiesOPM (auction) −0�003 0�043 0�006 0�016
�−0�104� �1�013� �1�193� �2�332�∗∗PG (bookbuilding) 0�033 −0�038 0�016 −0�017
�1�181� �−0�685� �1�800� �−0�901�
Market Return (buy-and-hold MIDCAC stock index returns) ending at pricing dateMarket Return 1�991 0�484
�5�141�∗∗∗ �2�458�∗∗Market Return∗OPF 1�989 0�168
�2�597�∗∗∗ �1�284�Market Return∗OPM 1�053b 0�186c
�3�434�∗∗∗ �3�890�∗∗∗Market Return∗PG 3�352b 1�011c
�3�967�∗∗∗ �2�034�∗∗
Market Volatility (standard deviation of daily MIDCAC stock index returns) ending at pricing dateMarket Volatility 6�654 2�181
�2�185�∗∗ �2�075�∗∗Market Volatility∗OPF 8�210 1�644
�1�286� �2�096�∗∗Market Volatility∗OPM 2�371 0�468c
�0�654� �0�739�Market Volatility∗PG 14�616 4�914c
�2�175�∗∗ �1�812�∗Adjusted R2 0�258 0�313 0�131 0�192
This table presents the same regressions as Table 5 (regressions of mean and “squared deviation” of first-day underpricing onfirm-specific variables, Market Return and Market Volatility variables, splitting by procedure) for “Second Marché” offeringsonly. This reduces our sample to 179 observations. All variables are as defined in Table 5. (White heteroscedasticity-consistentt-statistics are in parentheses.)a�b� c Coefficients are significantly different from each other at a 1% level (and, respectively, a 5% or 10% level).∗ Significant at a 10% level.∗∗ Significant at a 5% level.∗∗∗ Significant at a 1% level.
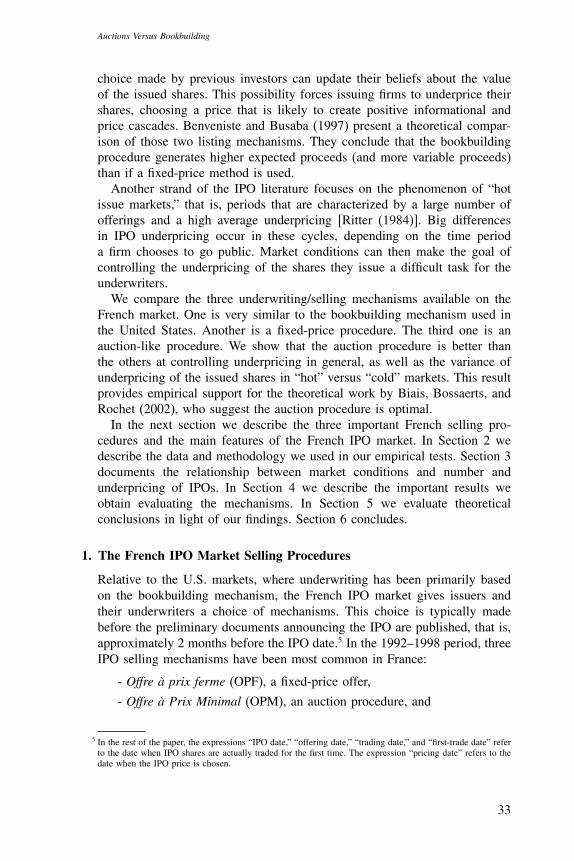
is mostly driven by the higher cross-sectional variability in PG offerings:the Market Return coefficient for PG offerings, 1.059, is again significantlydifferent from the one for OPMs, 0.184, at a 1% level, and also from theOPF coefficient, 0.183, at a 1% level. The Market Volatility∗PG coefficient(6.640) is also significantly larger than the Market Volatility ∗ OPM andMarket Volatility∗OPF coefficients (equal to 0.402 and 1.640, respectively)at the 1% and 5% levels, respectively. Thus the variability of underpricingis more sensitive to Market Volatility for bookbuilt (PG) offerings than forauction (OPM) and fixed-priced (OPF) counterparts.
49

The Review of Financial Studies / v 16 n 1 2003
Table 10Test for endogeneity of the choice of procedure, isolating issuers that did not choose their IPO procedure
Underwriter OPF OPM PG Total Spec. PG Spec. OPM No Spec.
Banques Populaires 3 33�5 3 39�5 0 1 0Crédit Agricole 5�5 12�5 10 28 0 0 1Crédit Lyonnais 2�5 2 15 19�5 1 0 0BNP 1 7 9 17 0 0 1CIC 5 6�5 5 16�5 0 0 1Société Générale 3�5 1�5 8 13 1 0 0Banque d’Orsay 0 10�5 1 11�5 0 1 0Crédit du Nord 0 5�5 5�5 11 0 0 1Pinatton 0 1�5 8�5 10 1 0 0Paribas 0 1 8 9 1 0 0
Dependent First-day return First-day return “Squared deviation” “Squared deviation”variable (underpricing) (underpricing) of return of return
Intercept, firm, and industry control variablesIntercept −0�483 −0�544 −0�109 −0�132
�−2�284�∗∗ �−2�581�∗∗ �−1�211� �−1�398�Exchange 0�023 0�042 −0�001 0�006
�0�502� �0�892� �−0�061� �0�239�Ln_ mktcap 0�035 0�032 0�008 0�007
�2�182�∗∗ �2�075�∗∗ �1�279� �1�150�Hi-tech 0�100 0�102 0�015 0�016
�3�109�∗∗∗ �3�266�∗∗∗ �1�059� �1�143�
IPO procedure dummiesOPM (auction) −0�064 0�107 −0�018 0�046
�−1�604� �1�881�∗ �−1�030� �2�535�∗∗
PG (book-building) X X X X
Market Return (buy-and-hold MIDCAC stock index returns) ending at pricing dateMarket Return 2�579 0�789
�5�708�∗∗∗ �3�375�∗∗∗Market Return∗OPF X XMarket Return∗OPM 1�030a 0�180a
�2�588�∗∗ �3�342�∗∗∗Market Return∗PG 3�482a 1�138a
�5�548�∗∗∗ �3�288�∗∗∗
Market Volatility (standard deviation of daily MIDCAC stock index returns) ending at pricing dateMarket Volatility 13�896 4�449
�3�488�∗∗∗ �2�494�∗∗Market Volatility∗OPF X XMarket Volatility∗OPM 2�457a 0�296a
�0�574� �0�376�Market Volatility∗PG 23�786a 8�165a
�3�961�∗∗∗ �2�771�∗∗∗
Adjusted R2 0�293 0�341 0�185 0�192
This table presents the same regressions as Table 5 (regressions of mean and “squared deviation” of first-day underpricing onfirm-specific variables, Market Return and Market Volatility variables, splitting by procedure) for issuers that presumably didnot choose their IPO procedure. We consider an IPO company did not choose its IPO procedure if it went public on “NouveauMarché,” or its underwriter was specialized in either OPM or bookbuilding. This reduces our sample to 169 observations.
In the first table we estimate the degree of specialization of the 10 largest underwriters in our sample. We count the proportionof PG and OPM offerings for each underwriter in which they were lead underwriters. If one of these procedures was usedby an underwriter 80% of the time or more, we consider this underwriter is specialized. The Spec. PG, Spec. OPM, and NoSpec. columns are equal to 1 if the underwriter is specialized in bookbuilding, auction, or in neither of these two mechanisms,respectively.
In the second table, we replicate Table 5, keeping only “Nouveau Marché” IPOs or IPOs led by a specialized underwriter andusing the procedure in which this underwriter is specialized. All variables are as defined in Table 5. (White heteroscedasticity-consistent t-statistics are in parentheses.)a Coefficients are significantly different from each other at a 1% level.∗ Significant at a 10% level.∗∗ Significant at a 5% level.∗∗∗ Significant at a 1% level.
50

Auctions Versus Bookbuilding
Table 11Test for endogeneity of the choice of procedure, two-stage least square regressions
Stage 1 Logit regressionDependent variable PG
%shares-created 1�655∗∗Goal-exit 2�036∗∗∗Goal-structure 0�155Goal-acquisition 0�227Rank-underwriter 0�070∗∗Pseudo-R2 0�129
Stage 2 regressionDependent variable First-day return (underpricing) “Squared deviation” of return
Intercept, firm, and industry control variablesIntercept −0�601 −0�159
�−2�438�∗∗ �−1�932�∗Exchange −0�041 −0�027
�−0�891� �−1�577�Ln_ mktcap 0�051 0�016
�2�456�∗∗ �2�178�∗∗Hi-tech 0�064 0�010
�1�970�∗ �0�942�
Predicted PG variablePG (book-building) −0�095 −0�076
�−0�570� �−1�303�
Market Return (buy-and-hold MIDCAC stock index returns)ending at pricing date
Market Return∗OPM 0�817c 0�026b
�0�913� �0�105�Market Return∗PG 4�705c 1�723b
�2�855�∗∗∗ �2�856�∗∗∗
Market Volatility (standard deviation of daily MIDCAC stock index returns)ending at pricing date
Market Volatility∗OPM 16�714 1�498�0�127� �0�642�
Market Volatility∗PG 9�755 6�242�0�744� �1�574�
Adjusted R2 0�248 0�234
This table presents the same regressions as Table 5 above (regressions of mean and “squared deviation” of first-day underpricingon firm-specific variables, Market Return and Market Volatility variables, splitting by procedure) using the two-stage leastsquare regression methodology.
In the first stage, we run a logit regression with PG (a dummy variable equal to one when the IPO used the bookbuildingprocedure) as the dependent variable and the following set of independent variables: %shares-created, the ratio of sharescreated in the IPO to existing shares before the IPO; rank-underwriter, the rank of the lead underwriter of the offering (1 beingthe highest rank), determined by the number of IPOs in which it was the lead underwriter in our sample period; goal-exit,goal-structure, and goal-acquisition, dummy variables equal to 1 when the goal of allowing one of the pre-IPO shareholdersto exit the capital (of rebalancing the capital structure or acquiring a company, respectively) was announced in the pre-IPOprospectus. We restrict our sample to IPOs that used the PG or OPM procedure, and to “Second Marché” offerings. Thenumber of observations is 107.
In the second stage we run the same regressions as in Table 5 (columns 2 and 4), replacing the PG and OPM proceduredummies by their predicted values using the coefficient of the first-stage regression. All other explanatory variables are asdefined in Table 5. (White heteroscedasticity-consistent t-statistics are in parentheses.)a�b� c Coefficients are significantly different from each other at a 1% level (and, respectively, a 5% or 10% level.)∗ Significant at a 10% level.∗∗ Significant at a 5% level.∗∗∗ Significant at a 1% level.
51

The Review of Financial Studies / v 16 n 1 2003
4.1 Artificial pricing constraintsAn important difference between the French and American bookbuilding pro-cedures is the role of the upper price limit. In both mechanisms, an ini-tial price range is announced prior to the IPO. In the United States, IPOsare often priced outside this price range. In France, although this is notexplicitely required, IPOs are almost always priced within the bounds of thisprice range.22 We know from Hanley (1993) that a partial adjustment phe-nomenon exists and that the pricing relative to the initial filing price rangeaffects underpricing significantly. We find partial adjustment and the pricelimits to be relevant in the French markets as well. We examine next howthese issues relate to market conditions.
In Table 7, we sort IPOs by market “hotness” at the pricing date andby procedure.23 We construct the previous 3-month weighted Market Returnvariable for each calendar trading day in the 1992–1998 period and sortthese days into quintiles. Each IPO in our sample is assigned to one of thesequintiles sorted on the value of the 3-month weighted Market Return as ofthe pricing date. We analyze only the two main procedures, bookbuilding(PG) and auctions (OPM), and we split the PG group in two subgroups. Thevariables PGU and PGL stand for PG offerings that are priced at the upperbound of the initial price range and within the initial price range, respectively.For PGU, PGL, and OPM offerings, Table 7 presents statistics on how manyIPOs fall in each quintile and their mean and median underpricing.
First, it is no surprise that there are more IPOs in hot market conditions,but of interest is that this phenomenon is relatively stronger for PGs thanfor OPMs (60.8% of PGs took place in quintiles 4 or 5 of market “hotness”versus 45.5% of OPMs). This may mean that underwriters are less willing totake firms public in less hot markets using the bookbuilding (PG) proceduresince the risks of a poor listing are higher. Second, we notice that manybookbuilt IPOs were priced at the upper bound of their initial price rangewhen the market was bullish (66% of bookbuilding offerings listed in quintile5 conditions versus 62.5%, 50%, 33.3%, and 10% in quintiles 4, 3, 2, and 1,respectively).
The key issue of higher underpricing in hot market conditions is shownby the IPOs that fall in the 5th (hottest market) quintile. They are moreunderpriced on average than the ones in other quintiles. For bookbuilt IPOspriced within the initial price range (PGL in Table 7), underpricing does notexceed average unconditional underpricing rates of about 15%. The pictureis very different for PGs priced at the upper bound of the initial price range(PGU in Table 7). These bookbuilt IPOs priced at the upper pricing limit
22 In the 135 bookbuilt IPOs in our sample, only 1 was priced above the upper limit of its initial price range.This IPO was simultaneously listed on the NASDAQ. In the rest of the article we consider this IPO as pricedat the upper bound of its initial price range.
23 Throughout the rest of the article, we will not consider fixed-price IPOs, since the question of how well market“hotness” information is incorporated into the IPO price is less relevant for this virtually defunct procedure.
52

Auctions Versus Bookbuilding
have a mean (and a median) underpricing of 40.23% (34.62%). Especiallywhen bookbuilt IPOs are priced at the upper bound of the initial price range,they are very sensitive to market conditions.
In Table 8, we test how good the two procedures are at incorporatingmarket hotness into the share price. We posit that an IPO procedure can beconsidered efficient in controlling market conditions if it incorporates thisinformation in the pricing process rather than in the aftermarket trading.Underpricing is our measure of how much information (that was not incor-porated into the IPO price) is incorporated into the aftermarket price. Weconstruct two more measures: the first, Price Range Adjustment, reflects theamount of information incorporated into the IPO price in the pricing process(i.e., in the period leading to pricing an offering): it is equal to the differencein percent between the minimum price announced in OPM offerings (or thelower bound of the initial price range in the case of bookbuilding24) and theIPO price (statistics on this variable are presented in Table 1). The secondmeasure, Total Price Adjustment, reflects the way the price has moved in thewhole IPO process, from the original reservation price (or the lower boundof the initial price range in the case of bookbuilding) to the closing priceat the end of the first trading day. These three variables are linked by thefollowing formula:
�1+Price Range Adjustment�∗ �1+Underpricing�= 1+Total Price Adjustment�
We run three regressions with the three measures above used as dependentvariables and our usual firm characteristics and market condition variables asindependent variables. Table 8 presents the results of these regressions. In thefirst regression (column 1, dependent variable: Price Range Adjustment), theimpact of Market Return on price adjustment is significantly positive onlyfor OPMs and PGLs. This impact is significantly larger for these two typesof offerings than for the PGU type (at the 5% and 10% levels, respectively).This means that more market hotness information is incorporated into the IPOprice in OPMs and PGLs than in PGUs. The opposite is true in column 2(dependent variable, Underpricing): Market Return has a larger impact forPGUs than for the two other types (the difference is significant at 1% forOPMs, 10% for PGLs).
The results in Tables 7 and 8 suggest that when bookbuilding is used, theupper limit imposed on pricing is more likely to be binding in hot markets.When this limit is binding, market hotness information is not incorporatedproperly into the IPO price. Thus it is incorporated into the aftermarket price,which results in excess underpricing. On the contrary, when the markets are
24 Taking the midpoint of the initial price range instead of its lower bound does not change the results signifi-cantly.
53

The Review of Financial Studies / v 16 n 1 2003
not particularly hot, bookbuilding does a good job of incorporating markethotness information into the IPO price, as the auction procedure does in allmarket conditions.
4.2 Endogeneity of procedure choice and therobustness of the results
The choice of IPO procedure is endogenous: perhaps issuers whose IPOsare likely to be more sensitive to market conditions prefer to choose thebookbuilding procedure, and vice versa. This potential endogeneity problemcould possibly bias our regression coefficients and conclusions. To addressthis question, we use three distinct methodologies.
4.2.1 Isolating Second Marché IPOs. So far we have considered offeringson two distinct exchanges: Second Marché and Nouveau Marché. The lat-ter is designed for young companies, the former for more established firms.Consequently these exchanges attract companies with different characteris-tics: as we have seen previously (see Table 1 for details), firms that go publicon Nouveau Marché are significantly smaller. They also exhibit more under-pricing than their Second Marché counterparts (16.96% versus 11.81% onaverage). Moreover, all Nouveau Marché IPOs in our sample used the book-building procedure (for a discussion on the motives for this choice, see thediscussion in “Data and Methodology”). This has an impact on the charac-teristics of our PG (versus OPM) offerings. In order to eliminate this bias,we repeat the tests that appear in Table 5, considering only Second MarchéIPOs.
The results in Table 9 are quite similar to the previous ones: our mainresult, the significant difference between the impact of Market conditionsfor bookbuilt versus OPM IPOs remains significant (see Table 9, columns 2and 4).
4.2.2 Isolating issuers that did not choose their IPO procedure. Next,we isolate the firms in our sample that did not choose the procedure theyused. Two types of firms can be in this situation: firms that go public onthe Nouveau Marché, and firms whose underwriter specializes in one of thetwo procedures. Clearly the choice of exchange (Nouveau Marché or SecondMarché) is made before the choice of procedure, the Nouveau Marché beingdesigned for young and small companies.25 Firms using the Nouveau MarchéIPOs have not had a choice: in our sample, they all used the bookbuildingprocedure. Discussions with underwriters and practitioners suggest that afirm that wants to go public generally chooses as a lead underwriter a bankwith which it had a previous relationship. Some underwriters specialize in
25 Listing requirements are quite different on the two exchanges. For instance, the Second Marché has somerequirements on equity and past earnings, which prevent most technology start-ups from choosing this market.
54

Auctions Versus Bookbuilding
one of the two procedures. The reason for this specialization is that thetwo procedures require very different organizational structure. Bookbuildingrequires a large team to advertise the issue and deal with the placement ofthe shares. This is not the case in auctioned IPOs. To estimate the degree ofspecialization of underwriters, we count for each the number of PG and OPMofferings in which they were lead underwriters. If one of these procedureswas used by an underwriter 80% of the time or more, we consider thisunderwriter to be “specialized.”
This procedure allows us to estimate, for each IPO in our sample, whetherthe company chose its mechanism. We assume that a firm did not chooseits IPO procedure if it went public on the Nouveau Marché or if its leadunderwriter was “specialized” and the procedure it used was the one thisunderwriter is specialized in. Seventy-three IPOs chose the Nouveau Marchéand 97 chose Second Marché offerings (60 OPMs and 37 PGs). Consequentlywe have a subsample of 170 out of 234 PG and OPM offerings that arguablydid not choose their IPO procedure. Table 10 presents the “specialization”of the 10 largest underwriters (in number of deals) and a reestimation ofTable 6. This reestimation does not change our previous conclusions.
4.2.3 Two-stage least squares regressions. Our third robustness test fol-lows Jenkinson, Ljungqvist, and Wilhelm (2001). The idea of the methodol-ogy is to estimate the choice of procedure using variables that are exogenouswith respect to our dependent variable (underpricing). In the first stage werun a logit regression, with the PG dummy as the dependent variable andexogenous variables as our explanatory variables. This allows us to predictthe probability of choosing the bookbuilding (versus OPM) procedure foreach IPO in our sample using the coefficients obtained in the logit regres-sion. In the second stage we replace our dummy variables (PG and OPM)by their predicted values and run the same regressions as in Table 6.
The first step is to choose our exogenous variables. All the variables wehave used so far happen to be endogenous with respect to underpricing (i.e.,each of them has a significant impact on underpricing). In order to run thisendogeneity test, we use seven new variables. Six of them come from theprospectus issued before the offering:
- age: the age of the company, in number of years, at the IPO date.
- bm: the book value of equity-to-market capitalization of the companyat the IPO date.
- %shares-created: the ratio of shares created in the IPO to existing sharesbefore the IPO.
- The goal of the offering, as announced in the prospectus. Three possible(not mutually exclusive) goals were announced: exit of a major share-holder, rebalancing of the capital structure of the company, acquiring
55

The Review of Financial Studies / v 16 n 1 2003
another company. We build three dummy variables (goal-exit, goal-structure, and goal-acquisition), equal to 1 when the corresponding goalwas announced in the pre-IPO prospectus.
We build another variable (rank-underwriter), which is equal to the rank ofthe lead underwriter of the offering (1 being the highest rank), determinedby the number of IPOs in which it was the lead underwriter in our sampleperiod.26
These variables were chosen because we believe they can influence thechoice of procedure. For instance, when a company issues new shares in itsIPO, it may have to spend more marketing effort to convince investors thatthe projects the money will be invested in have positive net present value(NPV). However, some of the variables we chose (e.g., age or bm), whichare linked with ex ante uncertainty, may also have an impact on underpricing.In order to make sure that the variables we use to estimate the probabilityof choosing the bookbuilding procedure are not linked with underpricing,we regress underpricing on each of these variables and eliminate those thatexhibit coefficients with p-values smaller than 10%. This first step leads usto eliminate the age and bm variables. In order to eliminate some “exchangeeffects,” we also take the conservative decision of considering only SecondMarché offerings in the first-stage regression.27 This and missing values leaveus with 107 observations in the first stage, 149 in the second stage.
The results of the two-stage least square regression are presented inTable 11. In the first stage, three variables have significant explanatorypower: the larger rank-underwriter, the higher the probability of choosingbookbuilding. This may come from the fact that the largest underwriterover the 1992–1998 period was specialized in OPM offerings and thatother “large” underwriters did both bookbuilt and auctioned offerings. Thegoal-exit variable has a positive coefficient too, which may come from thefact that outside investors such as venture capitalists tend to select the book-building procedure. Finally, as we suspected, the larger the number of sharescreated in the IPO, the higher the probability the firm chose bookbuilding.However, the pseudo-R2 obtained is quite low (12.9%), meaning that theexplanatory power of these variables on the choice of procedure is small.
The second stage of the regression replicates Table 6, replacing the pro-cedure dummies by their predicted values obtained with the coefficients ofthe logit regression. Our main result [the significant difference between theimpact of Market Conditions on underpricing when the bookbuilding (versusOPM) procedure is used] still holds. The economic significance (difference in
26 We implicitly assume that the rank of the underwriter has not changed over the 1992–1998 period. However,the data suggest that the ranking has not changed in this period, that is, underwriters with a large IPO activityin 1992 still have a large IPO activity in 1998.
27 Indeed, some of the variables we use behave differently on the two exchanges. For instance, firms that gopublic on Nouveau Marché are required to issue new shares. Consequently the %shares-created variable ismuch larger, on average, for Nouveau Marché IPOs.
56
Auctions Versus Bookbuilding
the mean procedure coefficients) is as great as before, although the p-valuesare lower than in previous tests. This can be explained by the fact that sev-eral observations were lost due to missing values and the small explanatorypower of the variables used in the first-stage regression.
5. Linkage to Theories of Underpricingand Optimal Selling Mechanisms
How do these findings inform previous theories and assumptions about under-pricing and selling procedures? Are our results consistent with prior theory ordo they suggest alternative interpretations? Our research raises and hopefullysheds light on the following theoretical questions: Why do market “condi-tions” (i.e., previous market return and volatility) have a significant impacton underpricing? What features of the bookbuilding and auction mechanismsaccount for their differential impact on underpricing in “hot” markets?
A common theme in the theories explaining IPO underpricing links under-pricing with information asymmetry. In a pioneering study by Rock (1986),informed investors only subscribe to high-quality issues, leaving uninformedinvestors with a disproportionate share of “losers.” Thus underpricing mustoccur on average if uninformed investors are to be adequately compensatedto participate disproportionately in weaker deals. This is the winner’s curse.In another asymmetric information model by Benveniste and Spindt (1989),informed investors are paid a “bribe” in the form of underpricing to revealtheir private valuation information. In both models, some investors have pri-vate information about the true value of the IPO, and the level of underpricingdepends on the amount of uncertainty or information asymmetry.
Rittter (1984) and Beatty and Ritter (1986) argue that ex ante uncer-tainty should increase underpricing, and the evidence supporting the uncer-tainty/underpricing relationship is strong. Market volatility in the monthswhen an IPO is being planned could quite naturally increase this uncertaintyand lead to more underpricing.
The impact of market volatility on uncertainty (and thus underpricing) isstandard, but the consequences of market return are less clear. We posit thatlarge market movements are associated with changes in investors’ expecta-tions. But how much these changes in expectations will affect the marketprice of IPO shares [i.e., how high (low) a price investors are willing topay for IPO shares in good (bad) market conditions] is quite uncertain. Theincentives of the parties involved in the IPO could lead them to choose toanchor on “midterm” prices, not taking the informational contents of goodor bad market conditions fully into account.28 Indeed, in good market con-ditions, underwriters may prefer to adjust only partially: this allows them to
28 This “partial adjustment” is different from the one obtained in Benveniste and Spindt (1989): in their model,only private information matters. The adjustment we describe here is related with public information (namely,market “temperature”).
57

The Review of Financial Studies / v 16 n 1 2003
favor large regular investors, which will presumably obtain large rents froman underpriced offering, and to avoid setting too high a price. On the otherhand, in bad market conditions, issuers may refuse to lower the IPO pricetoo much relative to their initial expectations. Such behaviors can explain thelink between underpricing and market conditions. From this point of view, anIPO procedure that gives little power to underwriters, like the French OPMauction, is likely to mitigate the impact of market conditions on underpricing.
Let us now analyze the IPO selling mechanisms in more detail. Theoret-ical models of IPO procedures show that both bookbuilding and the Frenchauction-like mechanism provide investors with incentives to place bids thatreveal their beliefs while fixed-price offerings cannot [see Benveniste andSpindt (1989), Biais, Bossaert and Rochet (2002), and Biais and Faugeron-Crouzet (2002)].
However, we report above that in France an auction-like mechanism ismore efficient than bookbuilding at controlling the underpricing reaction tomarket “temperature.” The French implementation of bookbuilding effec-tively sets an upper price limit.29 As we show in Table 7, this limit affectsthe underpricing of newly listed shares in very hot markets. When infor-mation in investors’ bids corresponds to an IPO price within the limits ofthe price range, bookbuilding does a good job of digesting this informationin the offering price [consistent with the idea modeled in Benveniste andSpindt (1989)]. Alternatively, when information revealed in investors’ bidscorresponds to a price above the initial price range, this information is notproperly incorporated into the IPO price and large underpricing results.
In the United States, the IPO offering price need not lie within the ini-tial price range. This institutional difference limits a complete “horse race”comparison of pure bookbuilding and auctions. However, even in the UnitedStates, bookbuilding appears particularly vulnerable to the partial adjustmentphenomenon, first documented by Hanley (1993) for U.S. shares. Issuers andtheir investment bankers appear to anchor on valuations in the initial pricerange, and when demand is much greater than expected, the pricing is notincreased sufficiently to choke off the excess demand, creating above-averageunderpricing.
While bookbuilding regulations are very similar in France and the UnitedStates, another question is why the upper limit of the initial price range isbinding in France but not in the United States. This might reflect weaker com-petition among underwriters on the French IPO market than in the UnitedStates. Indeed, French companies going public tend to choose their regu-lar bank as their lead underwriter instead of creating competition betweenpotential underwriters. Thus we hypothesize that the (lack of) efficiency ofthe bookbuilding procedure is related to the market power of underwriters
29 As we note in Section 4, the upper price limit is not legally binding but was only exceeded once in 135bookbuilt offerings.
58

Auctions Versus Bookbuilding
and privileged investors and to the competitiveness of the IPO market. How-ever, as Chen and Ritter (2000) show, even the U.S. market for IPOs is farfrom perfectly competitive.
On the other hand, the French auction (OPM) mechanism, which is mar-ket driven rather than underwriter driven, has fewer frictions and reflects allinvestors’ valuations more completely in the offer price, reducing underpric-ing. As Biais and Faugeron-Crouzet (2002) show, this mechanism encouragespotential investors to disclose their true beliefs in their bids. In this perspec-tive, the elimination of bids with prices over a given limit and the possibilityto postpone the offering and transform it into a fixed-price offering is inter-esting. First, these two features of the OPM procedure mitigate the winner’scurse that exists in “classic” auctions. Second, they prevent investors fromplacing orders at very high prices (i.e., market orders). Thus, whatever theconditions at the IPO date, informed investors are provided adequate incen-tives to place informative bids when the OPM auction mechanism is used.
6. Conclusion
We have shown that Market Return, a proxy for the overall market’s pricemomentum in the 3 months prior to an offering, is a significant ex antepredictor of the level of underpricing in French IPOs. While this result hasbeen hinted at or assumed in past research on U.S or other markets, we offerdirect evidence of its important effect on IPO underpricing in the Frenchmarket.
Because the impact of this market return is so substantial, we nextexamined which underwriting mechanism best controls its effect on IPOunderpricing. In the United States, the bookbuilding mechanism is usedexclusively, except for the smallest offerings. In France, three distinctmechanisms remain, and two are dominant. The first is the PG procedure,which resembles the U.S. bookbuilding procedure. The second is the OPMprocedure, an auction-like mechanism. The third mechanism, a fixed-pricemechanism, has faded in popularity in recent years.
We show that the initial price of the auction offerings incorporates moreinformation about the current and recent past market conditions than in thebookbuilt offerings. This result raises an important question: if the auctionprocedure dominates the bookbuilding procedure in mitigating underpricingin varied market conditions, what features of the bookbuilding proceduremake it dominant in the United States and very significant (and increasing)in the rest of the world? Wouldn’t issuers and investors be better served byauction-type sales?
However, there is another interpretation of the difference in underpricingbetween auction and bookbuilding. As is hypothesized by Kutsuna and Smith(2001), bookbuilding may allow issuers to reveal their quality credibly toinvestors. Thus bookbuilding allows them to obtain a higher price for their
59

The Review of Financial Studies / v 16 n 1 2003
shares, but also entails a revelation cost that might take the form of higherunderpricing. Our article does not explore this hypothesis, which is left openfor further research.
This study has focused mainly on the underpricing factor, showing thatbookbuilt IPOs do not incorporate current market return into the offeringprice as well as auction IPOs. Indeed, factors other than underpricing areclearly important to both issuer and underwriter [Sherman (2000)]. Whilemitigating underpricing is a worthy objective to issuers, it clearly is not theironly objective. Controlling underpricing is clearly not the most importantissue to underwriters who suffer an agency conflict of interest, pitting theirissuing clients against their investor clients. Investor clients are repeat cus-tomers, issuers are not, or at least, are less so. The underwriter’s benefitof access to investors’ capital for future offerings through underpricing maydominate the “cost” of potential future punishments by underpriced issuers.30
Because underwriters have pricing control and because they currently con-trol the key access to important institutional investors, issuing firms appear tosettle for a second-best underpricing outcome when the bookbuilding proce-dure is used. But they perhaps gain an ostensibly better-selected set of initialowners or other potential benefits from using the bookbuilding procedure.
ReferencesBeatty, R. P., and J. Ritter, 1986, “Investment Banking, Reputation, and the Underpricing of Initial PublicOfferings,” Journal of Financial Economics, 15, 447–471.
Beatty, R. P., and I. Welch, 1996, “Issuer Expenses and Legal Liability in Initial Public Offerings,” Journalof Law and Economics, 39, 545–603.
Benveniste, L., and W. Y. Busaba, 1997, “Bookbuilding vs. Fixed Price: An Analysis of Competing Strategiesfor Marketing IPOs,” Journal of Financial and Quantitative Analysis, 32, 383–403.
Benveniste, L., and P. Spindt, 1989, “How Investment Bankers Determine the Offer Price and Allocation ofNew Issues,” Journal of Financial Economics, 24, 343–361.
Benveniste, L., and W. Wilhelm, 1990, “A Comparative Analysis of IPO Proceeds Under Alternative Regula-tory Regimes,” Journal of Financial Economics, 28, 173–207.
Biais, B., P. Bossaerts, and J. C. Rochet, 2002, “An Optimal IPO Mechanism,” Review of Economic Studies,69(1), 999–1017.
Biais, B., and A. M. Faugeron-Crouzet, 2002, “IPO Auctions: English, Dutch, � � � French, and Internet,”Journal of Financial Intermediation, 11, 9–36.
Brennan, M. J., and J. Franks, 1997, “Underpricing, Ownership and Control in Initial Public Offerings ofEquity Securities in the UK,” Journal of Financial Economics, 45, 391–413.
Chen, H., and J. Ritter, 2000, “The Seven Percent Solution,” Journal of Finance, 55, 1105–1131.
30 While Dunbar (2000) shows that investment banks lose future business if they underprice too much, Beattyand Welch (1996) and Krigman, Shaw, and Womack (2001) show that in the 1990s, the largest and mostreputable underwriters have the highest underpricing as well. In fact, Krigman, Shaw, and Womack find thatfirms switching underwriters have far lower underpricing than those that do not switch (when conducting theirfirst seasoned deal). See Michaely and Womack (1998) for other aspects of this agency conflict.
60
Auctions Versus Bookbuilding
Dunbar, C., 2000, “Factors Affecting Investment Bank Initial Public Offering Market Share,” Journal ofFinancial Economics, 55, 3–43.
Habib, M. A., and A. P. Ljungqvist, 2001, “Underpricing and Entrepreneurial Wealth Losses in IPOs: Theoryand Evidence,” Review of Financial Studies, 14, 433–458.
Hanley, K. W., 1993, “The Underpricing of Initial Public Offerings and the Partial Adjustment Phenomenon,”Journal of Financial Economics, 34, 231–250.
Husson, B., and B. Jacquillat, 1990, Sous-évaluation des titres et méthodes d’introduction au Second Marché(1983–1986), Finance 11.
Ibbotson, R., 1975, “Price Performance of Common Stock New Issues,” Journal of Financial Economics, 2,235–272.
Ibbotson, R., J. Sindelar, and J. Ritter, 1994, “The Market’s Problems with the Pricing of Initial PublicOfferings,” Journal of Applied Corporate Finance, 7, 66–74.
Jenkinson, T., Ljungqvist A. P., and W. J. Whilhem, 2001, “Global Integration of Primary Equity Markets:The Role of U.S. Banks and U.S. Investors,” forthcoming in Review of Financial Studies.
Kutsuna, K., and R. Smith, 2001, “Issue Cost and Method of IPO Pricing: Japan’s Change from Auction toBook Building,” working paper, Claremont University.
Krigman, L., W. Shaw, and K. L. Womack, 1999, “The Persistence of IPO Mispricing and the PredictivePower of Flipping,” Journal of Finance, 54, 1015–1044.
Krigman, L., W. Shaw, and K. L. Womack, 2001, “Why Do Firms Switch Underwriters?,” Journal of FinancialEconomics, 60, 245–284.
Leleux, B., 1993, “Post-IPO Performance: A French Appraisal,” Finance, 11, 79–105.
Logue, D., 1973, “Premia on Unseasoned Equity Issues,” Journal of Economics and Business, 25, 133–141.
Loughran, T., J. R. Ritter, and K. Rydqvist, 1994, “Initial Public Offerings: International Insights,” Pacific-Basin Finance Journal 2, 165–199.
Michaely, R., and K. L. Womack, 1998, “Conflicts of Interest and the Credibility of Underwriter AnalystRecommendations,” Review of Financial Studies, 12, 653–686.
Ritter, J., 1984, “The Hot Issue Market of 1980,” Journal of Business, 57, 215–240.
Ritter, J., 1998, “Initial Public Offerings,” Contemporary Finance Digest, 2, 5–30.
Rock, K., 1986, “Why New Issues are Underpriced,” Journal of Financial Economics, 15, 187–212.
Sherman, A. E., 2000, “IPOs and Long-Term Relationships: An Advantage of Book Building,” Review ofFinancial Studies, 13, 697–714.
Stoughton, N. M., and J. Zechner, 1998, “IPO-Mechanisms, Monitoring and Ownership Structure,” Journalof Financial Economics, 49, 45–77.
Welch, I., 1992, “Sequential Sales, Learning, and Cascades,” Journal of Finance, 47, 695–732.
61