An investigation into Fast Food advertising and health ...
92
1 An investigation into Fast Food advertising and health consciousness in Ireland
Transcript of An investigation into Fast Food advertising and health ...

1
An investigation into Fast Food
advertising and health
consciousness in Ireland

2
An investigation into Fast Food advertising
and health consciousness in Ireland
Dissertation submitted in part fulfilment of the requirements
for the degree of
Master of Science in Marketing
at Dublin Business School
Carlos Eduardo Rezende e Souza
Student ID: 10348397
Supervisor: Dr. Shakeel Siddiqui
Word count: 19,958
Master of Science in Marketing 2018

3
Declaration: I, Carlos Eduardo Rezende e Souza, declare that this research is my original
work and that it has never been presented to any institution or university for the award of
Degree or Diploma. In addition, I have referenced correctly all literature and sources used in
this work and this this work is fully compliant with the Dublin Business School’s academic
honesty policy.
Signed: Carlos Eduardo Rezende e Souza
Date: August 18th, 2018.

4
Acknowledgements:
I would like to express my sincere gratitude to everyone who have supported me throughout
the course of this MSc. For the past two years, I have learnt so much, not only in the
professional or scientific arena, but also as person.
First my supervisor, Dr. Shakeel Siddiqui, for his guide and support during the dissertation
process, . Thanks to Dr. Alan Graham, who was my lecturer for “Writing for Graduate
Studies”, for his suggestions and helping me building ideas. I also would like to acknowledge
much appreciation to all DBS staff, in special the librarian team for all their assistance.
Thanks to my friends Daphne Farávola, Joseph Coppola, Louise Rubin and Luana Hortenci,
for all the support that they gave me in the last two years, for their sincere and prompt
feedback from dissertation proposal, questionnaire tests and final paper.
Dedication:
This dissertation is dedicated to my parents Joao Francisco and Silene, and my siblings
André and Ane, who have supported me every step of the way. Living away from home is
not easy sometimes, the love and bond between us gave me support to never give up.
Finally, I dedicated this dissertation to my partner Patrick, for his love, patience and for
always believing in me. I could not have made it this far without you.

5
Abstract
This research aim to investigate the influence of fast food advertising and healthy
consciousness in Ireland, offering guidance on how restaurants can enhance advertising
strategy, in relation to: food-related behaviour, legislation and negative connotations of fast
food. Poor-quality diet and low levels of physical activity are cause of many non-
communicable diseases (Naughton, et al. 2015). In Ireland, the Department of Health
approved the Code of Practice aiming to reduce population exposure to marketing initiatives
relating to HFSS foods (Irish Department of Health, 2017).
The research approach includes a review of relevant literature on fast food advertising and
consumer behaviour, coupled with collection and analysis of empirical data. A questionnaire
was carried out with 110 adults across four different age groups. Another questionnaire was
sent to four fast food restaurants.
Key findings: women in general; middle-age adults and older adults; and people with higher
income showed significantly higher health consciousness; people with higher income had
high assumption that healthy food is more expensive; taste was the most important factor
when deciding for eating out; and advertisement of fast food did not appeal to potential
customers of healthy fast food.
The main conclusions: advertising of healthy fast food was not seen as a strong factor over
people’s food choice, thus different adverting strategies should be taking into consideration
due distinct behaviour between women and men, age groups and income.
This dissertation recommends future research that consider: a bigger sample size (Ireland);
the approach of focus groups (depth analysis); investigate the influence of television
comparing to internet exposure on food choice; investigate the influence of healthy food
advertising among families with kids and no kids; and study countries with distinct cultures
and distinct income per capita (East and West Europe).
Keywords: fast food, healthy food, healthy fast food, food-related behaviour, advertising,
food choice

6
Table of Content
1. Introduction ....................................................................................................................... 11
2. Literature Review .............................................................................................................. 15
2.1 Literature Introduction ................................................................................................. 15
2.2 Literature theme one - Food and Fast Food Advertising ............................................. 15
2.3 Literature theme two - Food Advertising for Children .................................................. 20
2.4 Literature theme three - The Food Industry and Public Health Legislation ................. 21
2.5 Literature theme four - Healthy Eating Studies ........................................................... 23
2.6 Literature Conclusion .................................................................................................. 26
3. Methodology ..................................................................................................................... 27
3.1. Methodology Introduction ........................................................................................... 27
3.2 Research Design ......................................................................................................... 27
3.2.1 Research Philosophy ............................................................................................ 27
3.2.2 Research Approach .............................................................................................. 27
3.2.3 Research Strategy ................................................................................................ 28
3.3 Sampling - Selecting Respondents ............................................................................. 28
3.4 Data Collection ............................................................................................................ 30
3.5 Data Analysis .............................................................................................................. 30
3.6 Research Ethics .......................................................................................................... 31
3.7 Limitations of Methodology .......................................................................................... 31
4. Survey Findings: Description, Analysis and Synthesis ..................................................... 32
4.1 Introduction .................................................................................................................. 32
4.2 Findings ....................................................................................................................... 32
4.2.1 Demographics ....................................................................................................... 32
4.2.2 Food Choice ......................................................................................................... 35
4.2.2.1 Food Choice and Eating Behaviour ............................................................... 35
4.2.2.2 Food Choice and Personal Income ................................................................ 39
4.2.2.3 Food Choice and Age Groups ........................................................................ 40
4.2.2.4 Fast Food: Healthy versus Traditional ........................................................... 42
4.2.3 Fast Food Advertising ........................................................................................... 51
4.2.4 Summary of Findings ............................................................................................ 58
5. Discussion ..................................................................................................................... 59
5.1 Consumer behaviour and the motivation behind healthy eating ................................. 59
5.1.1 Gender .................................................................................................................. 60
5.1.2 Age ....................................................................................................................... 60
7
5.1.3 Income versus Social Class .................................................................................. 61
5.1.4 Price ...................................................................................................................... 61
5.1.5 Taste ..................................................................................................................... 61
5.1.6 Fast food: Healthy versus Traditional ................................................................... 62
5.2 Consumers response to fast food advertisement – enhancing advertising of fast food
business. ........................................................................................................................... 63
5.2.1 The influence of Advertisement ............................................................................ 63
5.2.2 Other influencers .................................................................................................. 65
5.3 The “side” effects of healthy food legislation to the fast food market .......................... 65
5.3.1 Food Research & Development ............................................................................ 65
5.3.2 Sports Sponsorship .............................................................................................. 66
5.4 Proposed advertising guide: overcoming obstacles .................................................... 67
5.5 Summary of Discussion ............................................................................................... 67
6. Conclusion ..................................................................................................................... 71
7. Recommendations ......................................................................................................... 73
8. Reflections ..................................................................................................................... 75
References ............................................................................................................................ 77
Appendix ............................................................................................................................... 85
Appendix 1 – Questionnaire Consumers ........................................................................... 85
Appendix 2 - Questionnaire - The Fast Food Industry ...................................................... 88
Appendix 3 – Ethics Checklist ........................................................................................... 89
Appendix 4 – Support Documentation – Information Sheet for Participants ..................... 91

8
List of Tables
Table 1 – Respondents: Q1. Gender x Q2. Age Group ........................................................ 33
Table 2 – Q3. Respondents Annual Personal Income .......................................................... 33
Table 3 – Overview of Survey Sample .................................................................................. 34
Table 4 – Q4. "I follow a healthy and balanced diet" and Gender (Q1) ................................ 36
Table 5 – Q2. Age and Healthy Eating Behaviour (Q4 and Q5) ........................................... 41
Table 6 – Q2. Age Group and Healthy Eating Behaviour (Q4 and Q5) ................................ 41
Table 7 – Q7. Fast Food Restaurants that sell healthy food according to respondents ....... 43
Table 8 – Respondents who cited Freshly Chopped as a fast food restaurant that sells
healthy food .......................................................................................................................... 43
Table 9 – Q8. How often do you go to your healthy fast food restaurant? If you have any
favourite. ............................................................................................................................... 44
Table 10 – Q3. Annual Personal Income and visit to healthy fast food restaurant (Q8) and
traditional fast food restaurant (Q9) ...................................................................................... 45
Table 11 – Q4. Frequency of respondent follow a healthy and balanced diet versus Q8.
Frequency of respondents go to a healthy fast food restaurant ............................................ 45
Table 12 – Q4. Frequency of respondent follow a healthy and balanced diet versus Q9.
Frequency of respondents go to a traditional fast food restaurant ........................................ 46
Table 13 – Q10. Regarding your food choice when eating out, which factor listed below is
the most important? and Gender (Q1) .................................................................................. 48
Table 14 – Q10. Regarding your food choice when eating out, which factor listed below is
the most important? and Income (Q3) .................................................................................. 48
Table 15 – Q11. "I think that eating healthy food is more expensive." and Income (Q3) ...... 50
Table 16 – Q13. Do you remember any healthy fast food advertising? and Gender (Q1) .... 53
Table 17 – Fast Food Restaurants that respondents remember seen an advertising of
healthy food .......................................................................................................................... 53
Table 18 – Q14. How likely are you to go to a healthy fast food restaurant based only on its
advertisement? and Income (Q3) ......................................................................................... 56

9
List of Graphs
Graph 1 – Q3. Annual Personal Income ............................................................................... 34
Graph 2 – Q4. “I follow a healthy and balanced diet” ............................................................ 35
Graph 3 – "I follow a healthy and balanced diet most of the time"(Q4) and "It is important that
the food I eat keep me healthy" (Q5) and Q9 "How often do you go to a fast food
restaurant?” (%) .................................................................................................................... 36
Graph 4 – Q5. “It is important that the food I eat…” .............................................................. 37
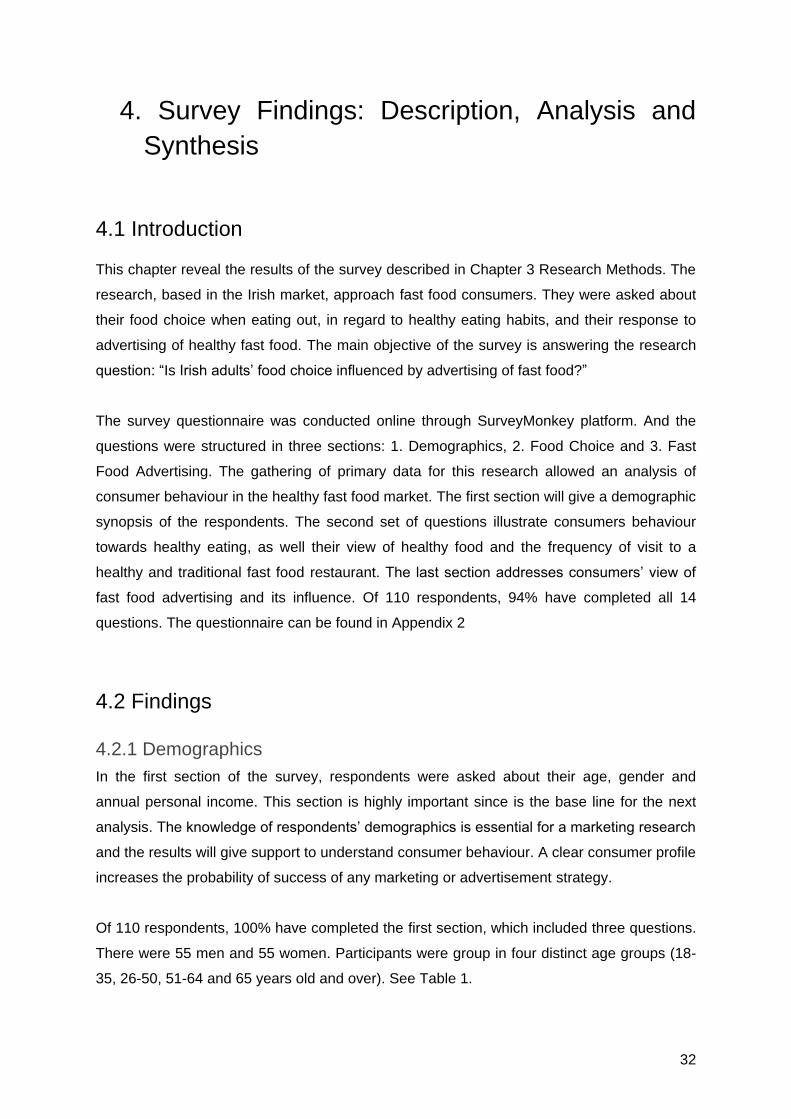
Graph 5 – "I follow a healthy and balanced diet most of the time and "It is important that the
food I eat keep me healthy" and Gender .............................................................................. 38
Graph 6 – “I follow a healthy and balanced diet most of the time" (Q4), "It is important that
the food I eat keep me healthy" (Q5), "I rarely go to a fast food restaurant" (Q9), and Gender
(Q1) ....................................................................................................................................... 38
Graph 7 – Q4. "I follow a healthy and balanced diet most of the time" ................................. 39
Graph 8 – Q5. "It is important that the food I eat keep me healthy" and Personal Income (Q3)
.............................................................................................................................................. 40
Graph 9 – Q6. Do you think Fast Food restaurants sell healthy food? ................................. 42
Graph 10 – Q8. How often do you go to your Healthy Fast Food restaurant versus Q9. How
often do you to a Fast Food restaurant (traditional) .............................................................. 44
Graph 11 – Q10. Regarding your food choice when eating out, which factor listed below is
the most important? .............................................................................................................. 47
Graph 12 – "I follow a healthy and balanced diet most of the time"(Q4) and "It is important
that the food I eat keep me healthy" (Q5) and most important factor when considering eating
out (Q10). .............................................................................................................................. 49
Graph 13 – Q11. "I think that eating healthy food is more expensive." ................................. 49
Graph 14 – Q11. "I think that eating healthy food is more expensive." and Gender (Q1) ..... 50
Graph 15 – Q12. "Do you think advertising of healthy food is aimed at?" ............................ 51
Graph 16 – Q12. "Do you think advertising of healthy food is aimed at?" and Gender (Q1) 52
Graph 17 – Q13. Do you remember any healthy fast food advertising? ............................... 52
Graph 18 – Q14. How likely are you to go to a healthy fast food restaurant based only on its
advertisement? (%) ............................................................................................................... 54
Graph 19 – Q14. How likely are you to go to a healthy fast food restaurant based only on its
advertisement? and Gender ................................................................................................. 54
Graph 20 – Q14. How likely are you to go to a healthy fast food restaurant based only on its
advertisement? and Gender (Q1) ......................................................................................... 55
Graph 21 – Respondents who go to their favourite healthy fast food restaurant once a month
and their likeability to go to a healthy fast food restaurant based on its advertisement ........ 56

10
Graph 22 – Respondents who rarely go to their favourite healthy fast food restaurant and
their likeability to go to the same kind of restaurant based on its advertisement .................. 57
Graph 23 – Respondents who do not have a favourite healthy fast food restaurant and their
likeability to go to the same kind of restaurant based on its advertisement .......................... 58

11
An investigation into fast food advertising and
health consciousness in Ireland
1. Introduction
Over the past 15 years numerous studies have been done in the area of fast food
advertising and consumer behaviour. Some of these studies with focus on children and
healthy eating. There is a general and wide perception that fast food is not healthy. And
some researchers argue that the food industry has crucial responsibilities concerning public
health issues, such as obesity and type 2 diabetes. (Tempels, et al. 2017 and Kelly, et al.
2010).
The relationship between food marketing and public health is conflicting, sometimes clashing
with each other. The main objective of food advertising is to encourage consumers to
consume even more, and consume in excess leads to health problems. In addition, the
production of tasty foods requires require a complex process and in general the use of
ingredients such as sugar, salt, oils and chemical compounds which are not the most healthy
choices. “The food sector plays a crucial role in relation to healthy weight … therefore,
advertising and pricing play a major role in food choice” (Irish Department of Health, 2017).
Unhealthy eating is becoming a global concern. World authorities such as World Health
Organisation (WHO) has established that a poor-quality diet and low levels of physical
activity are causative factors in the development of many non-communicable diseases as
well as having many social and economic consequences (Naughton, et al. 2015).
A study by Story and French (2004) presented that in USA 15% of young people were
overweight and the index for children was almost double, reaching triple among teenagers,
comparing to statistics from the 80’s. This same study has shown data from different sources
such the US Department of Health and Human Services and the American Diabetes
Association where ‘‘almost two-thirds (60%) of overweight children had at least one
cardiovascular risk factor (e.g., hypertension, hyperlipidaemia) and the prevalence of type 2
diabetes mellitus were increasing among young people.’’ With great concern about the future
health and productivity of the American population and the increasing of the health care
costs (Story and French, 2004).

12
In 2016, data from the Organisation for Economic Co-operation and Development (OECD) -
Directorate for Employment, Labour and Social Affairs and Australian Institute of Health and
Welfare (AIHW) revealed that obesity affects low and rich-income countries (Norman et al.,
2003 cited in Freeman et al., 2016, p.2).
The United Kingdom and Ireland, through a number of initiatives, has demonstrated equal
attention about its population’s health and eating habits. In the UK a campaign called
Change4Life aim to encourage people to change their eating habits and adopt an active life
by practising exercises. Another action from the UK government was the launch of ‘The
Eatwell Guide’, that is a policy with recommendations on eating healthy and achieving a
balanced diet. (Public Health England, 2017).
Ireland has recently implemented the ‘Traffic Lights Label’. The traffic light colour coding is
used to rank fat, saturated fat, salt and sugar. The ranking colour stands for: high (red),
medium (amber) or low (green) based on nutrient cut-off points.
In 2009, the Food Safety Authority of Ireland (FSAI) published a nationwide survey about
consumers’ understanding and views of food labelling. At least two thirds of consumers said
they would be inclined to buy food products labelled with the nutrition claims: ‘low salt’, ‘low
sugars’, ‘high fibre’, or ‘fat free’. (Food Safety Authority of Ireland, 2009).
A study conducted by Crofton et al. (2013, p. 1136) examined Irish consumers’ perceptions
and expectations towards healthy snacks and has found that “consumers expected a healthy
snack to contain low levels of calories, fat, salt and sugar, and to contain high levels of
wholegrain, oats, bran, nuts, seeds, pulses and fruit”. A demand for healthy snacks, or
healthy fast food in general can be related to the fact that traditional fast food, known as high
in calories, trans fat (fat created in an industrial process), sugars and salt, is pointed as
cause of obesity and heart diseases. (Arcan et al. 2013, p. 1-3; American Heart Association
(no date), p.1; Jolly, 2011, p. 3; Herron, 2014).
A study conducted by Kelly et al. (2010, p. 334), concerned about unhealthy food and child
obesity. Examining commercial activity around food marketing in Irish schools, the
researchers found that 81.4% operate shops or canteens that sell snacks, 44.7% have
drinks vending machines and 28% snack vending machines. In response to Irish regulations
87.3% of schools agreed with establishing a national voluntary code of practice in relation to
industry sponsorship, that is recommended by the Irish National Taskforce on Obesity.

13
Another study investigated the frequency and type of food and beverage TV advertised for
children in UK and Ireland. The study analyzed the morning broadcasts between 6:00 and
11:30 in both countries. The results showed a total recording of 1,155 food and beverage
cues. The most frequent food cue were sweet snacks with 13.3% and sweets/candy with
11.4%. Regarding beverage cues, tea/coffee was the most frequent with 13.5%, and sugar-
sweetened beverages 13.%. As final result, the study showed that both countries present
high levels of unhealthy food cues, showing evidence of unhealthy food in children’s
programming (Scully et al. 2014).
Other two research investigate the influence of television food advertising on consumer’s
food choice. The first one, conducted by Scully et al. (2008), examined the association
between television advertising exposure and Australian adults’ consumption of fast foods.
Results shown a positive relation between cumulative exposure to television food advertising
and fast-food consumption. The study by Kemps et al. (2014), also conducted in Australia,
investigated consumer behaviour after exposure to television food advertising, noticing an
increased self-reported desire to eat.
A research by Richards and Padilla (2007), debates the question of fast food advertising
versus consumption. This complex study took in consideration the fast food industry in
Canada. As well used an empirical model of fast food demand, and an analysis of the
promotion effect to understand “brand choice, category choice and purchase quantity”. The
results agreed that in Canada, advertising increases demand for fast food.
In Ireland, advertising of food is also a concern by the health authority. One of the latest
figures point the country as having the fourth highest prevalence of overweight and obesity
in men in the EU and the seventh highest prevalence among women, according to Irish
Department of Health (2017). To tackle this issue, in 2016 the government approved and
published a policy called 'A Healthy Weight for Ireland - Obesity Policy and Action Plan,
2016 - 2025', urging government and society to work together. “This policy is committed to
60 different but integrated actions that include: Develop, implement and evaluate a Code of
Practice for food and beverages promotion, marketing and sponsorship”, Irish Department of
Health (2017).
From these studies it is possible to affirm that the Irish government and consumers are
concern about unhealthy eating. However, there is no many studies conducted in Ireland
regarding the relation between fast food advertising and consumption. This gap offers an

14
opportunity to this research to investigate the advertising of fast food and consumer
behaviour towards food choice in an Irish perspective. So, the proposed research question:
Is Irish adults’ food choice influenced by advertising of fast
food?
Consumer behaviour towards fast food is changing. Consumers are demanding healthier
options and they would pay more for that. According to Nielsen’s 2015 Global Health &
Wellness Survey cited in Forbes, 2015, 88% of respondents are willing to pay more for
healthier foods.
Fast food restaurants are responsible for about 35% of Irish spending on foodservice
industry (The Irish Times, 2016a). And particularly the healthy fast food market with growing
presence in Ireland.
By adding valuable knowledge to the field of advertising of fast food and consumer food-
related behaviour, this research will directly benefit the fast food industry and academy
aiming to:
1. Better understand consumer behaviour and the motivation behind healthy eating.
2. Assist fast food restaurants, specially healthy fast food business enhance their
advertising.
3. Discuss how healthy food and food safety legislation can affect the present fast food
business.
4. Propose marketing strategies that deal with the negative aspects of the unhealthy
connotations of fast food.
With a qualitative research in format of interview with the industry looking at fast food
restaurant, this study will have a depth analyse of advertising of fast food and healthy food.
Through a quantitative research, by applying a questionnaire the research proposes to
investigate which factors influence consumer behaviour towards food choice, considering
eating outside their homes.

15
2. Literature Review
2.1 Literature Introduction
The literature review was evaluated to bring relevant and up to date research, study cases
and newspaper reports on fast food and its advertising; the issue around food advertising for
children; healthy food and healthy fast food; public health legislation; healthy eating studies,
and some marketing and advertising concepts. With all those subjects with sources in
Ireland and abroad, aiming to support this research objective.
2.2 Literature theme one - Food and Fast Food Advertising
Advertising is part of a company’s communication mix, and it has a very wide scope. For
Linehan and Cadogan (2011), the main objective is to persuade consumers to purchase a
product or service. According to Belch and Belch (2012, p. 20), advertising enables the
company to build a positive and ‘‘unique images and associations’’ to the brand. Some
consumers are influenced by brands and for what they stand for it. The total advertising
expenditure in western Europe, was predicted to be worth US$ 38 billion in 2015 (eMarketer,
2011 cited in Boyland and Whalen 2016, p. 3).
Tempels et al. (2017, p1) and Boyland and Whalen (2016, p. 1), argue that international food
companies, which are called the ‘‘Big Food’’, contribute to problems such as obesity and
type 2 diabetes. These same companies produce most of the HFSS food and drinks (HFSS
stands for high in saturated fats, fat, sugar and salt) that contribute to developing diet-related
NCDs (noncommunicable diseases).
A review paper from Boyland and Whalen (2016, p. 1-4), discuss food advertising and
consumption in Europe with three major approaches. First is the use of digital marketing,
that is gaining space from traditional media, especially television. Companies are currently
spending more with online advertising. Facebook, Instagram and YouTube are some of the
platforms that have been presenting effective food brand publicity. Second is the increase of
the personalised advertising where the message is designed according to each consumer
profile.
According to Boyland et al. (2016), there is no evidence that prove that food advertising
increases food consumption in adults. The results of Mills et al. (2013) study did not
16
determined if it is true or not, that food advertising affects food-related behaviour, attitudes or
beliefs in adults, however, the results indicate that there is an impact which varies in
subgroups such as gender, weight and food habits.
Australian research shows that advertising of fast food it does influence consumption. In
2007 Scully et al. (2008), conducted a research to examine the association between
television advertising and consumption of fast foods on adults. Through a cross-sectional
telephone survey with questions that “included measures of frequency of fast-food
consumption at different meal times and average daily hours spent watching commercial
television”. Scully et al. (2008, p. 105). The results show that “23% of respondents usually
ate fast food for dinner at least once weekly, while 17% consumed fast food for lunch on a
weekly basis. The majority of respondents reported never eating fast food for breakfast
(73%) or snacks (65%)”. Regarding television time spending, “41% of respondents estimated
watching commercial television for 1h/d (low viewers); 29% watched for 2h/d (moderate
viewers); 30% watched for 3h/d (high viewers). After adjusting for demographic variables,
high viewers were more likely to eat fast food for dinner at least once weekly compared with
low viewers”. As the authors established: “the results of the study provide evidence to
suggest that cumulative exposure to television food advertising is linked to adults’ fast-food
consumption”, Scully et al. (2008, p. 105).
Boyland and Whalen (2016), also discuss about the influence of price on food and drink
expending. Results from a number of articles shows “evidence that price promotions and
retail displays increase purchases of high sugar foods” (Press release 04/08/2016;
Nakamura, R. et al. (2015) and Public Health England, 2015, cited in Boyland and Whalen
2016, p. 7). In the same article is given an example from England, where “40% of food and
drink expenditure is estimated to be on products with price promotions, with more
promotions on HFSS foods than healthy foods” (Press release 04/08/2016, cited in Boyland
and Whalen 2016, p. 7). The authors argue that the small number of “evidence of food
promotion in adults” do not imply that fast food advertising does not influence food choice,
particularly considering marketing budgets that fast food companies allocate for advertising
and other marketing activities.
Kemps et al. (2014), investigated eating behaviour in Australians after exposure to television
food advertising. They first “developed a word stem completion task to measure accessibility
of food-related cognitions”. Then in two subsequent experiments, 160 female undergraduate
students (Experiment 1) and 124 overweight or obese community-dwelling women
(Experiment 2) viewed a series of television commercials advertising either food or non-food

17
products”. The next step was to complete the word stem task and also rated their desire to
eat. The results show that “exposure to televised food advertisements led to the completion
of word stems with more food- and eating-related words in both experiments. In both
samples, there was a positive association between accessibility of food-related cognitions
and reported desire to eat, following priming with television food advertisements”. As final
conclusion, “an increased activation of food-related cognitions may provide a mechanism for
the link between food advertising and consumption. This has implications for tackling
pathological (over)eating”, Kemps et al. (2014, p. 1202).
A research by Richards and Padilla (2007, p. 2; p. 17, p. 25), studied the effects of fast food
advertising and consumption, observing “market share and total demand by estimating a
discrete / continuous model of fast food restaurant choice and food expenditure that explicitly
accounts for both spatial and temporal determinants of demand”. The complete sample was
12,000 Canadian households who reported purchasing food away from home for a period of
6 years (2000 - 2005), with focus on visits to fast food restaurants. Nevertheless, a random
sample of 139 households was chosen to create a more tractable data set. The results show
that marketing of fast food increases market share and expand demand for fast food in
general. The conclusion emphasizes that “the expansion in demand is far greater than that
due to brand-switching”.
In a wider point of view, Tuder (2016), presents four marketing elements responsible for
influence consumers’ food choice: Social Media, Word-of-Mouth, Television and Celebrity
Endorsement. Social Media such as Facebook and Instagram, can influence people’s
decision. How many times per day we check our news feed? The author mentions that “the
majority of buying decisions about what to have for a meal happen approximately two hours
before mealtime”. As a result, our fast food choice might be in response to the ads we are
exposed. Second is the Word-of-Mouth. We tend to trust on recommendation and opinion
from people we know and at certain extent has some influence on our decisions.
Another bias is Television, which can influence people’s opinion, including what consumers
eat. In 2014, eMarketer - a market research company - published a global research showing
that people were spending 4h31min in front of a TV and 5h16min with digital media. And the
last element is celebrity endorsement. Consumers in general are not aware of how much
celebrities can influence purchase decision, including food choice. ‘‘With repetition, the
association between celebrity and product create value in the mind of the consumer;
credibility is formed as well as brand recognition and trust’’ Tuder (2016).

18
King (2018), describes that various elements can influence food choice, for instance, flavour,
aroma and appearance, but the author strength this influence to four major factors: Culture,
Advertisers, Health and Time. The author argues that our preference for sweets and snacks
may have started in childhood with our parents giving them to us as reward instead of
healthier food. Advertisers tend to use lighting, shelf placement and packaging to influence
consumers’ choice. Medical history or healthy habits also can determine the king of food we
eat. And the fast-pace of our lives leave us with time shortage. As consequence fast food
restaurants or frozen food at home become first food options.
Acknowledging that the food sector plays a crucial role in relation to healthy weight the Irish
Government approved in 2016 'A Healthy Weight for Ireland - Obesity Policy and Action
Plan, 2016 - 2025'. The purpose of this code of practice is to “ensure that foods high in fat,
especially saturated fat, sugar and salt are marketed and advertised in a responsible way,
thereby reducing the exposure of the Irish population to marketing communication
concerning these foods to exert a positive influence on healthy eating patterns”. As
established: “the overall objective of this code is to reduce exposure of the population to
marketing initiatives relating to foods that are high in fat, sugar and/or salt (HFSS foods).
To conclude this section, the last two papers have their focus around the discussion on
healthy fast food versus fast food with healthy options our health claims. The first article is a
result of a research conducted by Chandon and Wansink in USA in 2007. The second one
written by McDermott in 2010 is about Tony Pace and his work as CMO for Subway, an
American fast food company, one of the world’s biggest fast food chain.
Chandon and Wansink (2007), have executed an extensive literature review and backed
with primary research. The study, carried out in USA, proposed and tested how health
claims influence food decision, would explain why the rate of obesity still increasing in
America while is also increasing the number of restaurants holding up a healthy flag. For this
research two fast food restaurants, with opposite positioning, was used as an example. One
is Subway, which is positioning to be healthy and the other side is McDonald’s, which do not.
The research was compound in four studies, and a short brief of some of its results is
showed next.
The first one is that consumers estimated that familiar sandwiches and burgers contain up to
35% fewer calories when they come from restaurants claiming to be healthy, such as
Subway, then when they come from restaurants not making this claim, such as McDonald’s
Chandon and Wansink (2007). As the Study 1 addressed calorie estimations, there was as

19
belief among consumers that Subway meal had 21,3% fewer calories than his competitor
McDonald’s. Another finding is that healthy conscious consumers or not are both influenced
by health claims and calorie estimation. The Study 2 conclude that ‘‘although nutrition
involvement improves the quality of calorie estimations, it does not reduce the halo effects of
the restaurant brand’s health positioning’’ (Chandon and Wansink, 2007, p. 303).
Other results, as presented in Study 3, shows that consumers tend to choose up 131%
higher calories of beverages side dishes, and deserts when the main course is target as
healthy. By answering some questions about eating healthy and attention to calorie
information, the respondents’ behaviour did not show any relation to healthy eating goals.
Finally, the Study 4 proposed correct the effects of health claims on main dish calorie
estimation and on side-dish choices. And the results presented that the health halo effects
were eliminated. ‘‘In fact, the effects of health claims are slightly reversed when participants
consider opposite arguments. … The Study 4 also shows that manipulating the name of the
restaurant and the type of food on the menu, while keeping the target meal constant, suffices
to influence consumers’ choice of side orders and their estimation of the number of calories
contained in a familiar meal consisting of a ham sandwich and a cola’’ (Chandon and
Wansink, 2007).
The authors at the end emphasized that was not the purpose of the study recommend
people to not eat in restaurants, like Subway, which does offer healthier meals than their
competitors. ‘‘As showed in Study 1, meals ordered at Subway contain, on average, fewer
calories (M = 694 calories) than meals ordered at McDonald’s (M = 1,081) … the findings
show that the public health benefits of healthier foods are at least partially negated by the
halo effects of health claims that lead people to order calorie-rich side dishes and
beverages’’.
As a complementary and last reading of this chapter is presented an article by McDermott
and published by WARC in 2010. This paper was about the work of Tony Pace, at that time,
CMO at Subway. He quoted: ‘‘Subway's position is unique because there are so many
different facets to the brand: fresh, made-to-order, more healthful than other fast food’’
(McDermott, 2010). His words come right to the discussion around the claims of some fast
food restaurants make as being healthy. However, is important to mention that this
observation does not mean a judgment of Pace’s statement but to emphasize the relevance
of this research.

20
2.3 Literature theme two - Food Advertising for Children
As mentioned before, food advertising for children and teenagers is not the focus of this
study. Given the extent research in this area, some valuable studies were found, which is
believed can positively contribute to this very research.
The importance of advertising for the success of a business is undeniable. In the US food
advertising was the second biggest sector, only behind the automotive industry (Story and
French, 2004). When it comes to advertising for children, some premises of consumer
behaviour are not left behind. The article approach that not only adults, but children can also
pass through all the brand stages: awareness, preference, loyalty, and food purchase and
repurchase (p. 14).
Other studies also show concern about food marketing to children. Some of them have
consistently shown that children exposed to food advertising prefer and choose advertised
food products more frequently than those not exposed to such ads (Kotz K, and Story M,
1994; Dibb, S. and Harris, L., 1996 and Lewis, M.K., and Hill, A.J., 1998 cited in Story and
French, 2004).
Television is one of the biggest advertising channels. In the US children and adolescents
watch TV for almost four and a half hours each day. (Rideout et al. 2010 cited in Arcan et al.
2013). This article brings findings from another study by Food for Thought, 2007 saying that
‘‘advertising accounts for half of all advertising time in children’s TV programs. Children
between 2 to 7 years see 12 food ads and those between 8 to 12 years see 21 food ads
each day, or 7,609 ads each year’’ (Arcan et al. 2013). According to Arcan et al. (2013) since
we started developing our food taste and preference at young age the excessive exposure to
food ads will permanently influence our eating behaviour.
It has been documented that among young children, TV viewing is significantly associated
with increased consumption of unhealthy foods, including fast food (Chang, H. and Nayga
Jr., R.M., 2009 cited in Arcan et al, 2013). Also increased requests of foods seen on TV, and
more positive attitudes toward unhealthy foods. (Dixon, H. G. et al., 2007; Chamberlain, L. J.
et al. 2006 cited in Arcan et al. 2013).
The next paper is a study by Bernhardt (et al. 2013), comparing television fast food
advertising aimed to children and the ones aimed to adults in the US. As method, all
nationally televised advertisements for the top 25 American fast food restaurants from July 1,

21
2009 to June 30, 2010 were obtained and reviewed to identify those advertising meals for
children and these advertisements were compared with adult advertisements from the same
companies. Of the 92 children’s meal advertisements during the study period 99% were
attributable to McDonald’s (70%) or Burger King (29%). Healthy food, milk and/or apple
slices, were present in 78% of children’s advertisements and none of the adult
advertisements. Median food image size was only 20 percent of the screen diagonal in
children’s ads compared with 45 percent in adult ads (Bernhardt et al., 2013, p.4).
Closing this chapter, two more papers were examined. Herron (2014), raises the problem in
Australia where 25% of Australian children is overweight or obese and 41% of their daily
food consumption are considered unhealthy. Another alarming statistic is the estimated
AUS$56 billion spent on obesity every year.
In Ireland a broadcasting legislation passed in 2001 requiring the Broadcasting Commission
to introduce a code that deals specifically with advertising either directly or indirectly targeted
at children. Approved in January 2015, the code defines children as persons aged under 18
years. And bans the use of cartoon characters and celebrities to promote foods to children
and certain categories of food, such as fast foods, must carry messages stating that the
foods should be eaten in moderation; as part of a balanced diet (Jolly, 2011).
Overall the discussion around food advertising for children does not leave behind the issues
concerning legislation, in most of the cases the lack of legislation. Several authors
expressed the importance of regulation concerning the exposure of advertising of unhealthy
food; the impact of advertising and obesity on children, and children eating habits (American
Heart Association, no date; Bernhardt et al. 2013; Herron, 2014 and Jolly, 2011). Another
call is for more regulation in regard to sponsorship for sports events (Herron, 2014) and
sponsorship in schools (Kelly, 2010; The Irish Times, 2017).
2.4 Literature theme three - The Food Industry and Public Health
Legislation
In this section is discussed the responsibilities of the food industry and its advertising has on
public health problems. And approach some governments’ initiatives to deal with obesity and
some diseases such as diabetes, heart condition.

22
Tempels et al. (2017, p. 402) in its paper argue that 'Big Food’ corporation is partially
responsible for public health problems such as obesity, but on the other side, those same
companies engage with programs to prevent those diseases. The article highlights the
importance of shared responsibility suggesting that food companies, governments,
individuals, and civil society, work together embracing on population health problems.
The next article is a research by Nixon et al. (2015). The paper examined news articles
containing obesity-related arguments that referenced a trade association or industry-funded
non-profit organization, between 2000 and 2012. In this period 393 articles were found. Only
2% were referred to obesity-related arguments attributed to the food industry in general. The
highlight was the years 2005 and 2009. The authors explained that in 2005 the food and
beverage industry acted in response ‘‘to a combination of obesity-prevention policy
developments and launched self-regulatory initiatives’’ (p. 2230). One example was the
limitation on soda in schools and the issue around ‘‘McDonald’s placement of nutrition facts
on its food packaging’’ (p. 2230). And from 2009, the industry’s presence in newspaper
coverage was about the industry reacting from a growing number of public health policy
actions, including the Affordable Care Act’s menu-labelling provision in 2010 and various
states and local efforts to regulate sugar-sweetened beverages.
Magnusson (2010), debates around the responsibilities food industry has to population
health problems, with the industry showing resistance to the adoption of a food labelling
scheme. Australia is in one of the countries fighting against obesity. Statistics showed in
2008 that 68% of men and 55% of women were either overweight or obese (Australian
Bureau of Statistics, 2009 cited in Magnusson 2010, p. 2). And there was an increasing of
the risks of chronic diseases including diabetes, heart disease, and several types of cancer
(Pérez, A. et al. 2007 cite in cited in Magnusson 2010, p. 2). To tackle this problem in 2009
the Australian government introduced the ‘Traffic Lights Label’.
A research conducted by Australian organizations and the Cancer Council showed that
Traffic Lights was highly approved. Consumers found to be easier to identify healthier the
foods, with a survey showing that consumers using traffic light labelling were “five times
more likely to correctly identify the healthier food products, compared to ‘‘daily intake label’’
which was monochrome % system). Furthermore, the debate about nutrition labelling has
moved beyond packaging to food items in chain restaurants in countries such as the United
States and Australia (McColl, K. 2008 cited in Magnusson 2010 p. 9).

23
In regard to food labelling, Ireland had also put in action. In 2009 the Food Safety Authority
of Ireland (2009), published a nationwide survey about consumers’ understanding and views
of food labelling. A questionnaire was carried face-to-face with 1,021 consumers and
interview face-to-face with 50 consumers. The survey showed that 87% of consumers
considered the nutrition table on a label to be very or fairly important, but most would prefer
to see nutrient values stated per portion (e.g. per bowl), than per 100g or 100ml (FoodBev
Media, 2009). About 65% of consumers would be inclined to buy food products labelled with
the nutrition claims: ‘low salt’, ‘low sugars’, ‘one of five a day’, ‘high fibre’, or ‘fat free’.
More than 70% of consumers surveyed said they were very or fairly concerned about salt in
food, so it’s important that food labelling is presented in a way that allows consumers to
identify lower salt options. Currently, the salt content of a food is declared as ‘sodium’, but
the majority of consumers said that they would prefer to see a ‘salt’ value on the label
instead, though labelling both would be acceptable.
The Irish govern has recently implemented the ‘Traffic Lights Label’. The traffic light colour
coding is where key nutrients, such as fat, saturated fat, sugar and salt, are ranked and
colour coded. The high levels (red), medium (amber) or low (green) based on nutrient cut-off
points. A survey by the Food Standards Agency UK showed that 39% of consumers found
the traffic light system most informative comparing to the Guideline Daily Amount – GDA
(FSAI, 2009).
To finish the argument about food advertising and legislation is presented a newspaper
articles about a new voluntary code of practice developed by the Department of Health, the
HSE, food companies and advertisers. According to The Irish Times (2017), this code aims
to reduce exposure to advertising of food and drink that is classified as HFSS - high in fat,
sugar and salt. The article presented an alarming data: 60% of Irish adults, and 25% of
children, are overweight or obese. With increasing obesity levels Ireland is set to become the
most obese in Europe by 2030.
2.5 Literature theme four - Healthy Eating Studies
The literature review closes bringing to the discussion research about eating habits studies.
The first two research debate about eating habits in Ireland. The last one is an American
documentary about the fast food industry and unhealthy eating.
The study conducted by Crofton et al. (2013), examined Irish consumers’ expectations
towards healthy cereal based snacks. The researchers explicated that ‘‘over the past decade

24
there has been a steady increase in the number of consumers demanding products with
functional benefits throughout’’ (Crofton et al. 2013, p. 1131).
Consumers’ attitudes and preferences towards healthy food products are closely related to
demographic variables such as age and gender (Tuorila et al., 1998; Roininen et al., 2001
cited in Crofton et al. 2013, p. 1131). Regarding gender women have been described as
more likely to comply with dietary guidelines (Bogue et al., 2005 cited in Crofton et al. 2013,
p. 1131) and have a more positive attitude towards the consumption of healthy snack
alternatives when compared with men (McIntyre and Baid, 2009 cited in Crofton et al. 2013,
p. 1131). In addition, older consumer groups have been shown to be more diet conscious
and more likely to make healthier snack choices compared with younger adults who are
more oriented towards unhealthy “comfort snacks” (Irish Universities Nutrition Alliance
(IUNA), 2001; Wansink et al. 2003 cited in Crofton et al. 2013, p. 1131).
As data collection method Crofton et al. (2013), used three male and three female focus
groups, both divided in three age groups. Some results are highlighted next:
1. Consumers expected a healthy snack to contain low levels of calories, fat, salt and
sugar, and to contain high levels of whole‐ grains, oats, bran, nuts, seeds, and fruit’;
2. The definition of snack was not conclusive by the participants. But the majority
defined snack as ‘‘as something eaten between regular meals’’;
3. Most of consumers would choose an unhealthy snack ‘‘especially if they had to “go
out of their way” to buy it’’;
4. Participants also said that ‘‘a healthier snack would appear more “home-made” and
“natural” and expected the product to be “baked” or “not fried” or produced under
organic growing conditions’;
5. “Taste” appeared to be decisive when choosing a snack. And constant mentioned as
the main reason for not choosing a healthy snack. Men was reported to assimilate
the word “healthy” with “boring” or “tasteless” food;
6. Healthy snacks were strongly associated with a higher price, with some impact on
the food choice by the student’s groups;
7. There was a perception that snack appearing healthy but with cheaper price,
comparing its competitors, would indicate have less quality;
8. Male participants reported that healthy snack alternatives available aim towards
women;
9. All groups apart from the male students were concerned about the ‘‘accuracy of
health claims’’ and with variety of snack products being labelled as “healthy”.

25
10. Women showed more positive attitudes towards choosing a healthy snack than male
groups.
The second article is a study analysing healthy eating motivation in relation to dietary,
lifestyle and activity behaviour by Naughton et al. (2015). As method, a cross-sectional
survey, with a sample of 1,262 adults. Some of its results are listed next:
1. People with strong motivation to eat a healthy diet had healthier dietary profiles,
exercised more and watched less television compared to those with weak
motivations towards eating a healthy diet;
2. Individuals motivated to eat healthy are more likely to make healthy food choices;
3. Women were more likely than men to be positively motivated towards eating a
healthy diet;
4. Healthy eating motivation becomes stronger with increasing age;
5. Social class was non-significant, which contrasted to previous studies where
significant associations were shown between social class and healthy eating.
The third reference of this chapter is a 2004 documentary by Morgan Spurlock, an American
filmmaker, who decided to document a 30-day diet eating exclusively at McDonald’s,
including bottled water. During this time, he was supervised by three physicians – a
cardiologist, a gastroenterologist, and a general practitioner. As well as a nutritionist and a
personal trainer. Soon he increased his cholesterol levels, started to present kidney
problems and other health issues. At the end of his diet he gained around 11kg.
He was criticized by his extreme experiment, while having his 3 meals a day he stopped
doing exercises. Only taking the 5,000 steps (the average distance an American walk every
day). Also criticized by not taking the advice of his doctors, of stopping with the diet after
presenting serious medical conditions.
The overall message with his diet was to increase people’s health conscious. Morgan
Spurlock not only show the consequences of eating fast food with such high frequency –
McDonald’s consider people who eat their food ate least once a week as ‘heavy users’, and
they count for 72% of the customers. And there are the ‘super heavy users’ who eat 3 or
more times a week. There is also concern about people who tend to go for supersized
options, like the 1.5 litre of soft drink.
The documentary also approaches other two big issues, the presence of unhealthy food in
American schools and the strong lobby the food industry has on government legislation. As

26
an example, the “Cheeseburger Bill”, a law passed in the US Congress that would make it
illegal for people to sue food companies for making them obese.
2.6 Literature Conclusion
From the literature review is noticed that until now most of studies and research in the field
of advertising and the fast food industry regard specially children and the excessive
exposure to food and beverage advertising on television; and public health problems and its
cost. This research aim to investigate the influence of advertising on consumer’s fast food
choice on adults in Ireland and health consciousness.
To achieve research objective 1 – A better understanding of consumer behaviour and the
motivation behind healthy eating, the literature review covered previous research in the area
of eating habit carried out in Ireland and US. For research objective 2 – Assist fast food
restaurants, specially healthy fast food business enhance their advertising, the literature was
based on advertising and marketing strategy, added to papers about food advertising in
Europe; and a number of studies that discus the influence of television and some other
factors on food consumption. To meet objective 3 – Discuss how healthy food and food
safety legislation can affect the present fast food business, the literature approached some
current legislations that impact on fast food adverting in Ireland. Finally, to meet objective 4 –
Propose marketing strategies that deal with the negative aspects of the unhealthy
connotations of fast food, the literature was based on general marketing strategy and digital
media.
The findings of the literature review will be discussed later with findings from the survey with
consumers and the interview of some experts involved in the food industry. The
methodology for primary data collection is explained in the following chapter) The objective
is to examine for any agreements or disagreements comparing to previous research, also
considering the possibility of bringing new knowledge to the academy and to the industry.
The main objective is to answer the research question: “Is Irish adults’ food choice
influenced by advertising of fast food?”
27
3. Methodology
3.1. Methodology Introduction
A methodology describes the process of the research including the methods used for data
collection. This chapter explains the techniques used to collect data from Primary Research.
First describing the Research Design, from which philosophy the study most relate to.
Second step is the Approach with a description of the nature of this research and the
developing of theory. Next explain which Strategy is used to collect data and why it was
considered to this research. This chapter also detail the sampling, in other words, which
people or groups of people have been approached and what materials and equipment were
used to store data. This same data was analysed in accordance to its nature. Coming to the
end a description regarding Ethics and its general issues. And finally, the Limitations faced
during the study.
3.2 Research Design
3.2.1 Research Philosophy
This study research falls more into an Interpretivist philosophy. According to Saunders et al
(2009, p.116) Interpretivism supports the idea that when research is conducted with people
is necessary take into consideration that we act as part of a society from we may have ‘‘our
own set of meanings’’. Furthermore, there is a debate with that Interpretivism is
recommended to business and management research such as marketing.
3.2.2 Research Approach
The research approach identified as suitable for this study was the Induction approach.
Where data is collected, and theory is developed as a result of data analysis (Saunders et al.
(2007, p. 118). Also, useful for studies with small samples (Saunders, et al. 2007 p. 119).
The authors summarize that some characteristics of the Induction approach as listed
(Saunders, et al. 2009, p. 127):
● An understanding of the meanings humans attaches to events;
● Close understanding of the research context;
● The collection of qualitative data’ and
● Less concern with the need to generalise,

28
3.2.3 Research Strategy
To answer my research question and meet my objectives, this research employed multiple
methods. A Survey (quantitative method) was required to reach a considerable number of
consumers in Ireland. Using a questionnaire to obtain responses respecting the influence of
marketing advertising of healthy food on its food choice. Also, this research approached fast
food companies through an in-depth Interview (qualitative method), that was the most
suitable strategy to obtain detailed information about the market and a more complete
picture about their marketing advertising management.
3.3 Sampling - Selecting Respondents
This research covered two populations of interest: Irish consumers and fast food restaurants.
Consumers were approached by a questionnaire sent through Survey Monkey, an online
survey platform. Fast Food restaurants were approached with an interview. A set of
questions were sent ahead by email. Due to the limitation of time, was not possible to carry
out a face-to-face interview, so the interviewees have written down the answers and sent it
back also by email. answers were collected.
The Irish Population
According to the latest Census, from 2016, Ireland had a total population of 4,761,865. Only
Dublin city and suburbs there are 1,173,179 people. Considering that still a big population for
this market study, it is proposed to approach a sample of the population.
Because the focus of this research was adult consumers the population of interest was also
adults, males and females, age of 18 years old and over, living in Ireland. A sample frame
was not available. Therefore, no-probability sampling was used, and the chosen method was
snowball. The use of snowball sampling occurs when there is difficulty of finding individual
cases (Saunders et al 2009, p. 234, 240). The expected sample size was around 100
people. Because this research was conducted by only one person this research was carried
out in Dublin city, since is the biggest city in the country and concentrate a large number of
fast food restaurants. As I believed a 100 people was a reasonable number to manage a
questionnaire survey.
The snowball started by contacting people from four different groups based in Dublin, which I
have considerable access:

29
● Arnotts employees - 10 employees
● Cantando Chamber Choir - 30 members
● ELA Language School - 10 employees
● Itsa Bagel employees - 20 employees
The next step was asking them to identify other people to answer the questionnaire and so
forth. The process was planned to stop when achieving 100 respondents or above. The
participants answered a questionnaire available online, with mixed open and closed
questions. As explained by Fink, 2003 (cited in Saunders et al., 2009, p. 374), open question
allow respondents to give answers in their own words. Closed questions use a set of
alternative answers with instructions of how to answer it. (Saunders et al., 2009, p. 375). For
example, questions looking for facts, as gender, age and income; and questions
investigating opinions, with predetermined statements, as an example level of agreements
and likeability (Collis and Hussy, 2009).
The respondents had a time window of 2 weeks to answer the questions. At the end of data
collection, 110 respondents (55 women and 55 men) have completed the questionnaire. This
difference meets the latest census of 97.8 males for every 100 females. (Census 2016). The
heterogeneous sampling allowed this study identity patterns in different groups.
The second population of interest was fast food restaurants. A sample frame was also not
available. Therefore, no-probability sampling was used. The chosen method was purposive
based on the companies that agreed with an interview.
The sample size is 4 companies:
Itsa (cafes, restaurants & catering)
Umi Falafel
Subway Ireland
Bombay Pantry
Representing Itsa, the person who took part in the interview was Domini Kemp – Co-founder
and Director. Frances Adgey, Marketing Manager for Subway Ireland was the interviewee.
By the end of the data collection phase I had no received reply from Umi Falafel and
Bombay Pantry.
The interview was semi-structured questions based. In a semi-structured interview, there are
some prepared question with a possibility the interviewer add another question during the

30
interview (Collis and Hussey, 2009). An open questions interview allows participant to give
detailed answers. (Saunders et al. (2009, p. 375). Data from the interview was coupled with
findings from the questionnaire – Chapter 4. Survey Findings: Description, Analysis and
Synthesis and discussed in Chapter 5. Discussion.
A secondary research also was done. With analysing Literature Review available in the
areas: Advertising, Marketing Strategy, Food Industry, Fast Food Industry, and Consumer
Behaviour, Healthy Food Legislation.
3.4 Data Collection
As mentioned before the questionnaire was available in online form. The online
questionnaire was chosen because had shorter completion time comparing to postal or
delivered and collection. According to Saunders et al. (2009, p. 364) a written questionnaire
would take between 2-6 weeks from distribution to collection. The usually automated data
input is another advantage. Indispensable to inform that the respondents identification will
remain confidential.
The interview was set be made through a face to-face meeting. The interview method was
chosen because employ higher engage by the interviewee and higher response comparing
to a questionnaire method. However, due to time limitations the interviewees agreed to write
down the answers and send them back by email. The questionnaire form informed in
advance the voluntary and consent in taking part of the research.
3.5 Data Analysis
Data Analysis is a complex step of a research and the type of data will guide the
interpretation of data collected from the questionnaire and interviews. This research
employed qualitative and quantitative data. All data collected was stored physically in my
personal computer and cloud storage as backup (Google Drive).
As quantitative data, this research managed categorical - nominal and ordinal data, and
continuous with ratio data. For non-quantity questions Saunders et al. (2009, p. 385) suggest
the use a coding scheme which further enable comparisons with other data. Those findings
will be presented with tables, charts and graphs. The Excel spreadsheets will use be used
for quantitative data analysis.
31
For qualitative data, through a semi-structured interview, data collected is summarised
allowing to better illustrate the theme; key themes or patterns are identified; and finally
developing theories and drawing relevant conclusion (Saunders, 2009, p. 490).
3.6 Research Ethics
This section addresses the ethical issues regarding access to people and organizations and
the collection of data which I declared:
1. This research had no ethics conflicts;
2. Privacy and confidentiality will be maintained;
3. The participation was voluntary - the questionnaire form informed beforehand that
once participants start to answer they automatically gave consent in taking part of the
research, with the possibility to withdraw any time (see Appendix 1 and Appendix 4);
and
4. The research does not offer any physical or psychological harm.
3.7 Limitations of Methodology
The research had identified some limitations as expressed below:
● Getting access to the industry - I have tried to get access to some of the biggest
worldwide fast food chains like McDonald’s and Burger King without success.
Supermac’s, the leading Irish fast food chain also was contacted but with no
particular reason decided to not participate of the research. Chopped, the Irish
healthy fast food chain was also contacted without response.
● Applying the ‘snowball’ sampling - there was a risk of bias, as respondents tend to
refer onto other people with similarities to themselves;
● Time - the limitation of time as the survey should was to be completed within 2
months;
● Human resource - the study was conducted only by me, as an individual essay; and
● Budget - all the expenses if any, was covered by this researcher.
32
4. Survey Findings: Description, Analysis and
Synthesis
4.1 Introduction
This chapter reveal the results of the survey described in Chapter 3 Research Methods. The
research, based in the Irish market, approach fast food consumers. They were asked about
their food choice when eating out, in regard to healthy eating habits, and their response to
advertising of healthy fast food. The main objective of the survey is answering the research
question: “Is Irish adults’ food choice influenced by advertising of fast food?”
The survey questionnaire was conducted online through SurveyMonkey platform. And the
questions were structured in three sections: 1. Demographics, 2. Food Choice and 3. Fast
Food Advertising. The gathering of primary data for this research allowed an analysis of
consumer behaviour in the healthy fast food market. The first section will give a demographic
synopsis of the respondents. The second set of questions illustrate consumers behaviour
towards healthy eating, as well their view of healthy food and the frequency of visit to a
healthy and traditional fast food restaurant. The last section addresses consumers’ view of
fast food advertising and its influence. Of 110 respondents, 94% have completed all 14
questions. The questionnaire can be found in Appendix 2
4.2 Findings
4.2.1 Demographics
In the first section of the survey, respondents were asked about their age, gender and
annual personal income. This section is highly important since is the base line for the next
analysis. The knowledge of respondents’ demographics is essential for a marketing research
and the results will give support to understand consumer behaviour. A clear consumer profile
increases the probability of success of any marketing or advertisement strategy.
Of 110 respondents, 100% have completed the first section, which included three questions.
There were 55 men and 55 women. Participants were group in four distinct age groups (18-
35, 26-50, 51-64 and 65 years old and over). See Table 1.

33
Table 1 – Respondents: Q1. Gender x Q2. Age Group
Respondents – Q1. Gender / Q2. Age Group
Gender 18–35 years 36–50 years 51–64 years 65+ years Total
Female 18 13 23 1 55
Male 13 15 26 1 55
Total 31 28 49 2 110
The majority of respondents were at the age group of 51-64 years old (45%), followed by
age group 18-35 years old (28%), then respondents age group 36-50 years old (25%), only 2
respondents were 65 years old or over (2%).
Participants were also asked about their annual personal income, (see Table 2, Question 3)
and group in four distinct income range (less than €20,000, €20,000 to €29,999, €30,000 to
€49,999 and €50,000 or more).
Table 2 – Q3. Respondents Annual Personal Income
Q3. Annual Personal Income
Number of Respondents
Less than €20,000 20
€20,000 to €29,999 22
€30,000 to €49,999 33
€50,000 or more 35
Total 110 In the first group, with annual income of less than €20,000 there were 20 respondents (18%).
The second group, annual income from €20,000 to €29,999 with 22 respondents (20%). The
group with income from €30,000 to €49,999 there were 33 respondents (30%). The last
group with income of €50,000 or more was slightly the largest group with 35 people (32%).
See Graph 1.

34
Graph 1 – Q3. Annual Personal Income
In order to examine the respondents’ behaviour, with more depth, they were group
considering the three variables: gender, age and annual personal income. See Table 3.
Table 3 – Overview of Survey Sample
Table 3 – Overview of Survey Sample Q1. Gender / Q3. Annual Personal
Income 18–35 years
36–50 years
51–64 years
65+ years Total
Female 18 13 23 1 55
Less than €20,000 7 1 5 0 13
€20,000 to €29,999 7 4 3 1 15
€30,000 to €49,999 4 5 1 0 10
€50,000 or more 0 3 14 0 17
Male 13 15 26 1 55
Less than €20,000 3 3 1 0 7
€20,000 to €29,999 2 2 3 0 7
€30,000 to €49,999 6 6 10 1 23
€50,000 or more 2 4 12 0 18
Total 31 28 49 2 110
From the overview survey sample, two particular groups presented the highest number of
respondents. The first group is represented by women age between 51-64 years old and
annual personal income of €50,000 or more (25% of female respondents) The other group is
represented by men in the same age group and income (22% of male respondents).
20
22
33
35
Q3. Annual Personal Income
Less than €20,000
€20,000 to €29,999
€30,000 to €49,999
€50,000 or more

35
4.2.2 Food Choice
In this section there were a set of 7 questions about food choice. Of 110 respondents 104 of
them (50 women and 54 men), have completed the section (95% of completion rate). The
respondents were asked to choose the statement that matched to their view most closely.
4.2.2.1 Food Choice and Eating Behaviour
Question 4 “I follow a healthy and balanced diet”, (Graph 2) and Question 5 “It is important
that the food I eat…” (Graph 3) were set in order to get an insight of consumers’ healthy
eating habit.
Graph 2 – Q4. “I follow a healthy and balanced diet”
Fifty nine percent of respondents, (34 women and 27 men, total of 61 people) declared that
they follow a healthy and balanced diet ‘Most of the Time’. Followed by respondents who
answered ‘Sometimes’, which was 25% of respondents (8 women and 18 men, total of 26
people). See also Table 4 as follow.
59%25%
9%
6% 1%
Q4. "I follow a healthy and balanced diet"
Most of the time
Sometimes
Rarely
Always
Never

36
Table 4 – Q4. "I follow a healthy and balanced diet" and Gender (Q1)
Q4. "I follow a healthy and balanced diet" and Gender (Q1)
Frequency Female Male Total
Always 3 3 6
Most of the time 34 27 61
Sometimes 8 18 26
Rarely 4 6 10
Never 1 0 1
Total 50 54 104
As shown in Table 4, women are keener to follow a healthy and balanced compared to men
when looking at the respondents who answered “most of the time” (56%). For respondents
who answered “sometimes”, the men takes the lead (69%). Overall, considering respondents
who answered “Always”, “Most of the time” and “Sometimes” women still more inclined to eat
healthy.
To enhance the analysis, the answer “I rarely go to a fast food restaurant” from Question 9,
is added to this evaluation. The result show that 72% of respondents who "Follow a healthy
and balanced diet most of the time" (Q4), and "It is important that the food they eat keep
them healthy" (Q5), "Rarely go to a fast food restaurant" (Q9). See Graph 3.
Graph 3 – "I follow a healthy and balanced diet most of the time"(Q4) and "It is important that
the food I eat keep me healthy" (Q5) and Q9 "How often do you go to a fast food
restaurant?” (%)
2% 4%
22%
72%
"I follow a healthy and balanced diet most of the time" (Q4) and "It is important that the food I eat keep me healthy" (Q5)
and Q9. "How often do you go to a fast food restaurant (%)
Every week
Every 2 weeks
Once a month
Rarely

37
The following analysis discuss, among four factors, which of them respondents most take in
consideration when choosing the food they are going to eat.
Graph 4 – Q5. “It is important that the food I eat…”
Note: Question 5 was adapted from a questionnaire applied in a research conducted by
Naughton et al. (2015, p. 10).
When asked about the importance of the food they eat, 61% of respondents (34 women and
29 men, in total 63 people) answered “It is important to keep me healthy”. For 17%
respondents (9 women and 9 men, in total 18 people) it is important that the food they eat
“Helps control the weight”, followed by 7% respondents (4 women and 3 men, in total 7
people) who answered, “Contains vitamins & minerals”. A group of 16 respondents (3
women, 13 men) “Do not worry about healthiness of food”, which was 15% of respondents.
Overall the analysis of the relation between gender and a healthy eating habit, show that
women appear to have more interest in eating healthy.
In another analysis of the influence of gender on healthy eating habits, the answers "I follow
a healthy and balanced diet most of the time" (Q4) and "It is important that the food I eat
keep me healthy" (Q5) were crossed. As observed on Graph 5, of 46 respondents who
matched the two answers, results shows that the female group have a healthier dietary
profile with 57% (26 women), compared to men with 43% (20 men).
61%
17%
7%
15%
Q5. "It is important that the food I eat..."
Keeps me healthy
Helps me control myweight
Contains vitamins &minerals
I do not worry about thehealthiness of food
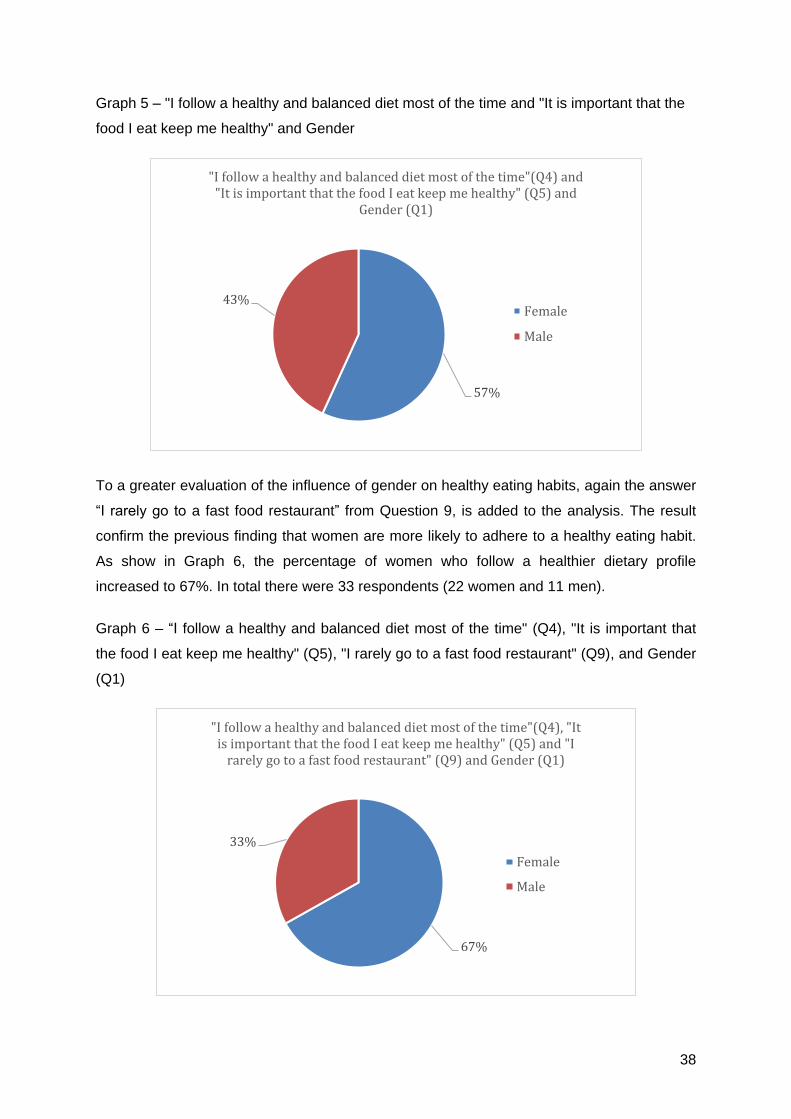
38
Graph 5 – "I follow a healthy and balanced diet most of the time and "It is important that the
food I eat keep me healthy" and Gender
To a greater evaluation of the influence of gender on healthy eating habits, again the answer
“I rarely go to a fast food restaurant” from Question 9, is added to the analysis. The result
confirm the previous finding that women are more likely to adhere to a healthy eating habit.
As show in Graph 6, the percentage of women who follow a healthier dietary profile
increased to 67%. In total there were 33 respondents (22 women and 11 men).
Graph 6 – “I follow a healthy and balanced diet most of the time" (Q4), "It is important that
the food I eat keep me healthy" (Q5), "I rarely go to a fast food restaurant" (Q9), and Gender
(Q1)
57%
43%
"I follow a healthy and balanced diet most of the time"(Q4) and "It is important that the food I eat keep me healthy" (Q5) and
Gender (Q1)
Female
Male
67%
33%
"I follow a healthy and balanced diet most of the time"(Q4), "It is important that the food I eat keep me healthy" (Q5) and "I
rarely go to a fast food restaurant" (Q9) and Gender (Q1)
Female
Male

39
4.2.2.2 Food Choice and Personal Income
To investigate any influence on eating behaviour in relation to Income, Question 4 “I follow a
healthy and balanced diet” and Question 5 “It is important that the food I eat” were crossed
with Question 3 “Annually Personal Income”.
Analysing the income of 59% of respondents (34 women and 27 men, in total 61 people)
who said “I follow a healthy and balanced diet most of the time”, is possible to see that as
income gets higher, also increases the number people with concerns about the food they
eat. With income of €50,000 or more there were 22 respondents (36%), followed by group
with income of €30,000 - €49,999 (28%). See Graph 7.
Graph 7 – Q4. "I follow a healthy and balanced diet most of the time"
For those respondents who answered "It is important that the food I eat keep me healthy"
there were 63 respondents. The two largest group was the ones of income between €30,000
and €49,999 with 19 respondents (30%) and income of €50,000 or more with 23
respondents (37%).
1210
17
22
0
5
10
15
20
25
less than €20,000 €20,000 - €29,999 €30,000 - €49,999 €50,000 or more
Q4. "I follow a healthy and balanced diet most of the time" and Q3. Personal Income / (number of respondents)

40
Graph 8 – Q5. "It is important that the food I eat keep me healthy" and Personal Income (Q3)
From the analysis of those two graphs, data show to some extent income can influence
consumer’s food choice.
4.2.2.3 Food Choice and Age Groups
The next analysis of food choice investigate the relation between eating behaviour trough
different generations.
Again, looking at the respondents who answered, "I follow a healthy and balanced diet most
of the time”, the age group which show more tendency of this habit was those between 36-
50 years old with 20 respondents (71%). Followed by age group 51–64 years old with 27
respondents (55%) and then age group 18-35 years old, 13 respondents (42%). See Table 4
- Age and Healthy Eating Behaviour.
The same pattern happens when studying the respondents who answered, "It is important
that the food I eat keep me healthy", as shown in Table 5. With age between 36-50 years old
were 19 respondents (68%). Followed by age group 51–64 years with 28 respondents (57%)
and then age group 18-35 years old, 14 respondents (45%).
7
14
19
23
0
5
10
15
20
25
less than €20,000 €20,000 - €29,999 €30,000 - €49,999 €50,000 or more
Q5. "It is important that the food I eat keep me healthy" and Q3. Personal Income / (number of respondents)
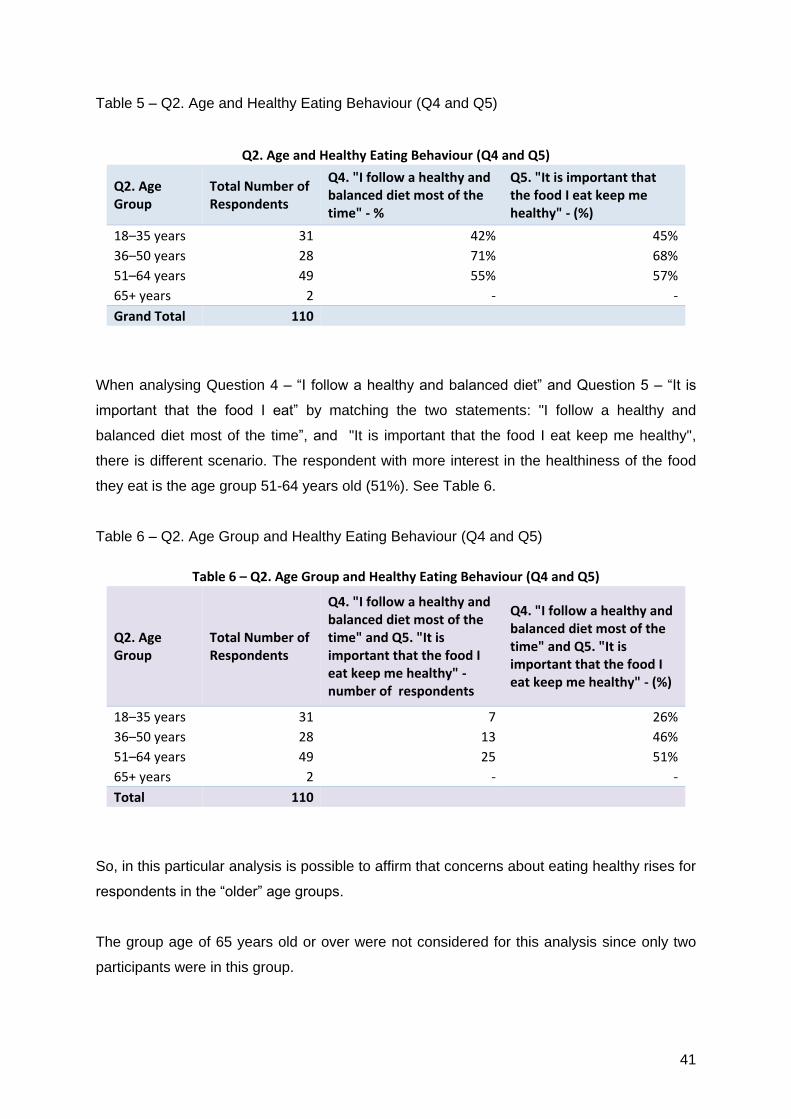
41
Table 5 – Q2. Age and Healthy Eating Behaviour (Q4 and Q5)
Q2. Age and Healthy Eating Behaviour (Q4 and Q5)
Q2. Age Group
Total Number of Respondents
Q4. "I follow a healthy and balanced diet most of the time" - %
Q5. "It is important that the food I eat keep me healthy" - (%)
18–35 years 31 42% 45%
36–50 years 28 71% 68%
51–64 years 49 55% 57%
65+ years 2 - -
Grand Total 110
When analysing Question 4 – “I follow a healthy and balanced diet” and Question 5 – “It is
important that the food I eat” by matching the two statements: "I follow a healthy and
balanced diet most of the time”, and "It is important that the food I eat keep me healthy",
there is different scenario. The respondent with more interest in the healthiness of the food
they eat is the age group 51-64 years old (51%). See Table 6.
Table 6 – Q2. Age Group and Healthy Eating Behaviour (Q4 and Q5)
Table 6 – Q2. Age Group and Healthy Eating Behaviour (Q4 and Q5)
Q2. Age Group
Total Number of Respondents
Q4. "I follow a healthy and balanced diet most of the time" and Q5. "It is important that the food I eat keep me healthy" - number of respondents
Q4. "I follow a healthy and balanced diet most of the time" and Q5. "It is important that the food I eat keep me healthy" - (%)
18–35 years 31 7 26%
36–50 years 28 13 46%
51–64 years 49 25 51%
65+ years 2 - -
Total 110
So, in this particular analysis is possible to affirm that concerns about eating healthy rises for
respondents in the “older” age groups.
The group age of 65 years old or over were not considered for this analysis since only two
participants were in this group.

42
4.2.2.4 Fast Food: Healthy versus Traditional
In this section, the analysis focus on investigating consumers’ food choice regarding healthy
and traditional fast food options when eating outside home. In order to examine the
respondents’ behaviour with more depth, the same variables presented previously in this
chapter will be used, such as Income (Question 3) and Healthy Eating Habits (Question 4
and Question 5).
The Graph 9, (Question 6), can give an insight of consumers’ perception of fast food
restaurants and the offer of a healthy food. When asked “Do you think fast food restaurants
sell healthy food?” the majority of respondents, 69% (35 women and 47 men, in total 72
people), answered that “Some” of them sell healthy food. Twenty seven percent (14 women
and 15 men, in total 29 people) think that “None” of fast food restaurants sell healthy food.
Graph 9 – Q6. Do you think Fast Food restaurants sell healthy food?
The Question 7, “Can you name a healthy fast food restaurant ?” was made in order to see
the ones Irish consumers were familiar with. In total 58 respondents (29 women and 29 men)
answered “Yes”, which as 56% of respondents. Freshly Chopped (also cited as Chopped)
was the company with most citation (63%). Of those 39 respondents 60% were women.
Subway was cited by 6 respondents (1 woman and 5 men), Freshii was cited by 4
respondents (3 women and 1 men). McDonald’s was cited by 4 respondents (all men). In
total 11 companies were cited, as presented in Table 7.
1% 2%
28%
69%
Q6. Do you think Fast Food restaurants sell healthy food?
All
Many
None
Some

43
Table 7 – Q7. Fast Food Restaurants that sell healthy food according to respondents
Table 7 – Q7. Can you name a healthy fast food restaurant?
Fast Food Restaurants Number of citation
Bagel Factory 1
Camile 1
Chopped 39
Freshii 4
Kanoodle 3
McDonald's 4
Nando’s 1
Pasta Bella 1
Sprouts & Co 1
Subway 6
Tolteca 1
Looking into the respondents who cited Chopped, 23 women and 16 men, and taking in
consideration the number of respondents in each age group, it is possible to see that women
age between 51-64 years old and age between 36-50 years old were the age groups that
most cited Chopped, as a fast food restaurant that sells healthy food. See Table 8.
Table 8 – Respondents who cited Freshly Chopped as a fast food restaurant that sells
healthy food
Respondents who cited Freshly Chopped as a fast food restaurant that sells healthy food
Q2. Age Group Women Men
18–35 years 28% 39%
36–50 years 50% 40%
51–64 years 52% 15%
The next two questions is related to the frequency respondents visit healthy fast food
restaurant (Question 8) and traditional fast food restaurants (Question 9). As shown in Table
9, 45% of respondents (22 women and 25 men, in total 47 people) “Rarely” go to a healthy
fast food restaurant, 17% of respondents (12 women and 6 men, in total 18 people)
answered “Once a month”. A representative number of people (30%) of respondents (14
women and 17 men, in total 31 people) answered “Not applicable”, that one can be
interpreted as “I do not have any favourite healthy fast food restaurant” or “I do not go to
healthy fast food restaurants”.

44
Table 9 – Q8. How often do you go to your healthy fast food restaurant? If you have any
favourite.
Table 9. How often do you go to your healthy fast food restaurant? If you have any favourite.
Row Labels Women Men Total
Every week 0 2 2
Every 2 weeks 2 4 6
Once a month 12 6 18
Rarely 22 25 47
Not applicable 14 17 31
Total 50 54 104
When analysing the frequency respondents visit a traditional fast food restaurant there is
different scenario since there was an increase of visit frequency. As can be seen in Graph
10, the higher increase was among respondents who go “Every week”, from 2 respondents
(healthy fast food restaurant) to 17 respondents (traditional fast food restaurant). For those
who answered “Every 2 weeks” the number of respondents was doubled. Among
respondents who go “Once a month” there was an increase of 11%. Finally, for those who
answered “Rarely” the increase was of 15%.
Graph 10 – Q8. How often do you go to your Healthy Fast Food restaurant versus Q9. How
often do you to a Fast Food restaurant (traditional)
The next analysis investigate for any correlation between income and the frequency people
visit healthy fast food restaurant and fast food restaurants (traditional). Because 45%
26
18
47
1713
20
54
0
15
30
45
60
Every week Every 2 weeks Once a month Rarely
Q8./Q9. How often do you go to…
Your healthy fast food restaurant Fast food restaurant
45
respondents (47 people), answered that “Rarely” go to a healthy fast food restaurant, this
was the group chosen for a better analysis. Of this group, 30% of respondents have income
of €50,000 or more. Same pattern happened for traditional fast food restaurants, which 54%
of respondents answered that “Rarely” go to this type of restaurant. As observed in Table 10,
of this group, 33% also have income of €50,000 or more. See Table 10
Table 10 – Q3. Annual Personal Income and visit to healthy fast food restaurant (Q8) and
traditional fast food restaurant (Q9)
Table 10 Respondents who rarely go to…
Annual Personal Income Your healthy fast food restaurant
Fast food restaurant
Less than €20,000 21% 19%
€20,000 to €29,999 26% 24%
€30,000 to €49,999 23% 24%
€50,000 or more 30% 33%
When crossing Question 4. “I follow a healthy and balanced diet” and Question 8. “How often
do you go to your healthy fast food restaurant? If you have any favourite”, is possible to see
that of 61 respondents who “follow a healthy and balanced diet most of the time”, 46% (17
women and 11 men, in total 28 people), “rarely” go to a healthy fast food restaurant, and
20% (7 women and 5 men, in total 12 people), go “once a month”. Thirty one percent (9
women and 10 men, in total 19 people), do not go to a healthy fast food restaurant (not
applicable). See Table 11. These findings suggest that there is a market opportunity for the
healthy fast food industry.
Table 11 – Q4. Frequency of respondent follow a healthy and balanced diet versus Q8.
Frequency of respondents go to a healthy fast food restaurant
Table 11 Q8. Frequency of respondents who go to a healthy fast food
restaurant
Q4. Frequency of respondent who follow a healthy
and balanced diet
Every 2 weeks Every week
Not applicable
Once a month
Rarely
Always 0 0 2 2 2
Most of the time 1 1 19 12 28
Sometimes 5 1 7 3 10
Rarely 0 0 3 0 7
Never 0 0 0 1 0

46
The same analysis was done considering visit to traditional fast food restaurant (Table 12)
By crossing Question 4. “I follow a healthy and balanced diet” and Question 9. “How often do
you go to a fast food restaurant?”. As seen in Table 12, of 61 respondents who “follow a
healthy and balanced diet most of the time”, 66% of respondents (25 women and 15 men, in
total 40 people) “rarely go to a fast food restaurant”, and 23% of respondents (7 women and
7 men) go “once a month”. Therefore, it is possible to say that women eating behaviour falls
more into a healthy diet compared to men.
Table 12 – Q4. Frequency of respondent follow a healthy and balanced diet versus Q9.
Frequency of respondents go to a traditional fast food restaurant
Table 12 Q9 - Frequency of respondents go to a traditional fast
food restaurant
Q4 - Frequency of respondent follow a healthy and balanced
diet Every 2 weeks
Every week
Once a month
Rarely
Always 1 1 0 4
Most of the time 4 3 14 40
Sometimes 1 0 0 0
Rarely 2 5 1 2
Never 5 8 5 8
Total 13 17 20 54
By comparing the two tables, findings show that respondents who follow a healthy and
balanced diet, go with more frequency to healthy fast food restaurants than the traditional
fast food options. Finally, by crossing Questions 4, 8 and 9 data show that those
respondents who “follow a healthy and balanced diet most of the time”, 34% of them (13
women and 8 men, in total 21 people), “rarely” go to either fast food restaurants.
4.2.2.5 Fast Food: factors that can influence consumers’ food choice when eating out.
After analysing the frequency of visit to fast food restaurants the next two analysis offers a
picture of some factors that can influence consumers’ fast food choice. Respondents were
asked to choose among 5 factors (convenience, health, location, price or taste) which one
was the most important when considering eating out (Question 10). They also had a
possibility to give a different reason. As seen on Graph 11, “Taste” was the factor that most
respondents, 43 people in total (20 women and 23 men) said they would be influenced by it,
which represented 41% of respondents.

47
Graph 11 – Q10. Regarding your food choice when eating out, which factor listed below is
the most important?
Among those who gave an “Other” answer, most were women, and age between 51-64
years old. Some illustrative quotes follow:
“It varies, depending on the people I am eating out with (2 people)”. (Female, 51-64
years old
“Type of food served, for example non-standard Irish/English food”. (Male, 51-64 years
old).
“Value for money (quality of food and service for the price charged)”. (Male, 51-64
years old)
“Vegan options”. (Female, 18-35 years old)
“Value for money”. (Female, 51-64 years old)
Looking in detail at the respondents, there was no significant difference between women and
men, as can be seen in Table 13.
41%
17%
13%
12%
6%
11%
Q10. Regarding your food choice when eating out, which factor listed below is the most important?
Taste
Convenience
Price
Health
Location
Other

48
Table 13 – Q10. Regarding your food choice when eating out, which factor listed below is
the most important? and Gender (Q1)
Q10. Regarding your food choice when eating out which factor listed below is the most important?
Women Men Total
Taste 20 23 43
Convenience 7 11 18
Price 8 6 14
Health 5 7 12
Location 3 3 6
Other 7 4 11
Total 50 54 104
When analysing the correlation between those factors and income, data show that “Taste”
was the most important factor for respondents with annual personal income between
€30,000 and €49,999 (37%). Table 14 show in detail the number of respondents for each
income group and corresponding factors. Another finding is that “Taste” appeal more to
respondents with higher income.
Table 14 – Q10. Regarding your food choice when eating out, which factor listed below is
the most important? and Income (Q3)
Q3. Annual Personal Income
Convenience Health Location Other Price Taste Total
Less than €20,000 4 2 3 1 3 6 19
€20,000 to €29,999 3 5 0 1 4 8 21
€30,000 to €49,999 6 3 1 3 4 16 33
€50,000 or more 5 2 2 6 3 13 31
Total 18 12 6 11 14 43 104
To a better analysis Questions 4, 5 and 10 were crossed. Considering respondents who
“follow a healthy and balanced diet most of the time" (Q4) and "It is important that the food
they eat keep them healthy" (Q5) there were 46 respondents (44% of total) from this group
the analysis show that Taste was also the most important factor when considering eating
out. See Graph 12.

49
Graph 12 – "I follow a healthy and balanced diet most of the time"(Q4) and "It is important
that the food I eat keep me healthy" (Q5) and most important factor when considering eating
out (Q10).
In order to get more data about the influence of money has on consumers’ food choice, in
Question 11 respondents were given the following statement: “I think that eating healthy food
is more expensive”, once they had to specify their level of agreement or disagreement. See
Graph 13.
Graph 13 – Q11. "I think that eating healthy food is more expensive."
46%
17%
13%
11%
9%4%
"I follow a healthy and balanced diet most of the time"(Q4) and "It is important that the food I eat keep me healthy" (Q5) and most important factor when considering eating out (Q10)
Taste
Other
Price
Convenience
Health
Location
24%
48%
18%
4%6%
Q11. "I think that eating healthy food is more expensive."
Agree
Somewhat agree
Neither agree or disagree
Somewhat disagree
Disagree

50
As seen in Graph 13, 48% of respondents “Somewhat agree” that “Eating healthy food is
more expensive (23 women and 27 men, in total 50 people). By adding the 24% of
respondents who “Agree” with this statement (13 women and 12 men, total of 25 people),
the total percentage of agreement increases to 72% of respondents (36 women and 39 men,
total of 75 people). When looking for any gender bias, the Graph 14, shows that there was
no significant difference in relation to gender.
Graph 14 – Q11. "I think that eating healthy food is more expensive." and Gender (Q1)
Another analysis to investigate the influence of income on food choice was relating the
respondents believes about healthy fast food being more expensive and their personal
income. The analysis across all income groups is presented in Table 15.
Table 15 – Q11. "I think that eating healthy food is more expensive." and Income (Q3)
Q11. "I think that eating healthy food is more expensive
Less than €20,000
€20,000 to €29,999
€30,000 to €49,999
€50,000 or more
Total
Agree 6 9 8 2 25
Somewhat agree 8 9 13 20 50
Neither agree or disagree 4 2 9 4 19
Somewhat disagree 0 1 1 2 4
Disagree 1 0 2 3 6
Total 19 21 33 31 104
Data show that in general respondents with higher income is biased towards an agreement
that healthy food is more expensive, in special those respondents with income of €50,000 or
more, who “Somewhat agree” with that statement.
13
23
9
3 2
12
27
10
14
0
10
20
30
Agree Somewhat agree Neither agree ordisagree
Somewhatdisagree
Disagree
Q11. "I think that eating healthy food is more expensive." and Gender (Q1)
Female Male

51
4.2.3 Fast Food Advertising
This last section of the findings has its focus on influence of advertising on consumers’ food
choice, in special the healthy fast food advertising. Of 110 respondents 103 of them (49
women and 54 men), have completed this section (94% of completion rate).
The first of the three questions was done to get an insight of consumers first thought about
advertising of healthy food. They were asked if they think advertising of healthy food is
aimed to men, women or both, (Question 12). As seen on Graph 15, 71% of respondents (35
women and 38 men, total of 73 people), believe that advertising of healthy food is aimed at
both gender. Followed by 27% (13 women and 15 men) who believed is aimed at women.
Only 2% of respondents (1 woman and 1 man) think that advertising of healthy food is aimed
only at men.
Graph 15 – Q12. "Do you think advertising of healthy food is aimed at?"
When analysing how women and men think about the adverting of fast food, there was no
significant difference between both gender, as seen on Graph 16.
71%
2%
27%
Q12. "Do you think advertising of healthy food is aimed at?"
Both
Men
Women
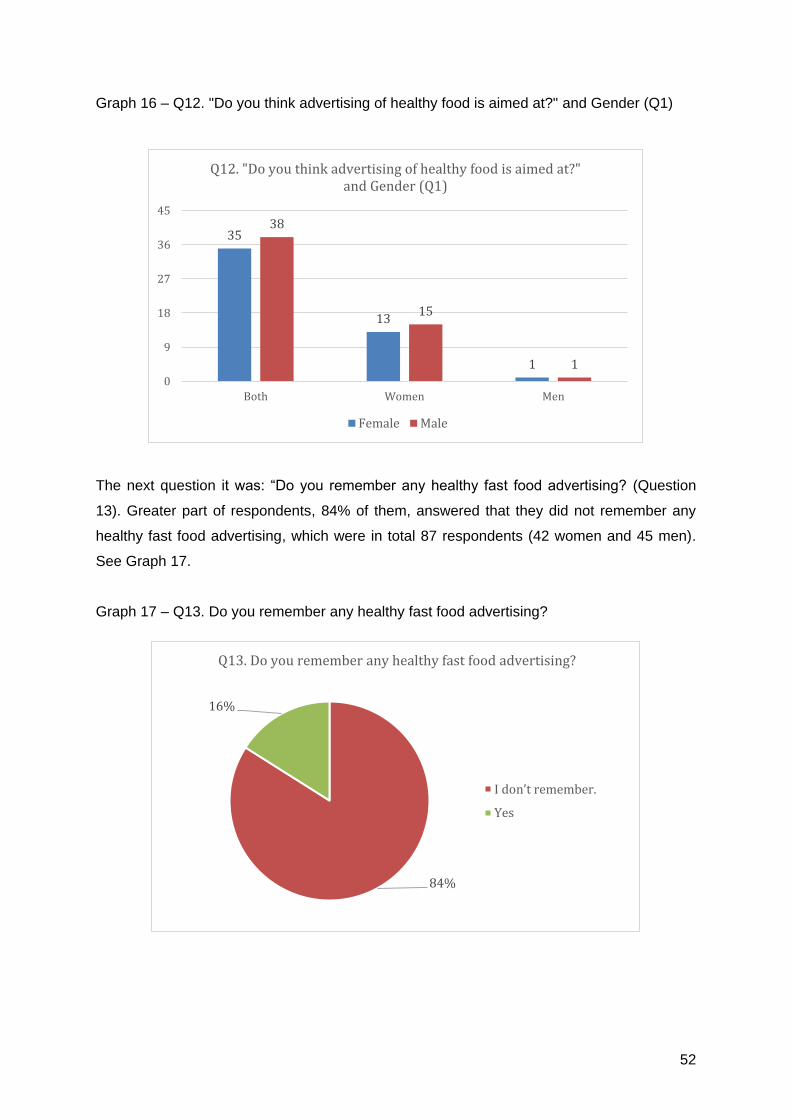
52
Graph 16 – Q12. "Do you think advertising of healthy food is aimed at?" and Gender (Q1)
The next question it was: “Do you remember any healthy fast food advertising? (Question
13). Greater part of respondents, 84% of them, answered that they did not remember any
healthy fast food advertising, which were in total 87 respondents (42 women and 45 men).
See Graph 17.
Graph 17 – Q13. Do you remember any healthy fast food advertising?
35
13
1
38
15
10
9
18
27
36
45
Both Women Men
Q12. "Do you think advertising of healthy food is aimed at?" and Gender (Q1)
Female Male
84%
16%
Q13. Do you remember any healthy fast food advertising?
I don’t remember.
Yes
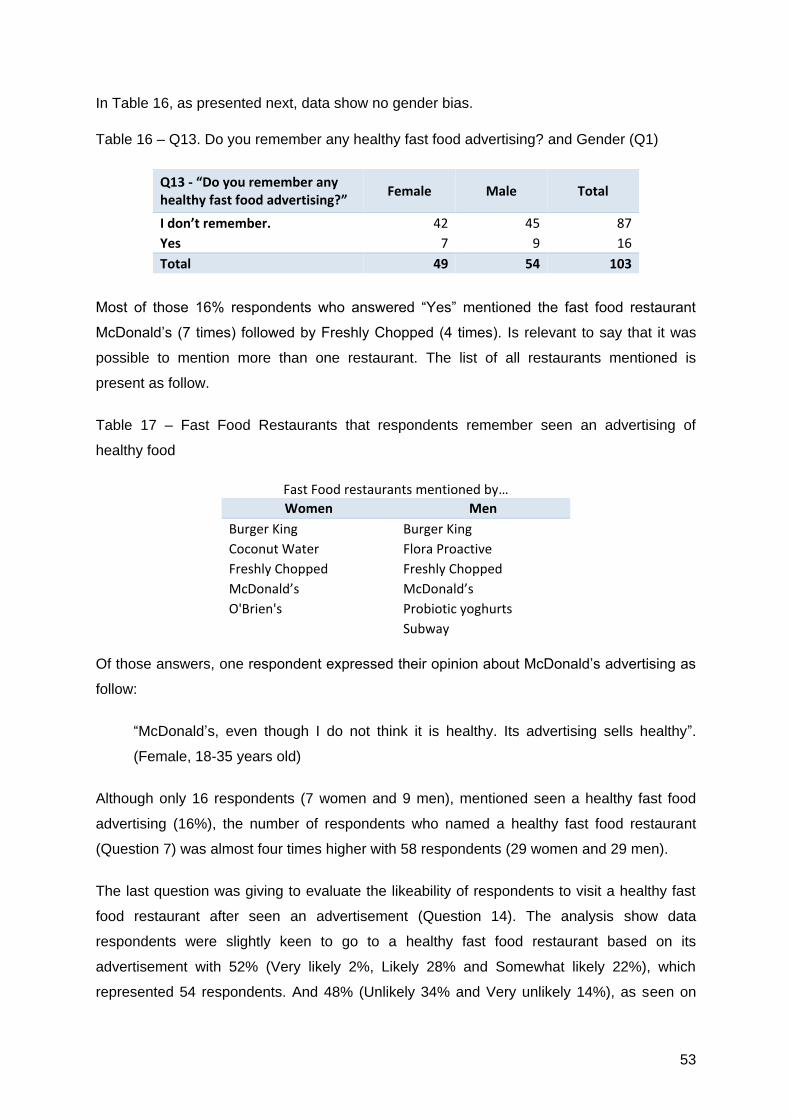
53
In Table 16, as presented next, data show no gender bias.
Table 16 – Q13. Do you remember any healthy fast food advertising? and Gender (Q1)
Q13 - “Do you remember any healthy fast food advertising?”
Female Male Total
I don’t remember. 42 45 87
Yes 7 9 16
Total 49 54 103
Most of those 16% respondents who answered “Yes” mentioned the fast food restaurant
McDonald’s (7 times) followed by Freshly Chopped (4 times). Is relevant to say that it was
possible to mention more than one restaurant. The list of all restaurants mentioned is
present as follow.
Table 17 – Fast Food Restaurants that respondents remember seen an advertising of
healthy food
Fast Food restaurants mentioned by…
Women Men
Burger King Burger King
Coconut Water Flora Proactive
Freshly Chopped Freshly Chopped
McDonald’s McDonald’s
O'Brien's Probiotic yoghurts
Subway
Of those answers, one respondent expressed their opinion about McDonald’s advertising as
follow:
“McDonald’s, even though I do not think it is healthy. Its advertising sells healthy”.
(Female, 18-35 years old)
Although only 16 respondents (7 women and 9 men), mentioned seen a healthy fast food
advertising (16%), the number of respondents who named a healthy fast food restaurant
(Question 7) was almost four times higher with 58 respondents (29 women and 29 men).
The last question was giving to evaluate the likeability of respondents to visit a healthy fast
food restaurant after seen an advertisement (Question 14). The analysis show data
respondents were slightly keen to go to a healthy fast food restaurant based on its
advertisement with 52% (Very likely 2%, Likely 28% and Somewhat likely 22%), which
represented 54 respondents. And 48% (Unlikely 34% and Very unlikely 14%), as seen on
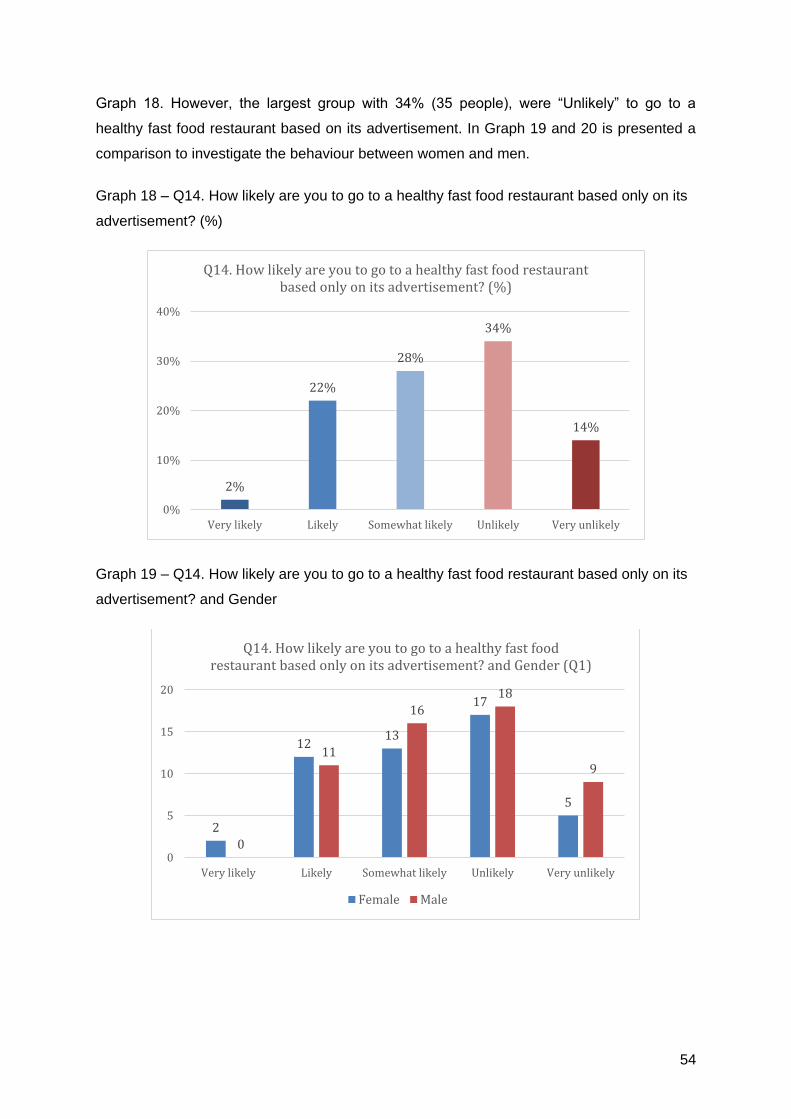
54
Graph 18. However, the largest group with 34% (35 people), were “Unlikely” to go to a
healthy fast food restaurant based on its advertisement. In Graph 19 and 20 is presented a
comparison to investigate the behaviour between women and men.
Graph 18 – Q14. How likely are you to go to a healthy fast food restaurant based only on its
advertisement? (%)
Graph 19 – Q14. How likely are you to go to a healthy fast food restaurant based only on its
advertisement? and Gender
2%
22%
28%
34%
14%
0%
10%
20%
30%
40%
Very likely Likely Somewhat likely Unlikely Very unlikely
Q14. How likely are you to go to a healthy fast food restaurant based only on its advertisement? (%)
2
1213
17
5
0
11
16
18
9
0
5
10
15
20
Very likely Likely Somewhat likely Unlikely Very unlikely
Q14. How likely are you to go to a healthy fast food restaurant based only on its advertisement? and Gender (Q1)
Female Male

55
When analysing respondents’ attitude regarding their gender, data show that female
respondents were more likely (Very likely / Likely / Somewhat likely) to go to a healthy fast
food restaurant based only on its advertisement, compared to men.
Graph 20 – Q14. How likely are you to go to a healthy fast food restaurant based only on its
advertisement? and Gender (Q1)
As mentioned before, income can influence consumers’ food choice when considering going
out. Because of that, another analysis was done to see for any correlation between
advertising of healthy food and income.
Data show that respondents with income between of less than €20,000 and income between
€30,000 and €49,000 were more likely (Very likely / Likely / Somewhat likely) to go to a
healthy fast food restaurant based only on its advertisement, which was 63% and 64% of
respondents in this income group). On the other side, respondents less influenced by
advertisement (Unlikely / Very Unlikely) have income of €50,000 or more, which correspond
to a 67% of respondents in this income group, (9 women, 11 men). The Table 18 present
respondents’ overall likeability.
55%
50%
45%
50%
0%
20%
40%
60%
Female Male
Q14. How likely are you to go to a healthy fast food restaurant based only on its advertisement? and Gender
More likely
More unlikely

56
Table 18 – Q14. How likely are you to go to a healthy fast food restaurant based only on its
advertisement? and Income (Q3)
Q14. How likely are you to go to a healthy fast food restaurant based only on its advertisement? and Income (Q3)
Likeability Less than €20,000
€20,000 to €29,999
€30,000 to €49,999
€50,000 or more
Total
Very likely 2 0 0 0 2
Likely 5 4 12 2 23
Somewhat likely 5 7 9 8 29
Unlikely 5 9 8 13 35
Very unlikely 2 1 4 7 14
Total 19 21 33 30 103
The next analysis investigate respondents’ behaviour when regarding going to a healthy fast
food restaurant and the influence of advertisement. For this analysis the three higher
frequencies were taken into consideration, those were respondents who go “Once a month”
(17%), “Rarely” (45%) and “Not applicable” (30%), which means respondents who “Do not
have a favourite healthy fast food restaurant” or “Do not eat at healthy fast food restaurants”.
As seen in Graph 21, as follow, respondents who go to their favourite healthy fast food
restaurant once a month are more likely (Very likely / Likely / Somewhat likely) to go to the
same kind of restaurant based on its advertisement, which was 67% of respondents. There
were 12 respondents with a positive response to advisement and 8 respondents
demonstrating not influenced by advertisement.
Graph 21 – Respondents who go to their favourite healthy fast food restaurant once a month
and their likeability to go to a healthy fast food restaurant based on its advertisement
1
4
7
4
2
0
2
4
6
8
Very likely Likely Somewhat likely Unlikely Very unlikely
Respondents who go to their favourite healthy fast food restaurant once a month and their likeability to go to a healthy fast food restaurant based on its advertisement

57
The next analysis investigate respondents who rarely go to their favourite healthy fast food
restaurant and the likeability to be influenced by advertisement. In total were 47
respondents, one of them did not answer this question (blank). As observed in Graph 22, 15
respondents were “Unlikely” and 5 respondents were “Very unlikely” to go to a healthy fast
food restaurant based on its advertisement. Together, it correspond to 55% of respondents
who had a negative positive response to healthy fast food advertisement. The other 45% of
respondent had a positive response to advertisement (Very likely / Likely / Somewhat likely).
With 26 respondents in total, 58% of them were men.
Graph 22 – Respondents who rarely go to their favourite healthy fast food restaurant and
their likeability to go to the same kind of restaurant based on its advertisement
In Graph 23, is possible to see how respondents who do not have a favourite healthy fast
food restaurant behave in relation to exposure to advertisement. Different than the previous
two groups, those respondents had a negative response to advertising. More than 60% of
them were unlikely (Unlikely / Very unlikely) to go to a healthy fast food restaurant based on
its advertisement.
0
9
1715
5
1
0
5
10
15
20
Very likely Likely Somewhatlikely
Unlikely Very unlikely (Blank)
Respondents who rarely go to their favourite healthy fast food restaurant and their likeability to go to the same kind
of restaurant based on its advertisement

58
Graph 23 – Respondents who do not have a favourite healthy fast food restaurant and their
likeability to go to the same kind of restaurant based on its advertisement
4.2.4 Summary of Findings
As final considerations of this chapter, the findings described in each of the 3 sections can
offered relevant data, from what will be crossed and discussed with secondary data (Chapter
2). The overall completion for the research was 94%, since 7 respondents have not
completed the 14 questions. However, the percentage of respondents who did not complete
will not affect the results.
As seen in a number of single and correlated analysis, in general respondents were keen to
a healthy option of food and by consequence, healthy fast food. Other analysis show that
gender, age and income does influence how respondents behave when it comes to fast food
choice, and to some extent, as well advertisement. These and other relevant findings will be
discussed in depth in the next chapter.
1
8
3
12
7
0
5
10
15
Very likely Likely Somewhat likely Unlikely Very unlikely
Respondents who do not have a favourite healthy fast food restaurant and their likeability to go to the same kind of
restaurant based on its advertisement
59
5. Discussion
In this chapter the findings of the survey will be discussed with different research from
literature review and the thoughts of some experts involved in the food industry. The
objective is to examine for any agreements or disagreements comparing to previous studies,
also the possibility of bringing new knowledge. The overall aim of this research was to
investigate the influence of advertising on consumer’s fast food choice, and answer the
research question: “Is Irish adults’ food choice influenced by advertising of fast food?”
(Chapter 1). The specific research objectives were:
1. Better understand consumer behaviour and the motivation behind healthy eating.
2. Assist fast food restaurants, specially healthy fast food business enhance their
advertising.
3. Discuss how healthy food and food safety legislation can affect the present fast food
business.
4. Propose marketing strategies that deal with the negative aspects of the unhealthy
connotations of fast food.
This section is divided in 4 sub-sections, each one corresponding to the four research
objectives. At the end will be presented a summary of what was discussed in light of the
literature review. The previous chapter – Survey Findings: Description, Analysis and
Synthesis – was an extensive work and for this reason needed to be summarised. Final
conclusions and recommendations for future research will be discussed in Chapter 6 and
Chapter 7.
5.1 Consumer behaviour and the motivation behind healthy
eating
Literature has identified a number of elements that can influence consumer food-related
behaviour. Some of them are flavour, aroma and appearance, and others with more strength
such as Culture, Advertising, Health and Time (King, 2018). Gender, Weight and Food
Habits also are described as influencers (Mills et al. 2013). Marketing elements as Social
Media, Word-of-Mouth, Television and Celebrity Endorsement are likewise seen as
responsible for influence consumers’ food choice (Tuder, 2016).

60
This research approached some of the elements listed in previously and others, for instance,
Healthy Habits, Gender, Age, Income, Price, Taste and Advertising, the main focus of this
research
The literature identified that individuals with motivation to eat healthy are more likely to make
healthier food choices (Naughton et al. 2015). The survey findings give evidences falling in
the same direction. As presented in Graph 3 (Section 4.2.21), 72% of respondents who said
that follow a healthy and balanced diet most of the time and believe that is important that the
food they eat keep them healthy were the group that go to fast food restaurant with less
frequency.
Findings from a research by Crofton et al. (2013) revealed that Irish consumers expect a
healthy snack to contain low levels of calories, fat, salt and sugar. Similar interpretation can
be done for fast food, where Irish consumers are demanding healthier options of food.
5.1.1 Gender
Another analysis was done to verify for any correlation between healthy eating habits and
gender. Previous studies has shown that women are more likely to comply with dietary
guidelines (Bogue et al., 2005 cited in Crofton et al. 2013, p. 1131) and they are more likely
than men to be positively motivated towards eating a healthy diet (Naughton et al. 2015).
The findings of this research also confirm that women are more likely to adhere to a healthy
eating habit, as summarised in Section 4.2.2.1. The Graph 6 (Section 4.2.2.1) show that
among respondents who follow a healthier dietary profile, 67% were women.
5.1.2 Age
When comes to Age, the literature show that older consumers have shown to be more diet
conscious and more likely to make healthier snack choices when comparing with younger
adults (Irish Universities Nutrition Alliance, 2001; Wansink et al. 2003 cited in Crofton et al.
2013, p. 1131). A study by Naughton et al. (2015) revealed that healthy eating motivation
becomes stronger with increasing age. The results of this research also go in the same
direction, as can be seen in Table 6, Section 4.2.2.3. So, when looking at respondents who
follow a healthy and balanced diet most of the time and believe food plays an important role
on their health, most of respondents were between 51 and 64 years old.

61
5.1.3 Income versus Social Class
Added to the factors that can influence food choice there are Income and Social Class.
Naughton et al. (2015), did not found a significant relation between social class healthy
eating in contrast to previous studies. Because of the small size of its sample, this research
did not approach Social Class, but investigated the influence of Income. The results
presented in section 4.2.2.2 shown that respondents with higher income were keener to a
healthy diet (Graph 7 and 8)
From other analysis about income and food choice, results shown that most of respondents
who rarely go to fast food restaurants (traditional), have income of €50,000 or more (30%).
Another relevant finding is that as income gets higher, also increases the number
respondents with concerns about the food they eat. (Table 10, Section 4.2.2.4). So from an
overall analysis, findings suggest that income does influence food choice.
5.1.4 Price
Another factor that can effect consumer’s food choice is Price, which is closely related to
Income. Healthy snacks are strongly associated with a higher price (Crofton, et al. 2013).
When compared to eating healthy food, also there was a high assumption that healthy food
is more expensive, as can be seen in Graph 12. This belief was stronger among
respondents with higher income, especially those with income of €50,000 or more (Table
15). Results did not show any significant difference between genders, as seen in Graph 13.
Frances Adgey, Marketing Manager for Subway Ireland, also believe that price influences
consumer’s food choice, and mentioned a number of other factors, such as, trend, value and
taste, which is the next influencer studied.
5.1.5 Taste
Literature shows that Taste appeared to be decisive when choosing a snack (Crofton et al.
2013). As can be seen in Table 13, Section 4.2.2.5, the results of this survey show that
Taste appealed as most important factor for most of respondents (41%), especially those
with higher income (Table 14, Section 4.2.2.5). Same as price, data show no significant
difference between women and men.
An interesting result was observed when considering respondents who declared that follow a
healthy and balanced diet most of the time as well consider food was an important element

62
to keep them healthy. At first thought, Health would be the most relevant factor when
considering eating out, yet, Taste was the highest important with 46%. Health only held the
fourth place (not considering respondents who gave Other factor), with 9%, as can be seen
in Graph 12, Section 4.2.2.5.
5.1.6 Fast food: Healthy versus Traditional
Another set of analysis investigate consumer behaviour towards healthy fast food versus
traditional fast food. No literature regarding the same analysis was found. Possibly because
healthy fast food can be considered a new market comparing to traditional fast food.
There is general and wide perception that fast food is not healthy. Thus, in order to
understand consumer’s view of the healthful of fast food, respondents were asked if fast
food restaurant sell healthy food. The results were not surprising, as shown in Graph 9,
(Section 4.2.2.4), the majority of respondents (69%), do think only some of fast food
restaurants sell healthy food. Other 24% of respondents believe that none of them provides
healthy food. So is possible to imply that a conception that fast food is not healthy is
sustained.
The analysis about the frequency respondents go to healthy and traditional fast food show
that traditional still the favourite kind of food. However the number of respondents who rarely
go to either restaurants is higher for traditional fast food (Graph 8, Section 4.2.2.4). Which
can be explained by a more health consciousness of Irish consumers.
Regarding consumers who go to a fast food restaurant every week, McDonald’s consider
those consumers as ‘heavy users’ (“Supersize me!” 2004). The survey revealed that 16% of
respondents are ‘heavy users’. Even though most of consumers presented a healthy eating
habit, only 2% of respondents go to a healthy fast food restaurant every week. As declared
by Frances Adgey, Marketing Manager for Subway Ireland, “Consumers want choice both
healthy and indulgent”. Here is important to consider that Ireland has the fourth highest
prevalence of overweight and obesity in men and the seventh highest prevalence among
women in the EU (Irish Department of Health, 2017). At this rate is difficult not to see the
Irish Department of Health raising the reg flag concerning about unhealthy eating.
Because this study was carried out in Ireland, respondents were asked to name a healthy
fast food restaurant in the Irish market. A positive result is that most of respondents could
indicate at least one company. As mentioned in Section 4.2.2.4, Freshly Chopped was cited

63
by most of respondents (63%), of that group, 60% were women. As a matter of context,
Freshly Chopped is an Irish company found in 2012 by Brian Lee and Andy Chen. Also
known as Chopped, the brand stands for health and fresh fast food. Today there are more
than 50 outlets across Ireland and Cyprus (Freshly Chopped, 2018).
5.2 Consumers response to fast food advertisement –
enhancing advertising of fast food business.
5.2.1 The influence of Advertisement
In this section, will be discussed the findings about consumer’s food choice and the influence
of fast food and healthy fast food advertisement. The main objective is to assist fast food
restaurants, specially healthy fast food business enhance their advertising. Investigate the
influence of advertising on consumer’s food choice is quite a challenge. And the literature is
not conclusive. No literature regarding the influence of healthy fast food advertising was
found, therefore, the secondary research covered the literature of traditional fast food
advertising.
Some researches argue that the insufficient number of studies does not support evidence
that food advertising increases food consumption in adults (Boyland et al. 2016). Or, if food
advertising affects adults’ food-related behaviour (Mills et al. 2013).
On the other side, distinct studies suggest the opposite. Some researches provide evidence
to suggest that cumulative exposure to television food advertising is linked to adults’ fast-
food consumption (Scully et al. 2008; Kemps et al. 2014;). Results from a number of articles
show evidence that price promotions and retail displays increase food expending of high
sugar foods (Boyland and Whalen 2016, p.7). Advertising not only increases market share,
as well expanding demand for fast food (Richards and Padilla, 2007, p. 25),
Although there is insufficient literature available to examine in contrast with the findings, yet,
is possible to draw some results and fill this gap in knowledge. By adding valuable
knowledge to the field of advertising and consumer food-related behaviour this research
positively contribute to the academy, the food industry and consumers.
This discussion start with an understanding of consumers’ opinion about advertising of
healthy food. Literature review that men believe that healthy snack alternatives available is
aimed at women (Crofton et al. 2013). Relevant to say that this survey offers a wider
analysis, (Section 4.2.3). Foremost, respondents were asked if advertising of healthy food is

64
aimed at men, women or both. Twenty seven percent of respondents think that fast food
advertising is aimed at women. Of this group 54% were men (Graph 16). So for this
particular view the results are in line to the literature. However with majority of respondents
(71%), thinking that advertising of healthy food is aimed at both gender, show evidence that
point in another direction. (Graph 15).
When considering that fast food companies spend billions on advertisement campaigns
(Boyland and Whalen 2016), is expected that such investment convert into consumers’
purchase. However an advertisement campaign is not effective if consumers cannot
remember seen an advertising, or even remember the name of the brand. The survey shows
what can be considered as an alarming result, only 16% of respondents mentioned that
remembered a healthy fast food advertising. As mentioned in the previous section, Chopped
was cited by 39 respondents as a fast food restaurant that sell healthy food. However only
10% did remember seen an advertisement from the company. Subway, which was cited 6
times, had its advertising remembered by one consumer. Even more surprisingly was seen
McDonald’s on the top of the list. Even though only 4 respondents mentioned McDonald’s as
a fast food restaurant that sell healthy food, 7 other respondents remembered seen
McDonalds’ advertising its food as healthy, in that case their range of salads.
In Section 4.2.3 were presented the investigation of the influence of advertisement on
consumer’s food choice when considering going out, and results show that consumers were
slightly keen to go to a healthy fast food restaurant based on its advertisement. A higher
likeability were found among women, which can be explained since they are more likely to
adhere to a healthy eating habit. When considering Income, results show that consumers
who earn of €50,000 or more (the highest income group in the survey) are the least
influenced by advertising.
Because the number of respondents who rarely go to a healthy fast food restaurant it can be
considered quite high (45%), the influence of advertisement on this group was also
investigated. The result show that respondents had a slightly positive response to fast food
advertisement. When asked about the increasing market for healthy fast food, Frances
Adgey (Subway Ireland), believe that the growing market is more due to advertising.
“However, like all purchase behaviours, there are also trends”. She emphasized.
However when comparing with respondents who do not have a favourite healthy fast food
restaurant there is different scenario. Those respondents had a negative response to
advertising. More than 60% of them were unlikely to be influenced by fast food
advertisement.
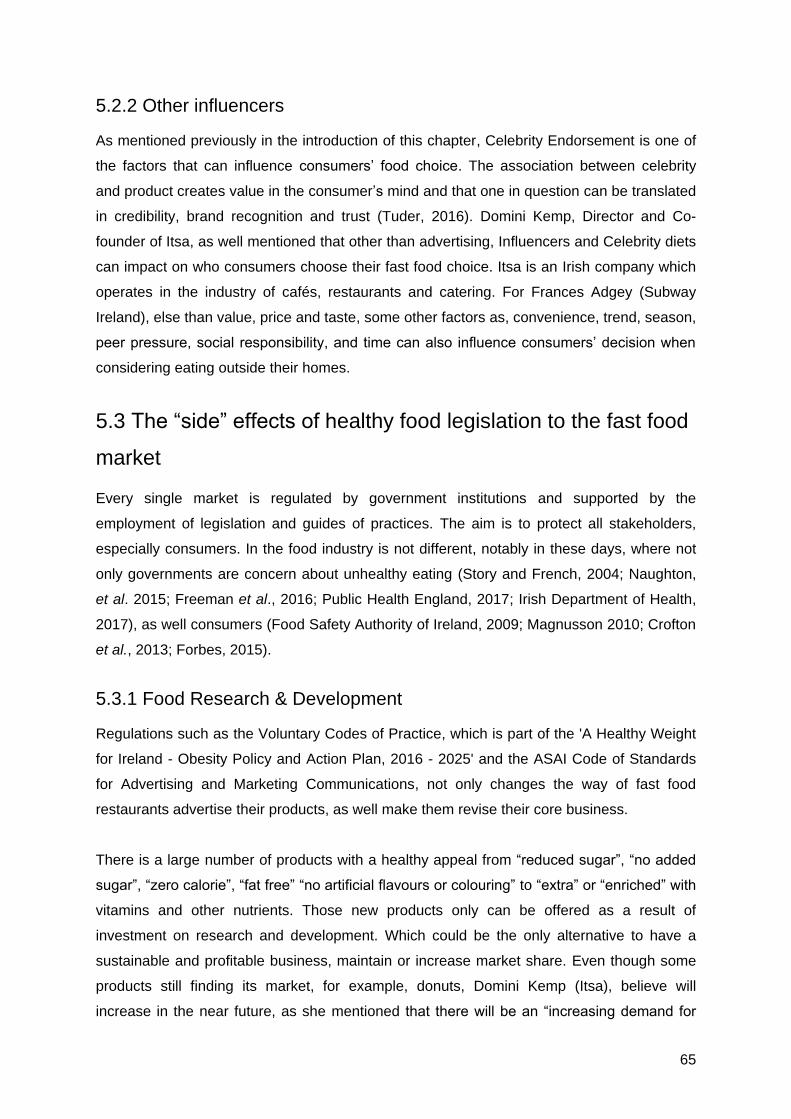
65
5.2.2 Other influencers
As mentioned previously in the introduction of this chapter, Celebrity Endorsement is one of
the factors that can influence consumers’ food choice. The association between celebrity
and product creates value in the consumer’s mind and that one in question can be translated
in credibility, brand recognition and trust (Tuder, 2016). Domini Kemp, Director and Co-
founder of Itsa, as well mentioned that other than advertising, Influencers and Celebrity diets
can impact on who consumers choose their fast food choice. Itsa is an Irish company which
operates in the industry of cafés, restaurants and catering. For Frances Adgey (Subway
Ireland), else than value, price and taste, some other factors as, convenience, trend, season,
peer pressure, social responsibility, and time can also influence consumers’ decision when
considering eating outside their homes.
5.3 The “side” effects of healthy food legislation to the fast food
market
Every single market is regulated by government institutions and supported by the
employment of legislation and guides of practices. The aim is to protect all stakeholders,
especially consumers. In the food industry is not different, notably in these days, where not
only governments are concern about unhealthy eating (Story and French, 2004; Naughton,
et al. 2015; Freeman et al., 2016; Public Health England, 2017; Irish Department of Health,
2017), as well consumers (Food Safety Authority of Ireland, 2009; Magnusson 2010; Crofton
et al., 2013; Forbes, 2015).
5.3.1 Food Research & Development
Regulations such as the Voluntary Codes of Practice, which is part of the 'A Healthy Weight
for Ireland - Obesity Policy and Action Plan, 2016 - 2025' and the ASAI Code of Standards
for Advertising and Marketing Communications, not only changes the way of fast food
restaurants advertise their products, as well make them revise their core business.
There is a large number of products with a healthy appeal from “reduced sugar”, “no added
sugar”, “zero calorie”, “fat free” “no artificial flavours or colouring” to “extra” or “enriched” with
vitamins and other nutrients. Those new products only can be offered as a result of
investment on research and development. Which could be the only alternative to have a
sustainable and profitable business, maintain or increase market share. Even though some
products still finding its market, for example, donuts, Domini Kemp (Itsa), believe will
increase in the near future, as she mentioned that there will be an “increasing demand for

66
extremes – e.g. donuts and “free-from” ranges”. However some of the companies will not
survive in a market which demand more and more healthy food, and by it means, healthy
fast food.
Food research also involve watching the market, looking for new trends. As declared by
Frances Adgey, Marketing Manager for Subway Ireland, “…like all purchase behaviours
there are also trends”. She also believes that a demand for healthy fast food and traditional
fast food “will continue to grow, with people’s taste developing they will demand more varied
ingredients and cultural alternatives as a fast food offering like the rise in Mexican and a
direction in more of a Street food offering”.
5.3.2 Sports Sponsorship
Another marketing activity that has been topic of discussion is fast food companies
sponsoring sports events. Some researches argue that there is a lack of legislation (Igumbor
et al. 2012; Herron, 2014; Boyland and Whalen, 2016). To tackle this issue, a multi-sectoral
group was established by Simon Harris, Minister of Health. This group has by mission to
develop a Code of Practice for sponsorships by the food industry (Irish Department of Health
2017).
The Code of Practice for Marketing Communications for HFSS Food on Non-Broadcast
Media, Out of Home Media, Print Media and Cinemas contain a series of rules. One of the
rules stated that “HFSS food sponsorship of sports pages or sports supplements is not
allowed” (Irish Department of Health 2017).
In Ireland, sports events play an important role nationwide, especially Gaelic Sports (GAA).
To have your brand attached to a local club or a county team, means that the company not
only creates brand awareness, also progress to next stages of consumer making decision:
as purchase and repurchase. In other others, sponsorship does stimulate consume.
However one of general rules for all Codes of Practice creates an immense wall between
fast food restaurants and consumer, and by all means, almost unbreakable: “Locations
primarily used by children shall be free from all forms of marketing communication for HFSS
foods. Examples of such settings include registered crèches, pre-schools, nurseries, family
and child clinics, paediatric services, schools, dedicated school transport, playgrounds and
youth centres (Irish Department of Health 2017). One alternative would be setting
partnership agreement with local council and assist adults sports centres, organizing
programs that encourage a healthy lifestyle and a healthy and balanced diet.

67
5.4 Proposed advertising guide: overcoming obstacles
The last theme to be discussed aim to propose marketing strategies that deal with the
negative aspects of the unhealthy connotations of fast food. As shown in the survey results,
the number of consumers who think that fast food restaurants do not sell healthy food was
more than 25% which is considerable high. Especially thinking that most of respondents
(65%) do follow a healthy and balanced diet.
Consumers of today are showing good judgment about false or misleading healthy claims. In
addition all marketing activity of HFSS food and drinks are monitored by the Department of
Health. As Domini Kemp (Itsa), defined “… Most large food companies market heavily
processed foods under veil of “health”. New evidence is disrupting the traditional beliefs that
fat is bad. Focus is now on sugar becoming the new tobacco. Social media cuts through
claims being made. Consumers becoming more savvy”. Because of that, any marketing
communication must be transparent in such way that consumers will not be deceived or
mislead.
Another strategy to reduce or eliminate the negative perception of fast food was suggested
by Frances Adgey (Subway Ireland). As she concerns about the various interpretation an
individual can make over a product, a “thorough testing of a consumer message before it
goes live can help”.
5.5 Summary of Discussion
Because the extent of what was discussed, this section summarizes the discussion around
the four research objectives, the research question, the literature review and the general
results.
The first objective was to better understand consumer behaviour and their motivation behind
healthy eating. Literature and survey findings, both show that consumers are more likely to
make healthier food choices. For them is relevant that the food they eat keep them healthy.
The findings also revealed that the consumer of today expects a healthy snack to contain
low levels of calories, fat, salt and sugar, and they are demanding healthier fast food options.
Other than advertising, the discussion also involved some particular influencers as, Gender,
Age, Income, Price, Taste and a comparison between food choice behaviour for healthy fast
food and traditional fast food with some interesting facts.

68
Literature from previous studies show that women are more likely to follow a healthy and
balanced diet. They are more motivated towards eating a healthy diet. Which has been
confirmed by this study. Regarding Age, literature and data from this survey, show evidence
of same behaviour: middle-age adults (36-50 years) and older adults (age older than 51
years) are more healthy conscious. The investigation about the influence of Income show
that respondents with higher income were keener to a healthy diet. This same group have a
high assumption that healthy food is more expensive.
Surprisingly was the finding that Taste appeal as most important factor for most of
respondents, especially the ones with higher income. As mentioned before, considering that
most people are following a healthy and balanced diet, assumes that Health would be the
first factor to consider when deciding for a fast food meal. Still, Healthy was placed far
behind in fourth place. Not surprisingly, was the fact that majority of respondents (69%),
believe that just some of fast food restaurants sell healthy food. And a good number of
respondents (24%) are convinced that none of the food sold by fast food restaurant can be
healthy. For that, the general concept that fast food is not healthy still inside consumer’s
mind.
The second research objective aim to assist fast food restaurants, specially healthy fast food
business enhance their advertising. The literature already showed evidence that marketing
activity and so advertising of traditional fast food has an impact on consumer’s food choice.
When it comes to advertising of healthy fast food the results show two distinct food-related
behaviour: Behaviour 1: respondents who rarely go to a healthy fast food restaurant
presented a slightly positive response to fast food advertisement. Behaviour 2: respondents
who do not have a favourite healthy fast food restaurant or do not go to this kind of
restaurant had a negative response to advertising. More than 60% of them were unlikely to
be influenced by fast food advertisement.
Because the group of respondents who rarely go to a healthy fast food restaurant
represented 45% of total sample, this group could be the chosen target audience for healthy
fast food restaurants. However this type of consumer would employ so much effort and
money expending that sound like an unsuccessful marketing strategy by starter.
This research also showed that old adults, especially women with income of €50,000 or
more is the consumer group with a more healthy conscious. Or a company can decide to
target the young generation, since could extend the life cycle of the product. No matter which

69
audience a healthy fast food restaurant aim to target, it is highly important to have a “picture”
of its consumer profile, and the best advertising channels to reach them.
Knowing from this survey findings that 27% of consumers think that adverting of healthy food
is aimed at women is another important data. If a company decided to target men, the
challenge for marketers to influence this group by advertising would be even higher.
Another finding is the consumer belief of healthy food being more expensive. To tackle this
issue healthy fast food restaurants should show to consumers the advantages of a healthy
eating habit and the relation between cost and benefit. Consumers are willing to pay more
for healthier options. (Forbes, 2015).
The third research objective proposed a discussion on how healthy food and food safety
legislation can affect the present fast food business. During the course of the research, only
healthy food legislation was approached seen that would make more sense considering the
focus of the study. Since there is a considerable number of restrictions for fast food
advertisement, one of the proposed alternatives is to invest in research and development for
healthier food and healthier options of fast food. This will not solve the problem, but at least
meet some of consumer expectations. Another problem faced by traditional fast food is the
restriction regarding sponsorships. Fast food companies still can advertise in locations
where children and young adults are not the primarily users. It would be very important that a
partnership between fast food restaurants and local councils include programs to encourage
a healthy lifestyle and a healthy and balanced diet.
The fourth research objective aims to propose marketing strategies that deal with the
negative aspects of the unhealthy connotations of fast food. As commented before, the
general concept that fast food is not healthy is still inside consumer’s mind. As a result of
that all marketing communication must be transparent in such way that consumers will not
be deceived or mislead. The use of Social Media can enhance their advertising channel mix,
which can be combined with Celebrity endorsement to increase the credibility of the
company’s message.
By understanding the behaviour and social media usage by your consumer target, enable
healthy fast food restaurant to maximize resources and minimize advertisement costs.
According to Google Consumer Barometer, Social Media is on the top activities on internet
(Digital Media), only behind of search engines. In addition is relevant to mention that 85% of
Irish people go online for personal internet usage every day. Another tool that can be used
70
by healthy fast food restaurant to improve their marketing activity is the Electronic Word-of-
Mouth (eWOW). The eWOW allow consumers and fast food restaurants to interact to each
other, by sharing of information and opinions. This interaction can happen via Social Media
such as Facebook, Instagram and Twitter or Online Consumer Reviews via websites or
apps. According to Hennig-Thurau, et al. (2004), the eWOW apply to positive or negative
statement made by consumers about a product, service or company. An Online Consumer
Reviews works as an informant and a recommender, and same as eWOW, involve positive
or negative statements made by consumers (Park et al. 2007). Both tactics are helpful
during the process of food choice decision.
71
6. Conclusion
The overall aim of this research was to investigate fast food advertising and health
consciousness in Ireland, in relation to the influence of adverting on consumers food choice.
The specific research question was: “Is Irish adults’ food choice influenced by advertising of
fast food?”. The research were within the context of food market to four objectives: 1 – Better
understand consumer behaviour and the motivation behind healthy eating; 2 – Assist fast
food restaurants, specially healthy fast food business enhance their advertising; 3 – Discuss
how healthy food and food safety legislation can affect the present fast food business; and 4
– Propose marketing strategies that deal with the negative aspects of the unhealthy
connotations of fast food. This chapter presents the main conclusions drawn from the
discussion based on the literature review, survey findings and interview.
The findings of this study confirmed that Irish consumers were more likely to follow a healthy
and balanced diet, and shown a positive and significant association between everyday food
and the importance to keep them healthy (p. 35-37). Findings also confirmed that this
healthy eating behaviour was higher among women (p. 37 and 38), who demonstrated to be
more likely to adhere to a healthy eating habit.
As illustrate on pages 40 and 41, a healthy eating habit was also associated with aging. As
observed, middle-age adults and older adults were more likely to choose healthy food
options, which was evidenced in distinct studies (p. 60). This behaviour can be explained as
people try to reduce the effects of aging by eating healthier.
A tendency for eating a healthy diet could be seen along respondents with higher income, as
our finding illustrate on page 39 and 40. In general, people had a strong assumption that
healthy food is more expensive (p. 49 and 50), especially respondents with higher income as
highlighted on page 50.
When considering eating out, Taste appealed as most important factor for most of
respondents, as the findings illustrates on pages 47-49. This behaviour was seen especially
among respondents with higher income (p. 48). Taste also appeared as decisive factor for
food choice in a different research, by Crofton et al. (2013), who examined consumers’
perceptions and expectations towards healthy snacks (p. 61).

72
This survey has shown that people were skeptical about fast food restaurants selling healthy
food as illustrated on page 42. Thus, is possible to assume that people still have the
conception that fast food is not healthy, which makes a challenge for healthy fast food
restaurants market their product as healthy. In spite of that, respondents who follow a
healthy and balanced diet, go with more frequency to healthy fast food restaurants than the
traditional fast food options, as explained on pages 45 and 46.
As focus of this research, findings showed that advertising of healthy fast food was not seen
as a strong factor over people’s food choice as illustrated on pages 53-58. And some people
believe that adverting of healthy food is aimed at women (p. 52).
Relating to food advertising, restrictions with respect to advertising of HFSS food and drinks,
limits some marketing activities for traditional fast food restaurants. As an example, sports
sponsorship in locations primarily used by children and young adults. To tackle this issue, a
strategy of approaching community centre, focus on middle-age adults and older adults and
by establishing partnership that include programs to encourage a healthy lifestyle and a
healthy and balanced diet can be incorporated to the marketing mix. Social Media, Celebrity
Endorsement and Online Consumer Reviews can increase company’s credibility and
diminish the negative aspects of the unhealthy connotations of fast food.
On account of the results of this research, different adverting strategies should be taking into
consideration due different behaviour between women and men, distinct age groups and
different levels of income; and the fact that consumers consider Taste as more important
factor than Health when it comes to eating out (p. 47-49).

73
7. Recommendations
Some recommendations can be made for future research. The focus of this research was to
investigate the influence of fast food advertising and healthy consciousness in Ireland.
Because of the sample size of this survey, was not possible to draw an analysis the
relationship between Social Status and eating behaviour. So, the first recommendation is to
consider a bigger sample size that represent the population. For a greater analysis the
findings can be crossed with two other factors: Income and Price. A more detail demography
would benefit fast food restaurants since they could target distinct social classes with
different message or different approach.
Findings show that people think that healthy food is more expensive, and that fast food is
unhealthy. For a depth investigation of why people have these assumptions, a future
research could consider approaching focus group. This recommendation would help healthy
fast food restaurants mitigate those beliefs, and as consequence, increase their market
share by reaching potential customers.
Literature has shown that television exposure does increase food consumption. However
people are now spending more time on Internet than watching TV. Another recommendation
is the investigate the influence of television comparing to internet exposure, considering that
each channel has its peculiarity and customer experience is different for both touchpoints.
By understanding better the target audience food companies can enhance its marketing
strategies.
Because income affect families’ food choice, it is recommended to investigate the influence
of healthy food advertising among families with kids and families with no kids, and for a
broad study, this future research could consider the two situations: eating at home and
eating out. This recommendation would benefit healthy food companies understand better
their target audience thus, enhancing its marketing strategies.
General findings show that Irish consumers were more keen to a healthy eating habit,
especially women. A more healthy consciousness were seen among middle-age adults and
older adults, it is recommended to apply a similar research in countries with different culture,
as different backgrounds often are related to distinct life style and eating habits, would
suggest distinct results.

74
People had a strong assumption that healthy food is more expensive, especially
respondents with higher income. These groups also had higher likeability to follow a healthy
and balanced diet. Since findings show that Income can influence food choice, it is
recommended an investigation considering population with distinct income per capita, e.g.,
countries from West versus East Europe. Same as the first recommendation, this approach
would benefit international fast food companies.

75
8. Reflections
I would like to start my reflection by giving a brief of the significant academic events in my life
that lead me to this day. I am 37 years old, and I am originally from Brazil. I’ve been in
Ireland for 5 years, and currently living with my partner in Mountmellick, Laois. I graduated
as Administrator at Universidade Estadual Paulista – UNESP (University of Sao Paulo State)
in 2007, and after 4 years I got my MBA in Human Resource at Uni-Facef a university from
my. Currently finishing my Master of Science in Marketing at Dublin Business School,
Dublin, Ireland.
I studied General English for 3 years, which really improved my language skills. So, I felt I
was ready to apply for a third level course in Ireland. I always have interested in Marketing
and its subjects. After considering a number of colleges I have decided for Dublin Business
School.
This master’s Marketing program has contributed to develop a wide range of skills, from
broad knowledge including techniques about writing academic paper and how to enhance
personal and professional skill to specific and technical skills, in the area of consumer
behaviour, marketing innovation and digital media. In this era, where consumer behaviour is
a complex process and is in continual change, the amount of information is provided from
every single interaction with brand, product or service is so extent, This program has
enhanced my thinking ability to understand the present, act with ethic, respecting all
individuals and institutions I interact with, also enhancing the ability of reading present facts
and events that can build foundation to be prepared for the future.
About the contribution of this dissertation, although it was a requirement of the program, it
was also a learning process for me. I really enjoyed the experience of writing this academic
paper. The one in question, was my first written in English, which I can describe as one the
biggest challenges I ever faced. It is a complete different and formal way of writing, and that
increased my vocabulary and improved my reading and writing skills. The life cycle of this
dissertation was subject to frustration, anxiety but also full of excitement and joy.
The first hurdle to overcome was finding an industry that I would enjoy studying about it.
That was not difficult. Since I came to Ireland I started to show interest for the food industry,
especially working in the environment. However that was too broad, the difficulty really
started when I had to decided which specific area of Marketing I would approach, taking into

76
consideration that I had to find a problem or issue to be explored. And not only any problem,
but one that was valuable and reflecting a gap in knowledge. After spending a few weeks I
finally decided to approach the fast food industry and health conscious market, which by the
end of my first proposal (Research Methods I), I have decided to investigate the fast food
advertising and health consciousness.
Then I had another obstacle. When I started Research Methods II, my focus was to build a
strong and solid literature review. When I finally started my dissertation phase my initial
challenge was to revise and polish my research objectives, that I did with my supervisor’s
guide and advices.
One other obstacle was getting access to the industry. Some of them did not reply my
emails. I even have tried contacting them on online communities such as, Twitter and
LinkedIn. Others did agree in participating but never returned to make an appointment for
interview. That was frustrating, as I knew it those responses would give exponential
contribution to my research.
But life goes on. I had to work with data I had in hands. And thanks to all 110 respondents of
my questionnaire and the two companies that participate by answering my “written interview”
(Itsa and Subway), I started doing my analysis. From there I started putting in practice my
analytical skills, and I got more excited when it came the time for discussions and then
conclusions. But I have to say, I was so relieved when I have completed the abstract, as I
only had four days to left to submit my dissertation.
After all this hard work I closure my dissertation cycle assured that my work did significant
contribution to the food industry as well to the academy. I do not feel I would change a thing
during this process. And my advice for other students would be to choose a topic that they
honestly would love work with and to give their best.

77
References
American Heart Association (no date) 'Food Advertising and Marketing to Children'.
American Heart Association. Washington DC, USA. Available at:
https://www.heart.org/idc/groups/heart-public/@wcm/@adv/documents/downloadable/ucm_
474473.pdf (Accessed: 21 December 2017).
American Psychological Association (no date) 'The impact of food advertising on childhood
obesity'. American Psychological Association. Available at: http://www.apa.org/topics/kids-
media/food.aspx (Accessed 20 December 2017).
Arcan, C., Bruening, M. and Story, M. (2013) 'Television (TV) and TV Advertisement
Influences on Children’s Eating Behaviour'. In: Tremblay RE, Boivin M, Peters RDeV, eds.
Faith MS, topic ed. Encyclopedia on Early Childhood Development [online]. September
2013. Available at: http://www.child-encyclopedia.com/child-nutrition/according-experts/
television-tv-and-tv-advertisement-influences-childrens-eating. (Accessed: 26 December
2017).
Belch, G. E. and Belch, M. A. (2012) Advertising and Promotion: An Integrated Marketing
Communications Perspective. 9 Ed. MrGraw-Hill/Irwin. New York. USA.
Bernhardt, A. M., Wilking C, Adachi-Mejia, A. M., Bergamini, E., Marijnissen, J., Sargent, J.
D. (2013) 'How Television Fast Food Marketing Aimed at Children Compares with Adult
Advertisements'. PLOS ONE Journal 8(8): e72479. Available at:
http://journals.plos.org/plosone/article?id=10.1371/journal.pone.0072479 (Accessed 28
December 2017).
Biggam, J. (2011). Succeeding with your Mater’s Dissertation: A step-by-step handbook. 2nd
edn. London, UK. Mc.Graw-Hill Education.
Boyland, E. J. and Whalen R. (2016) 'Food promotion as a driver of consumption patterns'
University of Liverpool, UK. Available at: http://www.ehnheart.org/component/attachments/
attachments.html?task=attachment&id=2620. (Accessed: 04 January 2018).

78
Boyland, E. J., Nolan, S., Kelly, B., Tudur-Smith, C., Jones, A., Halford, J. C. D. and
Robinson, E. (2016) 'Advertising as a cue to consume: a systematic review and meta-
analysis of the effects of acute exposure to unhealthy food and non-alcoholic beverage
advertising on intake in children and adults' The American Journal of Clinical Nutrition.
February 2016. Vol. 103 no. 2 519-533. Available at:
http://ajcn.nutrition.org/content/103/2/519 (Accessed: 07 January 2018).
Burton, J. (2009) Understanding the Economics of Digital Compared to Traditional
Advertising and Media Services. Published by American Association of Advertising
Agencies. New York.
Central Statistics Office (2017) ‘Census 2016 Summary Results - Part 1’. Central Statistics
Office. Ireland. Available at: http://www.cso.ie/en/media/csoie/newsevents/documents/
census2016summaryresultspart1/Census2016SummaryPart1.pdf (Accessed: 17 April 2017).
Chandon, P. and Wansink, B. (2007) 'The Biasing Health Halos of Fast-Food Restaurants
Health Claims: Lower Calorie Estimates and Higher Side-Dish Consumption Intentions'.
Journal of Consumer Research, Vol. 34, October 2007. Available at:
http://www.jstor.org/stable/pdf/10.1086/519499.pdf (Accessed: 21 December 2017).
Change4Life (no date) ‘About Change4Life’. Available at:
http://www.nhs.uk/Change4Life/Pages/why-change-for-life.aspx (Accessed: 19 April 2017).
Collis, J. and Hussey, R (2009). Business Research: A Practical Guide for Undergraduate &
Postgraduate Students. 3rd edn. London, UK. Palgrave Macmillan.
Crofton, E. C., Markey, A. and Scannell, A. G. M. (2013) "Consumers' expectations and
needs towards healthy cereal based snacks: An exploratory study among Irish adults",
British Food Journal, Vol. 115 Issue: 8, pp.1130-1148. Available at:
http://www.emeraldinsight.com/doi/pdfplus/10.1108/BFJ-08-2011-0213. Accessed: 19 April
2017).
EMarketer (2013) “Digital Set to Surpass TV in Time Spent with US Media - Mobile helps
propel digital time spent”, EMarketer. 1 August 2013. Available at:
https://www.emarketer.com/Article/Digital-Set-Surpass-TV-Time-Spent-with-US-
Media/1010096 (Accessed: 17 April 2017).
79
FoodBev Media (2009) ''FSAI survey unveils Irish attitudes to food labelling''. FoodBev
Media. December 2009. Available at: https://www.foodbev.com/news/fsai-survey-unveils-
irish-attitudes-to-food-labelling/ (Accessed: 21 April 2017).
Food Safety Authority of Ireland (2009) ‘FSAI Survey Unveils Irish Attitudes to Food
Labelling’ Food Safety Authority of Ireland. December 2009 [Online]. Available at:
https://www.fsai.ie/news_centre/press_releases/01122009.html (Accessed: 19 April 2017).
Forbes (2015) ‘Consumers want healthy foods - and will pay more for them’. Forbes, 15
February [Online]. Available at: http://www.forbes.com/sites/nancygagliardi/2015/02/18/
consumers-want-healthy-foods-and-will-pay-more-for-them/#69b1d927144f (Accessed: 18
February 2017).
Freeman, B., Kelly, B., Vandevijvere, S. and Baur, L. (2016) ‘'Young adults: beloved by food
and drink marketers and forgotten by public health?'. Health Promotion International, Volume
31, Issue 4, 1 December 2016, Pages 954–961 Available at
https://academic.oup.com/heapro/article/31/4/954/2593474 (Accessed: 26 December 2017).
Freshly Chopped, “Our Story”. Available at: https://www.chopped.ie/our-story/ (Accessed:
July 2018).
Fussenegger, D., Pietrobelli, A. and Widhalm, K. (2007) ‘Childhood obesity: political
developments in Europe and related perspectives for future action on prevention’.
International Association for the Study of Obesity. Obesity Reviews 9, 76–82. Available at:
http://search.ebscohost.com/login.aspx?direct=true&AuthType=ip,shib,cookie,url&db=edb&A
N=27810641&site=eds-live (Accessed: 18 April 2017).
Gagliardi, N. (2015) ‘Consumers want healthy foods - and will pay more for them’. Forbes.
Available at: http://www.forbes.com/sites/nancygagliardi/2015/02/18/consumers-want-
healthy-foods-and-will-pay-more-for-them/#69b1d927144f (Accessed: 18 February 2017).
Goggins, G., Rau, H. (2015) ‘Beyond Calorie counting: Assessing the sustainability of food
provided for public consumption’ Journal of Cleaner Production. June 2015. Available at:
https://www.researchgate.net/publication/282619788_Beyond_calorie_counting_Assessing_t
he_sustainability_of_food_provided_for_public_consumption (Accessed: 28 December
2017).

80
Google Consumer Barometer. Internet Usage. “Frequency of Internet Usage”. Available at:
https://www.consumerbarometer.com/en/graph-builder/?question=M6&filter=country:ireland
(Accessed: 02 August 2018).
Hennig-Thurau, T.; Gwinner, K. P.; Walsh, G. and Gremler, G. G. (2004). Electronic word-of-
mouth via consumer-opinion platforms: what motivates consumers to articulate themselves
on the Internet? Journal of Interactive Marketing, Vol. 18 No. 1, pp. 38-52. Available at:
https://www.marketingcenter.de/sites/mcm/files/downloads/research/lmm/literature/hennig-
thurau_et_al._2004_jim_electronic_word-of-mouth_via_consumer-opninion_platforms_what
_motivates_consumers_to_articulate_themselves_on_the_internet.pdf (Accessed 02 August
2018).
Herron, M. (2014) 'Do ads make kids fat?' Choice Consumer Advocacy. Marrickville,
Australia. Available at: https://www.choice.com.au/shopping/packaging-labelling-and-
advertising/advertising/articles/junk-food-advertising-to-kids (Accessed: 20 December 2017).
Igumbor, E. U.; Sanders. D.; Puoane, T. R.; Tsolekile, L.; Schwarz, C.; Purdy, C.; Swart, R.;
Dura, S.; and Hawkes, C. (2012). ‘Big Food,’’ the Consumer Food Environment, Health, and
the Policy Response in South Africa. PLoS Med 9(7): e1001253. Available at (Accessed: 18
April 2017).
Irish Department of Health (2017) “Non-Broadcast Media Advertising and Marketing of Food
and Non-Alcoholic Beverages, including Sponsorship and Retail Product Placement:
Voluntary Code of Practice”. Available at: https://health.gov.ie/wp-
content/uploads/2017/12/29835_Dept.Health_code.pdf (Accessed: 18 June 2018).
Jolly, R. (2011) 'Marketing obesity? Junk food, advertising and kids'. Parliament of Australia -
Social Policy Section. Research Paper no. 9 2010–11. Available at:
https://www.aph.gov.au/About_Parliament/Parliamentary_Departments/Parliamentary_Librar
y/pubs/rp/rp1011/11rp09#_Toc282609498 (Accessed: 21 December 2017).
Kelly, C., Clerkin, P., Gabhainn, S. N. and Mulvihill, M (2010). ‘Food marketing in Irish
schools’ Health Education. Vol. 110 No. 5, 2010 pp. 336-350. Available at:
https://www.researchgate.net/publication/228623262_Food_marketing_in_Irish_schools
(Accessed: 20 April 2017).

81
Kemps, E., Tiggemann, M., Hollitt, S. (2014) “Exposure to television food advertising primes
food-related cognitions and triggers motivation to eat”. School of Psychology, Flinders
University, Adelaide, Australia Vol. 29, No. 10, 1192–1205 Available at:
http://web.b.ebscohost.com/ehost/pdfviewer/pdfviewer?vid=1&sid=a4964db2-74f7-46fe-
8953-33f6464bcab3%40sessionmgr104 (Accessed 18 June 2018).
King, S. (2018) 'What Are Four Things That Can Affect Food Choices?'. The San Francisco
Chronicle. [Online]. Available at: http://healthyeating.sfgate.com/four-things-can-affect-food-
choices-3699.html (Accessed 13 June 2018).
Linehan, M. and Cadogan, T. (2011) Make That Grade Marketing. 4th Edition. Gill &
Macmillan, Dublin, Ireland.
Luomala, H., Jokitalo, M., Karhu, H., Hietaranta-Luoma, H., Hopia, A. and Hietamäki, S.
(2015). Perceived health and taste ambivalence in food consumption. Journal of Consumer
Marketing 32/4 (2015) 290-301. Available at: https://www.academia.edu/
15595801/Perceived_health_and_taste_ambivalence_in_food_consumption (Accessed: 20
November 2017).
Magnusson, R. S. (2010). Obesity prevention and personal responsibility: the case of front-
of-pack food labelling in Australia. BMC Public Health, 10, 662. Available at:
http://doi.org/10.1186/1471-2458-10-662 (Accessed 27 December 2017).
McCarthy, M., Breannan M. (2016) Drivers of Decision-Making: Perceived Food Healthiness.
Reference Module in Food Science. Elsevier Inc.
McDermott, M. J. (2010) 'Fresh Thinking: What makes Subway stand out in the US fast food
sector' WARC. March 2010. Available at: https://www.warc.com/content/article/ana/fresh_
thinking_what_makes_subway_stand_out_in_the_us_fast_food_sector/91673 (Accessed 27
December 2017).
Mills, S. D., Tanner, L. M., Adams, J. “Systematic literature review of the effects of food and
drink advertising on food and drink-related behaviour, attitudes and beliefs in adult
populations. Obesity Reviews 2013, 14(4), 303-314. Available at:
https://eprint.ncl.ac.uk/file_store/production/191232/B0FB3E77-A82B-4955-BE88-
E710B67F3CD3.pdf (Accessed 27 December 2017).

82
Naughton, P., McCarthy, S. N. and McCarthy, M. B. (2015) The creation of a healthy eating
motivation score and its association with food choice and physical activity in a cross-
sectional sample of Irish adults. International Journal of Behavioral Nutrition and Physical
Activity 12:74. Available at: https://ijbnpa.biomedcentral.com/track/pdf/10.1186/s12966-015-
0234-0?site=ijbnpa.biomedcentral.com (Accessed: 22 December 2017).
Nixon, L., Mejia, P., Cheyne, A., Wilking, C., Dorfman, L., & Daynard, R. (2015). “We’re Part
of the Solution”: Evolution of the Food and Beverage Industry’s Framing of Obesity
Concerns Between 2000 and 2012’. American Journal of Public Health, 105(11), 2228–
2236. Available at: https://www.ncbi.nlm.nih.gov/pmc/articles/PMC4605181/pdf/AJPH.2015.
302819.pdf (Accessed: 04 January 2018).
Park, D. H.; Lee, J., and Han, I. (2007). The effects of on-line consumer reviews on
consumer purchasing intention: the moderating role of involvement. International Journal of
Electronic Commerce, Vol. 11, No. 4, pp. 125–148. Available at:
http://eds.a.ebscohost.com/eds/pdfviewer/pdfviewer?vid=1&sid=43a285dd-ada7-4a61-9464-
2f6d94c9a0c7%40sessionmgr4009 (Accessed: 01 August 2018).
Public Health England (2017) ‘The Eatwell Guide’ Public Health England. Available at:
https://www.gov.uk/government/publications/the-eatwell-guide#history (Accessed: 19 April
2017).
Richards, T. J. and Padilla, L. (2007) “Promotion and Fast Food Demand”. Arizona State
University. Available at: https://www.gov.uk/government/publications/the-eatwell-
guide#history (Accessed: 18 June 2018).
Saunders, M., Lewis, P. and Thornhill, A. (2007). Research methods for business students.
4th edn. London: Pearson Education.
Saunders, M., Lewis, P. and Thornhill, A. (2009). Research methods for business students.
5th edn. London: Pearson Education.
Scully, M., Dixon, H., Wakefield, M. (2008) “Association between commercial television
exposure and fast-food consumption among adults”. Centre for Behavioural Research in
Cancer, Australia. Public Health Nutrition 12(1), 105–110. Available at:
https://pdfs.semanticscholar.org/5232/0249ff0395489623d9cb14a5cdb15b7ec84a.pdf?_ga=
83
2.159331322.1794071323.1529074663-1463972972.1529074663 (Accessed: 17 June
2018).
Scully, P., Reid, O., Macken, A., Healy, M., Saunders, J., Leddin, D., Cullen, W., Dunne, C.
and Gorman, C. S. O. (2014) “Food and beverage cues in UK and Irish children - television
programming”. Archives of Disease in Childhood 99(11). Available at:
https://www.cambridge.org/core/services/aop-cambridge-core/content/view/EC373342A3977
BE406F81F623CF361D7/S1368980015001755a.pdf/food_and_beverage_cues_in_children
s_television_programmes_the_influence_of_programme_genre.pdf (Accessed: 19 April
2018).
Story, M. and French, S. (2004) 'Food Advertising and Marketing Directed at Children and
Adolescents in the US'. International Journal of Behavioral Nutrition and Physical Activity
2004, 1:3. Division of Epidemiology, University of Minnesota, Minneapolis, MN USA.
Available at: https://ijbnpa.biomedcentral.com/track/pdf/10.1186/1479-5868-1-3?site=ijbnpa.
biomedcentral.com (Accessed: 19 December 2017).
Story, M., Neumark-Sztainer, D. and French, S. (2002) Individual and Environmental
Influences on Adolescent Eating Behaviours. Journal of the American Dietetic Association,
Volume 102, Issue 3, S40 - S51. University of Minneapolis, MN, USA. Available at:
http://www.sciencedirect.com/science/article/pii/S0002822302904219 (Accessed 20
November 2017).
“Supersize me!” 2004. Fortissimo Films. Directed by Morgan Spurlock. YouTube. Published
June 17, 2004, [https://www.youtube.com/watch?v=Sgcc_ZZnAgM]. (Accessed 18 June
2018).
Tempels, T. Verweij, M. and Blok, V. (2017) ‘Big Food's Ambivalence: Seeking Profit and
Responsibility for Health’. American Journal of Public Health. March 2017, Vol. 107 Issue 3,
p402-406, 5p. Available at: https://www.ncbi.nlm.nih.gov/pmc/articles/PMC5296687/pdf/
AJPH.2016.303601.pdf (Accessed: 16 April 2017).
The Irish Times (2016) '‘Quick-serve’ restaurants devour one third of Ireland’s food spend'
The Irish Times, 16 November [Online]. Available at:
https://www.irishtimes.com/business/agribusiness-and-food/quick-serve-restaurants-devour-
one-third-of-ireland-s-food-spend-1.2851723 (Accessed: 17 April 2017).
84
The Irish Times (2017) ''Ireland first country to restrict unhealthy food sponsorship aimed at
children''. The Irish Times. 10 May. [Online]. Available at:
https://www.irishtimes.com/news/health/ireland-first-country-to-restrict-unhealthy-food-
sponsorship-aimed-at-children-1.3077393 (Accessed 27 December 2017).
Tuder, S. (2016) 'How Marketing Influences Our Food Choices'. Sirvo Blog. 3 June.
Available at: https://sirvo.com/indinews/marketing-influences-food-choices/ (Accessed 27
December 2017).
World Health Organisation (2015) Ireland: WHO Statistical Profile. Available at:
http://www.who.int/gho/countries/irl.pdf?ua=1 (Accessed: 18 April 2017).

85
Appendix
Appendix 1 – Questionnaire Consumers
Questionnaire – Consumers
You have been asked to participate in a research study about advertising of fast food and
food choice in the Irish market. I ask you to read and answer the questionnaire below. Your
participation is voluntary, and you can withdraw anytime. I assure any personal information
will be share as an individual and confidentiality will be preserved. At the end of the survey
please click 'DONE' to send it. Thanks for your participation.
Section 1 - Demographics
1. Gender
( ) Male
( ) Female
2. Age
( ) 18–35 years
( ) 36–50 years
( ) 51–64 years
( ) 65+ years
3. Annually Personal Income
( ) less than €20,000
( ) €20,000 to €29,999
( ) €30,000 to €49,999
( ) 50,000 or more
Section 2 - Food Choice
For the following questions, please tick the box that matches your view most closely
4. I follow a healthy and balanced diet.
( ) Always
( ) Most of the time
( ) Sometimes
( ) Rarely
( ) Never

86
5. It is important that the food I eat…
( ) Keeps me healthy
( ) Contains vitamins & minerals
( ) Helps me control my weight
( ) I do not worry about healthiness of food
6. Do you think Fast Food restaurants sell healthy food?
( ) All
( ) Most
( ) Many
( ) Some
( ) None
7. Can you name a healthy fast food restaurant?
( ) Yes
_________________________ (please name it)
( ) I don’t know any.
8. How often do you go to YOUR healthy fast food restaurant? If you have any favourite.
( ) Every week
( ) Every 2 weeks
( ) Once a month
( ) Rarely
( ) Not applicable
9. How often do you go to a fast food restaurant?
( ) Every week
( ) Every 2 weeks
( ) Once a month
( ) Rarely
10. Regarding your food choice when eating out, which factor listed below is the most
important?
( ) Convenience
( ) Health
( ) Location
( ) Price
( ) Taste
( ) Other
_________________________ (please describe)
11. I think that eating healthy food is more expensive.
( ) Agree
( ) Somewhat agree
( ) Neither agree or disagree
( ) Somewhat disagree
( ) Disagree

87
Section 3 - Fast Food Advertising
12. Do you think advertising of healthy food is aimed at?
( ) Men
( ) Women
( ) Both
13. Do you remember any healthy fast food advertising?
( ) Yes
_________________________ (please name it)
( ) I don’t remember.
14. How likely are you to go to a healthy fast food restaurant based only in its
advertisement?
( ) Very likely
( ) Likely
( ) Somewhat likely
( ) Unlikely
( ) Very unlikely

88
Appendix 2 - Questionnaire - The Fast Food Industry
1. For decades fast food have been associated as unhealthy food and one of the main
causes of health public problems such as obesity and heart diseases. But in the
recent years we have seen a change in the landscape and new form of fast food
were introduced in the market - the healthy fast food. How do you see the future
demand for both markets?
2. Do you believe the increasing market for healthy fast food is due to advertising or
consumer’s demand?
3. In a society where healthy eating is becoming a global concern, how advertising can
drive consumer behaviour?
4. Other than advertising, which other factors you believe most influence consumers’
food choice, when eating out?
5. Some research argues that there are some advertisements with false or misleading
health claims. How companies can deal with this issue and reduce or eliminate any
negative perception of its products?

89
Appendix 3 – Ethics Checklist
Ethics Information – Business Postgraduate Studies
Student Details
Student Identifier:
Carlos Eduardo Rezende e Souza
Submission Date:
15/01/2017
Proposal Research
Title:
An investigation into the advertising of fast food and a healthy
conscious market in Ireland.
Brief Description of
the research:
Understand the health fast food advertising, communication and
message and how consumers behaviour towards food choice.
Sampling
Population of interest:
(brief description)
Adults consumers, male and female, aged 18 years old and over
living in Ireland.
Sample of interest:
(brief description of
size and how it is
chosen)
Expect to reach 100 participants chosen through snowball
sampling technique.

90
Primary Research - Data Management
Is the data
anonymised – how is
this done?
Yes, the data is anonymised. This will be done by removing
personally identifiable information from data sets, so that the
people whom the data describe remain anonymous.
How is data
confidentiality
maintained/
As researcher I agree to handle, store, and share research data
to ensure that information obtained from and about research
participants is not improperly divulged.
Where will the data be
stored/
Data stored in my personal computer and on the clouds, will be
protected by password which I am the only one with access.
When will the data be
destroyed/
The day after the time period for appeal-of-grade period has
expired. Or, the day after any grade appeals have been finalized
and closed.
Specific Ethical Considerations
Detail any aspects
specific to your
proposal that will
require further ethical
approval e.g.
interaction with under-
18-year-olds,
experiments requiring
deception, anything
that might cause
respondents any
distress, etc.
This research has no ethics conflicts and does not offer any
physical or psychological harm.
Student: Carlos Souza / Student number: 10348397 Date: 15/01/2018
Signature: Carlos Souza Signed: ______________

91
Appendix 4 – Support Documentation – Information Sheet for
Participants
PROJECT TITLE
An investigation into the marketing advertising of healthy fast food in the Irish market
You are being asked to take part in a research study on healthy fast food advertising, and
consumer behaviour towards food choice. I am Carlos Souza, master student at Dublin
Business School and my research supervisor is the lecturer Shakeel Siddiqui.
WHAT WILL HAPPEN
In this study, you will be asked to participate with an interview where questions regarding
fast food and healthy fast food market, advertising and consumer behaviour.
TIME COMMITMENT
The interview typically takes 45 minutes.
PARTICIPANTS’ RIGHTS
You may decide to stop being a part of the research study at any time without explanation
required from you. You have the right to ask that any data you have supplied to that point be
withdrawn / destroyed.
You have the right to omit or refuse to answer or respond to any question that is asked of
you.
If you have any questions as a result of reading this information sheet, you should ask the
researcher before the study begins.
CONFIDENTIALITY/ANONYMITY
The data I collect does not contain any personal information about you except such as
revenue neither the company’s strategy. My intentions regard the use of data for my
dissertation. Ultimately, this research may be presented at conferences, presented as a
paper or published as part of a book. For what I extent to which your individual participant
might be identifiable.
FOR FURTHER INFORMATION
I or / and Shakeel Siddiqui will be glad to answer your questions about this study at any time.
You may contact my supervisor at [email protected] or +353 1 417 7500.
Informed Consent Form

92
PROJECT TITLE:
An investigation into the marketing advertising of healthy fast food in the Irish market
PROJECT SUMMARY:
This interview is part of the dissertation for my master’s degree in Marketing at Dublin
Business School. This research aims to understand the fast food advertising in Ireland
regarding the increasing trend of healthy fast food and its advertising and the influence on
consumer’s food choice.
By signing below, you are agreeing that: (1) you have read and understood the Participant
Information Sheet, (2) questions about your participation in this study have been answered
satisfactorily, (3) you are aware of the potential risks (if any), and (4) you are taking part in
this research study voluntarily (without coercion).
_________________________________ _________________________________
Participant’s signature Participant’s Name (Printed)
CARLOS SOUZA
Student Name (Printed) ______________________________
Student Name signature
_____________________________
Date