An introduction to genetics and molecular biologycavanr/introBio.pdf · molecular biology,...
49
An introduction to genetics and molecular biology Cavan Reilly September 5, 2017
Transcript of An introduction to genetics and molecular biologycavanr/introBio.pdf · molecular biology,...

An introduction to genetics and molecular biology
Cavan Reilly
September 5, 2017

Table of contents
Introduction to biology
Some molecular biologyGene expression
Mendelian genetics
Some more molecular biology
Linkage analysis
Genetic associations

Biology
Biology is the study of life, however it is surprisingly difficult todefine life.
A living thing is usually defined descriptively by what it does:metabolism, reproduction and growth are some of the crucialactivities of a living thing.
There are many subdisciplines in biology: ecology, microbiology,molecular biology, immunology, virology, genetics...and many thatoverlap with other areas of inquiry: biochemistry, bioinformatics,biophysics...

Life
Features that are common to all forms of life include some sort ofcell membrane that keeps the contents of the cell secluded from itsenvironment and the presence of deoxyribonucleic acid (DNA).
The 3 basic groups of organisms found on Earth are classified asarchea, prokaryotes and eukaryotes.
Archea and prokaryotes are unicellular organisms while someeukaryotes are multicellular.
Not much is known about archea however they have been found inthe human gut and many other habitats.
Most forms of life are unicellular: the majority of the biomass (i.e.living matter) of the Earth is composed of bacteria.

Eukaryotes
Bacteria are everywhere, from hot springs to the inhospitableenvironment of the human gut.
Eukaryotes have a nucleus that contains the DNA of the cellwhereas prokaryotes do not.
They also have a number of organelles that the other 2 groups donot and eukaryotes use different methods for cell division.
There are 4 divisions of Eukaryotes: protists, fungi, plants andanimals.
DNA
We refer to the DNA of an organism as its genome.
DNA is a molecule that has a sequence of sugar molecules (and aphosphate group) with 1 of 4 distinct bases: adenine (A), cytosine(C), guanine (G) and thymine (T).
We think of DNA sequences in terms of sequences of bases.
A base bound to a sugar and phosphate group is called anucleotide.
Each base has a complementary base that it will naturally form ahydrogen bond with: the complement pairs are A-T and G-C.

Chromosomes
In its naturally occurring form, a single stranded DNA moleculebinds to another single stranded DNA molecule so that each baseon one strand binds to its complement.
This pair of molecules tends to fold into a double helix.
The human genome has approximately 3 billion basepairs andabout 99.9% of these are identical among humans.
In healthy humans, DNA exists as 23 pairs of distinct moleculesknown as chromosomes. Other organisms have different numbersof chromosomes and some even have more than just a pair of each.
One pair, the sex chromosomes, determine the gender of theperson.
Gene expression
In its naturally occurring state DNA is bound to a variety ofmolecules, and the manner in which these other molecules bind toDNA impacts the functionality of DNA.
Which molecules are bound to a DNA molecule varies over timeand in response to stimuli.
Cells use DNA as a template for making proteins.
Proteins are molecules generated by cells that allow the cell tofulfill a function.

Gene expression (cont.)
Ribonucleic acid (RNA) is much like DNA except uracil takes theplace of thymine, it doesn’t tend to form bonds with itscomplement and it takes many different shapes.
RNA has many functions in a cell, but it is “most famous” fortransporting information from DNA to the sites where proteins aremade (i.e. ribosomes).
Ribosomes are organelles composed of RNA molecules.
MicroRNAs are short RNA molecules that can bind to othernucleic acids and alter their function.

Gene expression (cont.)
A subsequence of the genome that is used to make a specificprotein is called a gene coding region, or sometimes just a gene.
The term gene is used somewhat loosely: we might mean thesubsequence of bases at the gene coding region or the location inthe genome of the subsequence.
The term locus is used to refer to a location in the genome (theremay or may not be a gene at a locus).
Although the number of genes isn’t fully known, there are about21,000-23,000 human genes.

Gene expression (cont.)
Most human genes are not composed of contiguous segments ofDNA.
Just prior to the start of a gene are certain sequence features thatare nearly common across all genes that regulate how the gene isused.
After this regulatory region there is a section called the 5’ (read: 5prime) untranslated region (UTR), then the first exon.
After this exon one encounters the first intron which is a section ofthe gene that is not used to make protein.
Gene expression (cont.)
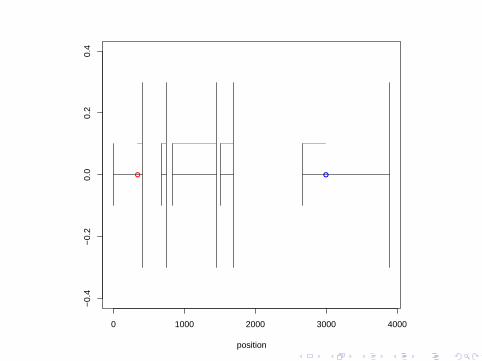
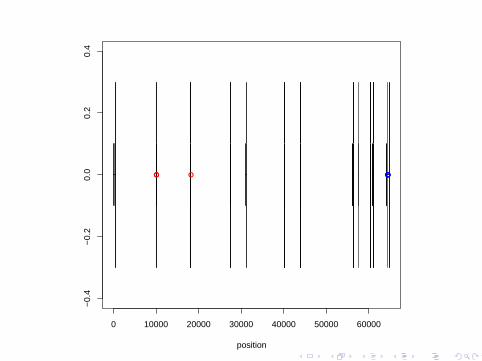
There are typically 5-10 exons in human genes and the introns canbe thousands of bases in length.
Then the 3’ UTR is found after the last exon.
Over 90% of human genes undergo alternative splicing: there aremultiple mRNA molecules that can be made from the gene.
This is possible because the gene can use just some of the exons,or use different 5’ and 3’ UTRs, and some genes even havemultiple start and stop locations.
0 1000 2000 3000 4000
−0.
4−
0.2
0.0
0.2
0.4
position
● ●
0 10000 20000 30000 40000 50000 60000
−0.
4−
0.2
0.0
0.2
0.4
position
●● ● ●●●●

Gene expression (cont.)
Transcription is the process by which alterations in the collectionof proteins bound to a DNA molecule lead to copying a genecoding region to create an RNA molecule.
This RNA molecule has information about the particular sequenceof bases at this gene coding region.
After copying the entire gene, the introns are removed (but not theUTRs) and structures are added to the ends to preserve themolecule: at that point we call the molecule a messenger RNA(mRNA).

Gene expression (cont.)
Translation is the process by which a cell uses the information inthe mRNA molecule to create a protein.
Proteins are composed of a sequence of amino acids: there are 20naturally occurring amino acids.
The genetic code is the basis for the system for converting DNAsequences into sequences of amino acids.
A codon is a collection of 3 contiguous nucleotides: each codon inan mRNA maps to 1 amino acid according to a fixed set of rules.
Gene expression is a term that is used to describe the entireprocess of translation and transcription of a gene.

Mendelian genetics
Since there is some variation among DNA sequences in humans,there are genes that have different subsequences among people.
Genes (or loci) that exhibit differences among members of aspecies are called polymorphic.
The possible subsequences at a gene (or a locus) are called alleles.
Since all humans have 2 copies of each chromosome, every genehas 2 alleles. One is inherited from the mother (the maternalallele) and the other from the father (the paternal allele).

Mendelian genetics (cont.)
The alleles that a subject has at a locus (or set of loci) is calledthat subject’s genotype.
If the 2 alleles at a locus are distinct we say that the organism isheterozygous at that locus otherwise the organism is homozygous.
An observed feature of an organism is referred to as a phenotype.

Mendelian genetics (cont.)
If a trait is at least partially genetically transmitted, the extent towhich it is hereditary is called its heritability.
There are methods for estimating this just using observablefeatures of organisms-in particular you don’t need to know whichgenes are responsible for the trait.
Note: Heritability is used in a technical sense that only applies tocontinuous traits.
The manner in which a genotype impacts a hereditary phenotypedepends on the trait.
Mendelian genetics (cont.)
In Mendelian genetics, individuals with homozygous genotypesdisplay the phenotype corresponding to the common allele, butheterozygous genotypes can display either phenotype.
If an organism has a heterozygous genotype and displays a certaintrait, then that trait is said to be dominant and the other trait isrecessive.
Traits that are controlled by one gene in a recessive or dominantfashion are called Mendelian traits otherwise they are calledcomplex traits.
Cystic fibrosis is a well documented Mendelian trait: currently3,000 loci have been implicated in Mendelian traits.

Haplotype
When we consider 2 loci simultaneously, if know which pairs ofalleles are on the same chromosome then we know the haplotype.
For example, consider 2 genes (denoted by a letter) where eachgene has 2 alleles (which we distinguish by case).
If someone has genotype AA and Bb, then we know that 1chromosome must have alleles AB and the other chromosomemust have alleles Ab-in this case we know the haplotype.

Haplotype (cont.)
In contrast, if someone has genotype Aa and Bb then 2configurations are possible: one chromosome has alleles AB whilethe other has ab or one chromosome has alleles Ab while the otherhas alleles aB-here the haplotype is unknown.
Conventional assays for genotyping a subject (i.e. determining thegenotype for many loci simultaneously) do not give informationabout haplotypes, they only provide information about genotypesfor each locus separately.
This presents a fundamental challenge for determining which genesare involved in disease processes.

Meiosis
One important function of some cells is that they go through thecell cycle and replicate-a process called mitosis.
During the process of replication, the cell makes copies of itschromosomes and then passes the copied chromosomes on to thenext generation-this can lead to errors, or mutations.
Such mutations are thought to be an important source of geneticdiversity.
However there are much stronger forces that lead to geneticdiversity.
Meiosis (cont.)
The generation of diversity in offspring is essential for survival of aspecies.
Such diversity allows a species to be able to adapt to changes in itsenvironment since some individuals might be able to survive due tomutations.
This phenomenon is at the heart of natural selection.
This is illustrated by organisms that can reproduce sexually andasexually: when there are sufficient resources the organismsundergo sexual reproduction (e.g. Cryptosporidium).
Meiosis (cont.)
Meiosis is the process that leads to the formation of sex cells (i.e.sperm and egg), also known as gametes.
Meiosis starts in a manner similar to mitosis: both copies of all ofthe chromosomes are replicated.
After this is a stage called prophase I in which the (replicated)pairs from both parental sources line up and separate, going into 2daughter cells.
After this each of these daughter cells has 2 copies of eachchromosome.

Meiosis (cont.)
In the next step of meiosis the daughter cells split again to create atotal of 4 cells where each of these cells only has one of eachchromosome (rather than a pair).
When the daughter cells divide, each chromosome from a pair isequally likely to be transmitted to the resulting cells.
Thus each gamete has a mix of chromosomes-some come from thematernal source and some from the paternal source.
When 2 gametes fuse the resulting cell will thereby have a pair ofeach of the chromosomes and the resulting organism will have aunique genome.
This process leads to substantial genetic diversity.

Recombination
While the random assortment of chromosomes to gametesgenerates new genomes, there is another mechanism that increasesgenetic diversity: recombination.
During meiosis (during prophase I), before the pairs ofchromosomes split up and go to different cells, they sometimes willswap sections of chromosomes between pairs to create entirely newchromosomes.
This process is called recombination.
Recombination (cont.)
As an example, suppose we consider the fate of some chromosomeafter a recombination. If we use letters to denote loci, case todistinguish alleles and suppose that the maternal and paternalalleles are all distinct then:
Before recombination:chromosome 2 (maternal): ABCDEFGchromosome 2 (paternal): abcdefg
After recombination:chromosome 2 (one copy): ABCdefGchromosome 2 (the other copy): abcDEFg
This process creates even further genetic diversity.
Recombination rate
The recombination rate between 2 loci is the probability of the 2loci having alleles from different parental sources.
If 2 loci are very close then it is unlikely that a recombination willseparate them, consequently the recombination rate is low.
Conversely, if 2 loci are on distinct chromosomes then theprobability that the alleles come from different parental sources is 1
2since chromosomes pass to gametes independently of one another.
Hence for all pairs of loci, the recombination rate is in the interval(0, 1
2
].

Markers
A marker is some known feature of a genome.
For example, the center of a chromosome can be observed under amicroscope (during certain stages of the cell cycle) hence this is amarker.
A polymorphic marker is a marker that varies among members of aspecies-all (normal) chromosomes have a center so the center isnot a polymorphic marker.
A single nucleotide polymorphism (SNP) is a single nucleotide thatis known to vary among individuals.
While older studies used other types of markers, SNPs are themarkers of choice today.

SNPs
Millions of SNPs have been identified in the human genome andlow cost assays are available for genotyping subjects at these SNPs.
There are also known sites which are called indels.
These are locations where some people have additional nucleotidescompared to others (i.e. insertions),
or some people are missing nucleotides compared to others (i.e.deletions).
So the actual length of the genome in terms of nucleotides variesamong members of a species.

Genetic linkage
Linkage analysis is a set of techniques whose goal is to estimatethe recombination fraction between loci where (at least) 1 locusalters risk for disease.
If we know the recombination rate between a marker (whoselocation on the genome is known) and a locus that alters diseaserisk is near zero, then we have found the location of a locus thatalters disease risk (i.e. we have found the “disease gene”).
By using many markers that cover the genome we can therefore gofishing for the location of the disease gene-genome scans.

Genetic linkage (cont.)
By knowing which genes have alleles that alter risk for somedisease we can gain insight into the disease and perhaps developbetter treatments for patients with the disease.
We can also provide information for pregnant mothers regardingthe probability that their offspring will have a particular disease.
Such genetic counciling is very important for some humansubpopulations as debilitating recessive traits circulate in somesubpopulations.

A simple example
To understand the difficulties of linkage analysis, we will consider asimple example.
Let’s assume that there is a gene with certain alleles that alter therisk for some disease.
Suppose further that we are willing to assume that this disease is adominant trait.
linkage example (cont.)
Consider a mating where one parent is affected by this trait and theother is not (and some offspring are affected and some are not).
Note that by assuming the disease has a genetic source and acts ina dominant fashion we know the genotype for the disease gene:
all affecteds (i.e. those with the disease) are heterozygous with acopy of the disease allele
all unaffected subjects are “homozygous” for the “normal“ allele(there could be multiple normal alleles).
linkage example (cont.)
Suppose we genotype both parents at some marker and discoverthat both parents are homozygous, but with different alleles (saythe diseased parent is A1,A1 and the other is A2,A2).
Use D to represent the disease allele and N to represent thenormal allele at the disease locus.
This implies that all offspring will be heterozygous at this markerallele (with genotype A1,A2).
Hence an affected offspring will be heterozygous at the markerlocus and the disease locus, i.e. this offspring will be doublyheterozygous.

linkage example (cont.)
Suppose these parents have an affected offspring. Note that wewill also know the haplotype here which we denote D,A1|N,A2.
Now suppose the affected offspring mated with someone who is notaffected by this disorder and was homozygous at the marker locus.
If this mating resulted in an affected offspring then by examiningthe alleles at the marker locus we are able to determine if arecombination occurred between the marker locus and the diseaselocus.

linkage example (cont.)
Suppose the unaffected parent in the second mating had genotypeA1,A1.
Then the marker genotype of the affected offspring will be eitherA1,A2 or A1,A1.
In the former case, the affected parent transmitted the diseaseallele and the allele A2 hence there was a recombination.
In the latter case, the affected parent transmitted the disease alleleand the allele A1 hence there was not a recombination.

linkage example (cont.)
Now suppose the unaffected parent in the second mating hadgenotype A1,A2.
Then the genotype of the affected offspring will be either A1,A1
(no recombination), A1,A2 (can’t tell if recombination occurred)or A2,A2 (a recombination).
If we had many matings where we could deduce if a recombinationoccurred then we could use the sample proportion ofrecombinations to estimate the recombination fraction.
If we found a marker that was close to the disease locus (in termsof the recombination fraction) then we would know the location ofthe disease gene.

linkage example (cont.)
We could then use tools available online to find if there are anygenes known to be at that location.
For example, let’s look up rs1501299-the link to follow is the oneto the NCBI website- this takes you to dbSNP which hasinformation about this SNP.
Typically there will be many genes (hundreds) that are “close” tomost markers when we use data from related subjects.
This is because related subjects typically share large chromosomalregions so that the ability to localize a disease gene is poor.
LOD scores
Rather than estimate the recombination fraction, geneticists testthe null hypothesis that the recombination fraction is 1
2 against thealternative that it is less than 1
2 .
If the null is rejected then the 2 loci are said to be linked.
Geneticists have traditionally conducted this test by computing theLOD score.
LOD scores (cont.)
The LOD score is the base 10 log of the test statistic for testingthe null hypothesis of that the recombination fraction is 1
2 , and thenull is rejected if the LOD score exceeds 3.
This turns out to be equivalent to rejecting the null hypothesis ifthe p-value is less than 0.0002.
This seemingly very “conservative” procedure makes sense giventhat one is typically testing many markers at once.
In fact given the current practice of examining million of markers,this is probably not conservative enough-currently 5.0× 10⁻⁸ iswidely used for genome wide association studies.
Estimating the recombination fraction given a family structure (i.e.a pedigree), disease status and a set of markers is incrediblycomputationally challenging.

Genetic associations
So far, we’ve focused on related subjects (families), but in fact allhumans are related at some level.
This fact manifests itself in the genome via a phenomenon calledlinkage disequilibrium (LD).
Linkage disequilibrium exists when 2 (or more) alleles tend to bepresent in the same haplotype more than we expect by chance.
It arises due to recombination: as sequences of meioses go over thegenerations, ancestral chromosomes are continually cut up andreassembled due to recombination.

Genetic associations (cont.)
Within a family we noted that recombination will tend to produceshared large pieces of chromosomes-this is a problem for linkageanalysis since 10-20 Mb (i.e. megabase) sections will be found.
When we look at unrelated subjects, much shorter segments ofchromosomes will be retained since many more generations ofmeioses will separate these 2 unrelated individuals.
This phenomenon used to be exploited for the purpose of “finemapping”: after linkage is detected using family data, unrelatedcases and controls would be used to test for an associationbetween the presence of a particular allele and case status.

Genetic associations (cont.)
Such a test could just be conducted using Pearson’s χ2 forcontingency tables: case versus controls versus presense of acertain allele or not.
Note that in linkage analysis, if a marker is linked to a disease allelethen subjects in that family with the disease would tend to havethe same allele at the marker, but different families could havedifferent marker alleles that are transmitted with the disease allele.
In contrast, in association studies, we expect to find the sameallele at the marker locus that is associated with the disease allele.

Admixture and confounding
Unfortunately, genetic associations can arise for reasons other thanlinkage between the 2 loci in question.
This can arise due to the existence of subpopulations that aregenetically similar in a heterogeneous population (admixture).
For example, African-Americans are at greater risk for sickle cellanemia and have alleles at marker loci that have differentfrequencies than the rest of the US population.

Admixture and confounding (cont.)
Hence if one tests for an association between having sickle cellanemia and the presence of a certain allele at some marker, onewill tend to find such an association due to the confounding effectsof ethnicity.
This has led to several different strategies for attempting to correctfor this source of bias.

Family based controls
The idea behind family based controls was originally developed forthe trio study design in which one has access to a collection ofparents and their affected offspring.
In this context, the family based control genotype is the pair ofalleles that were not transmitted to the affected offspring.
As an example, suppose the alleles at some marker locus for oneparent are A1, A2 and for the other parent they are A3, A4.
If the genotype of the affected offspring is A1, A3 then that is thecase genotype and the control genotype is just A2, A4.

Family based controls (cont.)
One can then make the following table and use a test statisticcalled McNemar’s χ2 test to test for an association.
control A1 control A1 total
case A1 a b w
case A1 c d x
total y z n
This is known as the transmission disequilibrium test (TDT) and ithas been extended to general pedigrees and quantitative traits.
The family based association test (FBAT) is a generalization of theTDT and many of its extensions.