Intermarket Analysis for Cybertraders: Where Bitcoin Fits In
An Intermarket Approach to Tactical Risk RotationUsing the Signaling Power of Treasuries to Generate Alpha and
Enhance Asset Allocation
2014 Wagner Award Submission
National Association of Active Investment Managers (NAAIM)
By Michael A. Gayed, CFA and Charles V. Bilello, CMTPension Partners, LLC
430 West 14th Street, #505New York, NY 10014
[email protected]@pensionpartners.com

1
Introduction
Traditional asset allocation argues for maintaining an appropriate mix
of asset classes weighted based upon one’s individual risk and return profile.
This methodology commands static execution, disregarding the potential to
enhance performance through the tactical identification of conditions which
may favor one asset class over another. In this paper, we propose an
alternative approach, using intermarket behavior within the Treasury market
as a signal to re-position a portfolio based on changing conditions. 1
Observing the behavior of the Treasury market has always been of
special importance to the Federal Reserve, economists, and market
participants given the leading nature of the yield curve. Much of the prior
research has focused on the spread between short duration and long duration
bonds. This spread, or the Treasury term structure, has been shown in
academic literature to be a leading indicator of oncoming recessions and
credit risk.2 However, to the best of our knowledge, no strategy has used the
total return and relative strength of two bonds of different durations as an
indicator of future asset class returns and volatility. While the yield curve
may be indicative of economic behavior, we find that total return
intermarket behavior proves to be a strong indicator of near-term volatility in
1 Intermarket analysis focuses on the relationships that exist within and across various asset classes in aneffort to identify lead-lag behavior which may be exploitable for active managers.2 See Estrella and Mishkin (1996).
2
equities, which in turn provides a roadmap for enhancing asset allocation
decisions.
The importance of asset allocation has been documented in numerous
studies over the last several decades. Brinson, Hood, and Beebower (1986)
noted that over 90% of the variability in a portfolio’s performance was due
to asset allocation policy, while Ibbotson and Kaplan (2000) argued that “on
average, policy accounted for a little more than all of total return.” Much of
the reasoning behind this relates to the idea brought forth by Sharpe (1991)
who argued that the average performance across all investors must equate to
the market, and as such after fees and expenses active return from security
selection is negated. This is one of the primary reasons why passive
indexing has been shown to produce superior results relative to mutual funds
in the long-term. 3 This is also a central tenet of the Efficient Market
Hypothesis which states that no strategy can consistently outperform a
simple buy and hold investment.
However, several studies have called into question the Efficient
Market Hypothesis, as certain market anomalies have been persistent and
exploitable. 4 Momentum is one such anomaly which has been well
3 See Day, Wang, and Xu (2001).4 See Philip and Torbey (2002).

3
documented in the stock market.5 Recent research indicates that persistence
of returns at the one month interval is not only an equity phenomenon, but
also applies to bonds.6 Therefore, if we accept that asset allocation accounts
for all of a portfolio’s return but reject the idea that active management can’t
outperform, then the focus should be on choosing an appropriate active
strategy to guide portfolio tilts. Prior studies have shown the potential
benefits of using relative price momentum in making tactical asset allocation
decisions. 7 Our strategy is unique in that we are using the relative
momentum within one asset class (Treasuries) as a signal for both tactical
asset allocation decisions and impending changes in volatility.
By tracking the relative performance of intermediate and longer
duration Treasuries, we document a powerful way to outperform traditional
asset allocation strategies on both a return and risk-adjusted return basis.
Broadly speaking, when the total return of longer duration Treasuries
outperforms that of intermediate duration Treasuries, volatility in equities
for the following month tends to rise and bond momentum drift continues.
When the opposite signal occurs, stocks become the preferred asset class.
We refer to this idea as Tactical Risk Rotation due to the timing of stock and
5 See Moskowitz and Grinblatt (1999).6 See Luu and Yu (2012).7 See Lewis (2012).

4
bond rotations around information the bond market is providing about near-
term volatility changes.
Using total return indices provided by CRSP®, we first develop a
strategy which positions 100% into either Treasuries or the stock market
based on the relationship between the 10-year Treasury and the 30-year
Treasury.8 We show that the performance from positioning 100% in stocks
or 100% in bonds based on our signal is higher than a buy and hold return of
both asset classes, with lower risk than the stock market.
The theory behind why this strategy works relates ultimately to
investor behavior during periods of anticipated stock market volatility,
contractionary periods, and/or slowing growth and inflation expectations.
Because Treasuries are considered a “risk-free” investment from the
standpoint of credit worthiness, investors tend to position into longer
duration bonds which benefit from “risk-off” periods. As near-term
confidence grows, intermediate term duration Treasuries outperform their
more defensively aggressive 30-year counterparts. The relative behavior
between 10-year and 30-year bonds then serves as an anticipatory gauge of
conditions that favor risk-taking due to near-term changes in the future
outlook for risk assets.
8 10-year Treasury and 30-year Treasury Total Return Indices were calculated (or derived) based on datafrom the University of Chicago on behalf of its Center for Research in Security Prices (CRSP®) ©2014.

5
We also extend Tactical Risk Rotation to rebalancing in creating a
strategy which adjusts target weights using the same relationship between
the 10-year Treasury and 30-year Treasury. We show that risk adjusted
returns and volatility are considerably better in using this strategy than a
traditional rebalancing based on monthly intervals. We find this to be true
for aggressive, moderate, and conservative iterations of our strategy. Finally,
we propose ways of implementing Tactical Risk Rotation through the use of
mutual funds and Exchange Traded Funds for active asset allocators and
investment managers.
The All-In Strategy
We first test the validity of Tactical Risk Rotation by exploring the
most extreme case of asset class rotation: a 100% portfolio shift. Our
strategy positions a portfolio either fully into Treasuries or fully into equities
based on the relative price performance of the 10-year Treasury and the 30-
year Treasury. 9 The strategy is descriptively named the Tactical Risk
Rotation Strategy (“TRRS”) as it attempts to rotate into bonds during higher
risk periods and into stocks during lower risk periods characterized by less
volatility. 10 Rotating into bonds in general and intermediate to longer
9 As a proxy for broad equity market exposure, we used the Fama/French U.S. Stock Market Index, whichis a total return index. Source: http://mba.tuck.dartmouth.edu/pages/faculty/ken.french/data_library.html10 “TRRS 10” is the strategy version that uses the 10-year Treasury as its bond allocation. “TRRS 30” is thestrategy version that uses the 30-year Treasury as its bond allocation.
6
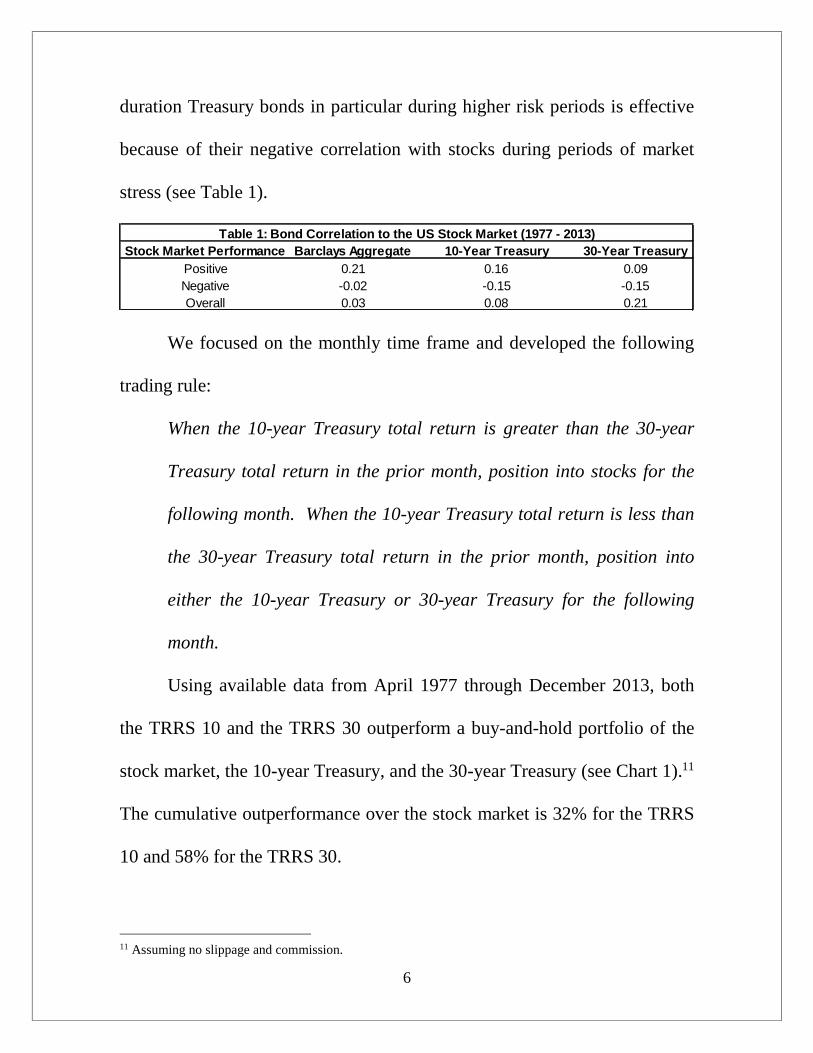
duration Treasury bonds in particular during higher risk periods is effective
because of their negative correlation with stocks during periods of market
stress (see Table 1).
Stock Market Performance Barclays Aggregate 10-Year Treasury 30-Year TreasuryPositive 0.21 0.16 0.09Negative -0.02 -0.15 -0.15Overall 0.03 0.08 0.21
Table 1: Bond Correlation to the US Stock Market (1977 - 2013)
We focused on the monthly time frame and developed the following
trading rule:
When the 10-year Treasury total return is greater than the 30-year
Treasury total return in the prior month, position into stocks for the
following month. When the 10-year Treasury total return is less than
the 30-year Treasury total return in the prior month, position into
either the 10-year Treasury or 30-year Treasury for the following
month.
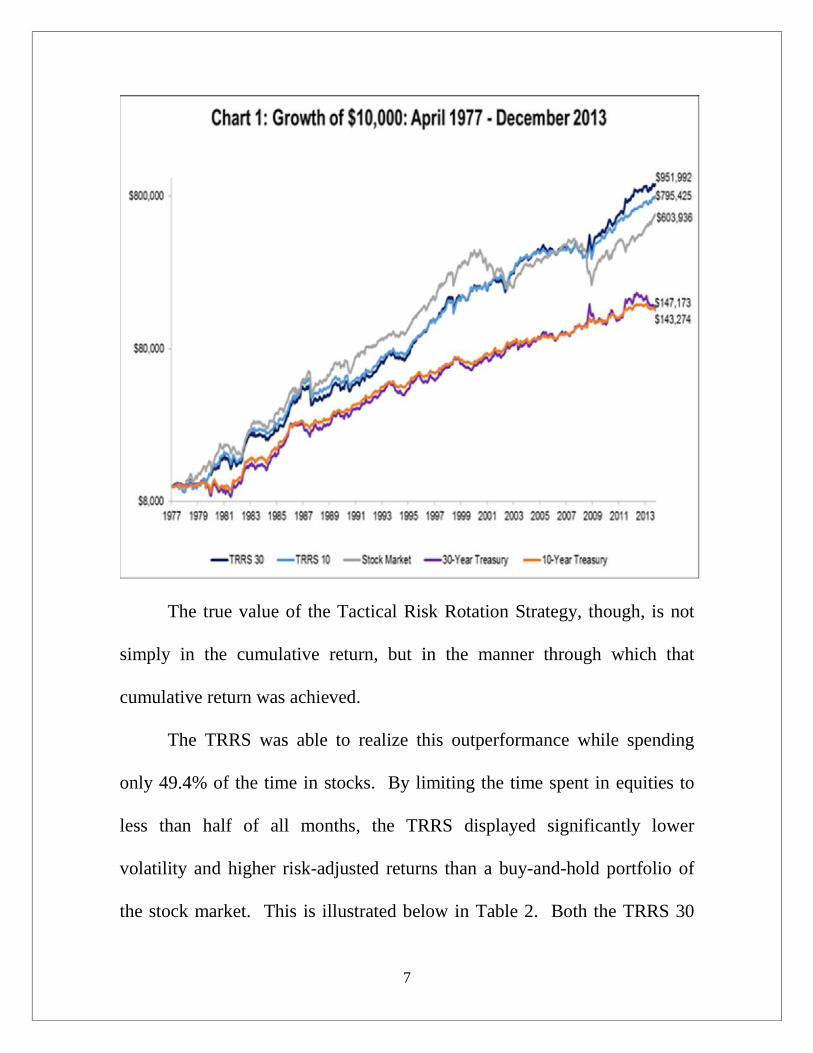
Using available data from April 1977 through December 2013, both
the TRRS 10 and the TRRS 30 outperform a buy-and-hold portfolio of the
stock market, the 10-year Treasury, and the 30-year Treasury (see Chart 1).11
The cumulative outperformance over the stock market is 32% for the TRRS
10 and 58% for the TRRS 30.
11 Assuming no slippage and commission.
7
The true value of the Tactical Risk Rotation Strategy, though, is not
simply in the cumulative return, but in the manner through which that
cumulative return was achieved.
The TRRS was able to realize this outperformance while spending
only 49.4% of the time in stocks. By limiting the time spent in equities to
less than half of all months, the TRRS displayed significantly lower
volatility and higher risk-adjusted returns than a buy-and-hold portfolio of
the stock market. This is illustrated below in Table 2. Both the TRRS 30
8
and TRRS 10 achieved higher annualized returns with lower annualized
volatility than the stock market, resulting in a higher Sharpe Ratio and
higher Sortino Ratio than the stock market.12 The annualized alpha created
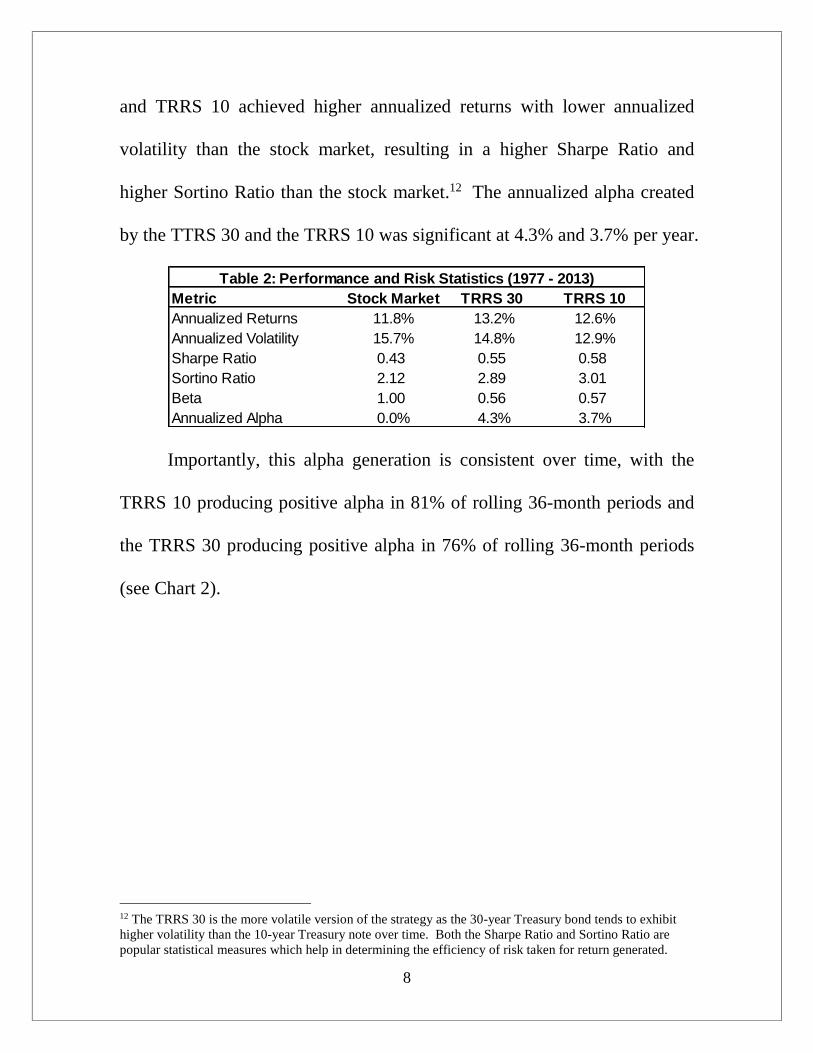
by the TTRS 30 and the TRRS 10 was significant at 4.3% and 3.7% per year.
Metric Stock Market TRRS 30 TRRS 10Annualized Returns 11.8% 13.2% 12.6%Annualized Volatility 15.7% 14.8% 12.9%Sharpe Ratio 0.43 0.55 0.58Sortino Ratio 2.12 2.89 3.01Beta 1.00 0.56 0.57Annualized Alpha 0.0% 4.3% 3.7%
Table 2: Performance and Risk Statistics (1977 - 2013)
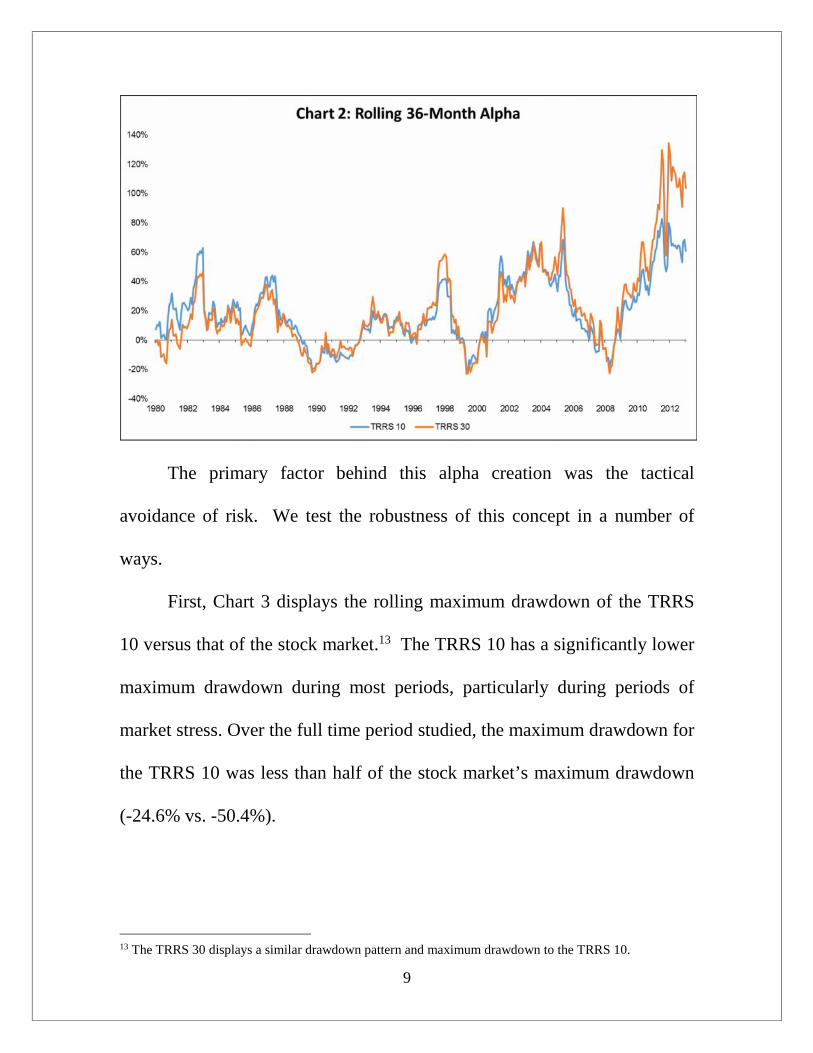
Importantly, this alpha generation is consistent over time, with the
TRRS 10 producing positive alpha in 81% of rolling 36-month periods and
the TRRS 30 producing positive alpha in 76% of rolling 36-month periods
(see Chart 2).
12 The TRRS 30 is the more volatile version of the strategy as the 30-year Treasury bond tends to exhibithigher volatility than the 10-year Treasury note over time. Both the Sharpe Ratio and Sortino Ratio arepopular statistical measures which help in determining the efficiency of risk taken for return generated.
9
The primary factor behind this alpha creation was the tactical
avoidance of risk. We test the robustness of this concept in a number of
ways.
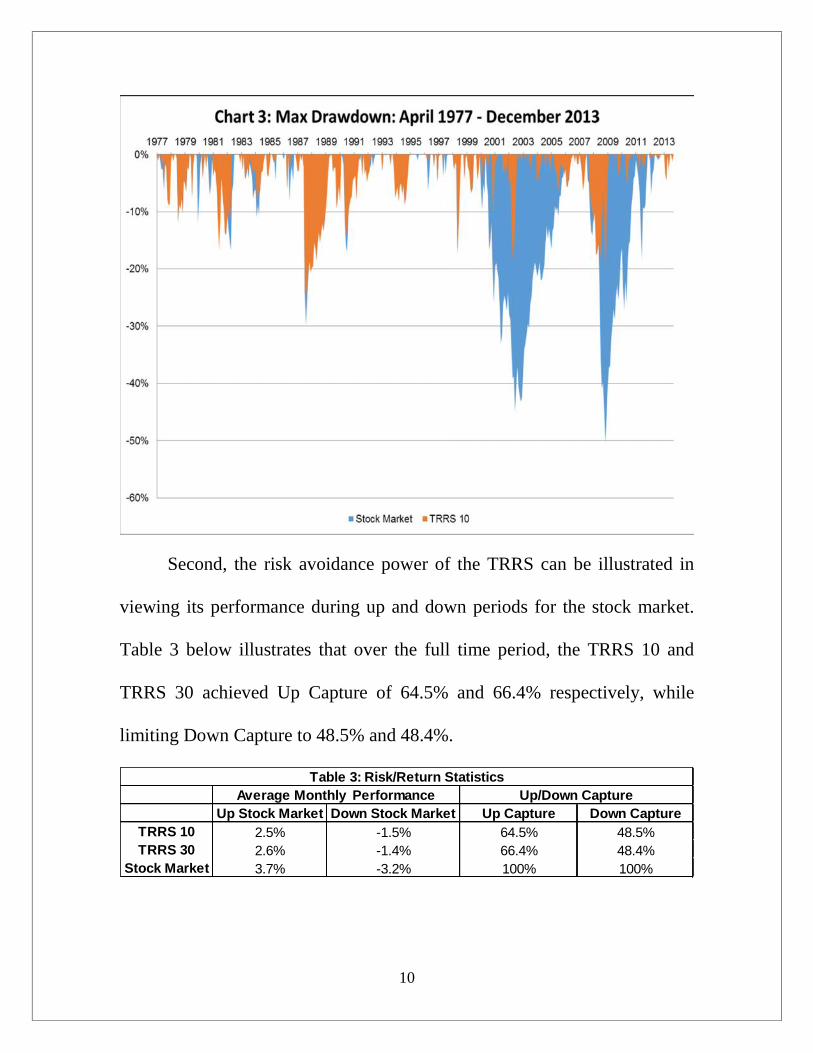
First, Chart 3 displays the rolling maximum drawdown of the TRRS
10 versus that of the stock market.13 The TRRS 10 has a significantly lower
maximum drawdown during most periods, particularly during periods of
market stress. Over the full time period studied, the maximum drawdown for
the TRRS 10 was less than half of the stock market’s maximum drawdown
(-24.6% vs. -50.4%).
13 The TRRS 30 displays a similar drawdown pattern and maximum drawdown to the TRRS 10.
10
Second, the risk avoidance power of the TRRS can be illustrated in
viewing its performance during up and down periods for the stock market.
Table 3 below illustrates that over the full time period, the TRRS 10 and
TRRS 30 achieved Up Capture of 64.5% and 66.4% respectively, while
limiting Down Capture to 48.5% and 48.4%.
Up Stock Market Down Stock Market Up Capture Down CaptureTRRS 10 2.5% -1.5% 64.5% 48.5%TRRS 30 2.6% -1.4% 66.4% 48.4%
Stock Market 3.7% -3.2% 100% 100%
Table 3: Risk/Return StatisticsAverage Monthly Performance Up/Down Capture
11
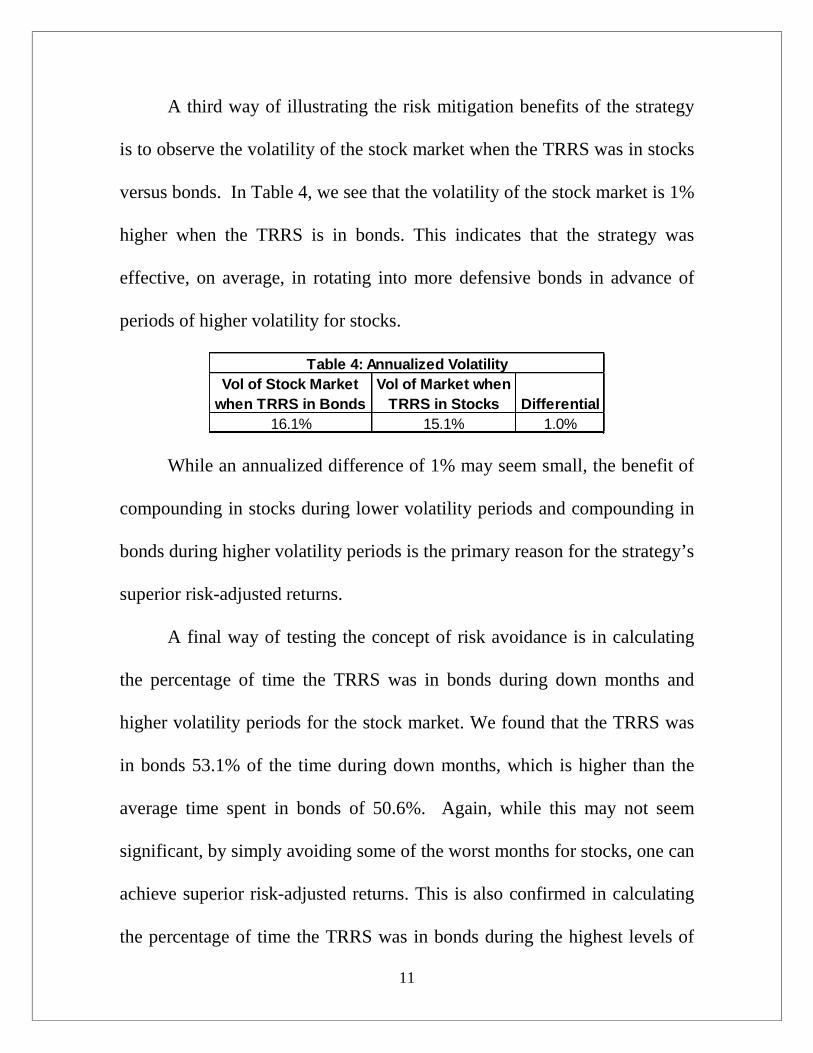
A third way of illustrating the risk mitigation benefits of the strategy
is to observe the volatility of the stock market when the TRRS was in stocks
versus bonds. In Table 4, we see that the volatility of the stock market is 1%
higher when the TRRS is in bonds. This indicates that the strategy was
effective, on average, in rotating into more defensive bonds in advance of
periods of higher volatility for stocks.
Vol of Stock Marketwhen TRRS in Bonds
Vol of Market whenTRRS in Stocks Differential
16.1% 15.1% 1.0%
Table 4: Annualized Volatility
While an annualized difference of 1% may seem small, the benefit of
compounding in stocks during lower volatility periods and compounding in
bonds during higher volatility periods is the primary reason for the strategy’s
superior risk-adjusted returns.
A final way of testing the concept of risk avoidance is in calculating
the percentage of time the TRRS was in bonds during down months and
higher volatility periods for the stock market. We found that the TRRS was
in bonds 53.1% of the time during down months, which is higher than the
average time spent in bonds of 50.6%. Again, while this may not seem
significant, by simply avoiding some of the worst months for stocks, one can
achieve superior risk-adjusted returns. This is also confirmed in calculating
the percentage of time the TRRS was in bonds during the highest levels of
12
the VIX index (since January 1990).14 We found that during months in
which top decile levels of the VIX were observed (levels greater than 29.1),
the TRRS was positioned in bonds 72.4% of the time, significantly higher
than the average time spent in bonds.
Risk Avoidance and Mitigating Behavioral Biases
Before moving on, it is important to understand why risk avoidance
and superior risk-adjusted returns are so critical, beyond the obvious benefits.
As investors are inherently emotional beings, they are more likely to
abandon a strategy with a higher drawdown and higher volatility at precisely
the worst time. Regardless of their stated risk tolerance, when faced with a
50% drawdown in their stock portfolio, many investors will panic and begin
to sell, likely near the low. This behavior was very clear in 2002 and 2009
at the tail end of bear markets that saw over 50% declines in equities. While
no strategy can completely eliminate risk, the TRRS manages risk to a more
acceptable level for most investors.
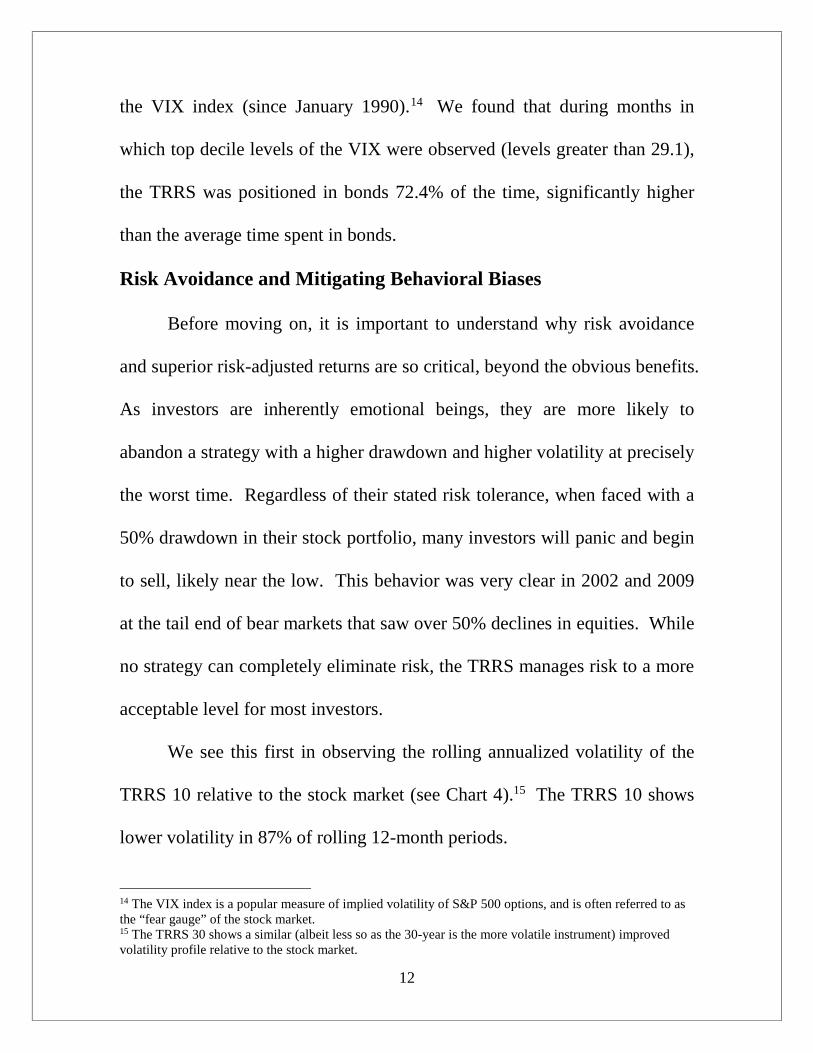
We see this first in observing the rolling annualized volatility of the
TRRS 10 relative to the stock market (see Chart 4).15 The TRRS 10 shows
lower volatility in 87% of rolling 12-month periods.
14 The VIX index is a popular measure of implied volatility of S&P 500 options, and is often referred to asthe “fear gauge” of the stock market.15 The TRRS 30 shows a similar (albeit less so as the 30-year is the more volatile instrument) improvedvolatility profile relative to the stock market.
13
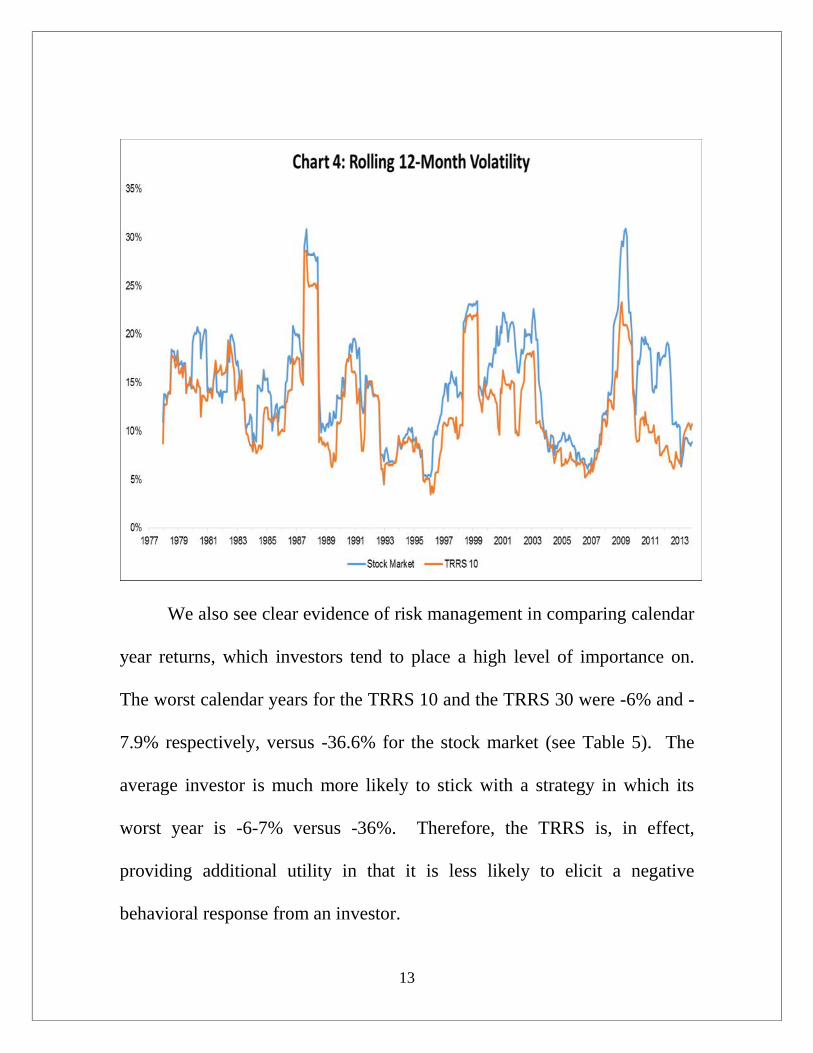
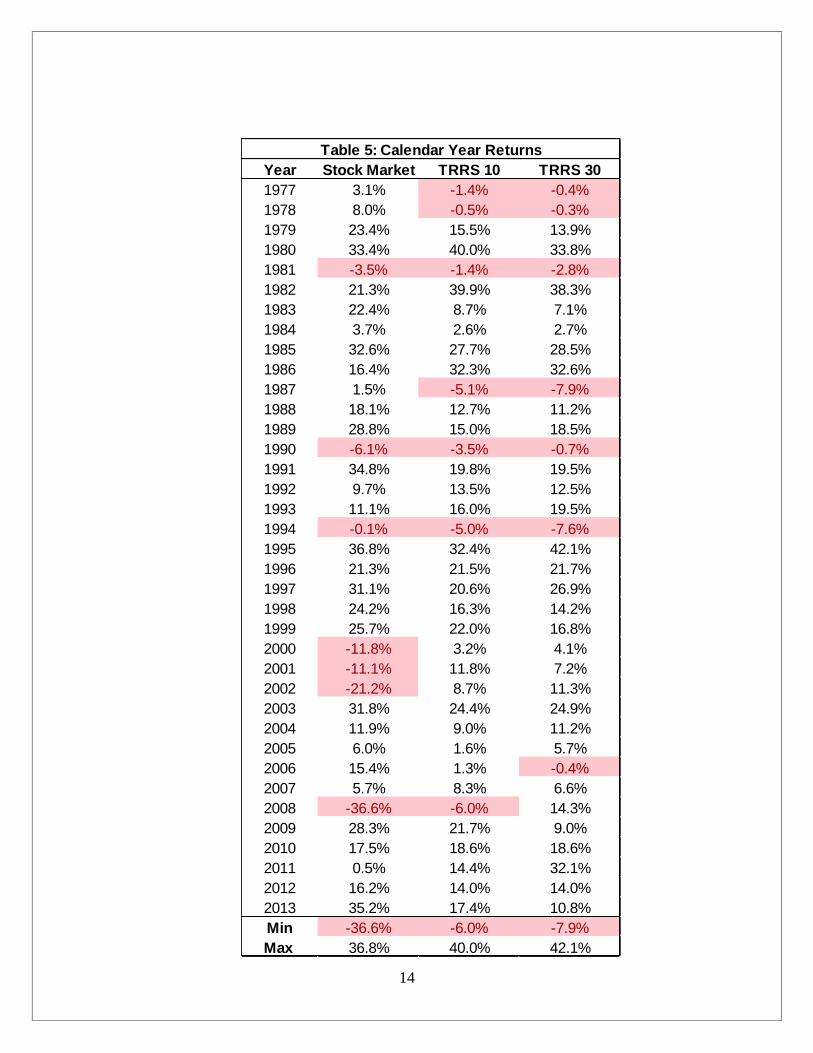
We also see clear evidence of risk management in comparing calendar
year returns, which investors tend to place a high level of importance on.
The worst calendar years for the TRRS 10 and the TRRS 30 were -6% and -
7.9% respectively, versus -36.6% for the stock market (see Table 5). The
average investor is much more likely to stick with a strategy in which its
worst year is -6-7% versus -36%. Therefore, the TRRS is, in effect,
providing additional utility in that it is less likely to elicit a negative
behavioral response from an investor.
14
Year Stock Market TRRS 10 TRRS 301977 3.1% -1.4% -0.4%1978 8.0% -0.5% -0.3%1979 23.4% 15.5% 13.9%1980 33.4% 40.0% 33.8%1981 -3.5% -1.4% -2.8%1982 21.3% 39.9% 38.3%1983 22.4% 8.7% 7.1%1984 3.7% 2.6% 2.7%1985 32.6% 27.7% 28.5%1986 16.4% 32.3% 32.6%1987 1.5% -5.1% -7.9%1988 18.1% 12.7% 11.2%1989 28.8% 15.0% 18.5%1990 -6.1% -3.5% -0.7%1991 34.8% 19.8% 19.5%1992 9.7% 13.5% 12.5%1993 11.1% 16.0% 19.5%1994 -0.1% -5.0% -7.6%1995 36.8% 32.4% 42.1%1996 21.3% 21.5% 21.7%1997 31.1% 20.6% 26.9%1998 24.2% 16.3% 14.2%1999 25.7% 22.0% 16.8%2000 -11.8% 3.2% 4.1%2001 -11.1% 11.8% 7.2%2002 -21.2% 8.7% 11.3%2003 31.8% 24.4% 24.9%2004 11.9% 9.0% 11.2%2005 6.0% 1.6% 5.7%2006 15.4% 1.3% -0.4%2007 5.7% 8.3% 6.6%2008 -36.6% -6.0% 14.3%2009 28.3% 21.7% 9.0%2010 17.5% 18.6% 18.6%2011 0.5% 14.4% 32.1%2012 16.2% 14.0% 14.0%2013 35.2% 17.4% 10.8%Min -36.6% -6.0% -7.9%Max 36.8% 40.0% 42.1%
Table 5: Calendar Year Returns
15
All-In Strategy vs. NBER Recession/Expansion Announcements
Expansionary periods tend to be characterized by lower overall
volatility in financial markets, while contractionary periods tend to exhibit
higher price fluctuations. A key component of the TRRS is its ability to
identify more volatile periods for equities in advance of their occurrence. In
using the relative performance between the 10-year Treasury and 30-year
Treasury as our risk trigger, we are letting intermarket relationships define
the economic cycle and are not simply relying on the standard definition of
an expansion or contraction as determined by the National Bureau of
Economic Research (NBER).16 This is important because by the time the
NBER officially recognizes a period of contraction, the economy is well into
a recession. Similarly, by the time the NBER recognizes the end of a
recession and beginning of a recovery, the economy is well into the next
expansion. We observe this fact in Table 6, which shows that the average
lag time between the turning point in the economy and NBER official
announcement was 12 months. The most recent example was the 2007-2009
recession, which ended in June 2009. NBER did not officially recognize
this end date until September 2010, a full 16 months later. By that point, the
stock market had already advanced over 80% from its low in March 2009.
16 Founded in 1920, the NBER is a research organization widely recognized as the definitive source fordetermining Business Cycle Expansion and Contraction dates in the U.S. www.nber.org.

16
Peak or Trough Turning Point Date Announcement Date with Link Lag (Months)Trough 6/1/2009 9/20/2010 16Peak 12/1/2007 12/1/2008 12Trough 11/1/2001 7/17/2003 21Peak 3/1/2001 11/26/2001 9Trough 3/1/1991 12/22/1992 22Peak 7/1/1990 4/25/1991 10Trough 11/1/1982 7/8/1983 8Peak 7/1/1981 1/6/1982 6Trough 7/1/1980 7/8/1981 12Peak 1/1/1980 6/3/1980 5
12Average Lag (months)
Table 6: Turning Point vs. Announcement Date
Therefore, as bonds and stocks are known to be leading indicators of
the economy and bonds tend to lead stocks over multiple cycles, a preferable
strategy from an investment and trading standpoint is using market prices
themselves to define economic cycles. This becomes immediately clear in
observing the performance of the TRRS 10 versus a strategy that rotates into
bonds (10-year Treasury note) or the stock market based on NBER
announcement dates (see Table 7). In every risk and return metric, the
TRRS 10 is superior and the NBER Strategy also underperforms a simple
buy and hold stock portfolio. This leads us to conclude that investors would
be better served ignoring such announcements as by the time the
announcement occurs the market has long ago priced in the turning point in
the economy.

17
Metric Stock Market TRRS 10 NBER StrategyCumulative Returns 5939% 7854% 3159%Annualized Return 11.8% 12.6% 9.9%Annualized Volatility 15.7% 12.9% 14.5%Sharpe Ratio 0.43 0.58 0.33Sortino Ratio 2.12 3.01 1.62Max Drawdown -50.4% -24.6% -43.8%Beta 1.00 0.57 0.78Annualized Alpha 0.00% 3.72% -0.36%
Table 7: TRRS 10 vs. NBER Announcement Strategy
Tactical Risk Rotation Through Rebalancing
Most fiduciaries recognize the importance of dynamic rebalancing.
Over time, stock and bond relative weights will drift and could potentially
result in a portfolio which has drastically different risk/return characteristics
than would otherwise be appropriate for a client’s risk profile. The question
of when to overweight and when to underweight an asset class, however, is
illusory for most. One of the simpler approaches that avoids having to
answer these questions is through continuous rebalancing of asset allocations
to target weights, which are set forth in Investment Policy Statements.17
Using monthly, quarterly, or annual time frames, studies show that the
contrarian nature of selling assets which outperform in favor of buying those
which underperform over time reduces volatility without harming longer-
term return.18
17 The “Investment Policy Statement” is a document drafted between a portfolio manager and a client thatoutlines general rules for the manager.18 See Dichtl, Drobetz, and Wambach (2012).

18
In practice, there are a number of reasons why an all-in rotation
strategy may be an unfeasible one for most, particularly money managers
with discretionary authority over client accounts. First, a strategy that can
rotate either completely into bonds or completely into stocks on a monthly
basis may be too difficult to explain to clients, who are likely to question the
merits of such an uncommon approach. Additionally, due to a lack of
sophistication, clients may seek to abandon the strategy during inevitable
short-term periods of underperformance. While this is true of any strategy,
the underperformance in the all-in strategy will be glaring when it occurs as
the strategy will be 100% in the underperforming asset class.19 Second, the
volatility of the all-in strategy, while lower than the stock market, may still
be too high for clients with a moderate or conservative risk tolerance.
Finally, most advisors would not use the 10-year or 30-year Treasury as a
proxy for fixed income exposure, preferring instead to use a more broad
representation of the bond market. We address these concerns in developing
an asset allocation strategy that is more suitable for the average investment
advisor.
19 It is worth emphasizing that the real power of the Tactical Risk Rotation Strategy is in minimizingdownside risk, rather than maximizing upside return over time. In 2013, the strategy had its worst year ofrelative underperformance against the broader stock market as Treasuries suffered from a historic shift andyield spike. While investors during that year may have exhibited home bias and questioned the strategy’svalidity, the longer-term results are undeniably strong precisely because of risk minimization.
19
In addressing the first concern, our asset allocation strategy is making
incremental shifts to a mix of stocks and bonds and is not switching from
100% stocks to 100% bonds in every rotation. As to the second concern, we
have developed three distinct asset allocation strategies based on an
investor’s risk tolerance: 1) Aggressive, 2) Moderate, and 3) Conservative.
In addressing the third concern, we used the Barclays Aggregate Bond Index
as the fixed income portion of the portfolio, representing a more diversified
exposure to the bond market.
Aggressive Asset Allocation Model
We first developed a rebalancing rule for the Aggressive category.
The default allocation is an 80% weighting to the stock market and a 20%
weighting to the Barclays Aggregate Bond Index. In months where the 10-
year Treasury outperformed the 30-year Treasury (expansionary signal), the
portfolio is rebalanced to this 80/20 mix of stocks and bonds. In months
where the 30-year Treasury outperformed the 10-year Treasury
(contractionary signal), the portfolio is rebalanced to a lower equity
allocation and higher bond allocation. We tested a range of weights in 5%
increments from the standard 80/20 allocation. The most defensive
rebalancing moved the portfolio to a 50/50 split between equities and bonds.
20
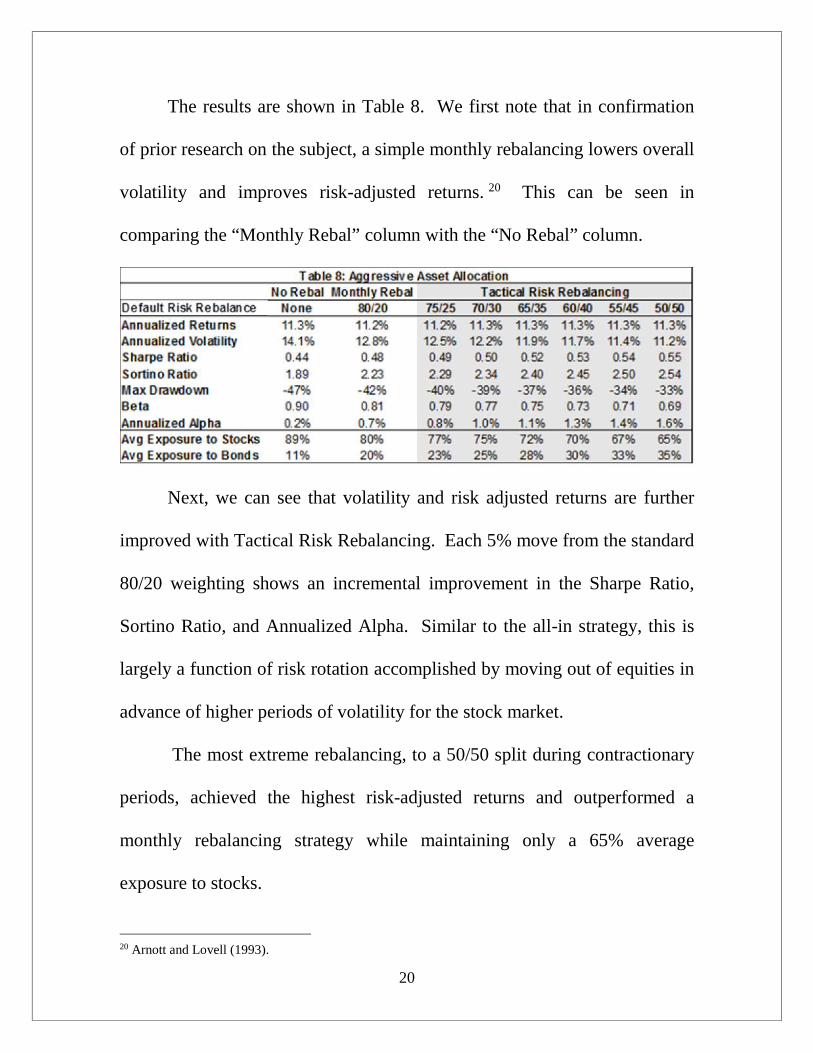
The results are shown in Table 8. We first note that in confirmation
of prior research on the subject, a simple monthly rebalancing lowers overall
volatility and improves risk-adjusted returns. 20 This can be seen in
comparing the “Monthly Rebal” column with the “No Rebal” column.
Next, we can see that volatility and risk adjusted returns are further
improved with Tactical Risk Rebalancing. Each 5% move from the standard
80/20 weighting shows an incremental improvement in the Sharpe Ratio,
Sortino Ratio, and Annualized Alpha. Similar to the all-in strategy, this is
largely a function of risk rotation accomplished by moving out of equities in
advance of higher periods of volatility for the stock market.
The most extreme rebalancing, to a 50/50 split during contractionary
periods, achieved the highest risk-adjusted returns and outperformed a
monthly rebalancing strategy while maintaining only a 65% average
exposure to stocks.
20 Arnott and Lovell (1993).
21
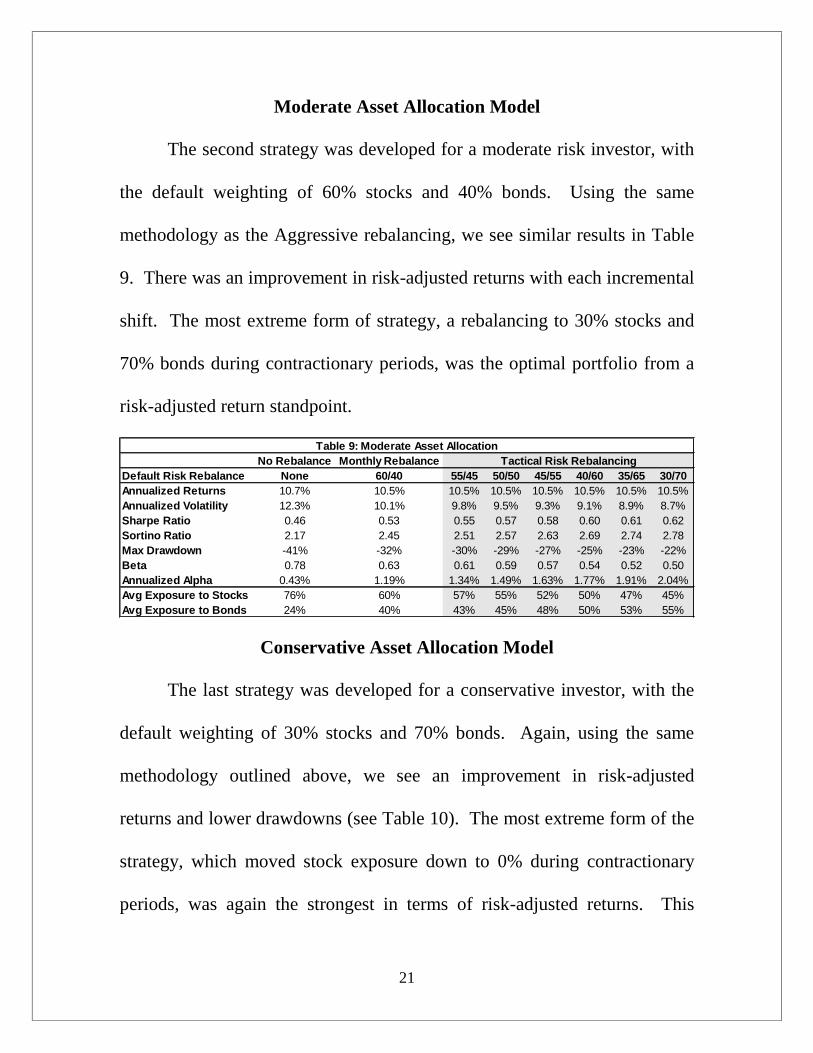
Moderate Asset Allocation Model
The second strategy was developed for a moderate risk investor, with
the default weighting of 60% stocks and 40% bonds. Using the same
methodology as the Aggressive rebalancing, we see similar results in Table
9. There was an improvement in risk-adjusted returns with each incremental
shift. The most extreme form of strategy, a rebalancing to 30% stocks and
70% bonds during contractionary periods, was the optimal portfolio from a
risk-adjusted return standpoint.
No Rebalance Monthly RebalanceDefault Risk Rebalance None 60/40 55/45 50/50 45/55 40/60 35/65 30/70Annualized Returns 10.7% 10.5% 10.5% 10.5% 10.5% 10.5% 10.5% 10.5%Annualized Volatility 12.3% 10.1% 9.8% 9.5% 9.3% 9.1% 8.9% 8.7%Sharpe Ratio 0.46 0.53 0.55 0.57 0.58 0.60 0.61 0.62Sortino Ratio 2.17 2.45 2.51 2.57 2.63 2.69 2.74 2.78Max Drawdown -41% -32% -30% -29% -27% -25% -23% -22%Beta 0.78 0.63 0.61 0.59 0.57 0.54 0.52 0.50Annualized Alpha 0.43% 1.19% 1.34% 1.49% 1.63% 1.77% 1.91% 2.04%Avg Exposure to Stocks 76% 60% 57% 55% 52% 50% 47% 45%Avg Exposure to Bonds 24% 40% 43% 45% 48% 50% 53% 55%
Table 9: Moderate Asset AllocationTactical Risk Rebalancing
Conservative Asset Allocation Model
The last strategy was developed for a conservative investor, with the
default weighting of 30% stocks and 70% bonds. Again, using the same
methodology outlined above, we see an improvement in risk-adjusted
returns and lower drawdowns (see Table 10). The most extreme form of the
strategy, which moved stock exposure down to 0% during contractionary
periods, was again the strongest in terms of risk-adjusted returns. This

22
portfolio achieved an annualized return of only 0.1% less than standard
rebalancing while cutting average exposure to equities in half (30% to 15%).
No Rebalance Monthly RebalanceDefault Risk Rebalance None 30/70 25/75 20/80 15/85 10/90 5/95 0/100Annualized Returns 9.6% 9.3% 9.3% 9.2% 9.2% 9.2% 9.2% 9.2%Annualized Volatility 8.8% 6.7% 6.5% 6.3% 6.2% 6.1% 6.1% 6.1%Sharpe Ratio 0.51 0.62 0.64 0.65 0.66 0.67 0.67 0.66Sortino Ratio 2.36 2.68 2.73 2.78 2.81 2.83 2.84 2.82Max Drawdown -28% -15% -13.0% -11.3% -9.5% -8.3% -7.6% -7.7%Beta 0.52 0.35 0.33 0.31 0.29 0.27 0.25 0.23Annualized Alpha 1.00% 1.80% 1.93% 2.06% 2.19% 2.31% 2.43% 2.54%Avg Exposure to Stocks 48% 30% 27% 25% 22% 20% 17% 15%Avg Exposure to Bonds 52% 70% 73% 75% 78% 80% 83% 85%
Table 10: Conservative Asset AllocationTactical Risk Rebalancing
Modern-Day Implementation
We recognize that many investors do not have access to CRSP® total
return data for 10-year and 30-year Treasuries. With the advent of an
increasing subset of Exchange-Traded Funds and no-load mutual funds, an
investor could replicate the TRRS and Asset Allocation Models above.
First, in replicating the signal, the instruments that currently resemble
the 10-year Treasury and 30-year Treasury most closely are the iShares 7-10
Year Treasury Bond (IEF) and the iShares 20+ Year Treasury Bond (TLT).
From the inception of these ETFs in July 2002, the signal produced from
their total returns was similar in 95% of months to the signal generated from
the CRSP® data.
Next, in replicating the available instruments, investors could choose
from a variety of products.
23
In the all-in strategy, substitutes for the Fama-French Stock Index
include the Vanguard Total Market ETF (VTI), the Vanguard Total Stock
Market Index Fund (VTSMX), and any other Total U.S. Stock Market
product. Substitutes for the 10-year Treasury note include the iShares 7-10
Year Treasury Bond (IEF), the Vanguard Intermediate Bond Fund (VBIIX),
and any other Treasury bond product with an average maturity of close to 10
years. Substitutes for the 30-year Treasury bond include the iShares 20+
Year Treasury Bond (TLT), the Vanguard Long-Term Bond Index Fund
(VBLTX), and any other product with an average maturity of close to 30
years.
In the rebalancing strategies, the substitutes for the stock portfolio are
the Vanguard Total Market ETF (VTI), the Vanguard Total Stock Market
Index Fund (VTSMX), and any other Total U.S. Stock Market product.
Substitutes for the Barclays Aggregate Bond Index include the iShares
Barclays Aggregate Bond Fund (AGG), the Vanguard Total Bond Market
ETF (BND), the Vanguard Total Bond Market Index Fund (VBMFX), and
any other total U.S. bond market product.

24
While our above analysis did not incorporate fees, commission,
slippage, or taxes, we would also note the following:
1) All of the products listed above are passive funds at the lowest end of the
fee spectrum currently available to investors.
2) The products listed are also at the highest end of the liquidity spectrum
where slippage is not a concern.
3) Both the TRRS and the Rebalancing Strategy are not extremely active,
with the TRRS shifting the portfolio roughly every two months and the
Rebalancing Strategy moving the portfolio monthly.
4) With this level of frequency, commission levels would be de minimis and
not likely to alter returns. Additionally, an account housed within
Vanguard could buy/sell both Vanguard mutual funds and Vanguard
ETFs without incurring a commission. In this case, the transaction fee
would be $0.
5) There are tax implications in the TRRS and Rebalancing Strategy which
could reduce overall returns. If executed in a non-taxable account (IRA,
401k, etc.), this would not be an issue. In a taxable account, one would
generate additional short-term capital gains which is sub-optimal from a
tax perspective, though the risk reduction benefits over time may
outweigh this.

25
6) Overall, a non-taxable account housed at one of the major brokerage
firms that offer no-fee trades for their products would be the best way to
approximate the strategy at minimal cost.
Conclusion
We find that the signaling power of Treasury bonds is a market
anomaly that has persisted over time. The relationship between the total
return of the 10-year Treasury and the 30-year Treasury in particular
contains important information about future volatility in markets. Contrary
to the Efficient Market Hypothesis, this information does not appear to be
priced in immediately by broad market averages, and therefore is exploitable.
The implications from both a strategy and signaling standpoint are
meaningful. We find that by using a Tactical Risk Rotation Strategy based
on the relationship between intermediate and long duration bonds, one could
have outperformed a buy and hold strategy over time with lower risk. This
finding is contrary to the widely accepted notions of risk and return dictated
by the Capital Asset Pricing Model (CAPM) and Security Market Line
(SML).
Outperformance is achieved by timing exposure to risk using a
monthly relative performance signal of the 10-year Treasury to the 30-year
Treasury. The strategy rotates into equities when the investing environment
26
favors risk-taking and into bonds when the investing environment favors
capital preservation. Importantly, because the Tactical Risk Rotation
Strategy spends more than half of its time in bonds, it also benefits from
lower volatility and higher compounding of interest.
The key to the strategy’s outperformance, though, was in the tactical
avoidance of risk. Specifically, when the 30-year Treasury is outperforming
the 10-year Treasury, it often serves as a warning sign of increased volatility
in the equity market during a “risk-off” environment.
We also find that a Rebalancing Strategy based on the same risk
signal produces higher risk-adjusted returns with lower average exposure to
equities than a simple monthly rebalancing. This was true for aggressive,
moderate, and conservative allocations. The critical component was once
again the avoidance of risk by holding a higher percentage of bonds during
periods of higher stock market volatility.
The avoidance of risk is especially important for investment advisors
and other fiduciaries, who recognize that the business of portfolio
management is as much about managing client behavior as it is about
managing money. Real-time access to accounts and a constant flow of
information from the financial media about short-term market movements
often results in emotionally-driven responses from clients. Needless to say,
27
these responses tend to be suboptimal and are the primary cause of the gap
seen between investor returns and average mutual fund returns. 21 This
behavior is most evident during periods of heightened volatility and market
stress, when investors may force their advisors to reduce risk and sell out of
positions due to loss aversion. Meanwhile, home bias in strong up years for
stocks can result in excessive risk taking and the termination of a manager
who underperforms.22 Both situations are highly counterproductive as they
are entirely reactionary and completely disregard the investor’s risk profile.
While advisors who have discretionary authority over an account can
attempt to counteract this adverse behavior, obeying a client’s wishes (even
if it is against his or her best interest) can be the difference between keeping
those assets, and losing them. Tactical Risk Rotation offers a potential
solution to this problem.
Further Research
Although beyond the scope of this paper, there are a number of
broader implications that our findings may have on the investing and
trading landscape. As it relates to trading and the timing of volatility,
21 See Frazzini and Lamont (2008).22 Both loss aversion and home bias are terms advanced in the field of behavioral finance and economics.Loss aversion relates to the idea that people feel the pain for portfolio losses more acutely than the joy ofthe same portfolio gain. Home bias causes people to want to overweight domestic equities in favor ofglobal diversification, which in turn causes clients to benchmark their portfolios to popular domesticindices regardless of portfolio construction.
28
further research could study the benefit of: (1) implementing option
overlay strategies around the risk signal23, (2) hedging around the risk
signal, (3) timing of gross exposure or leverage around the risk signal,
and (4) developing a risk signal within shorter time frames (using daily
or weekly data). As it relates to asset allocation, further research could
study: (1) implementing Tactical Risk Rotation on portfolios with
additional asset classes, (2) applying an overweight or underweight to
specific sectors within the equity allocation (ex: cyclical or defensive),
and (3) applying an overweight or underweight to specific areas within
the bond allocation (ex: high yield or treasuries).
23 The “risk signal” is when the 30-year Treasury is outperforming the 10-year Treasury.
29
References
Arnott, R., and R. Lovell, 1993, Rebalancing: Why? When? How Often?The Journal of Investing, Vol. 2, No. 1.
Beach, Steven L., and Clarence C. Rose, 2009, Portfolio Rebalancing toOvercome Behavioral Mistakes in Investing, Journal of Behavioral Studiesin Business, Vol. 1.
Brinson, Hood and Beebower, 1986, Determinants of Portfolio Performance,Financial Analysts Journal, July/August 1986.
Day, Wang, and Xu, 2001, Investigating Underperformance by Mutual FundPortfolios, School of Management, The University of Texas at Dallas.
Dichtl, Drobetz, and Wambach, 2012, Testing Rebalancing Strategies forStock-Bond Portfolios: Where Is the Value Added of Rebalancing? MidwestFinance Association 2012 Annual Meetings Paper.
Estrella, Arturo, and Frederic S. Mishkin, 1996, The Yield Curve as aPredictor of U.S. Recessions, Federal Reserve Bank of New York, CurrentIssues in Economics and Finance, Vol. 2, No. 7.
Frazzini, Andrea, and Owen A. Lamont, 2008, Dumb Money: Mutual fundflows and the cross-section of stock returns, Journal of Financial Economics88 (2008).
Guo, Hui, 2006, Are Investors More Risk-Averse During Recessions?Federal Reserve Bank of St. Louis.
Ibbotson, Roger G., 2010, The Importance of Asset Allocation, FinancialAnalysts Journal, vol. 66. No. 2.
Ibbotson, Roger G., and Paul D. Kaplan, 2000, Does Asset Allocation PolicyExplain 40, 90, or 100 Percent of Performance? Financial Analysts Journal,Jan/Feb 2000, Vol. 56, No. 1.
Kellogg, Nat, and Eric Przybylinski, 2012, Portfolio Rebalancing: A Guidefor Institutional Investors, Marquette Associates.
30
Koijen, Rodriguez, and Sbuelz, 2006, Momentum and Mean-Reversion inStrategic Asset Allocation, Management Science 55.
Lewis, John, 2012, Tactical Asset Allocation Using Relative Strength,Dorsey Wright & Associates.
Luu, Bac Van, and Peiyi Yu, 2012, Momentum in Government-BondMarkets, Journal of Fixed Income, Vol. 22, No. 2.
Moskowitz, Tobias J. and Grinblatt, Mark, 1999, Do Industries ExplainMomentum? The Journal of Finance.
Perold, Andre F., and William F. Sharpe, 1988, Dynamic Strategies forAsset Allocation, Financial Analysts Journal (January – February 1988),Vol. 44, No. 1.
Russell, Philip S. and Violet M. Torbey, 2002, The Efficient MarketHypothesis: A Survey, Business Quest Journal.
Tokat, Yesim, 2006, Portfolio Rebalancing in Theory and Practice,Vanguard Investment Counseling & Research.
Van Vliet, P., and David Blitz, 2009, Dynamic Strategic Asset Allocation:Risk and Return across Economic Regimes, Robeco Asset Management.