An initial model of seismic microzonation of Sikkim …earthqhaz.net/imp_pubs/2005_J of Asian Earth...
15
An initial model of seismic microzonation of Sikkim Himalaya through thematic mapping and GIS integration of geological and strong motion features q Sankar Kumar Nath * Department of Geology and Geophysics, Indian Institute of Technology, Kharagpur-721302, India Accepted 10 March 2004 Abstract Seismic microzonation and hazard mapping was undertaken in the Sikkim Himalaya with local site conditions and strong ground motion attributes incorporated into a geographic information system. A strong motion network in Sikkim consisting of 9 digital accelerographs recorded more than 100 events during 1998 –2002, of which 72 events are selected with signal-to-noise ratios $ 3 for the estimation of site response (SR), peak ground acceleration (PGA) and resonance frequency (RF) at all stations. With these data and inputs from IRS-1C LISS III digital data, topo-sheets, geographical boundary of the State of Sikkim, surface geological maps, soil taxonomy map at 1:50,000 scale and seismic refraction profiles, the seismological and geological thematic maps, namely, SR, PGA, RF, lithology, soil class, slope, drainage, and landslide layers were generated. The geological and seismological layers are assigned normalized weights and feature ranks following a pair- wise comparison hierarchical approach and later integrated through GIS to create the microzonation map of the region. The overall SR, PGA and resonance frequency show an increasing trend in a NW – SE direction, peaking at Singtam in the lesser Himalaya. Six major hazard zones are demarcated with different percentages of probability index values in the geological, seismological hazard and microzonation maps. The maximum risk is attached to a probability greater than 78% in the Singtam and adjoining area. These maps offer generally better spatial representation of seismic hazards including site-specific analysis as a first level microzonation attempt. q 2004 Elsevier Ltd. All rights reserved. Keywords: Seismic hazard; Site response; Peak ground acceleration; Resonance frequency; GIS integration; Microzonation 1. Introduction Five major earthquakes occurred in India over the past decade. The devastating Bhuj earthquake of 26th January 2001 is still fresh in our memory. The Himalayan region is a 2500 km long belt from Kashmir in the west to Arunachal Pradesh in the east. It can be divided into several seismotectonic blocks, including the Darjeeling – Sikkim, where a good number of moderate magnitude earthquakes ðM $ 5:0Þ had been recorded in the past. Global Positioning System (GPS) measurements show that India and southern Tibet converge at a rate of 20 ^ 3 mm/year (Bilham et al., 2001). Bilham et al. (2001) divided the Himalaya into 10 imaginary sections, each around 220 km in length. At the observed conver- gence rate of 20 mm/year (Bilham et al., 2001), at least 6 of these 10 regions have an accumulated slip potential of 4 m. This is equivalent to the slip believed to be associated with the 1934 Bihar earthquake that killed 10,700 people. By 2002, the Bureau of Indian Standard mapped four seismic zones in India, namely (i) Zone-V: PGA of 0.4 g and above with 10% probability of exceedence in 50 years and MMI of IX and above, occupying about 12% of the country (ii) Zone IV: PGA 0.25 g and MMI VIII, occupying 18% of the country (iii) Zone III: PGA 0.2 g and MMI VII, occupying 26% of the country (iv) Zone II: PGA 0.1 g and MMI VI. However, these zones cannot predict with certainty what ground acceleration will be experienced by structures situated in them. It is the level of ground acceleration, coupled with site-specific effects, which actually buffet buildings due to the impact of an earthquake. The Sikkim Himalaya (Fig. 1a) is located in an earthquake-prone part of the eastern Himalaya along the Darjeeling–Sikkim tract. 1367-9120/$ - see front matter q 2004 Elsevier Ltd. All rights reserved. doi:10.1016/j.jseaes.2004.03.002 Journal of Asian Earth Sciences 25 (2005) 329–343 www.elsevier.com/locate/jaes q Originally submitted for the 17 Himalaya Tibet Workshop. * Tel.: þ91-3222-283-374; fax: þ91-3222-282-268. E-mail address: [email protected] (S.K. Nath).
Transcript of An initial model of seismic microzonation of Sikkim …earthqhaz.net/imp_pubs/2005_J of Asian Earth...

An initial model of seismic microzonation of Sikkim Himalaya
through thematic mapping and GIS integration
of geological and strong motion featuresq
Sankar Kumar Nath*
Department of Geology and Geophysics, Indian Institute of Technology, Kharagpur-721302, India
Accepted 10 March 2004
Abstract
Seismic microzonation and hazard mapping was undertaken in the Sikkim Himalaya with local site conditions and strong ground motion
attributes incorporated into a geographic information system. A strong motion network in Sikkim consisting of 9 digital accelerographs
recorded more than 100 events during 1998–2002, of which 72 events are selected with signal-to-noise ratios $3 for the estimation of site
response (SR), peak ground acceleration (PGA) and resonance frequency (RF) at all stations. With these data and inputs from IRS-1C LISS
III digital data, topo-sheets, geographical boundary of the State of Sikkim, surface geological maps, soil taxonomy map at 1:50,000 scale and
seismic refraction profiles, the seismological and geological thematic maps, namely, SR, PGA, RF, lithology, soil class, slope, drainage, and
landslide layers were generated. The geological and seismological layers are assigned normalized weights and feature ranks following a pair-
wise comparison hierarchical approach and later integrated through GIS to create the microzonation map of the region. The overall SR, PGA
and resonance frequency show an increasing trend in a NW–SE direction, peaking at Singtam in the lesser Himalaya. Six major hazard zones
are demarcated with different percentages of probability index values in the geological, seismological hazard and microzonation maps.
The maximum risk is attached to a probability greater than 78% in the Singtam and adjoining area. These maps offer generally better spatial
representation of seismic hazards including site-specific analysis as a first level microzonation attempt.
q 2004 Elsevier Ltd. All rights reserved.
Keywords: Seismic hazard; Site response; Peak ground acceleration; Resonance frequency; GIS integration; Microzonation
1. Introduction
Five major earthquakes occurred in India over the past
decade. The devastating Bhuj earthquake of 26th January
2001 is still fresh in our memory. The Himalayan region
is a 2500 km long belt from Kashmir in the west to
Arunachal Pradesh in the east. It can be divided into
several seismotectonic blocks, including the Darjeeling–
Sikkim, where a good number of moderate magnitude
earthquakes ðM $ 5:0Þ had been recorded in the past.
Global Positioning System (GPS) measurements show
that India and southern Tibet converge at a rate of
20 ^ 3 mm/year (Bilham et al., 2001). Bilham et al.
(2001) divided the Himalaya into 10 imaginary sections,
each around 220 km in length. At the observed conver-
gence rate of 20 mm/year (Bilham et al., 2001), at least 6
of these 10 regions have an accumulated slip potential of
4 m. This is equivalent to the slip believed to be
associated with the 1934 Bihar earthquake that killed
10,700 people. By 2002, the Bureau of Indian Standard
mapped four seismic zones in India, namely (i) Zone-V:
PGA of 0.4 g and above with 10% probability of
exceedence in 50 years and MMI of IX and above,
occupying about 12% of the country (ii) Zone IV: PGA
0.25 g and MMI VIII, occupying 18% of the country (iii)
Zone III: PGA 0.2 g and MMI VII, occupying 26% of the
country (iv) Zone II: PGA 0.1 g and MMI VI. However,
these zones cannot predict with certainty what ground
acceleration will be experienced by structures situated in
them. It is the level of ground acceleration, coupled with
site-specific effects, which actually buffet buildings due to
the impact of an earthquake. The Sikkim Himalaya
(Fig. 1a) is located in an earthquake-prone part of the
eastern Himalaya along the Darjeeling–Sikkim tract.
1367-9120/$ - see front matter q 2004 Elsevier Ltd. All rights reserved.
doi:10.1016/j.jseaes.2004.03.002
Journal of Asian Earth Sciences 25 (2005) 329–343
www.elsevier.com/locate/jaes
q Originally submitted for the 17 Himalaya Tibet Workshop.* Tel.: þ91-3222-283-374; fax: þ91-3222-282-268.
E-mail address: [email protected] (S.K. Nath).

Fig. 1. (a) Generalized geological map of the Himalayas, showing the different geotectonic domains and lithounits. Inset shows the location of the Sikkim
Himalaya. MBT, Main Boundary Thrust; NP, Nanga Parvat; ND, Nanda Devi. (b) Schematic geological map of the Sikkim Himalaya (after Neogi et al., 1998).
S.K. Nath / Journal of Asian Earth Sciences 25 (2005) 329–343330

The recent damaging earthquake of 1988 (M 6.7) was
distinctly felt in the Darjeeling–Sikkim Himalaya, and the
isoseismal VII contour passed through the towns of
Darjeeling and Gangtok.
It is therefore necessary to develop a microzonation map
of earthquake prone areas like Sikkim Himalaya in order to
display seismic hazards on an urban block-by block scale,
based on local conditions such as soil types that affect
ground motion levels and vulnerability to soil liquefaction.
Seismic microzonation consists of several subtasks, namely,
a study of the seismotectonic setting of a region, ground
failure susceptibility analysis, geotechnical parameteriza-
tion, spatial variation of ground motion using both weak and
strong motion recordings, estimation of site amplification
factors, study of attenuation relations, seismological
simulation of source and propagation effects (broadband
and strong motion seismometry) and thematic mapping.
To produce a microzonation map, it is important to include
site effects, a digital map of the lithological conditions, soil,
a digital map showing the topographic effect (% slope), peak
ground acceleration (PGA) and the resonance/predominant
frequency (RF) of ground motion at different sites.
The Sikkim Himalaya is considered in the present study in
order to develop a quasi-probabilistic microzonational
model at a 1:50,000 scale.
2. The Sikkim Himalaya
2.1. Regional geologic setting
In the Sikkim region, the different lithounits (Acharyya,
1998) are dispersed in an arcuate regional fold pattern
(Fig. 1b, Neogi et al., 1998). The ’core’ of the region is
occupied by Lesser Himalayan low-grade metapelites and
interbedded metapsammite belonging to the Daling Group
(Proterozoic to Mesozoic). The distal parts of the region are
characterized by medium-to high-grade crystalline rocks of
the Higher Himalayan Belt (Higher Himalayan Crystalline
Complex, HHC). A prominent ductile shear zone, the Main
Central Thrust (MCT) separates the two belts. In this region,
the MCT is the southernmost occurrence of a number of
northward-dipping ductile shear zones within the Higher
Himalayan Crystalline Complex. Gondwana (Carbonifer-
ous-Permian) and molasse-type Siwalik (Miocene–Plio-
cene) sedimentary rocks of the Sub-Himalayan Zone
(not shown in the map) occur in the southern part of the
region. In the extreme north, a thick pile of Cambrian to
Eocene fossiliferous sediments of the Tethyan Zone
(Tehtyan Sedimentary sequence, Fig. 1b) overlie the HHC
on the hanging wall side of a series of north-dipping normal
faults constituting the South Tibetan Detachment System
(STDS) (Gansser, 1964).
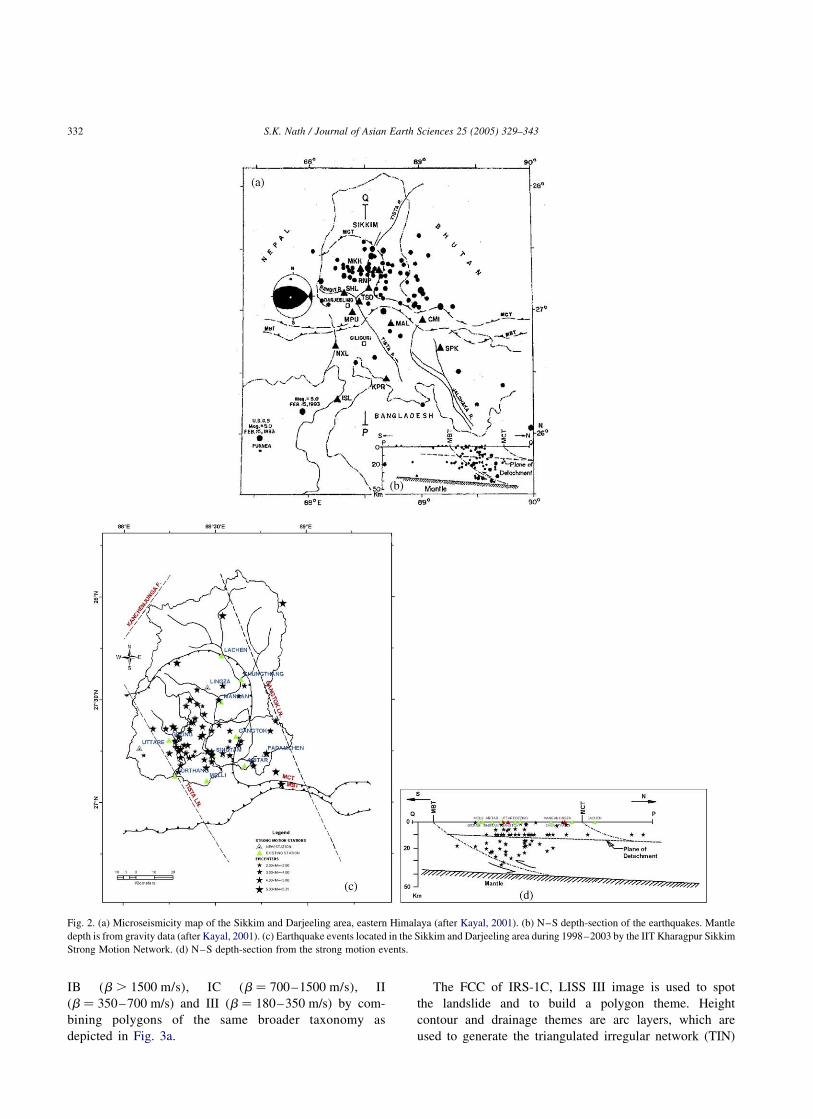
2.2. Microseismicity
Geological Survey of India in the eastern Himalaya
carried out two microearthquake surveys, one during
1992–1993 in the Darjeeling Himalaya, and the other
during 1994–1995 in the Sikkim Himalaya (De, 2000).
About 400 earthquakes were recorded and about 100
earthquakes ðMd¼ 1:0–5:0Þ are precisely located within
50 km of the networks. The epicentre map and N–S cross
section (Kayal, 2001) of the earthquakes are shown in
Fig. 2a and b. It is observed that the earthquakes are
mostly clustered to the north of MBT, at a depth range of
10–40 km, with the majority of the earthquakes occurring
below the plane of detachment (Fig. 2b). A well-
constrained composite fault plane solution for a group
of earthquakes (depth 10–40 km) shows thrust faulting
with a strike-slip component. The depth section and the
fault-plane solution suggest that the MBT is seismogenic
up to the mantle in this part of the Himalaya. The
recorded strong motion events (72 earthquakes with
magnitude between 2.2 and 5.6) also show clustering in
the same source region (Fig. 2c and d) as that of the
microearthquake survey and thus support the tectonic
model of the region.
3. Geological inputs
The geological inputs include IRS-1C LISS III digital
data of March 2000, topo-sheets from the Survey of India,
geographical boundary of the State of Sikkim, surface
geological maps (Neogi et al., 1998), soil taxonomy map
at 1:50,000 scale from National Bureau of Soil Survey
(1994) and seismic refraction profiles. All the maps and
topo-sheets were scanned at 200 DPI with a resolution of
6 m for a scale of 1:50,000 and rectified with a common
base using a Everest polyconic projection system. A
second-degree polynomial surface, fitted during the
rectification process, removed any distortion in the
scanned image. The respective features on each rectified
raster image were digitized for conversion to a vector
layer/coverage using ARC INFO GIS software. The
IRS-1C LISS III data were converted to a False Color
Composite (FCC) for the generation of multi-spectral
images, which were also rectified to the same base. The
themes thus generated are geographical boundaries of
Sikkim and its districts along with geological attributes
that include lithounits, soil taxonomy, drainage, lakes and
glaciers, height contours and landslides. In the lithounit
layer of the geological themes, the significant attribute
consists of the Higher Himalayan Crystalline rocks and
Lesser Himalaya. The physiographic zones of soil of
Sikkim from the National Bureau of Soil Survey were
vectorized and stored as the soil taxonomy GIS
coverage. The soil classification is based on composition,
grain size and lithology. Site classification is done as sites
S.K. Nath / Journal of Asian Earth Sciences 25 (2005) 329–343 331
IB (b . 1500 m/s), IC (b ¼ 700–1500 m/s), II
(b ¼ 350–700 m/s) and III (b ¼ 180–350 m/s) by com-
bining polygons of the same broader taxonomy as
depicted in Fig. 3a.
The FCC of IRS-1C, LISS III image is used to spot
the landslide and to build a polygon theme. Height
contour and drainage themes are arc layers, which are
used to generate the triangulated irregular network (TIN)
Fig. 2. (a) Microseismicity map of the Sikkim and Darjeeling area, eastern Himalaya (after Kayal, 2001). (b) N–S depth-section of the earthquakes. Mantle
depth is from gravity data (after Kayal, 2001). (c) Earthquake events located in the Sikkim and Darjeeling area during 1998–2003 by the IIT Kharagpur Sikkim
Strong Motion Network. (d) N–S depth-section from the strong motion events.
S.K. Nath / Journal of Asian Earth Sciences 25 (2005) 329–343332

Fig. 3. (a) Soil site classification and drainage coverage of Sikkim. (b) Slope map of Sikkim.
S.K. Nath / Journal of Asian Earth Sciences 25 (2005) 329–343 333

of Sikkim and later to create a ‘%slope’ layer shown in
Fig. 3b.
4. Strong motion data processing and seismological
attribute generation
A 9-station strong motion network (Fig. 4) in Sikkim
established by IIT, Kharagpur, has been operative since
1998. One Kinemetrics Altus K2 and 8 Kinemetrics Altus
ETNA high dynamic range strong motion accelerographs
were installed to continuously monitor the signals that
satisfy the event detection criteria. A trigger level of 0.02%
of the full-scale (2 g) was set for data recording.
The dynamic range of the systems is 108 dB at 200
samples/sec with an 18-bit resolution. The data for more
than 100 local earthquakes ð2:2 # M # 5:6Þ was recorded
during 1998–2002. The present analysis is based on 72
events, which were recorded with a good signal-to-noise
ratio (signal-to-background ratio $ 3). These events are
plotted in Fig. 4 on the IRS image and show a clustering in
the lesser Himalayan zone to the north of MBT. The event
recording history is presented in Table 1.
4.1. Site response estimation
The greatest challenge in estimating site response (SR)
from earthquake data is removing the source and path
effects The non-reference-site-dependent technique used
here involves deconvolution of the vertical-component
signal from the horizontal-components, so that the
obscuring effects of source function and instrument
response are removed, leaving a signal composed of
primarily S-wave conversions below the station. The
deconvolved horizontal component called the receiver
function trace is the best representation of the SR since
the local site conditions are relatively transparent to the
motion that appears on the vertical component.
Suppose a network has recorded J events by I stations
(each event may not be recorded by all I stations). Then the
amplitude spectrum of the jth event recorded at the ith
station for the kth frequency, OijðfkÞ can be written in the
frequency domain as a product of a source term EjðfkÞ; a path
Fig. 4. Strong motion network and earthquake events located on the IRS image of Sikkim.
S.K. Nath / Journal of Asian Earth Sciences 25 (2005) 329–343334

Table 1
Event recording history by the Strong Motion Network in Sikkim
Sl. no. Event (YYMMDD-HMMSS) Lat (8N) Long (8E) Mag (Mb) Depth (km) Singtam Gezing Mangan Gangtok Lachen Chungthang Jorethang Aritar Melli
1. 990307-061439.48 27-15.10 88-23.57 4.6 23.5 * * *
2. 990614-090336.11 27-26.19 88-27.05 4.9 23.1 * * *
3. 990618-093618.21 27-22.04 88-41.72 3.2 10.0 * * *
4. 990619-075749.20 27-21.21 88-21.92 3.7 14.7 * * *
5. 990702-060130.16 27-15.10 88-29.10 4.2 17.8 * * *
6. 990710-091107.85 27-21.68 88-21.48 4.0 14.6 * * *
7. 990714-060130.83 27-15.10 88-29.10 3.7 17.4 * * *
8. 000101-001129.46 27-17.87 88-35.10 4.1 10.0 * * *
9. 000407-102647.49 27-23.09 88-31.10 3.1 5.0 * * *
10. 000418-132502.59 27-31.31 88-38.10 4.1 10.0 * * *
11. 000523-035201.88 27-14.18 88-06.67 2.2 10.0 * * *
12. 000531-045313.28 27-16.12 88-34.51 3.1 7.5 * * *
13. 000531-062118.81 27-33.21 88-23.94 3.5 7.4 * * *
14. 000603-055559.17 27-12.91 88-26.35 3.0 5.6 * * *
15. 000608-083235.65 27-12.18 88-22.24 3.2 5.5 * * *
16. 000602-085141.48 27-14.06 88-25.27 5.1 22.3 * * *
17. 000607-091014.88 27-16.54 88-17.73 4.9 18.9 * * *
18. 000603-162811.84 27-17.52 87-58.57 3.2 10.0 * * *
19. 000610-120748.83 27-11.18 88-18.52 5.1 23.4 * * *
20. 000613-070908.15 27-30.10 88-21.91 3.4 10.0 * * *
21. 000616-061211.61 27-40.70 88-17.73 3.3 10.0 * * *
22. 000618-164557.29 27-23.63 88-22.84 3.6 14.9 * * *
23. 000629-042625.83 27-24.00 88-50.09 3.1 10.0 * * *
24. 000630-092717.62 27-19.67 88-26.07 3.6 6.1 * * *
25. 000704-102644.40 27-10.47 88-26.90 4.4 22.5 * * *
26. 000716-075704.02 27-12.01 88-29.10 3.3 10.0 * * *
27. 000727-032015.18 27-17.10 88-15.10 3.8 5.3 * * *
28. 000807-032152.39 27-19.32 88-25.10 3.4 10.0 * * *
29. 000807-135938.95 27-17.10 88-20.02 4.3 10.0 * * *
30. 000820-172625.34 27-21.77 88-17.20 3.0 7.8 * * *
31. 000823-070009.30 27-15.70 88-19.05 2.9 6.7 * * *
32. 000828-081613.22 27- 9.10 88-18.10 3.8 16.8 * * *
33. 000902-071511.39 27-22.05 88-16.62 4.1 10.0 * * *
34. 000904-124810.75 27-17.10 88-21.36 3.7 10.0 * * *
35. 000906-190748.59 27-30.10 88-31.10 4.5 20.6 * * *
36. 000908-021531.27 27-26.16 88-26.37 4.3 17.5 * * *
37. 000921-075141.18 27-22.96 88-31.10 5.1 17.8 * * *
38. 000925-044616.89 27-23.50 88-22.32 3.3 10.0 * * *
39. 001003-050216.82 27-13.64 88-29.10 5.1 25.3 * * *
40. 001018-142214.62 27-21.28 88-29.10 4.5 24.5 * * *
41. 001117-213502.15 27-14.51 88-32.82 3.8 10.0 * * *
42. 001123-065050.82 27-15.01 88-18.10 4.3 23.5 * * *
43. 001201-035523.01 27-12.38 88-18.81 4.3 13.0 * * *
44. 010209-095929.88 27-17.95 88-16.98 3.2 5.4 * * *
(continued on next page)
S.K
.N
ath
/Jo
urn
al
of
Asia
nE
arth
Scien
ces2
5(2
00
5)
32
9–
34
33
35

Table 1 (continued)
Sl. no. Event (YYMMDD-HMMSS) Lat (8N) Long (8E) Mag (Mb) Depth (km) Singtam Gezing Mangan Gangtok Lachen Chungthang Jorethang Aritar Melli
45. 010104-023638.89 27-13.35 88-21.46 4.1 21.3 * * *
46. 010105-180834.26 27-13.98 88-22.73 3.0 10.0 * * *
47. 011116-042438.85 27-21.48 88-10.03 4.0 19.0 * * *
48. 011115-143251.00 27-09.10 88-18.10 4.1 21.2 * * *
49. 011123-103104.04 27-22.20 88-26.18 4.8 10.0 * * *
50. 011202-224108.27 27-15.10 88-27.92 5.6 26.2 * * *
51. 011203-010022.79 27-21.56 88-14.20 3.4 3.5 * * *
52. 020316-112647.00 27-21.10 88-35.10 5.1 20.0 * * *
53. 020408-115025.80 27-28.26 88-20.47 3.0 10.0 * * *
54. 020422-093640.01 27-43.81 88-57.85 5.1 19.4 * * *
55. 020424-141804.71 27- 5.39 88-52.01 3.5 5.3 * * *
56. 020425-045812.86 27-17.08 88-37.72 5.1 22.9 * * *
57. 020425-011644.82 27- 8.86 88-49.83 4.5 10.0 * * *
58. 020425-082136.09 27-14.54 88-47.00 5.2 25.4 * * *
59. 020425-113005.57 27-19.11 88-18.10 5.1 26.4 * * *
60. 020426-030442.79 27-28.78 88-24.24 4.4 10.0 * * *
61. 020426-095755.09 27-21.10 88-35.10 4.3 10.0 * * *
62. 020426-155142.54 27-18.10 88-38.47 4.1 10.0 * * *
63. 020427-120349.41 27-34.49 88-39.58 2.5 12.1 * * *
64. 020428-054806.41 27-11.24 88-43.03 5.0 24.1 * * *
65. 020429-013853.14 27-24.67 88-23.33 3.7 6.0 * * *
66. 020429-062843.47 27-14.18 88-35.10 4.2 10.0 * * *
67. 020429-124356.14 27-12.00 88-42.25 5.0 27.8 * * *
68. 020430-064601.89 26-54.67 88-32.71 3.9 10.0 * * *
69. 020430-134913.09 27-21.07 88-48.09 3.0 9.9 * * *
70. 020501-024400.51 27-21.10 88-35.10 4.7 17.1 * * *
71. 020501-114553.25 27-34.45 88-32.43 4.4 10.0 * * *
72. 020502-102838.32 26-58.13 88-52.06 4.0 10.0 * * *
S.K
.N
ath
/Jo
urn
al
of
Asia
nE
arth
Scien
ces2
5(2
00
5)
32
9–
34
33
36

Fig. 5. Site response contours overlain on an elevation (TIN) map of Sikkim at (a) 3 Hz, and (b) 9 Hz.
S.K. Nath / Journal of Asian Earth Sciences 25 (2005) 329–343 337

term, PijðfkÞ; and a site effect term, SiðfkÞ:
OijðfkÞ ¼ EjðfkÞPijðfkÞSiðfkÞ ð1Þ
Taking the natural logarithm, Eq. (1) becomes:
ln OijðfkÞ ¼ ln EjðfkÞ þ ln PijðfkÞ þ ln SiðfkÞ ð2Þ
This linear expression often forms the basis of separating
the source, path, and site effects (Nath et al., 2000, 2002).
The processing starts with Butterworth bandpass filtering
of each accelerogram within a 0.5–16 Hz frequency range
for each event. Let the S-wave amplitude and the
background noise amplitude be AijðfkÞ and BijðfkÞ; respect-
ively. Then the signal amplitude spectrum at the frequency
fk is expressed as,
OijðfkÞ ¼ AijðfkÞ2 BijðfkÞ ð3Þ
A five-point smoothing window is chosen for all the
spectral amplitudes at the central frequencies 1, 3, 5, 7, 9
and 11 Hz to reduce randomness in the data. Thus the
receiver function SRijðfkÞ can be computed at each i site for
the jth event at the central frequency fk as,
SRijðfkÞ ¼
1ffiffi2
pffiffiffiffiffiffiffiffiffiffiffiffiffiffiffiffiffiffiffiffiffiffiffiffiffiffiffiffiffiffiffiffiffiffiffiabsHijðfkÞl
2NS þ absHijðfkÞl
2EW
q
absVijðfkÞð4Þ
where, HijðfkÞlNS;HijðfkÞlEW and VijðfkÞ are the Fourier
spectra of the NS, EW and vertical components
respectively. The event average SR contours at 3 and 9 Hz
are overlain on the elevation map of Sikkim and displayed
in Fig. 5a and b respectively.
4.2. Peak ground acceleration and resonance frequency
The peak horizontal acceleration (PGA) is the most
commonly used measure of the intensity of shaking at a site
and is taken to be the largest absolute value of the horizontal
acceleration recorded at a site. It is also possible to extract
the maximum of the vector sum of two orthogonal
components of the horizontal ground acceleration recorded
at a site. As the peak accelerations (a) and peak velocities
(v) are usually associated with motions of different
frequencies, the ratio v=a can be related to the frequency
content of the motion. For earthquake motions that include
several frequencies, the parameter 2pv=a can be interpreted
as the period of vibration of an equivalent harmonic wave,
thereby providing an indication of the predominant period
of the ground motion. Power spectrum also plays a
significant role in deciding the predominant frequency of
ground motion at each site.
4.3. Seismological thematic mapping
GIS application to seismological thematic mapping
generated strong ground motion attributes, namely, contours
of SR at the central frequencies 1, 3, 5, 7, 9, and 11 Hz;
Fig. 6. (a) Union of soil site class, lithology and site response at 5 Hz.
Drainage and PGA contours are overlain on the combined coverage.
(b) Union of soil class, lithology and site response at 5 Hz. Drainage and
resonance frequency contours are overlain on the combined coverage.
S.K. Nath / Journal of Asian Earth Sciences 25 (2005) 329–343338

PGA, and resonance frequency (RF) with built up polygon
topology having attributes classified within the range of
assigned values. The composite site-condition vector
coverage helped in the polygon interpolation of
seismological attributes using least square error energy
minimization criterion. Even the strong motion network and
epicenters of the events form two vector layers for future
overlay on the hazard map. The PGA and RF contours
overlain on the composite site condition map of Sikkim in
Fig. 6a and b show the spatial variation of strong motion
impact in the region.
5. GIS integration and microzonational model
For microzonation and hazard delineation, all of the
above themes are reclassified into two broad groups,
Geological and Seismological. A representative flow chart
for microzonation is depicted in Fig. 7. The Geological
themes include slope (S), soil (SO), lithology (G) and
landslides (L). Each theme has a weight in the 4–1 scale
depending on their contribution towards a seismic
hazard, the higher weight in this case being attached to
slope due to the rugged topography. For determining
the weight of a theme, we used Saaty’s Analytical Hierarchy
Process (Shahid et al., 2003). In this method, a matrix of
pairwise comparisons (ratios) between the factors is
constructed and used to derive the individual normalized
weights of each factor. The pairwise comparison is
performed by calculating the principal eigen vector of the
matrix and the elements of the matrix are in the range of 0 to
1 summing to ‘1’ in each column. The weights for each
theme can be calculated by averaging the values in each row
of the matrix. These weights will also sum to ‘1’ and can be
used in deriving the weighted sum of rating or scores of each
region of cells or polygon of the mapped layers. Since the
values within each thematic map/layer vary significantly,
they are classified into various ranges or types known as the
features of a layer. These features are then assigned ratings
or scores within each layer, normalized between 0–1.
Similarly, Seismological themes are also assigned
weights on the 3–1 scale. A Seismo-geological pairwise
comparison table is also generated for combined integration
of both groups taken together. The layer-wise
normalized weight and feature scores for all themes are
given in Table 2.
All of the thematic maps are registered with one another
through ground control points and integrated step-by-step
Fig. 7. Flow chart depicting quasi-probabilistic microzonation model.
S.K. Nath / Journal of Asian Earth Sciences 25 (2005) 329–343 339

using the aggregation method in GIS. The geologic
hazard potential index GHZI for the geological class is
calculated as,
GHZI ¼ ½SwSr þ SOwSOr þ GwGr þ LwLr�=Sw ð5Þ
where w represents the normalized weight of a theme
and r the normalized rank of a feature in the theme.
GHZI is a dimensionless quantity that helps in indexing
the probability of seismic hazard and hence microzona-
tion of a region. In Fig. 8a the integrated GHZI layer is
displayed with six distinct zones, namely, ,16, 16–33,
33–50, 50–66, 66–83, .83%. It is evident that the
lesser Himalaya poses a comparatively high earthquake
hazard.
Similarly, the seismological themes are integrated to
form the seismic hazard potential index layer SHZI as,
SHZI ¼ ½SRwSRr þ PGAwPGAr þ RFwRFr�=Sw ð6Þ
w being the normalized weight of a theme and r the
normalized rank of a feature in the theme. The evolved
Table 2
Normalized weight and feature rating of the thematic maps
Theme Weight Feature Rating Normalized rating
Site response 0.25 ,2.20 1 0
2.20–2.25 2 0.0556
2.25–2.30 3 0.1111
2.30–2.35 4 0.1667
· · · · · · · · ·
· · · · · · · · ·
2.90–2.95 16 0.8333
2.95–3.00 17 0.8889
3.00–3.05 18 0.9444
.3.05 19 1
Peak ground acceleration 0.2143 ,0.00115 1 0
0.00115–0.00130 2 0.0256
0.00130–0.00145 3 0.0513
0.00145–0.00160 4 0.0769
· · · · · · · · ·
· · · · · · · · ·
0.00640–0.00655 37 0.9231
0.00655–0.00670 38 0.9487
0.00670–0.00685 39 0.9744
.0.00685 40 1
Resonance frequency 0.1786 ,6.10 1 0
6.10–6.20 2 0.0333
6.20–6.30 3 0.0667
6.30–6.40 4 0.1
· · · · · · · · ·
· · · · · · · · ·
8.70–8.80 28 0.9
8.80–8.90 29 0.9333
8.90–9.00 30 0.9667
.9.00 31 1
Slope (%) 0.1429 ,15 1 0
15–30 2 0.2
31–45 3 0.4
46–60 4 0.6
61–75 5 0.8
.75 6 1
Soil (b) 0.1071 IB 1 0
IC 2 0.3333
II 3 0.6667
III 4 1
Lithology 0.0714 Higher Himalayan crystalline 1 0
Lesser Himalayan 2 1
Landslides 0.0357 No landslides 1 0
Landslides 2 1
S.K. Nath / Journal of Asian Earth Sciences 25 (2005) 329–343340

layers are displayed for SR at a central frequency of 3 Hz in
Fig. 8b. Six zones indicated as %SHZI are ,22, 22–37,
37–52, 52–67, 67–82, .82%, the highest being at the
Singtam strong motion site.
Finally, Geological and Seismological attributes are
integrated together to generate full-scale microzonation
map using CHZI as,
CHZI ¼ ½SRwSRr þ PGAwPGAr þ RFwRFr þ SwSr
þ SOwSOr þ GwGr þ LwLr�=Sw ð7Þ
The notations have their usual meanings. The combined
microzonation map is presented in Fig. 9 at a central
frequency of 3 Hz. In this layer, six major zones are again
mapped, namely ,15, 15–31, 31–47, 47–63, 63–78,
.78%. This diagram represents the first order microzona-
tion map of Sikkim.
6. Discussion and conclusions
The Darjeeling–Sikkim Himalayas are well known to
be seismically active. The microearthquake survey in the
Darjeeling and Sikkim tract (Fig. 2a and b) showed that
MBT is seismogenic down to the mantle in this region
with an estimated b-value of 0.61 (Kayal, 2001). All 72
events recorded by the strong motion network also
clustered in the same source zone (Fig. 2c and d). Fixing
of the seismicity to delineate the hazard and to determine
the resulting risk cannot be fruitfully undertaken for
macro-regions. This calls for a multi-disciplinary effort on
the part of scientists and engineers to create a seismic
hazard map through microzonation by incorporating a
variety of factors including geology, topography, sub-soil
condition, building morphology, earthquake ground
motion amplification, etc.
The process of overlaying, combining and finally
integration of various geologic and seismologic maps
are complicated spatial operations that are optimally
performed in a GIS environment. The integration of
lithounit, soil site class and slope coverages provide the
site-condition of the Sikkim region on which the
seismological attributes are overlain. The South Sikkim
exhibits higher SR values (Fig. 5) compared to the North,
which is mostly covered by competent bedrock. The
South Sikkim, being mostly covered by coarse textured
skeletal soils susceptible to water erosion and landslide
hazards, represents weak geological formations and hence
has higher site amplification values. This is also the case
with PGA and RF (Fig. 6). The overall PGA and
resonance frequencies in the lesser Himalaya are much
higher than those in the higher Himalayan crystalline
rocks, the northern Sikkim being seismically more stable.
As MBT is approached, the attribute values increase
further. Referring to Fig. 8b, six SHI zones with ,22,
22–37, 37–52, 52–67, 67–82, .82% at 3 Hz could be
Fig. 8. (a) Hazard zonation map of Sikkim by GIS integration of
geological attributes (low frequency site effects centered at 3 Hz).
(b) Seismic hazard zonation map of Sikkim by GIS integration of strong
motion data generated seismological attributes (low frequency site effects
centered at 3 Hz).
S.K. Nath / Journal of Asian Earth Sciences 25 (2005) 329–343 341

identified, the maximum seismic hazard probability being
at the strong motion site of Singtam. These zones can be
qualitatively classified as no-hazard to having a maximum
probability of experiencing earthquake hazard, with low,
fair, moderate and high hazard potentials in between. In
the microzonation vector layer of integrated seismological
and geological themes (Fig. 9), again six major zones are
mapped, namely ,15, 15–31, 31–47, 47–63, 63–78,
.78% at the low frequency end, with similar
probabilistic risk classifications. The maximum risk is
attached to a probability greater than 78% in the Singtam
and adjoining area.
The advantage of using GIS for seismic hazard mapping
lies in its capability to calculate areas and lengths of
geometric features.
The microzonation map presented here may be useful
for land use planning or for making hazard mitigation
decisions. The geologic site condition map is an
initial model to describe areas that may exhibit
different seismic shaking characteristics during future
earthquakes.
Acknowledgements
The author is grateful for the support provided by the
Department of Science and Technology, Government
of India under the earmarked research grants
DST/23(97)/ESS/95 and DST/23(218)/ESS/98. Department
of Science and Technology, Government of Sikkim helped
in monitoring the strong motion network in the interior of
Sikkim. The critical review and constructive suggestions of
the anonymous referees and the editorial board have
significantly enhanced the paper’s contents with better
scientific exposition.
References
Acharyya, S.K., 1998. Thrust tectonics and evolution of domes and the
syntaxis in eastern Himalaya, India. Proceeding of the Second Nepal
Geological Congress 18, 1–18.
Fig. 9. Seismic microzonation map of Sikkim by GIS integration of major geological and strong motion data generated seismological attributes.
S.K. Nath / Journal of Asian Earth Sciences 25 (2005) 329–343342

Bilham, R., Gaur, V.K., Molnar, P., 2001. Himalayan seismic hazard.
Science 293, 1442–1444.
De, R., 2000. A microearthquake survey in the Himalayan Foredeep region,
Sikkim Himalaya. Journal of Geophysics XXI, 1–8.
Gansser, A., 1964. Geology of Himalayas, Interscience Publication, New
York, pp. 28.
Kayal, J.R., 2001. Microearthquake activity in some parts of the Himalaya
and the tectonic model. Tectonophysics 339, 331–351.
National Bureau of Soil Survey (1994). Master Plan for Irrigation
Development, Sikkim, Govt. of Sikkim, Agricultural Finance Corpor-
ation Ltd., Report, 2, 35–47.
Neogi, S., Dasgupta, S., Fukuoka, M., 1998. High, P-T Polymetamorphism,
Dehydration Melting, and Generation of Migmatites and Granites in the
Higher Himalayan Crystalline Complex, Sikkim, India. Journal of
Petrology 38, 61–99.
Nath, S.K., Sengupta, P., Sengupta, S., Chakarabarti, A., 2000. Site
response estimation using Strong Motion network: a step towards
microzonation of Sikkim Himalayas, Seismology 2000. Current
Science 79, 1316–1326.
Nath, S.K., Sengupta, P., Kayal, J.R., 2002. Determination of Site Response
at Garhwal Himalaya from the aftershock sequence of 1999 Chamoli
Earthquake. Bulletin of Seismological Society of America 92,
1072–1081.
Shahid, S., Nath, S.K., Kamal, A.S.M.M., 2003. GIS integration of remote
sensing and topographic data using fuzzy logic for ground water
assessment in Midnapur District, India. Geo-carto International.
S.K. Nath / Journal of Asian Earth Sciences 25 (2005) 329–343 343