
An Eye-Opening Approach to Developing and Communicating ...
9
University of Richmond UR Scholarship Repository Geography and the Environment Faculty Publications Geography and the Environment 2007 An Eye-Opening Approach to Developing and Communicating Integrated Environmental Assessments Todd R. Lookingbill University of Richmond, [email protected] William C. Dennison Tim J.B. Carruthers Jane M. Hawkey Shawn L. Carter Follow this and additional works at: hp://scholarship.richmond.edu/geography-faculty- publications Part of the Design of Experiments and Sample Surveys Commons , and the Other Forestry and Forest Sciences Commons is Article is brought to you for free and open access by the Geography and the Environment at UR Scholarship Repository. It has been accepted for inclusion in Geography and the Environment Faculty Publications by an authorized administrator of UR Scholarship Repository. For more information, please contact [email protected]. Recommended Citation Dennison, William C., Todd R. Lookingbill, Tim J.B. Carruthers, Jane M. Hawkey, and Shawn L. Carter. "An Eye-opening Approach to Developing and Communicating Integrated Environmental Assessments." Frontiers in Ecology and the Environment 5, no. 6 (2007): 307-14. doi:10.1890/1540-9295(2007)5[307:AEATDA]2.0.CO;2.
Transcript of An Eye-Opening Approach to Developing and Communicating ...
University of RichmondUR Scholarship Repository
Geography and the Environment FacultyPublications Geography and the Environment
2007
An Eye-Opening Approach to Developing andCommunicating Integrated EnvironmentalAssessmentsTodd R. LookingbillUniversity of Richmond, [email protected]
William C. Dennison
Tim J.B. Carruthers
Jane M. Hawkey
Shawn L. Carter
Follow this and additional works at: http://scholarship.richmond.edu/geography-faculty-publications
Part of the Design of Experiments and Sample Surveys Commons, and the Other Forestry andForest Sciences Commons
This Article is brought to you for free and open access by the Geography and the Environment at UR Scholarship Repository. It has been accepted forinclusion in Geography and the Environment Faculty Publications by an authorized administrator of UR Scholarship Repository. For moreinformation, please contact [email protected].
Recommended CitationDennison, William C., Todd R. Lookingbill, Tim J.B. Carruthers, Jane M. Hawkey, and Shawn L. Carter. "An Eye-opening Approach toDeveloping and Communicating Integrated Environmental Assessments." Frontiers in Ecology and the Environment 5, no. 6 (2007):307-14. doi:10.1890/1540-9295(2007)5[307:AEATDA]2.0.CO;2.
REVIEWS REVIEWS REVIEWS
An eye-opening approach to developing and
communicating integrated environmental
assessments
William C Dennison1, Todd R Lookingbill2, rim JB Carruthers', Jane M Hawkey', and Shawn L Carter3
Communication among managers, the public, and scientists is the key to successful ecosystem management; however, the varied perspectives and interests of these groups can make such communication difficult. One way to achieve effective communication is to develop a common knowledge base by combining syntheses of key sci entific results with information-rich visual elements. Within a management landscape, integrated environmen tal assessments provide a useful framework for evaluating resources and directing management efforts. The inte grated assessment process involves (1) initial investigation, (2) development of a conceptual framework, (3) data navigation, (4) environmental report cards, and (5) science communication. Each step requires the synthesis and visualization of information on the status and trends connected with multiple natural resources. We provide a case study, using examples from selected National Park Service sites in the mid-Atlantic region of the United States. Visual elements (conceptual diagrams, maps, graphs, tables, and photographs) were used to facilitate com parative assessments and to provide a more visual, or "eye-opening", approach to effective environmental deci sion making.
Front Ecol Environ 2007; 5(6): 307-314
-i
Land managers face a variety of challenges, involving threats at different spatial and temporal scales (eg
global change, development along management bound aries, pollution from outside protected areas, and intro ductions of invasive plants, animals, and pathogens). Effective resource management relies upon having and understanding scientific data on the status, trends, and interactions among these elements. Integrated environ
mental assessments provide a tool for evaluating and redi recting management efforts relative to multiple resources and threats (Grumbine 1994; Christensen et al. 1996;
In a nutshell: * The process of developing and communicating an integrated
ecosystem assessment creates common ground between multi ple stakeholders and is as important as the product itself
* Once the visual elements are accumulated to communicate an integrated assessment, they form a valuable resource for all stakeholders
* Visual elements summarize and synthesize information in a widely understandable format
* Conceptual diagrams ("thought drawings") are powerful tools that link key ecosystem features, environmental indicators, and major threats
Pantus and Dennison 2005; Reagan 2006). A common challenge facing assessment programs is the effective inte gration, interpretation, and communication of monitoring data among the various stakeholders (Barker 2006). The importance of visual elements in this process cannot be overstated. Conceptual diagrams are a central tenet in sci ence communication and these symbol-based drawings allow ecosystem features and threats to be summarized in self-contained visual representations of key ecosystem processes. These diagrams provide the context (spatial, temporal, and ecological) for informed management deci sion making. Various environmental indicators can be added to the visualizations, providing the link between ecosystem processes and the ecosystem measures used in the assessment. The conceptual synthesis of processes and threats can also be placed into a model framework, which can be used to test specific hypotheses regarding manage
ment actions (Kershner 1997; Harris et al. 2003). In developing methods for environmental monitoring
at National Park Service (NPS) sites in the mid-Atlantic region, we have established a process for interpreting and communicating integrated assessments that is greatly enhanced by visual elements. The process begins with investigations, based on local expertise, followed by the development of a conceptual synthesis, comprising both conceptual diagrams and ecological models, a data navi gation system, an environmental report card, and a sci ence communication framework. The initial investiga tion phase synthesizes current understanding of the system and identifies critical resources, high priority threats, and knowledge gaps. Visual representations of
'Integration and Application Network, University of Maryland
Center for Environmental Science, Cambridge, MD 21613
(dennison~umces.edu); 2Appalachian Laboratory, University of Maryland Center for Environmental Science, Frostburg, MD 21532;
3National Park Service, National Capital Region, Center for Urban
Ecology, Washington, DC 20007
C The Ecological Society of America www.froniersinecolo.org

Integrated environmental assessments WC Dennison et al.
I
~~~~~~''~~~~~~~~~~~~~~!-- ~ ~ ~ ~ ~ ~ ~ ~ ~ ~ Se r
Baltmrn
*4~~~ sei~~~~~?. eru
o Appalachian Plateau alr
fl1 Blue Ridge
]Piedmont
LIcoastal
*National Park
Figure 1. Locations of the national parks (red) in the mid-Atlantic region used in the
integrated environmental assessment process: (1) Antietam National Battlefield, (2) Catoctin Mountain Park, (3) Chesapeake and Ohio Canal National Historic Park,
(4) George Washington Memorial Parkway, (5) Harpers Ferry National Historic Park, (6) Manassas National Battlefield Park, (7) Monocacy National Battlefield, (8) National Capital Parks-East, (9) Prince William Forest Park, (10) Rock Creek Park, and ( 11) Wolf Trap National Park for the Performing Arts.
approach. The development of concep tual diagrams is playing a key role in this effort for various NPS sites in the mid
Atlantic, including Antietam National Battlefield, Assateague Island National Seashore, Chesapeake and Ohio Canal National Historical Park, Prince William Forest Park, and Rock Creek Park (Figure 1). These parks represent a spectrum of historic, natural resource, and cultural values. They range widely in size, usage, and surrounding land use. In total, the parks of this region cover over 50000 ha and span four physio graphic provinces: Atlantic Coastal Plain, Piedmont Plateau, Blue Ridge
Mountains, and Ridge and Valley. While the area is only 1% of the land managed by the NPS, these parks receive approxi mately 14% of nationwide NPS visita tions (NPS 1999). All of the parks lie within the rapidly
developing Chesapeake Bay watershed and coastal bays of the Atlantic Ocean (Figure 1). Although most of the
Chesapeake Bay watershed (more than 90%) remains agricultural or forested
the system can facilitate communication by encouraging resource experts to work toward consensus on the most important ecosystem attributes and on the relationships that need to be included in the diagrams.
All stages of the process benefit from carefully con structed visualizations of thoughts and data, but the com bination of graphs, tables, pictures, and diagrams is par ticularly crucial to the effective communication of analysis results. Visualizations and conceptual diagrams can act as a communal language among scientists, man agers, and stakeholders, providing a common knowledge base for further communication. This holistic approach has proven successful in helping diverse stakeholders to prioritize monitoring needs within NPS sites in the National Capital Region.
* Environmental setting
The NPS is implementing a series of programs designed to provide a stronger scientific basis for its management actions (NPS 1999; Kaiser 2000). The Inventory and
Monitoring program was established to fulfill this mission by creating a comprehensive assessment of the status and trends of park natural resources. This initiative involves obtaining the appropriate data, developing ways to ana lyze this data, and creating mechanisms to communicate the understanding that results from data analysis. This represents a major departure from previous NPS activities and includes a partnership with academia to facilitate the development of an integrated environmental assessment
(Jaworski et al. 1997), the rate of urban growth in the region is among the fastest in the country. Between 1973 and 1996, the rate of urban expansion around
2 Washington, DC, was approximately 22 km per year (Masek et al. 2000), and the US Census Bureau reported a 30% increase in population in the counties surrounding the District of Columbia from 2000 to 2003.
The large and increasing population density of the region results in extremely heavy use of the national parks. The George Washington Memorial Parkway alone had over seven million recreational visits in 2004, mak ing it the sixth most-visited park within the National Park Service system (Barna and Gaumer 2005). Many of the management issues in these national parks are related to increasing urbanization. In a regional context, small urban parks act as important refugia in conserving rem nants of the natural heritage disappearing from the land scape (Falkner and Stohlgren 1997). Healthy native habitats within densely settled areas also offer consider able social, economic, and educational benefits (Pickett et al. 2001). The conceptual diagram process offers a
method for infusing these diverse resource values and stressors into discussions of the natural resource manage
ment and scientific research conducted in the parks.
* Initial investigation
The initial investigation phase involves an attempt to capture the current understanding of the system, identify knowledge gaps, and synthesize inputs from various stake
wwwdfrontienineologyrg C The Ecological Society of America
WC Dennison et al. Integrated environmental assessments
holders, local experts, and managers. This can be accom plished by reviewing available written accounts and solic iting verbal inputs through interviews and/or workshops. It is helpful, at this stage, to identify and ultimately inte grate the structural elements (habitats, species, geomor phology) and key processes of the system (limiting fac tors, disturbance, biogeochemical cycles, physics, threats).
The process of developing first drafts of conceptual dia grams provides a central focus in working toward consen sus on the key structural and functional properties of an ecosystem. Conceptual diagrams can help to clarify thinking; words can be ambiguous, but images link to the
message being portrayed. They facilitate communication, both one-way (the presentation of the idea) and two-way (idea development). By providing both context and syn thesis, the process of developing conceptual diagrams can be used to identify knowledge gaps, priorities, and other essential elements.
* Conceptual framework
Synthesis of the knowledge gained in the initial investiga tion of the key elements, the main stressors, and the princi pal management objectives can be used to develop a con ceptual framework. This can be presented in two ways: (1) as conceptual diagrams that are intended to be dynamic and are the primary communication tool among scientists, managers, and stakeholders, and (2) as conceptual models, which can be used to explore specific hypotheses related to the success of management actions (Carruthers et al. 2002;
Harris et al. 2003). This combination of products provides a scalable set of hypotheses regarding the key attributes and threats to urban parks. The integration of conceptual dia grams into the process of model construction helps to syn thesize regional issues while also communicating details of system processes. Where data are available, this empirical evidence is captured in the conceptual framework. However, where this is not the case, the diagrams and models capture key ideas and qualitative information in a formalized framework that can later be refined and quanti fied (Jackson et al. 2000).
Figure 2a provides an example of a conceptual diagram created during a workshop of NPS staff (NCRN 2006). The parks of the mid-Atlantic region protect nationally and regionally important water, forest and grassland, wildlife, and cultural and recreational resources. The major threats that these parks face were identified as urban encroachment adjacent to parks (associated with increases in water and air pollution, disease outbreaks, and invasive and pest species), and transportation or util ity corridors that pass through parks (associated with interruptions of the natural flow of water and movements of biota). This diagram represents generic park processes throughout the entire network of parks, rather than at a specific geographic location. Conceptual diagrams use symbols to generate self
(a)
I
I I
II
II
I
4 -d Wildlife
K Historic sites
%'> Recreation
4ff,#Ak Agriculture
=~ Impervil surface
I Transportation
Ago Water quality
,oIlk, Water quantity
. Point source pollution
Pest alls
Loss of forest/grass
I Elevated air temperature
_ Air pollution
(b) Natural system I Urbanized system
Forests, grasslands, wetlands, and meandering streams represent the natural state of the environment. Rainfall permeates natural surfacesi., and recharges 4 the shallow groundwater layer and the deeper drinking water aquifer.
Groundwater supplies a baseflow for streams by percolating _. through stream banks and stream bottoms. Forests ? and wetlands i provide a natural buffer for absorption of pollutants and interception and storage of rainfall. Overland flow C is slowed by vegetation.
City and suburban development increase impervious surface e Impervious surfaces provide pa ways for direct transport of pollutants and sewage At into streams and rivers. Impervious surfaces also prevent rainfall I from penetrating* into the groundwater and drinking
water aquifer. Lowered groundwater levels provide less input It for stream baseflow. Increased water flow from development causes stream erosion from both the banksZand the stream bottom , causing the stream to widen and deepen.
Figure 2. Generalized National Park conceptual diagrams: (a) highlighting key resources and key threats, and (b) detailing changes in stream processes with urbanization.
explanatory, self-contained figures that represent synthe sized concepts and knowledge (IAN 2006). The concep tual diagram for the national parks of the National
Capital Region (Figure 2a) acts as a general ecosystem model, depicting the key features and major threats to the region's parks. The diagram was reviewed and refined by regional park managers and represents their broad
? The Ecological Society of America wwwl eonfieninecologyog
Integrated environmental assessments WC Dennison et al.
I
Industrial/ Arclua Electric utilities Transportation commerciall land use residential ln s
Aerial Urban Sewage Animal deposition runoff treatment manure Fertilizer
plants ",.Impervious I Winter
NAAQS -'surfaces BNR BM<Pcrop
Forests -* Streams
Geomorphology
\ ~~~~ /
/l~~~~~nstrearn
[ rocessing Biota
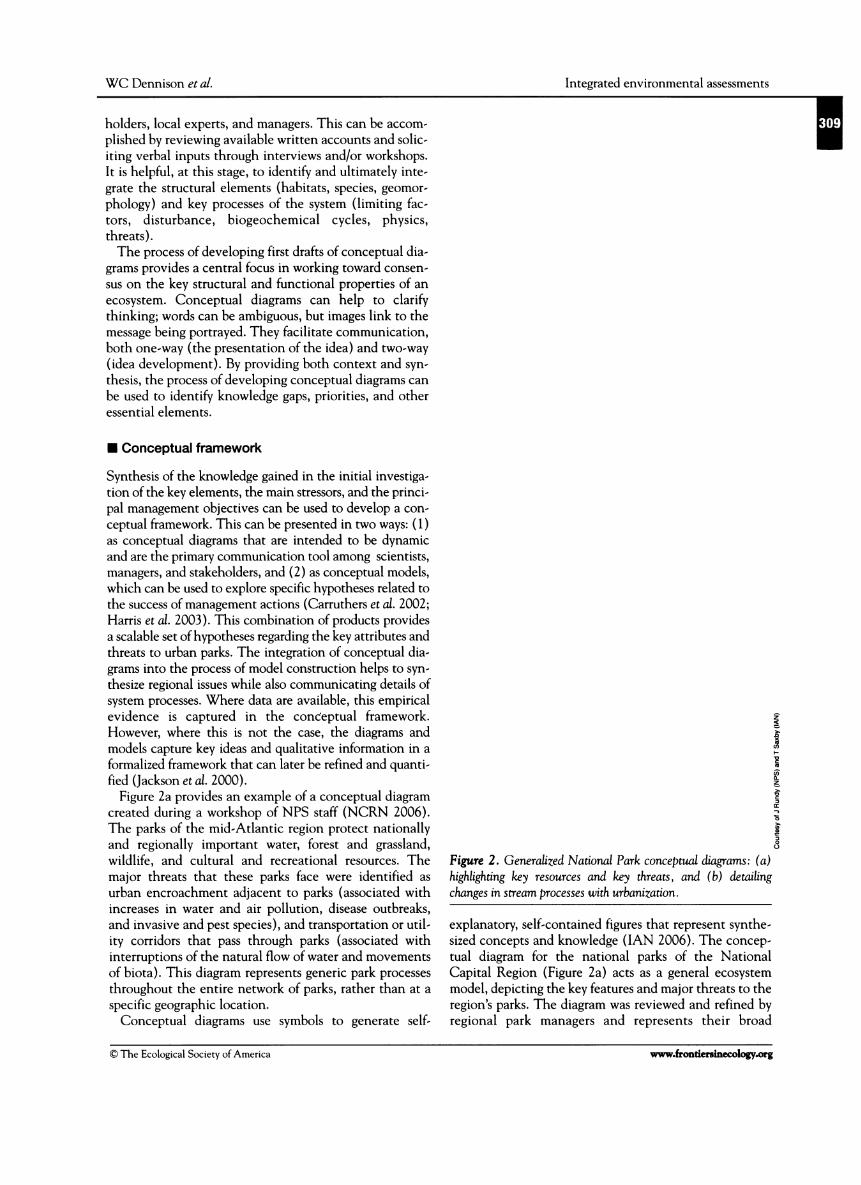
Figure 3. A conceptual stressor-effect model of the nitrogen cycle from the perspective of National Park streams. Boxes represent sources of nitrogen from adjacent lands (brown), stressor pathways (blue), and standing nitrogen stocks in National Parks (green). Controls on input processes are represented by bow tie symbols. NAAQS = national ambient air quality standards, BNR = biological nutrient removal, and BMP = best management practice.
is a multi-layered, supportive dataset, which requires careful organization to ensure effec tive navigation and therefore efficient uti lization of the data.
* Data navigation
Efficient use and dissemination of data are essential to the integrated ecological assess
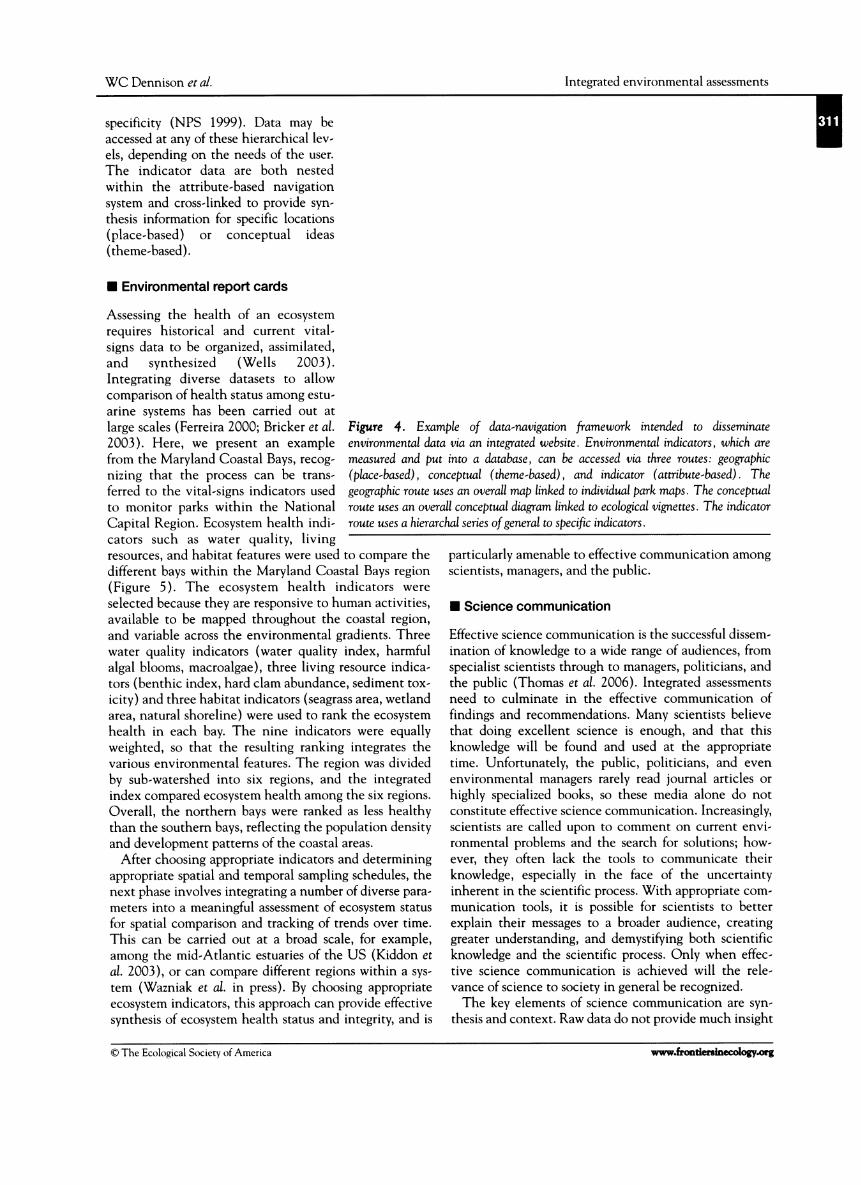
ment process. A data navigation system pro vides a means to access, analyze, and inter pret assessment data (Figure 4). The logic pathway may be geographic (place-based), conceptual (theme-based), and/or associ ated with indicators (attribute-based). This multi-access approach to monitored data, as well as different graphical and spatial syn theses, is intended to assist in database querying through web-based hyperlinking.
Place-based navigation uses spatially nested. ;eo-referenced diagrams to define
hypotheses regarding the resources and the stressors of concern in relation to their management activities. Diagrams can be nested to capture greater detail for issues or locations needing special attention. One priority issue raised by the managers was the influence of development (specifically impervious surfaces) on the streams and rivers that act as the primary drinking-water supply for the region (Figure 2b).
The information gained during the initial investigation phase can also be used to construct detailed models of specific ecological processes of concern. We followed a formal approach to develop, apply, and test hypotheses concerning park management, using conceptual ecologi cal models (Sutter 1999; Woodward et al. 1999). The multi-step method uses a nested set of models to provide an overview of important ecological interactions and to explore in depth the mechanisms for the small subset of ecological processes deemed most critical for protecting natural resources. A generalized model provides a sum mary of the system, and is useful for facilitating communi cation among scientists, managers, and the public. More detailed models can then be constructed in response to specific management or research objectives. The objects and relationships in the qualitative models can be trans lated into quantitative models once data are available and appropriate hypotheses have been identified (Haefner 1996). The role of increased nitrogen loading to these systems has received special attention (Driscoll et al. 2003; Groffman et al. 2003), and a more detailed qual itative model can be used to explore the mechanisms associated with nitrogen cycling in urban landscapes (Figure 3). This model traces the specific pathways from stressors to putative ecological damage, and can be read ily converted to a quantitative framework (eg the arrows in the model can be parameterized using monitoring data). Underlying these facilitated conceptual syntheses
the spatial extent of the ecological process or indicator of interest. In our example, we defined the mid-Atlantic region by physiographic province and subdivided the region into 11 park-based diagrams. Each park model contains a specific suite of indicators and objectives that were defined through investigation and the conceptual framework process. Depending on the maturity of the
monitoring program, knowledge of these processes may be observational, based on data, or a summary of pub lished literature. A benefit of place-based navigation is that users (ie park managers) can more easily determine
where particular indicators are being monitored within a park, thereby increasing the possibility of bundling related monitoring or research efforts.
Theme-based navigation makes use of conceptual dia grams to represent biological themes. It provides an intu itive link between the data and the thematic overview diagram developed as part of the initial investigation (Figure 2a). An additional data entry point was a series of
models constructed to reflect the National Research Council's priority environmental research challenges (biogeochemical cycles, biological diversity, climate vari ability, hydrologic forecasting, infectious disease, and land-use dynamics; NRC 2001). Unlike place-based dia grams, which define the unique resources of a particular park, theme-based diagrams are used to find commonali ties in threats to, or value of, resources. Theme-based dia grams describe broad-scale, complex ecological relation ships and are more likely to draw upon data for a suite of indicators (eg air quality) than on any particular attribute. Attribute-based navigation is based on collecting eco
logical data, which can ultimately be used for indicator reporting, to assess comparative ecosystem health of parks.
The National Park Service's Inventory and Monitoring program has constructed a tiered framework that organizes monitoring indicators ("vital signs") into three levels of
www.frontfiersnecologyog ? The Ecological Society of America
WC Dennison et al. Integrated environmental assessments
specificity (NPS 1999). Data may be accessed at any of these hierarchical lev els, depending on the needs of the user. The indicator data are both nested within the attribute-based navigation system and cross-linked to provide syn thesis information for specific locations (place-based) or conceptual ideas (theme-based).
* Environmental report cards
Assessing the health of an ecosystem requires historical and current vital signs data to be organized, assimilated, and synthesized (Wells 2003). Integrating diverse datasets to allow comparison of health status among estu arine systems has been carried out at large scales (Ferreira 2000; Bricker et al. 2003). Here, we present an example from the Maryland Coastal Bays, recog nizing that the process can be trans ferred to the vital-signs indicators used to monitor parks within the National
Capital Region. Ecosystem health indi cators such as water quality, living
Geographic Conceptual Indicator Reporting
All o~~~~~~~esew I ~
PakA 1 0 0 1
11 1 1 0
C 0 1 1 0.1
Figure 4. Example of * data-navigatonframewor intendedtodisseint
-. ~~~~~~~~~~~~~~ ~~~~U 4
SA0u0O bhm a mm 89"
nta ParktA 'Issue: Water Quality
Park A Metrics
010 Concudratmon
sam 0D: xvz CMgar 0111i0 0.cis 0S 02 lift ~ ~ ~~~~~~~~~111 4 1.0 02
Figure 4. Example of data-navigation framework intended to disseminate
environmental data via an integrated website. Environmental indicators, which are
measured and put into a database, can be accessed via three routes: geographic (place-based), conceptual (theme-based), and indicator (attribute-based). The geographic route uses an overall map linked to individual park maps. The conceptual route uses an overall conceptual diagram linked to ecological vignettes. The indicator route uses a hierarchal series of general to specific indicators.
I
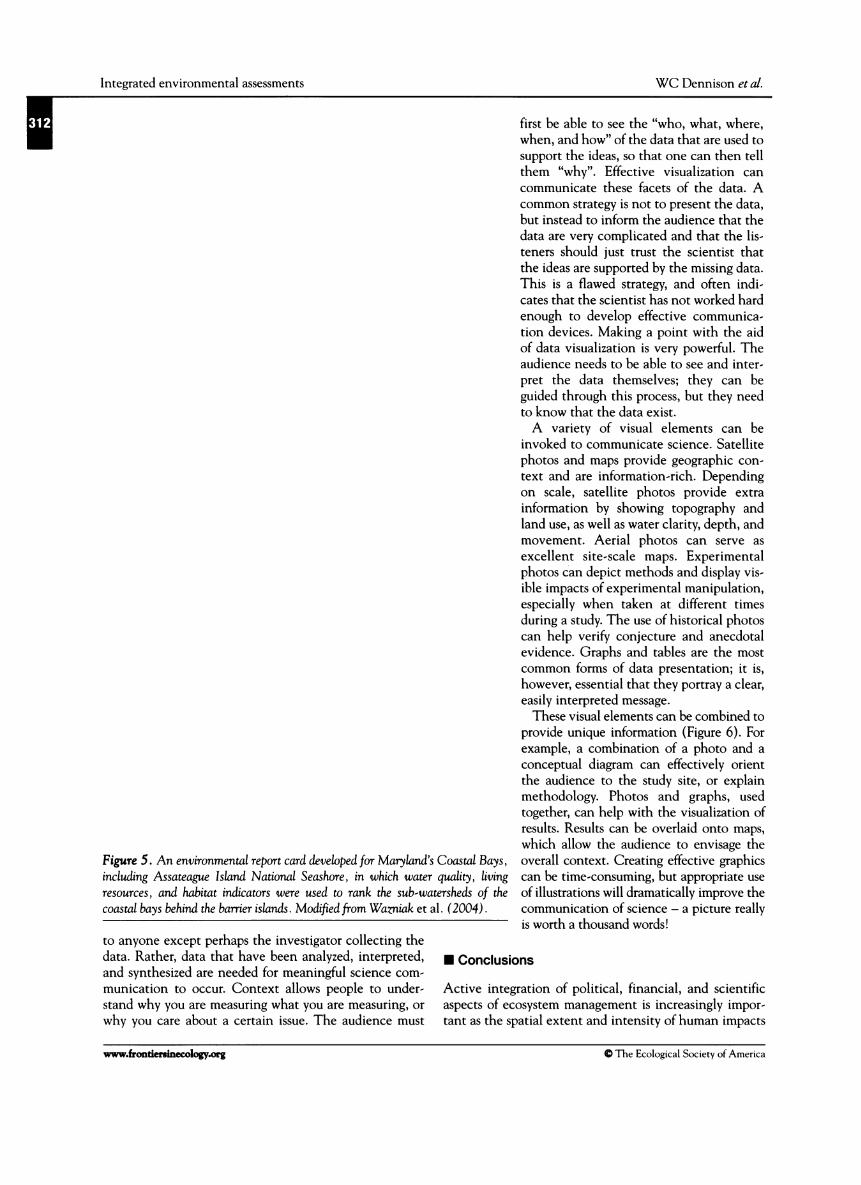
resources, and habitat features were used to compare the different bays within the Maryland Coastal Bays region (Figure 5). The ecosystem health indicators were selected because they are responsive to human activities, available to be mapped throughout the coastal region, and variable across the environmental gradients. Three water quality indicators (water quality index, harmful algal blooms, macroalgae), three living resource indica tors (benthic index, hard clam abundance, sediment tox icity) and three habitat indicators (seagrass area, wetland area, natural shoreline) were used to rank the ecosystem health in each bay. The nine indicators were equally weighted, so that the resulting ranking integrates the various environmental features. The region was divided by sub-watershed into six regions, and the integrated index compared ecosystem health among the six regions.
Overall, the northern bays were ranked as less healthy than the southern bays, reflecting the population density and development patterns of the coastal areas.
After choosing appropriate indicators and determining appropriate spatial and temporal sampling schedules, the next phase involves integrating a number of diverse para meters into a meaningful assessment of ecosystem status for spatial comparison and tracking of trends over time. This can be carried out at a broad scale, for example, among the mid-Atlantic estuaries of the US (Kiddon et al. 2003), or can compare different regions within a sys tem (Wazniak et al. in press). By choosing appropriate ecosystem indicators, this approach can provide effective synthesis of ecosystem health status and integrity, and is
particularly amenable to effective communication among scientists, managers, and the public.
* Science communication
Effective science communication is the successful dissem ination of knowledge to a wide range of audiences, from specialist scientists through to managers, politicians, and the public (Thomas et al. 2006). Integrated assessments need to culminate in the effective communication of findings and recommendations. Many scientists believe that doing excellent science is enough, and that this knowledge will be found and used at the appropriate time. Unfortunately, the public, politicians, and even environmental managers rarely read journal articles or highly specialized books, so these media alone do not constitute effective science communication. Increasingly, scientists are called upon to comment on current envi ronmental problems and the search for solutions; how ever, they often lack the tools to communicate their knowledge, especially in the face of the uncertainty inherent in the scientific process. With appropriate com
munication tools, it is possible for scientists to better explain their messages to a broader audience, creating greater understanding, and demystifying both scientific knowledge and the scientific process. Only when effec tive science communication is achieved will the rele vance of science to society in general be recognized.
The key elements of science communication are syn thesis and context. Raw data do not provide much insight
? The Ecological Society of America www fentineclopgg
Integrated environmental assessments WC Dennison et al.
I
EduwIue hsf Index
Wowqusf a uomph)le agL4l
TotS Nlogen (mg LIP Toal phiphon ('g L')' Deolved oxygn (nu Led
aBrownd (meaxe ilL ? Mlcrodgl blommee(nex.gm' u~m -sow
Hind dam dwoy (don m9 GSeenh Hoky'm
Segom ae (% of ey)' WelenW da (% of wetehe)p NavelW ehorlIe km% of OWm)'
-CO BONEPO NE INK~~STARN
HEALTH HEALTH
0.9 0.7 0.6 0. OA 0.1
first be able to see the "who, what, where, when, and how" of the data that are used to support the ideas, so that one can then tell them "why". Effective visualization can communicate these facets of the data. A common strategy is not to present the data, but instead to inform the audience that the data are very complicated and that the lis teners should just trust the scientist that the ideas are supported by the missing data.
This is a flawed strategy, and often indi cates that the scientist has not worked hard enough to develop effective communica tion devices. Making a point with the aid of data visualization is very powerful. The audience needs to be able to see and inter pret the data themselves; they can be guided through this process, but they need to know that the data exist. A variety of visual elements can be
invoked to communicate science. Satellite photos and maps provide geographic con text and are information-rich. Depending on scale, satellite photos provide extra information by showing topography and land use, as well as water clarity, depth, and
movement. Aerial photos can serve as excellent site-scale maps. Experimental photos can depict methods and display vis ible impacts of experimental manipulation, especially when taken at different times during a study. The use of historical photos can help verify conjecture and anecdotal evidence. Graphs and tables are the most common forms of data presentation; it is, however, essential that they portray a clear, easily interpreted message.
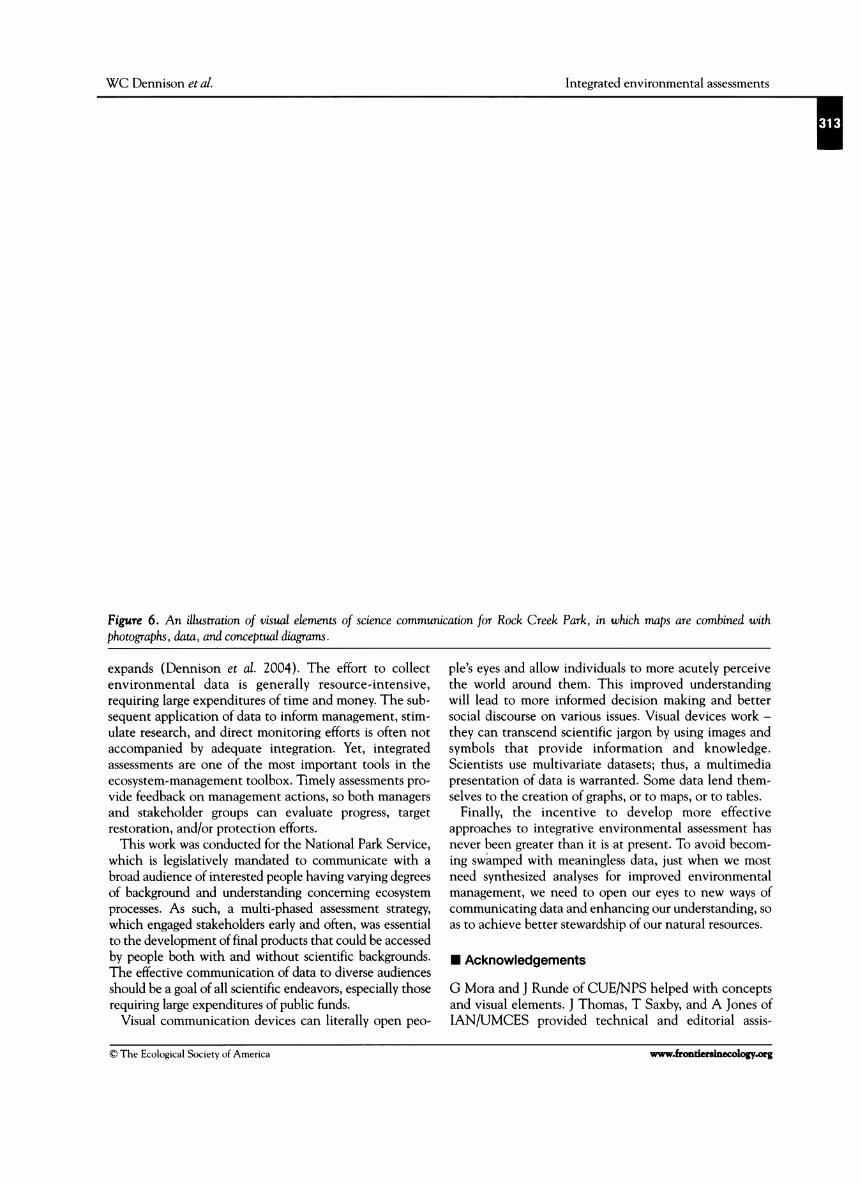
These visual elements can be combined to provide unique information (Figure 6). For example, a combination of a photo and a conceptual diagram can effectively orient the audience to the study site, or explain
methodology. Photos and graphs, used together, can help with the visualization of results. Results can be overlaid onto maps,
which allow the audience to envisage the overall context. Creating effective graphics can be time-consuming, but appropriate use of illustrations will dramatically improve the communication of science - a picture really ic. wunrth n rhniinnrJ wor(Ic!
1. Rangeom O (nDo a osi cr1 mut)t bi (a ortiala mt). Caulad om d ph a. tolA nron & phosphorus and dissolvds oxygen 2 Medan of month massuraents torn 2001 throug 20083, frm 57 dtL &. Mfdmum vluaas
mond -tre amos l90at 15 als 4. Surey of a8 An tdrxhoutthe Coal Bays hI 2001 and 2003. 5. Cobmna rn of benthic fauna ue from S4s3115 _b sn 2000 and 2001. Rag. hrm I (poor) 6 (good). &Avsag fm 1994-2000 fom Iold 1490 ala. _Apprt ElthThr ldomblns crod les rg ddof dana.measur bn 1901-19 6 from 00 aas. 6.200Q aer photographicaurvey. *. ur cnd out h 16 and 196.16. A .hohnowashlcurvevcanbdouth im.
'_ Sub-watershed
St* Marnotineague
Figure 5. An environmental report card developed for Maryland's Coastal Bays, including Assateague Island National Seashore, in which water quality, living resources, and habitat indicators were used to rank the sub-watersheds of the coastal bays behind the barrier islands. Modified from Wazniak et at. (2004) .
to anyone except perhaps the investigator collecting the data. Rather, data that have been analyzed, interpreted, and synthesized are needed for meaningful science com
munication to occur. Context allows people to under stand why you are measuring what you are measuring, or why you care about a certain issue. The audience must
* Conclusions
Active integration of political, financial, and scientific aspects of ecosystem management is increasingly impor tant as the spatial extent and intensity of human impacts
www.frondeunecology.org C The Ecological Society of America
WC Dennison et al. Integrated environmental assessments
Text
Pioneering the Value of Urba Parks
Mock Cmek Perk Isoneeof to ege un ps In the Unhd Stm _
awide valet of nadural hMtrwcal wed re e It mlof Wslhngto DC Tmw we4ocatfth Xwe sunarwow*wh Ir-uitd of aFtodcCrw*endS fIbtutw_ asmw dralnaedrmp hmthe PledmotPeeutt I eOew wte Plain. The mbmd dec lo **mre&W hide4 stodploen conwdmltha pek rprnta arbgey obeated nturelm suronded by ben wewswhich kupect pek reerea rough rainc, flooding andpofpak Meem k*trdtlof
bn Spedef naial dcmen& depcb~tngre ffon of unul mmsodt t nd bounrye t
"_3\
PO Pmh iU Photo
Conceptual diagram
- Water Quality and Hydrology *; hagwasabaearpat
ts te first en prk In th National Pork Ss o Creek Park pridae-s ancd protc tsn important. al rwource fort nation, Cal Expening -m-pi.-at _ ousu hthe park ntlnuu to incremtk pefouse spfameo, reultn h Inremdod torrewa
sunnoff of _lnedm nuand sstrhi% auk bedl uowuring ;, end reduocd naral tito th reundar .The peks Ie
act of I 5% of5to PtheparklIs woodlund) bensormwet InMP C1e"dbpria br4 quaft . within te park by filrling out .*imbwncl other pollutenta
SiBodiversity
RodkCra* ek akfwa wider-e,-eof recaeatonelend resite OPPOCUMf park Istor whiH p ng t o al bioclernty ofthewre indudin trredragonfs *k m p 0p .
-@ ,M1- thhb o IN#, seonedr ve~ flih k*' ialororet& hids en native plard * w unmy n imp the natural rsor of the park. WhlculartraMl _ reut I od kills Wt and park Mobdofregment foraom The sprawdl ssti plent i bydumplngP.tineceatlsn of unadhnd dopoff-i ah J damage reourceaandtan
- - wh~nenn~mesap~%eq...- - -
Extended legend
Map,,
Itk Park Watershed
Abm ~ FAW PukMm u Iwai
VtlSgsMonitoring
he -rlom -ogical, bWokicaL anlpkica ocmutbeact mtihom aouituThbstei.pedflcdtawIANp vdpavkuwW the kIfonnatlon nsedadsfr cologically oundme nagement of the watural rau-rcus.
in Rock CiA orkPai dataI beilng coIlac'adn tAr Quellhty and M,*,lkgvanolNd! WaIwatv with refeer mm to pwrk-spaific moncawvuaawefll as ndertnlng reglobnaL uu
mat.Mmnmlrau ~Mh*Iiaadi
i Aa ., i ~m PmO.W ammoa
at t
' Sa
~~Z~j au
Data6
I
Figure 6. An illustration of visual elements of science communication for Rock Creek Park, in which maps are combined with photographs, data, and conceptual diagrams.
expands (Dennison et al. 2004). The effort to collect environmental data is generally resource-intensive, requiring large expenditures of time and money. The sub sequent application of data to inform management, stim ulate research, and direct monitoring efforts is often not accompanied by adequate integration. Yet, integrated assessments are one of the most important tools in the ecosystem-management toolbox. Timely assessments pro vide feedback on management actions, so both managers and stakeholder groups can evaluate progress, target restoration, and/or protection efforts.
This work was conducted for the National Park Service, which is legislatively mandated to communicate with a broad audience of interested people having varying degrees of background and understanding concerning ecosystem processes. As such, a multi-phased assessment strategy, which engaged stakeholders early and often, was essential to the development of final products that could be accessed by people both with and without scientific backgrounds. The effective communication of data to diverse audiences should be a goal of all scientific endeavors, especially those requiring large expenditures of public funds.
Visual communication devices can literally open peo
ple's eyes and allow individuals to more acutely perceive the world around them. This improved understanding
will lead to more informed decision making and better social discourse on various issues. Visual devices work - they can transcend scientific jargon by using images and symbols that provide information and knowledge. Scientists use multivariate datasets; thus, a multimedia presentation of data is warranted. Some data lend them selves to the creation of graphs, or to maps, or to tables.
Finally, the incentive to develop more effective approaches to integrative environmental assessment has never been greater than it is at present. To avoid becom ing swamped with meaningless data, just when we most need synthesized analyses for improved environmental management, we need to open our eyes to new ways of communicating data and enhancing our understanding, so as to achieve better stewardship of our natural resources.
* Acknowledgements
G Mora and J Runde of CUE/NPS helped with concepts and visual elements. J Thomas, T Saxby, and A Jones of IAN/IUMCES provided technical and editorial assis
C The Ecological Society of America wvw.fotieroenecolog.org

Integrated environmental assessments WC Dennison et al.
I
tance. R Jesien, C Cain, and D Wilson of MCBP and C Wazniak and M Hall of MD DNR contributed to Assateague Island National Seashore examples. B Longstaff of NOAA/UMCES and S Fancy of NPS made helpful comments on the manuscript. NCRN park man agers contributed to the scoping and conceptual model ing. Funding from NPS was facilitated through the
Chesapeake Watershed CESU. This manuscript is contri bution number 4061 from UMCES.
References Barker S. 2006. Environmental communication in context. Front
Ecol Environ 4: 328-29.
Barna D and Gaumer G. 2005. NPS director says visitation to
National Parks up in 2004. Washington, DC: Department of
Interior, National Park Service.
Bricker SB, Ferreira JG, and Simas T. 2003. An integrated method
ology for assessment of estuarine trophic status. Ecol Model 169:
39-60.
Carruthers TJB, Dennison WC, Longstaff BJ, et al. 2002. Seagrass habitats of northeastern Australia: models of key processes and
controls. B Mar Sei 71: 1153-69.
Christensen NL, Bartuska AM, Brown JH, et al 1996. The report of
the Ecological Society of America committee on the scientific
basis for ecosystem management. Ecol Appl: 6: 665-91.
Dennison WC, Carruthers TJB, Thomas JE, and Glibert PM. 2004. A comparison of issues and management approaches in Moret?n
Bay, Australia and Chesapeake Bay, USA. In: Wong MH (Ed). Developments in ecosystems, vol 1. Wetlands ecosystems in
Asia: function and management. Amsterdam, Netherlands:
Elsevier.
Driscoll C, Whitall D, Aber J, et al 2003. Nitrogen pollution: sources
and consequences in the US northeast. Environ 45: 8-21.
Falkner MB and Stohlgren TJ. 1997. Evaluating the contribution of
small national park areas to regional biodiversity. Nat Area] 17:
324-30.
Ferreira JG. 2000. Development of an estuarine quality index based
on key physical and biogeochemical features. Ocean Coast
Manage 43: 99-122.
Groffman PM, Bain DJ, Band LE, et al. 2003. Down by the riverside:
urban riparian ecology. Front Ecol Environ 1: 315-21.
Grumbine RE. 1994. What is ecosystem management? Conserv Biol
8: 27-38.
Haefner JW 1996. Modeling biological systems: principles and appli cations. New York, NY: Chapman 6k Hall.
Harris, GP, Bigelow SW, Cole JC, et al 2003. The role of models in
ecological management. In: Canham CD, Cole JC, and
Lauenroth WK (Eds). Models in ecosystem science. Princeton,
NJ: Princeton University Press.
IAN (Integration and Application Network). 2006. Symbol libraries, www.ian.umces.edu. Viewed 8 Jun 2007.
Jackson LJ, Trebitz AS, and Cottingham KL. 2000. An introduction
to the practice of ecological modeling. BioScience 50: 694-706.
Jaworski NA, Howarth RW, and Hetling LJ. 1997. Atmospheric deposition of nitrogen oxides onto the landscape contributes to
coastal eutrophication in the northeast United States. Environ
SciTechnol 31: 1995-2004. Kaiser J. 2000. Bringing science to the national parks. Science 288:
34-37.
Kershner JL. 1997. Monitoring and adaptive management. In:
Williams JE, Wood CA, and Dombeck MP (Eds). Watershed restoration principles and practices. Bethesda, MD: American
Fisheries Society. Kiddon JA, Paul JF, Buffam HW, et al. 2003. Ecological condition of
US mid-Atlantic estuaries 1997-1998. Mar Poll B 46: 1224-44. Masek JG, Lindsay FE, and Goward SN. 2000. Dynamics of urban
growth in the Washington, DC metropolitan area, 1973-1996, from Landsat observations. Int] Remote Sens 21: 3473-86.
NCRN (National Capital Region Network). 2006. A conceptual basis for natural resource monitoring. Washington, DC:
Department of Interior, National Park Service. http://ian.
umces.edu/ncr/ pdfs/nrm_booklet.pdf. Viewed 8 Jun 2007.
NPS (National Park Service). 1999. Natural resource challenge: the
National Park Service's action plan for preserving natural
resources. Washington, DC: Department of Interior, National
Park Service, http://science.nature.nps.gov/im/monitor. NRC (National Research Council). 2001. Grand challenges in envi
ronmental sciences. Washington, DC: National Academy Press.
Pantus FJ and Dennison WO 2005. Quantifying and evaluating
ecosystem health: a case study from Moret?n Bay, Australia. Env
Manage 36: 757-71.
Pickett STA, Cadenasso ML, Grove JM, et al. 2001. Urban ecologi cal systems: linking terrestrial ecological, physical, and socio
economic components of metropolitan areas. Annu Rev Ecol Syst 32: 127-57.
Reagan DP. 2006. An ecological basis for integrated environmental
management. Hum Ecol Risk Assess 12: 819-33
Sutter IIGW. 1999. Developing conceptual models for complex eco
logical risk assessments. Hum Ecol Risk Assess 5: 375-96.
Thomas JE, Saxby TA, Jones AB, et al. 2006. Communicating sci
ence effectively: a practical handbook for integrating visual ele
ments. London, UK: IWA Publishing. Wazniak C, Hall M, Cain C, et al. 2004. State of the Maryland
coastal bays. College Park, MD: Maryland Department of
Natural Resources, Maryland Coastal Bays Program, and
University of Maryland Center for Environmental Science.
http://dnrweb.dnr.state.md.us/pressroom/MCB.pdf. Viewed 8
Jun 2007. Wazniak CE, Hall MR, Carruthers TJB, et al. Linking water quality
to living resources in a mid-Atlantic lagoon system, USA. Ecol
Appl. In press. Wells PG. 2003. Assessing health of the Bay of Fundy
- concepts and
framework. Mar Poll B 46: 1059-77. Woodward A, Jenkins KJ, and Schreiner EG. 1999. The role of eco
logical theory in long-term ecological monitoring: report on a
workshop. Nat Areas] 19: 223-33.
www.frontiersinecology.org ? The Ecological Society of America


![5 Eye-Opening HR Stats: Why Employee Recognition Matters [INFOGRAPHIC]](https://static.fdocuments.in/doc/165x107/58e9488e1a28ab262c8b4dab/5-eye-opening-hr-stats-why-employee-recognition-matters-infographic.jpg)