
An Exploratory Study of Process Enactment as … · An Exploratory Study of Process Enactment as...
6
An Exploratory Study of Process Enactment as Input to Software Process Improvement Ming Huo, He Zhang, Ross Jeffery National ICT Australia Ltd. and University of New South Wales, Australia {mhuo, hezhang, rossj}@cse.unsw.edu.au Abstract Software process improvement has been a focus of industry for many years. To assist the procedure and implementation of software process improvement we provide a software process recovery method based on mining project enactment data. The goal of process recovery is to improve the quality of a planned software process. We investigate the enactment of a planned software process from the view of understanding the appropriateness and fitness for purpose of the process model from the viewpoint of the project managers in the context of a small software development organization. We collected empirical data from this organization and then applied our method to a pilot case study. The main contribution of our work is to provide a methodology of software process model recovery which supports software process improvement. Categories and Subject Descriptors D.2.9.[SOFTWARE ENGINEERING]: Management- Software process model ,life cycle General Terms: management, verification Keywords: software process improvement, process mining, 1. Introduction One implicit assumption in software process research is that improving the software process will improve the software product quality and better control of the software process will increase project success. Hence software process improvement has been a long term pursuit. Practitioners from research areas as well as industry have continued to explore techniques to improve software processes. However software process has long been considered as a complex procedure [5]. Software process models and software process modeling languages have been developed over many years. Several different kinds of software process models have been adopted in industry [15]. However, practitioners are curious as to what is really happening in the enacted process, such as (1) if the process model is applicable for the project and how appropriate it is, and (2) if there a gap between the pre-defined process and the project enactment? In order to answer these questions, our research work attempts to discover the variance between the model and its enactment using process mining as one possible solution. In section 2, we outline previous work in process mining and then outline reasons why the previous work is not applicable for our data set. Section 3 describes the procedure and preliminary notations and formulas involved. Section 4 presents our case study of one project with data collected from a small software company. In section 5 we compare our approach with previous works and then discuss the advantages of our approach as well as some limitations found in the case study. The final section is the conclusion and future work. 2. Related work Process mining intends to re-discover a process model from people’s daily activities, events or tasks. There are at least two main reasons for applying process mining. One is process mining can be used as a tool to reveal how people or procedures really work. The other one is process mining could be used for delta analysis, such as comparing the predefined model with the recovered model. The idea of process mining is not new but it mainly developed in the business process model area, especially in workflow management systems. There are a number of techniques and some tools developed for recovering business process models and used for analyzing commercial systems such as Staffware, SAP, and PeopleSoft [1]. Cook and Wolf have done a similar investigation in the software process fields and extend their approach to the concurrence system [10]. They present three algorithms for software process discovery. Among the three methods, the Markovian method is a mixture of algorithmic and statistical methods which can deal with noisy data. It is described as the most accurate method of process recovery in [10]. However, there are two major problems when utilizing these algorithms. The first problem is that hundreds of process instance data have to be collected to discover a process model. In all these methods [2, 12, 14], they treat each event or task as an atomic unit, the smallest unit in a process instance. The event is one well defined step in a process and normally one process contains hundreds of events. Because usually one project is treated as one software process instance and different projects may follow different predefined process models, it is very difficult to collect sufficient data for many projects which consistently follow the same process model. Hence, in this context, the data might never be enough for discovering one process model. The second problem is that the discovered model is a very low level process model which is defined generally in the terms of daily activities. Most predefined software process models, such as the waterfall model, spiral model or ISO standard models, are Permission to make digital or hard copies of all or part of this work for personal or classroom use is granted without fee provided that copies are not made or distributed for profit or commercial advantage and that copies bear this notice and the full citation on the first page. To copy otherwise, or republish, to post on servers or to redistribute to lists, requires prior specific permission and/or a fee. WOSQ'06, May 21, 2006, Shanghai, China. Copyright 2006 ACM 1-59593-085-X/06/0005…$5.00. 39
Transcript of An Exploratory Study of Process Enactment as … · An Exploratory Study of Process Enactment as...

An Exploratory Study of Process Enactment as Input to Software Process Improvement
Ming Huo, He Zhang, Ross Jeffery National ICT Australia Ltd. and University of New South Wales, Australia
{mhuo, hezhang, rossj}@cse.unsw.edu.au
Abstract Software process improvement has been a focus of industry for
many years. To assist the procedure and implementation of software process improvement we provide a software process recovery method based on mining project enactment data. The goal of process recovery is to improve the quality of a planned software process. We investigate the enactment of a planned software process from the view of understanding the appropriateness and fitness for purpose of the process model from the viewpoint of the project managers in the context of a small software development organization. We collected empirical data from this organization and then applied our method to a pilot case study. The main contribution of our work is to provide a methodology of software process model recovery which supports software process improvement.
Categories and Subject Descriptors D.2.9.[SOFTWARE ENGINEERING]: Management-Software process model ,life cycle
General Terms: management, verification
Keywords: software process improvement, process mining,
1. Introduction One implicit assumption in software process research is that
improving the software process will improve the software product quality and better control of the software process will increase project success. Hence software process improvement has been a long term pursuit. Practitioners from research areas as well as industry have continued to explore techniques to improve software processes. However software process has long been considered as a complex procedure [5]. Software process models and software process modeling languages have been developed over many years. Several different kinds of software process models have been adopted in industry [15]. However, practitioners are curious as to what is really happening in the enacted process, such as (1) if the process model is applicable for the project and how appropriate it is, and (2) if there a gap between the pre-defined process and the project enactment? In order to answer these
questions, our research work attempts to discover the variance between the model and its enactment using process mining as one possible solution.
In section 2, we outline previous work in process mining and then outline reasons why the previous work is not applicable for our data set. Section 3 describes the procedure and preliminary notations and formulas involved. Section 4 presents our case study of one project with data collected from a small software company. In section 5 we compare our approach with previous works and then discuss the advantages of our approach as well as some limitations found in the case study. The final section is the conclusion and future work.
2. Related work Process mining intends to re-discover a process model from people’s daily activities, events or tasks. There are at least two main reasons for applying process mining. One is process mining can be used as a tool to reveal how people or procedures really work. The other one is process mining could be used for delta analysis, such as comparing the predefined model with the recovered model.
The idea of process mining is not new but it mainly developed in the business process model area, especially in workflow management systems. There are a number of techniques and some tools developed for recovering business process models and used for analyzing commercial systems such as Staffware, SAP, and PeopleSoft [1]. Cook and Wolf have done a similar investigation in the software process fields and extend their approach to the concurrence system [10]. They present three algorithms for software process discovery. Among the three methods, the Markovian method is a mixture of algorithmic and statistical methods which can deal with noisy data. It is described as the most accurate method of process recovery in [10].
However, there are two major problems when utilizing these algorithms. The first problem is that hundreds of process instance data have to be collected to discover a process model. In all these methods [2, 12, 14], they treat each event or task as an atomic unit, the smallest unit in a process instance. The event is one well defined step in a process and normally one process contains hundreds of events. Because usually one project is treated as one software process instance and different projects may follow different predefined process models, it is very difficult to collect sufficient data for many projects which consistently follow the same process model. Hence, in this context, the data might never be enough for discovering one process model.
The second problem is that the discovered model is a very low level process model which is defined generally in the terms of daily activities. Most predefined software process models, such as the waterfall model, spiral model or ISO standard models, are
Permission to make digital or hard copies of all or part of this work for personal or classroom use is granted without fee provided that copies are not made or distributed for profit or commercial advantage and that copies bear this notice and the full citation on the first page. To copy otherwise, or republish, to post on servers or to redistribute to lists, requires prior specific permission and/or a fee. WOSQ'06, May 21, 2006, Shanghai, China. Copyright 2006 ACM 1-59593-085-X/06/0005…$5.00.
39
moderately high level process models which are very difficult to be compared with the activity level models. There is a distinct gap between the low level recovered model and the pre-defined higher-level model.
In this paper, we present our approach which overcomes the two problems outlined above. We begin by collecting low level project task data, which is then mined for process patterns by analyzing this data. The discovered process patterns are at the same level as the predefined process model. In this case, it is easy to discover any discrepancies between them, and by analysis, to improve the predefined process.
3. Process discovery In this section, we present our process discovery approach and
the primary algorithm and notations. Firstly, we give a brief overview and the assumptions of our approach, and then follow by introducing the data analysis methods, and process patterns mining approach.
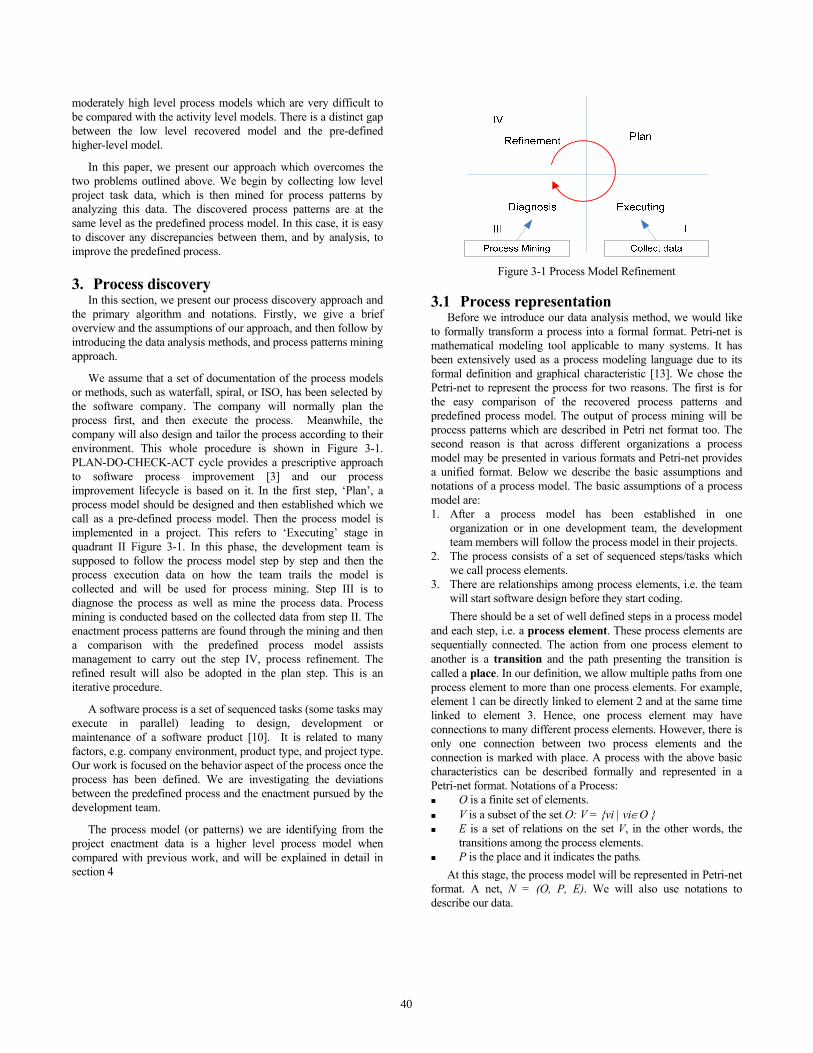
We assume that a set of documentation of the process models or methods, such as waterfall, spiral, or ISO, has been selected by the software company. The company will normally plan the process first, and then execute the process. Meanwhile, the company will also design and tailor the process according to their environment. This whole procedure is shown in Figure 3-1. PLAN-DO-CHECK-ACT cycle provides a prescriptive approach to software process improvement [3] and our process improvement lifecycle is based on it. In the first step, ‘Plan’, a process model should be designed and then established which we call as a pre-defined process model. Then the process model is implemented in a project. This refers to ‘Executing’ stage in quadrant II Figure 3-1. In this phase, the development team is supposed to follow the process model step by step and then the process execution data on how the team trails the model is collected and will be used for process mining. Step III is to diagnose the process as well as mine the process data. Process mining is conducted based on the collected data from step II. The enactment process patterns are found through the mining and then a comparison with the predefined process model assists management to carry out the step IV, process refinement. The refined result will also be adopted in the plan step. This is an iterative procedure.
A software process is a set of sequenced tasks (some tasks may execute in parallel) leading to design, development or maintenance of a software product [10]. It is related to many factors, e.g. company environment, product type, and project type. Our work is focused on the behavior aspect of the process once the process has been defined. We are investigating the deviations between the predefined process and the enactment pursued by the development team.
The process model (or patterns) we are identifying from the project enactment data is a higher level process model when compared with previous work, and will be explained in detail in section 4
Figure 3-1 Process Model Refinement
3.1 Process representation Before we introduce our data analysis method, we would like
to formally transform a process into a formal format. Petri-net is mathematical modeling tool applicable to many systems. It has been extensively used as a process modeling language due to its formal definition and graphical characteristic [13]. We chose the Petri-net to represent the process for two reasons. The first is for the easy comparison of the recovered process patterns and predefined process model. The output of process mining will be process patterns which are described in Petri net format too. The second reason is that across different organizations a process model may be presented in various formats and Petri-net provides a unified format. Below we describe the basic assumptions and notations of a process model. The basic assumptions of a process model are: 1. After a process model has been established in one
organization or in one development team, the development team members will follow the process model in their projects.
2. The process consists of a set of sequenced steps/tasks which we call process elements.
3. There are relationships among process elements, i.e. the team will start software design before they start coding. There should be a set of well defined steps in a process model
and each step, i.e. a process element. These process elements are sequentially connected. The action from one process element to another is a transition and the path presenting the transition is called a place. In our definition, we allow multiple paths from one process element to more than one process elements. For example, element 1 can be directly linked to element 2 and at the same time linked to element 3. Hence, one process element may have connections to many different process elements. However, there is only one connection between two process elements and the connection is marked with place. A process with the above basic characteristics can be described formally and represented in a Petri-net format. Notations of a Process:
O is a finite set of elements. V is a subset of the set O: V = {vi | vi∈O } E is a set of relations on the set V, in the other words, the
transitions among the process elements. P is the place and it indicates the paths.
At this stage, the process model will be represented in Petri-net format. A net, N = (O, P, E). We will also use notations to describe our data.
40

3.2 Process data hierarchy and data pre-processing
In one project, there might be different types of data including high level and low level data. The low level data may include project tasks, daily activities and etc. The data we used are the low level data which are gathered during implementation. The data are recorded while developing the projects. In this circumstance, the data reflects how the team followed the predefined process model in the real world. In this section, we lay out the data hierarchy normally existing in a software organization and then display the data we need, and how we analyzed it before mining.
Data hierarchy: The high level data are items such as project documents and system requirements which are used as reference data. We focus on relatively low level data, which are shown in Figure 2. Software project modules, referred to here, are the units that are not tightly related to each other during the development and can be developed separately even they belong to one system/product or project. Each task may contain many activities needed to accomplish the task, which is designed according to their process model. Therefore, the smallest unit data is one activity. A task is the second smallest data unit which may contain multiple activities. The hierarchy of all the data is shown in Figure 2. We focus mainly on the task level at this stage. We assume it is possible to record tasks such that: 1. Each task refers to only one process instance or one project. 2. Tasks are ordered and it has a finite period time from start to
end. (some tasks are executed in parallel or overlapped) 3. Task refers to the process model. 4. Each task has a description. 5. Each task has one or more assignees, the person who executed
the task.
Figure 2 Data Hierarchy Mapping tasks to process element in O is one of the important
aspects in our approach. One reason is that task classification can only be done manually since these tasks are fairly low level data with some detailed information, e.g. start time, comments and etc. The other reason is that it is difficult to categorize the tasks according to process elements.
Even though project managers follow the process model to design the tasks, their work experience normally will be involved in task planning. We found that whether a task belongs to its corresponding process element is not obvious from the description or comments of a task. When the tasks are executed, the development team members did not sort the tasks into process elements. The tasks are fairly low level data compared with the process elements and then there is a distance between them. The tasks data are similar to event logs. They reflect the development team’s behavior in one project. In order to accomplish this step, experts need to be involved in this procedure and the statistic method, Kappa agreement, is applied.
Given a task t, Start(t) represents the start date of t and End(t) represents the end date of t. Obviously, End(t) > Start(t). We use Vt(ti) to represent the process elements that task ti belongs to: Vt(ti) = {ti| ti∈T(vi) }
Verification of task classification: Kappa is a chance-corrected measure of agreement among raters, each of whom independently classifies each of a sample of subjects into one of a set of mutually exclusive and exhaustive categories. The Kappa value is computed as (3-1).
e
eop
ppK−−
=1 (3-1)
If there are k categories and 2 raters (rater 1 and rater 2), we use rip to represent the proportion of objects classified by rater ‘r’(r
= 1 or 2) to category i (1 ≤ i ≤ k) and use iip to represent the proportion of objects that classified by both of the two raters to category i (1 ≤ i ≤ k). Po is observed agreement and Pe is expected agreement and, where:
∑=
=k
iiio pp
1, ∑
==
k
iiie ppp
1
21
K=0 means that agreement is not different from chance and K=1 means perfect agreement. K value less than 0.67 indicate no conclusion can be reached. K value lies between 0.67 and 0.8 allows tentative conclusions. And then definite conclusion can be drawn when K value is above 0.8 [11]. In our approach, we won’t accept the classification till K value is above 0.8.
After collecting all the data, we first use standard Kappa to calculate the agreement among all the raters. However the standard Kappa has its own limitation. It can not handle the marginal data [4]. For example, Kappa value may drop dramatically when one of the agreed-category has a small percentage. Gwet proposed an alternative statistic called AC1-statistic which can avoid the original Kappa’s limitation [6] and is more consistent with the percentage of agreement between raters in all situations. So after calculating the Kappa values for each project, we then use AC1 statistic method to refine the results [7].
3.3 Process patterns mining There are many process mining algorithms. Among these
algorithms, alpha algorithm is the basic one and we borrow the main idea, causal relations and connecting transitions, from alpha algorithm [14].
After correctly classified the tasks, each task will be assigned into one element vi in O. We use T(vi) to represent all the tasks that are assigned into element vi. The next step is to mine the data and try to discover a model or patterns from the process data. We focus on the causal relations to investigate whether there are two tasks that have causal dependency. For example, if one task is always followed by another task, it is likely that a causal relation between them. Furthermore, if such dependency exists, it implies that a connecting transition exits, and there has to be a place connecting the transitions[14]. The causal relationship will be searched from the whole data set among one process instance. While accumulating the sequence relationship and the connecting places, the recovered process patterns are generated piece by piece.
Given two tasks ti, tj we say ti and tj have casual relation ti → tj iff End(ti) > Start(tj), and we will add a directed line from ti to tj in
41

the Petri-Net of tasks. We already know that each task has a correspondent process element Vt(ti), which means the casual relationship in the task level also represents the correspondent relationship in the EPG model level. There are two distinctive differences between this method and alpha algorithm. First the alpha algorithm is trying to recover the whole process model, which means the data set should be a complete set. A complete data set means all tasks potentially directly follow each other, which is not realistic in most of our situations. We allow the task data set to be incomplete. Therefore in our approach, we are trying to find out any piece of the process patterns which may be detected by the causal connections. The second difference is that the process piece or pattern found is in the same level as pre-defined process model, which can be directly and clearly compared with them. The causal relations are found out between two tasks. Because the tasks have been mapped to the pre-defined process elements, the relations between tasks also represents the relationship of the two process elements which the tasks belong to. For example, if we found a relation A->B between two tasks A and B, and Vt(A)= Ei, Vt(B) = Ej then in the recovered process, the possible path is from Ei -> Ej.
By discovering the relationship of tasks and sequence, the sequence and relationship of process elements are reflected from the enactment data in this stage. Then, we can easily compare the recovered process patterns with the predefined process model and further bridge the gap between them.
4. Case study In this section, we briefly describe one pilot case study by
using our method. We won’t enumerate all the details of each step. Instead, we will present the values and a pattern we have recovered from this case study.
4.1 Background An Australian software firm chose a modified ISO 12207 as
their fundamental process model. ISO 12207 Software Life Cycle Process Standard [8] is one of the most comprehensive documents. It defines three primary types of processes as well as two assisting processes named supporting processes and organization processes. This company customized ISO 12207 and installed a web-accessible electronic process guide (EPG) based on it.
The EPG provides an efficient way of presenting software process models to the development team. It visualizes the process model as a graphic format with UML notations. The EPG provides the diagrams as well as the documentation of each process element. It also shows the sequence of all the process elements. The development team can easily follow the process model and easily understand the content of each process element with the assistance of the EPG[9]. The process enactment data of many previous projects are stored through the EPG.
The database stored all the tasks and daily activities of each team members while the project is in development. After the requirements of one project are collected, the project manager or the team leader starts to design the tasks and then allocates the tasks to the team members. When each team member is executing the tasks, they will record the task information. The typical information of one task consists of:
1) task start and end date, 2) assignee, the person who executes it, 3) brief comments made by the operator, 4) and which project this task belongs to.
We randomly chose one small to mid-sized project with desired documentations as our pilot case study. This project is to develop a database system. The comprehensive documents are available. These documents assisted the experts in mapping the tasks to the EPG process elements. The detailed project information is shown in Table 1.
Table 1 Pilot Project Information
Project Information Team size 6 persons Total Effort 1652.25 man-hours Duration 875 days Closed year 2002 Total task number 85
EPG Tasks 53 (62%) Task Classification
None-EPG Tasks 32 (38%) Kappa Agreement 0.808 Process modules no. 3
4.2 Pre-processing The tasks classification was done by two experts and both of
them have comprehensive knowledge of ISO12207 and the EPG. One of the experts has working experience with the development team. High agreement was reached by the two experts. The Kappa value after correction was 0.808, which indicates that conclusions can be reasonably drawn on the tasks classification. In this step, we did some additional experiments on the task classification. We found experts with practical knowledge of the implemented process model can reach a high agreement no matter whether the experts have working experience in this company. The deviation between the naïve on the implemented process model and the process experts is distinct. We concluded that the experts with process knowledge can classify the tasks into the most appropriate process elements.
The project is divided into 3 modules and we treat the set of tasks in each module as one process instance. The EPG model is originally designed with UML notations. In order to compare between the discovered process patterns and EPG process model, we represented the EPG process model in formal format. The EPG model was turned into Petri-net format as shown in Figure 3. The circle means a place and the line with arrow means there is a relation between the elements.
4.3 Result The patterns discovered by mining the data is shown in Figure
4. It illustrates the three process elements have been followed but the sequence is not exactly the same as in the EPG model in Figure 3.
In Figure 3, “Collect Requirement” should be done at the very beginning of a project and then followed by “Refine System Requirements”. There are 6 places, P2 to P7, from “Collect Requirement” to “Software Architecture Design” in EPG. However, in the recovered pattern, Figure 4, there is only one place between them. In this case, five process elements have been skipped. There is a loop, from “Collect Requirement” to “Analyse”, which indicates that these two elements are tightly cooperated or interacted. It may reveal the following phenomena from two aspects, the requirements and the team. The
42

requirements may not be stable during the development. Even after the first gathering of some documents or requirements from the client, the team found that they still needed to keep collecting or mending more requirements due to the client’s request, technical constraints and market change. The team may not be able to collect accurate requirements at the beginning to generate well defined software architecture and they need to improve their skills. The manager may provide training to the development team.
Figure 3 EPG Petri-net The direct connection from “Collect Requirement” to
“Software Architecture Design” shows that the team skipped generating “Specific System Requirements” and the “Refine System Requirements” tasks. Hence, the questions are raised for the manager, such as “Does the team really need these process elements?”, “These process elements are only not adopted in this project but will be useful for others?”, or “Under what circumstance these process elements can be skipped?”
Figure 4 Pilot Case Study Result Even though some other process elements are also found, the
project looks incomplete comparing with EPG. Figure 5 shows that the process may end at “Update Task List”, “Test” or “Analyse”. All three of these elements are not the proper ending
elements. In contrast, the EPG process should end at “Provide Documentation and Support”. We have a close look of the source data of the tasks that belong to these process elements and then found that when the project was near its end, clients still want to have some meeting and discussion on how to finalize the project. Clients sent some change requests even at the ending point.
Figure 5 Ending Process Elements
From the above findings, we realize that there is a gap between EPG process model and project enactment of this project. How to improve the process, “Shall we revise the pre-defined process based on the discovered the process patterns?” or “Shall the manager keep the team on track of the pre-defined process model?” To answer these questions, we need to assess the process performance and based on our assessment, we adjust the balance between them.
Process improvement: Software process involves many factors and an effective software process should be able to predict the behaviors of how the team accomplishes one real project. Software process assessment is the critical step when implementing SPI and the assessment is valuable only when the difference between the planned process model and executed model is discovered and measured. In our approach, the process is diagnosed and tracked, and then the gap is identified. The results generated from our approach bring valuable input to process assessment.
5. Discussion In this section, firstly, we compare our work with previous
related work, from three aspects: 1) data type and size, 2) mining method, and 3) output. Secondly, we present some limitations of our work, which we found from the pilot case.
5.1 Comparison with previous work Data type and required amount: Cook and Wolf used a similar
approach in the software process context. Their approach involved statistical methods in process mining step where the amount of data required is large, normally more than hundreds of cases. It is very difficult to gather hundreds of project enactment data which follow the same process model within the similar project environment and context. Cook and Wolf’s approach ignored these factors, since they investigated the process mainly from its behavior aspects. The required data size of our approach could be fairly small.
Mining method: Most of the process mining approaches involve statistical methods. In our approach, we mainly based on the alpha-algorithm. We are trying to find the causal relations from the data set and then to detect the connecting places from the causal relations. These places made up the recovered process patterns. The main reason that we did not involve statistical methods in our process mining step is the required data size. As mentioned before, to collect more than some hundreds of similar project enactment data is typically not realistic and one project is
43

mined as one process instance. In this situation, it is not suitable to involve statistic methods in the mining step.
Output: In Cook and Wolf’s recovered models, the main elements still present the tasks or activities, such as “code check-in”, “code inspection”, “modify schedule” and etc. The input data for process mining is the lowest level data, the atomic unit, in one project. Compared to our data hierarchy in Figure 2, their data stay at the “activity” level. Without mapping these data to process elements, the recovered model with such details is normally very large and mainly reflects the low level process model. Meanwhile, the transitions sometimes are countless and complex. For example, if the team followed a waterfall model, the recovered process at such a detailed level can not be easily compared to the waterfall model’s elements because it stays at least one level below the pre-defined process model. In our methods, the recovered process elements are in the same context as the pre-defined process model with the same name and labels.
The major advantage of this approach is that a higher level process pattern or model can be captured by comparing with the model Cook and Wolf recovered. This is the most distinctive difference between this work and Cook and Wolf’s model.
5.2 Limitations From the pilot case study, we also find some issues needs to be
improved. These issues will be covered in our future work. The first issue is that our approach does not handle non-process element tasks. Not all tasks can be categorized to a predefined process element and the content of some tasks is across process elements. In the tasks classification step during the pilot case study, we found that some tasks can not be clearly categorized to one single process element, and meanwhile some tasks do not belong to any process elements at all in our case study. Currently this approach can not handle these data. In order to gain an accurate discovered process pattern, we put these data aside at this stage. The input data for process mining are “pure” tasks, which can be surely identified to one process element.
The second problem is that while the project is a moderately large sized project, it needs to be divided into its modules or components. The process model should allow parallel development among modules even when the process elements are organized sequentially. One module can be treated as one process instance. In our approach, we haven’t clearly instructed on what kind of projects should be divided into modules.
6. Conclusion and future work In this paper, we presented our approach to discover process
patterns based on project tasks. In our method, process patterns can be discovered in the same format as pre-defined process models and the pre-defined process models can be designed from any general process methods, such as waterfall model, ISO standards and etc. In the previous work, the discovered process remains at the low level, in other words, the same level as the collected data. The breakthrough of our work is that we can discover the higher level process patterns or models at the same level as the pre-defined process. However, our process mining is carried out on project tasks, the low level data, but the discovered process is at a higher level than the enactment data, or the same level as the pre-defined process model. The deviations between a pre-defined process model and the discovered process patterns can be taken as the input for software process improvement. The main value of our method is to provide the evidence of how a process
executes during the development and extract the process patterns from the life data.
In our work, some noise data such as the tasks that can not be mapped to the process elements cannot be handled. This remains as our future work. After mining process patterns, how to accurately compare them with the defined process model and to present the deviation quantitatively could be also addressed in our future work. We argue that the results from our approach are suitable for the process improvement and tailoring. However, a comprehensive process amending mechanism specially for using these results will be proposed in the future.
7. References 1. Aalst, W.M.P.v.d. Verification of Workflow Nets. in
Application and Theory of Petri Nets, 18th International Conference. 1997. Toulouse, France.
2. Alves, A.K., Using Genetic Algorithms to Mine Process Models: Representation, Operators and Results. 2003.
3. Arthur, L.J., Improving Software Quality: An Insider's Guide to TQM. 1993.
4. Fleiss, J.L., Measuring nominal scale agreement among many raters. Psychological Bulletin, 1971. 76(378-382).
5. Fuggetta, A., Software process: a roadmap in Proceedings of the Conference on The Future of Software Engineering 2000 ACM Press: Limerick, Ireland p. 25-34
6. Gwet, K., Handbook of Inter-Rater Reliability. 2002: STATAXIS Publishing Company.
7. Gwet, K, Kappa statistic is not satisfactory for assessing the extent of agreement between raters.Statistical Methods for Inter-Rater Reliability Assessment Series,2002.1:p.1-16.
8. ISO, ISO/IEC 12207:1995; Standard for Information Technology - Software Life Cycle Processes - Implementation Considerations Institute of Electrical and Electronics Engineers/Electronic Industries Alliance. 01-Apr-1998.
9. D.Ross Jeffery, Felicia Kurniawati, The Use and Effects of an Electronic Process Guide and Experience Repository: A Longitudinal Study Information and Software Technology, Elsevier, Amsterdam, 2005.
10. Jonathan, E.C. and L.W. Alexander, Discovering models of software processes from event-based data. ACM Trans. Softw. Eng. Methodol., 1998. 7(3): p. 215-249.
11. Krippendorff, K., Content Analysis: An Introduction to Its Methodology. Newbury Park, CA: Sage Publications., 1980.
12. L. Wen, J.W., W.M.P. van der Aalst, Z. Wang, and J. Sun. , A Novel Approach for Process Mining Based on Event Types. BETA Working Paper Series, WP 118, Eindhoven University of Technology, Eindhoven, 2004.
13. Murata, T, Petri nets: Properties, analysis and applications. Proceedings of the IEEE, 1989. 77(4): p. 541 - 580
14. van der Aalst, W.W., T.; Maruster, L., Workflow Mining: Discovering Process Models from Event Logs. Knowledge and Data Engineering, IEEE Transactions 2004. 16(9): p. 1128 - 1142.
15. Victor, R.B., et al., Lessons learned from 25 years of process improvement: the rise and fall of the NASA software engineering laboratory, in Proceedings of the 24th International Conference on Software Engineering. 2002, ACM Press: Orlando, Florida.Pages:69-79
44