International Journal of Prevention and Control of Industrial Pollution - Vol 2_Issue 2
Galore International Journal of Health Sciences and Research
Vol.2; Issue: 1; March 2017
Website: www.gijhsr.com
Case Study P-ISSN: 2456-9321
Galore International Journal of Health Sciences and Research (www.gijhsr.com) 11
Vol.2; Issue: 1; March 2017
An Excel-Based Inventory Control System Based on ABC and VED
Analyses for Pharmacy: A Case Study
Hacer GünerGören1, Özge Dağdeviren
1
1Asst. Prof. Department of Industrial Engineering, Pamukkale University, Kinikli Campus, 20070, Denizli,
Turkey
Corresponding author: Hacer GünerGören
________________________________________________________________________________________________________________
ABSTRACT
In today's competitive environment, businesses
that can offer products or services to users at any
time, in any quantity and quality, have great
advantages. Especially when these businesses
are vital for human health, they need to keep
staples of medicines, medical supplies and other
support materials in sufficient quantity so that
the service can continue without any
interruption. Hospitals must keep drugs
according to their cost and importance in order
to minimize inventory and holding costs. For
this purpose, inventory control techniques are
needed in order to cut total expenses. The aim of
this study was to determine the importance of
drugs in a hospital’s pharmacy via ABC, VED
and ABC-VED Matrix Analyses. Based on the
results, order quantities were determined using
Economic Order Quantity model. In order to
cope with numerous drugs, an Excel-based
inventory system was built to do the analyses
quickly and efficiently.
Key words: Inventory management, ABC
analysis, VED analysis, ABC-VED matrix,
economic order quantity, pharmacy.
INTRODUCTION
One of the most important
institutions that provide community
healthcare is hospitals. Hospitals should
keep their services at the highest level in
order to meet expectations of patients. Like
every sector, there is a competitive
environment in health sector and this
competition is further enhanced by legal
regulations allowing the private sectors
operate. Therefore, inputs, processes and
outputs should be checked regularly and
resources should be used efficiently at
hospitals.
Inventory at hospitals have a
significant share in total cost. As stated in
Kant et al. [1]
, about one-third of the annual
hospital budget is spent on buying materials
and supplies, including medicines.
Therefore, hospitals need to adapt efficient
techniques for inventory control in order to
cut their expenses. A savings of 1% or 2%
from these costs can lead to a significant
increase in hospital productivity,
profitability, financial performance and
increase competitive advantage. Yiğit [2]
stated that inventory control analyzes and
precautions were taken in a study conducted
in a 1500-bed hospital, resulted in saving
20% of the cost of expensive drugs. The
ability to provide the financial sustainability
of hospital enterprises with today's highly
complex, technological and competitive
structure can only be possible by the
availability of medical supplies and
medicines at the right location, time,
quantity, quality and price. [3]
In order to
achieve this, an efficient material
management and inventory control system
must be adapted at hospitals.In case of
ineffective inventory control, lack of
necessary medicines and medical supplies
may not be detected.This can lead to
consequences such as death, disability and
inability to compensate and avoid damage
which might have a negative effect on
hospital’s image and lead to loss of income
in the long term. Therefore, inventory
control techniques should be applied.
Hacer GünerGören et al. An Excel-Based Inventory Control System Based on ABC and VED Analyses for
Pharmacy: A Case Study
Galore International Journal of Health Sciences and Research (www.gijhsr.com) 12
Vol.2; Issue: 1; March 2017
ABC analysis is one of the most
widely used inventory control technique. In
order to classify drugs, researches in
healthcare systems have mostly preferred
this analysis. ABC analysis focuses on the
annual consumption amount and cost in
classifying drugs. This analysis puts strict
control on the drugs in class A which are the
most expensive among all. But importance
of class B and C however should not be
overlooked. In some cases, there might be
medicines from A, B and C in one
prescription. Short of class C drug can lead
to a failure in medical treatment if it is vital
for the illness. [4]
In order to overcome this
disadvantage, VED analyses depending on
the criticality of drugs have also been
utilized in classification at hospitals.
Combining these two techniques, ABC-
VED Matrix has been emerged and this
matrix is the most suitable method for
hospital medical materials. [5]
Antonoglou et
al. [6]
analyzed the annual consumption and
expenditure incurred on each product at a
general military hospital of Athens for the
year2012 via ABC and VED analyses.
Another study of ABC and VED analyses
was presented by Yiğit. [7]
The author
analyzed the annual medical materials
expenditure and consumption using
inventory control techniques. Different
classifications were presented by various
authors using ABC and VED analyses. [8, 9,
10, 11]
All these aforementioned studies
focused only on classifying drugs via ABC
and VED analyses. In this study, an Excel-
based program was built to classify drugs
using ABC, VED, ABC-VED analyses and
determine the order sizes. By using this
program, hospital staff can easily classify
drugs and determine order sizes quickly and
correctly. This would help in reducing
stock-out problems and total costs.
The rest of the study is organized as
follows. Section two presents the material
and methods used in this study where the
case study is explained in the third section.
The last section summarizes the findings of
this study.
MATERIALS AND METHODS
This case study was conducted at a
hospital’s pharmacy. Using the data of year
2015, drugs were classified. For ease of use,
an Excel-based inventory control system
was built. This section gives some
background information regarding ABC and
VED analyses.
ABC Analysis
ABC analysis is one of the most
widely used tools in inventory control. It is
based on Pareto’s Law or “80-20 Rule”. [12]
This rule, developed by Vilfredo Pareto,
states that 80 % of total value is accounted
by 20 % of items. Motivated by this rule,
ABC analysis classifies the items in
inventory in three groups as in the
following.
Class A represents 20% of inventory
items and 80% of inventory value.
Class B represents 30% of inventory
items and 15 % of inventory value.
Class C represents 50% of inventory
items and 5% of inventory value.
According to ABC analysis, inventory
items in Class A will be handled extensively
since the most of the inventory value
belongs to this group. Shortage of these
items will result in high costs therefore; the
inventory control of these items should be
done carefully. Continuous review inventory
control policies might be more appropriate
for this group and safety stocks should be
determined strictly. On the other hand, no
strict rules should be applied for class B and
C items. Low safety stock policy might be
appropriate for class B items whereas class
C items do not need to be controlled
carefully. However, these items should not
be overlooked. Especially in hospital
pharmacy, shortage of these items may lead
to a failure in medical treatment which is
very important for the illness. [10]
VED Analysis
VED analysis is a method that is
used in control of drugs and medical
materials. As ABC analysis classifies items
based on purchasing costs, VED analysis
classifies them based on the critically of
stock items. There are three groups in VED

Hacer GünerGören et al. An Excel-Based Inventory Control System Based on ABC and VED Analyses for
Pharmacy: A Case Study
Galore International Journal of Health Sciences and Research (www.gijhsr.com) 13
Vol.2; Issue: 1; March 2017
analysis based on the basis of priority and
importance to patients’ health. [4]
V (Vital): These are drugs that
potentially involve lifesaving which
should be available all times.
E (Essential): They are significant for
illnesses but less severe compared to
vital drugs which may be available in the
hospital.
D (Desirable): These items are lowest
critically and shortages of these items
are not detrimental to the health of
patients. [10]
The critically of each item is identified
by a group of doctors with different
specializations and pharmacists.
ABC-VED matrix analysis
The ABC-VED matrix is formed by
cross-tabulating the ABC and VED analysis. [10]
Three combinations are formed from the
resultant combination. It should be noted
that the first letter in this category denotes
the place of the item in ABC analysis where
the second letter shows the place of the item
in VED analysis.
1st Category: These items are both
expensive and critically vital for
patient’s life. They need to be monitored
and controlled continuously. These items
might be in sub-categories namely, AV,
AE, AD, BV and CV.
2nd
Category: The items in this group are
not as expensive as the first group or not
as critically vital for patient’s life. These
need to be controlled periodically. These
items might be in sub-categories namely,
BE, CE, BD.
3rd
Category: These items in this group
are the least expensive and vital. They
do not need to be controlled periodically.
These items might be in sub-category
namely, CD.
RESULT AND DISCUSSION
For ABC analysis, annual
consumption amount and expenditures of
157 items used in 2015 were analyzed. For
VED analysis, these items were grouped by
an expert in terms of their importance to a
patient’s life. These data then were used in
forming the Excel-based inventory control
system. The unit purchasing cost, annual
consumption amount and groups of V, E and
D were transferred to the program. The
screenshots of the program are given in the
following.
Figure 1.Excel-based inventory control program.
Hacer GünerGören et al. An Excel-Based Inventory Control System Based on ABC and VED Analyses for
Pharmacy: A Case Study
Galore International Journal of Health Sciences and Research (www.gijhsr.com) 14
Vol.2; Issue: 1; March 2017
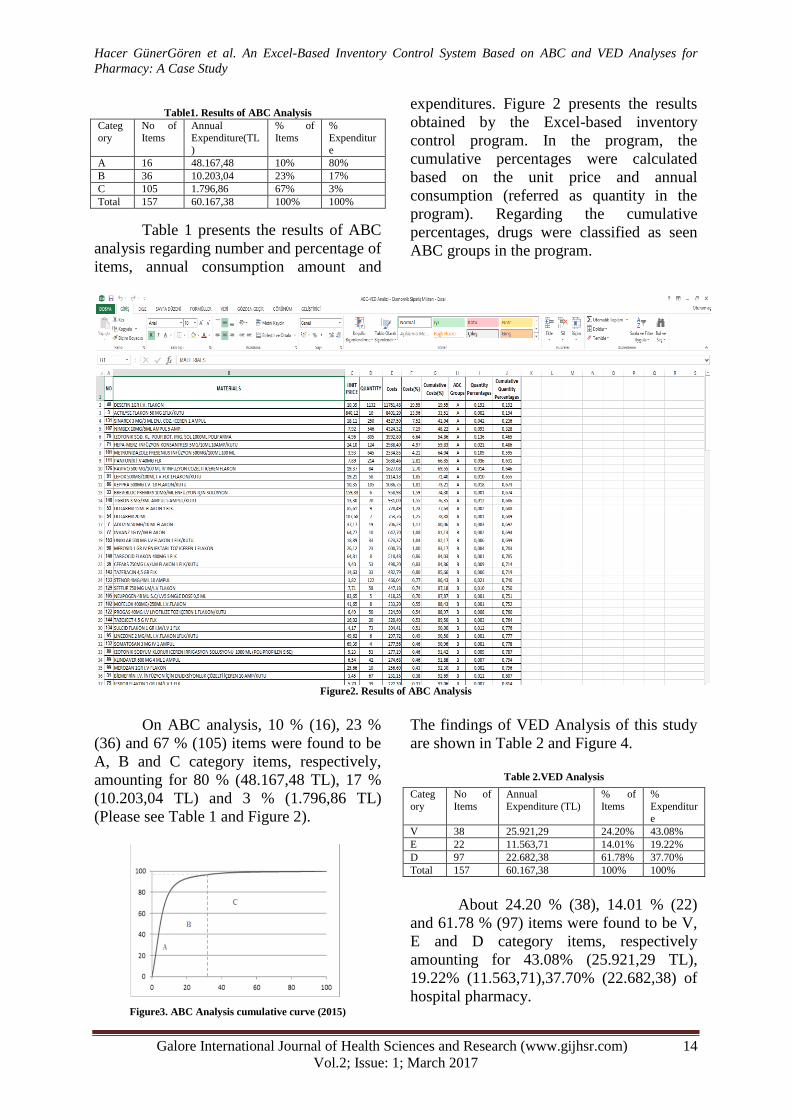
Table1. Results of ABC Analysis
Categ
ory
No of
Items
Annual
Expenditure(TL)
% of
Items
%
Expenditure
A 16 48.167,48 10% 80%
B 36 10.203,04 23% 17%
C 105 1.796,86 67% 3%
Total 157 60.167,38 100% 100%
Table 1 presents the results of ABC
analysis regarding number and percentage of
items, annual consumption amount and
expenditures. Figure 2 presents the results
obtained by the Excel-based inventory
control program. In the program, the
cumulative percentages were calculated
based on the unit price and annual
consumption (referred as quantity in the
program). Regarding the cumulative
percentages, drugs were classified as seen
ABC groups in the program.
Figure2. Results of ABC Analysis
On ABC analysis, 10 % (16), 23 %
(36) and 67 % (105) items were found to be
A, B and C category items, respectively,
amounting for 80 % (48.167,48 TL), 17 %
(10.203,04 TL) and 3 % (1.796,86 TL)
(Please see Table 1 and Figure 2).
Figure3. ABC Analysis cumulative curve (2015)
The findings of VED Analysis of this study
are shown in Table 2 and Figure 4.
Table 2.VED Analysis
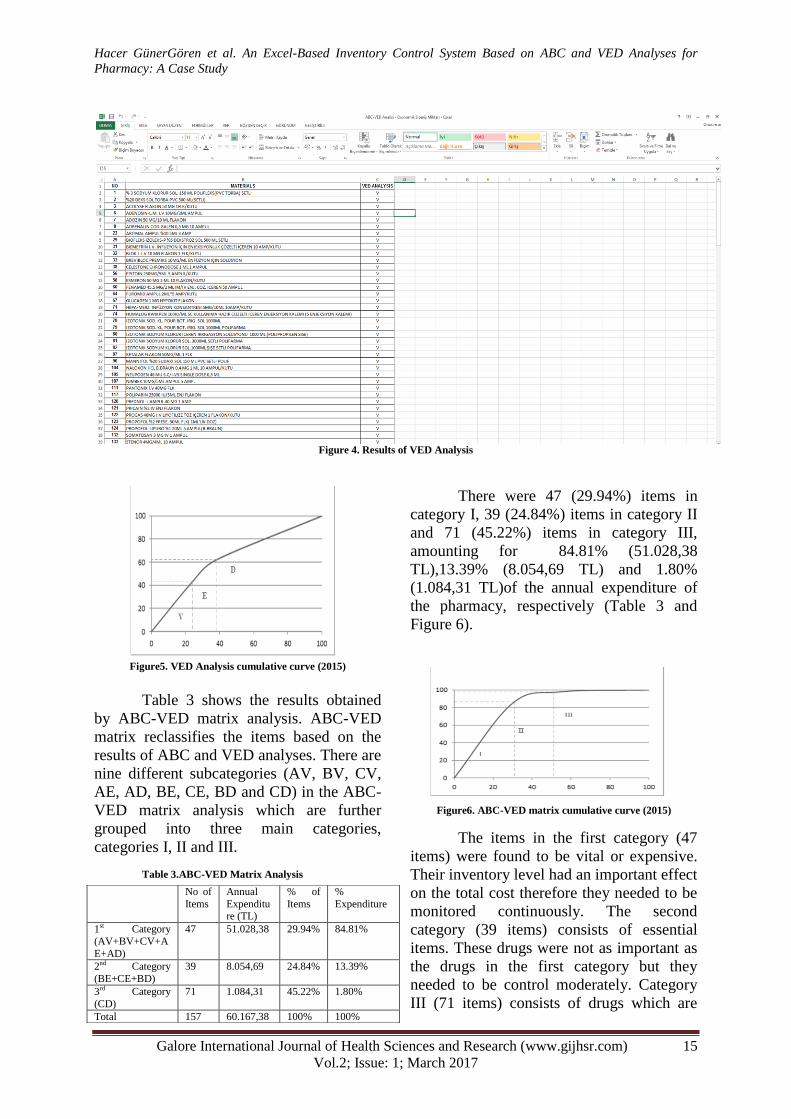
About 24.20 % (38), 14.01 % (22)
and 61.78 % (97) items were found to be V,
E and D category items, respectively
amounting for 43.08% (25.921,29 TL),
19.22% (11.563,71),37.70% (22.682,38) of
hospital pharmacy.
Categ
ory
No of
Items
Annual
Expenditure (TL)
% of
Items
%
Expenditure
V 38 25.921,29 24.20% 43.08%
E 22 11.563,71 14.01% 19.22%
D 97 22.682,38 61.78% 37.70%
Total 157 60.167,38 100% 100%
Hacer GünerGören et al. An Excel-Based Inventory Control System Based on ABC and VED Analyses for
Pharmacy: A Case Study
Galore International Journal of Health Sciences and Research (www.gijhsr.com) 15
Vol.2; Issue: 1; March 2017
Figure 4. Results of VED Analysis
Figure5. VED Analysis cumulative curve (2015)
Table 3 shows the results obtained
by ABC-VED matrix analysis. ABC-VED
matrix reclassifies the items based on the
results of ABC and VED analyses. There are
nine different subcategories (AV, BV, CV,
AE, AD, BE, CE, BD and CD) in the ABC-
VED matrix analysis which are further
grouped into three main categories,
categories I, II and III.
Table 3.ABC-VED Matrix Analysis
There were 47 (29.94%) items in
category I, 39 (24.84%) items in category II
and 71 (45.22%) items in category III,
amounting for 84.81% (51.028,38
TL),13.39% (8.054,69 TL) and 1.80%
(1.084,31 TL)of the annual expenditure of
the pharmacy, respectively (Table 3 and
Figure 6).
Figure6. ABC-VED matrix cumulative curve (2015)
The items in the first category (47
items) were found to be vital or expensive.
Their inventory level had an important effect
on the total cost therefore they needed to be
monitored continuously. The second
category (39 items) consists of essential
items. These drugs were not as important as
the drugs in the first category but they
needed to be control moderately. Category
III (71 items) consists of drugs which are
No of
Items
Annual
Expenditure (TL)
% of
Items
%
Expenditure
1st Category
(AV+BV+CV+A
E+AD)
47 51.028,38 29.94% 84.81%
2nd Category
(BE+CE+BD)
39 8.054,69 24.84% 13.39%
3rd Category
(CD)
71 1.084,31 45.22% 1.80%
Total 157 60.167,38 100% 100%

Hacer GünerGören et al. An Excel-Based Inventory Control System Based on ABC and VED Analyses for
Pharmacy: A Case Study
Galore International Journal of Health Sciences and Research (www.gijhsr.com) 16
Vol.2; Issue: 1; March 2017
cheap and desirable. These drugs should be
given the least priority and purchased
periodically.
Figure7. Results of ABC-VED matrix
In the last step, the Excel-based inventory program was used to determine the order
sizes of the drugs. The Economic Order Quantity (EOQ) model was used to determine the
order sizes since the annual demands were found to be constant. EOQ is the order quantity
that minimizes the total costs including inventory holding and ordering costs. It is the most
widely used approach in determining the order sizes when the annual demand is constant. For
further information regarding the EOQ, the reader can refer to Harris. [13]
The quantities
determined using the Excel-based program were given in Figure 8.
Figure 8. Order quantities determined.
Hacer GünerGören et al. An Excel-Based Inventory Control System Based on ABC and VED Analyses for
Pharmacy: A Case Study
Galore International Journal of Health Sciences and Research (www.gijhsr.com) 17
Vol.2; Issue: 1; March 2017
In Figure 8, the results of ABC,
VED and ABC-VED Matrix can be seen.
Moreover, economic order quantities of
these items were given. This Excel-based
program will help hospital staff in doing
these analyses easily and correctly.
Furthermore, no shortage problems would
occur since which drugs would be given
more priority, had already been determined.
CONCLUSION
In health institutions, effective and
planned inventory control is essential in
order to determine demand definitively,
optimize the use of financial resources,
make the best use of the opportunities
offered by renewable and developing
technologies, and provide timely and
necessary supplies. It is possible to follow
the movements and control of drugs within
the hospital using inventory management.
Inventory management includes all
processes from procurement of materials to
the consumption of end user. The
workflows in these processes should be
specified and material must be recorded in
every physical environment.
In this study, drugs were grouped
according to their cost and vital importance
in order to make decisions related to
inventory control and to keep the costs
related at minimum level. Drugs have been
standardized by ABC-VED analysis. Thus,
drugs with higher importance will be
controlled more frequently; drugs with
lesser importance and counterparts will be
controlled with longer intervals. Therefore,
the work force will be shaped according to
this analysis and the negativities
experienced in the past will be prevented.
REFERENCES
1. Kant S., Pandaw CS, Nath LM. A management
technique for effective management of medical
store in hospitals. Medical store management
store. J Academy of Hosp Admin. 1996-1997; 8-
9 (2-1): 41-7.
2. Yiğit, V. Hastanelerde Stok Kontrol Analizi:
Akdeniz Üniversitesi Hastanesinde Bir
Uygulama.Sayıştay Dergisi. 2014; 93: 4 (in
Turkish).
3. Özcan, A.Y.QuantitativeMethods in Health Care
Management: Techniques And Applications.
USA, A WileyImprint, 2009.
4. Theptong J. Drug Inventory Control. Case: Thai
International Hospital Mahasarakham.
Tampereen Ammattikorkeakoulu University of
Applied Sciences Business School, Degree
Programme in International Business. Tampere,
2010, 56 pages.
5. Gupta N. Inventory Analysis in a Private Dental
Hospital in Bangalore, India. J of Clinical and
DiagnosticRes. 2016; 10(11):10-2.
6. AntonoglouDimitrios, Kastanioti
Catherine, Niakas Dimitris. ABC and VED
Analysis of Medical Materials of a General
Military Hospital in Greece. J of Health Manag.
2017; 19 (1): 170-179.
7. Yiğit, V. MedicalMaterials Inventory Control
Analysis at UniversityHospital in Turkey. Int J
of Health S and Res. 2017; 7 (1); 227-231.
8. Yeşilyurt, Ö.,Sulak, H., Bayhan, M.
SağlıkSektöründe Stok KontrolFaaliyetlerinin
ABC ve VED AnalizleriyleDeğerlendirilmesi:
IspartaDevletHastanesiÖrneği.SüleymanDemirel
İktisadiveİdariBilimlerFakültesiDergisi. 2015;
20 (1): 365-376 (in Turkish).
9. Wandalkar, Poorwa, P. T.Pandit, ve A. R. Zite.
ABC and VED analysis of thedrugstore of a
tertiarycareteachinghospital. Indian J of Basic
ApplMedicalRes. 2013; 3 (1): 126-131.
10. Devnani, M., Gupta AK, Nigah R. ABC and
VED Analysis of the Pharmacy Store of Tertiary
Care Teaching, Research and Referral
Healthcare Institute of India, J of Young Pharm.
2010; 2 (2): 201-205.
11. Vaz, F.S., Ferreria, A.M., Kulkarni, M.S.,
Motgharde, D.D., Pereira-Antao, I. A Study of
Drug Expenditure at a Tertiary Care Hospital:
An ABC-VED Analysis. J of Health Manag.
2008; 10 (1): 119-127.
12. Coyle, John J. Bardi, Edward J. Langley C. John
Jr. 2003. The Management of Business
Logistics: A Supply Chain Perspective. 7th
edition. South-Western Thomson Learning.
13. Harris, Ford W. How Many Parts to Make at
Once". Operations Res. 1990; 38 (6): 947.
How to cite this article: GünerGören H, Dağdeviren
O. An excel-based inventory control system based on
ABC and VED analyses for pharmacy: a case
study.Galore International Journal of Health Sciences
& Research. 2017; 2(1): 11-17.
******


![Untitled-1 [animalmedicalresearch.org]animalmedicalresearch.org/Vol.2_Issue-2_December_2012/1st...E-mail : embryostar@gmil.com BEST WISHES FROM EMBRYO GROUP OF COMPANIES OUR BUSINESS](https://static.fdocuments.in/doc/165x107/5b39cd207f8b9a5a178ec497/untitled-1-a-a-embryostargmilcom-best-wishes-from-embryo-group-of-companies.jpg)