An Evaluation of The IMF and Aid to Sub-Saharan...
133
INTERNATIONAL MONETARY FUND INDEPENDENT EVALUATION OFFICE An Evaluation of The IMF and Aid to Sub-Saharan Africa March 12, 2007 This report was prepared by a team led by Joanne Salop, and including Martin Kaufman, Markus Berndt, Steve Kayizzi-Mugerwa, Scott Standley, and Tim de Vaan. Contributions were also made by Thomas Reichmann, Luis Alvaro Sanchez Baracaldo, and Misa Takebe. David Bevan, Kwesi Botchwey and David Peretz provided useful comments. Final judgments expressed in this report are the responsibility of the IEO alone. The report was approved by Thomas Bernes, Director of the Independent Evaluation Office (IEO).
Transcript of An Evaluation of The IMF and Aid to Sub-Saharan...

INTERNATIONAL MONETARY FUND
INDEPENDENT EVALUATION OFFICE
An Evaluation of The IMF and Aid to Sub-Saharan Africa
March 12, 2007
This report was prepared by a team led by Joanne Salop, and including Martin Kaufman, Markus Berndt, Steve Kayizzi-Mugerwa, Scott Standley, and Tim de Vaan. Contributions were also made by Thomas Reichmann, Luis Alvaro Sanchez Baracaldo, and Misa Takebe. David Bevan, Kwesi Botchwey and David Peretz provided useful comments. Final judgments expressed in this report are the responsibility of the IEO alone. The report was approved by Thomas Bernes, Director of the Independent Evaluation Office (IEO).

iii
Contents Page
Abbreviations and Acronyms ...........................................................................................v Executive Summary ....................................................................................................... vii I. Introduction ...................................................................................................................1 II. Country Policies and Programs ....................................................................................3
A. Accommodation of Aid....................................................................................5 B. Analysis of Aid...............................................................................................11 C. Key Features Agenda .....................................................................................15
III. IMF Relationship Management in SSA....................................................................21
A. The Authorities ..............................................................................................22 B. Donors ............................................................................................................25 C. Multilateral Partners.......................................................................................27 D. Civil Society...................................................................................................30
IV. Institutional Drivers of IMF Behavior......................................................................32
A. Executive Directors........................................................................................32 B. Management ...................................................................................................34 C. Operational Staff ............................................................................................36
V. Findings and Recommendations ................................................................................40
A. Findings..........................................................................................................40 B. Recommendations ..........................................................................................42
Boxes 1.Trends in Aid, Policies, and Outcomes in SSA .............................................................4 2. Spending and Absorbing Additional Aid......................................................................5 3. Different Concepts of Aid Scenarios ..........................................................................13 4. PRGF Key Features ....................................................................................................15 5. Location of Work........................................................................................................22 6. Informing the PRGF Dialogue with the Authorities...................................................23 7. Fund Engagement with Donors: Different Possible Roles .........................................33 8. Resident Representatives’ Perspective on Donor Coordination .................................39 Charts 1. Programmed Current Account Responses to Aid Increases .........................................6 2. Programmed Fiscal Responses to Aid Increases .........................................................7 3. Inflation Targets in SSA PRGFs and ESAFs................................................................8 4. Survey Views on PRGF Analysis of Absorptive Capacity...........................................9 5. Programmed and Actual Aid Flows: PRGFs Underpredicted Medium-Term Inflows................................................................................................12
iv
6. Public Spending on Education, Health, and PRE .....................................................16 7. Survey Views on IMF Staff/Authorities Interface: Connect ....................................25 8. Survey Views on IMF Staff/Donor Interface: Disconnect .......................................27 9. Survey Views on Accommodation of Earmarked Aid ............................................28 10. Survey Views on IMF Staff/World Bank Staff Interface: Disappoint .....................29 11. Survey Views on IMF Staff/Local Civil Society Interface: Major Disconnect........31 12. With Whom do Staff Spend their Time? ..................................................................31 13. Survey Views on the Relevance of PRSP for PRGF and Vice Versa ......................36 14. Survey Views on Relevance of PRGFs for Macro, Growth, Poverty Reduction, and Other MDGs.......................................................................37 15. Surveyed Mission Chief Views on Fiscal Deficits, Inflation, and Domestic Debt...37 16. Survey Views on Fund Proactivity in Discussing Aid Gaps with Donors ...............38 Annexes A. Board Perspective on Relevant Issues .......................................................................43 B. Quantitative Analysis .................................................................................................50 C. Country Desk Reviews: Methodology and Summary Findings.................................59 D. Country Case Studies: Program Change in Major Aid Recipients ............................71 E. Evaluation Survey .....................................................................................................78 References.......................................................................................................................83
v
Abbreviations and Acronyms
AfDB AFR AFRITAC AFRODAD CAR CGD CSO DFID DRC EPA ESAF EXR FAD GDP HIPC IEO IFI IMF IMFC MDG MDRI MONA MTS NGO NIR ODA OECD PC PDR PEFA PFP PRE PRGF PRS PRSP PSIA SSA SWAp UNAIDS UNDP UNECA UNICEF VAT WHO
African Development Bank African Department (IMF) African Regional Technical Assistance Center African Forum and Network for Debt and Development Central African Republic Center for Global Development Civil Society Organization Department for International Development (UK) Democratic Republic of the Congo Ex-Post Assessment Enhanced Structural Adjustment Facility External Relations Department Fiscal Affairs Department (IMF) Gross Domestic Product Heavily Indebted Poor Country Independent Evaluation Office (IMF) International Financial Institution International Monetary Fund International Monetary and Financial Committee Millennium Development Goal Multilateral Debt Relief Initiative Monitoring of Fund Arrangements Medium-Term Strategy Non-Governmental Organization Net International Reserves Official Development Assistance Organization for Economic Co-operation and Development Performance Criteria Policy Development and Review Department (IMF) Public Expenditure Management and Financial Accountability Policy Framework Paper Poverty-Reducing Expenditure Poverty Reduction and Growth Facility Poverty Reduction Strategy Poverty Reduction Strategy Paper Poverty and Social Impact Assessment Sub-Saharan Africa Sector-Wide Approach Joint United Nations Programme on HIV/AIDS United Nations Development Programme United Nations Economic Commission for Africa United Nations Children’s Fund Value Added Tax World Health Organization


vii
EXECUTIVE SUMMARY
I. INTRODUCTION
i. This report sets out the main findings and recommendations of an independent evaluation of the IMF’s role and performance in the determination and use of aid to low-income countries in Sub-Saharan Africa (SSA). The evaluation focused on 1999–2005. This was a time of improving macroeconomic performance in much of SSA, with increasing growth and falling inflation. It was a time when aid to SSA recovered from earlier declines, debt relief gained momentum, and donors began to move to multi-donor budget support. It was a time when the PRSP was introduced—in late 1999—and the IMF transformed its Enhanced Structural Adjustment Facility (ESAF) into the Poverty Reduction and Growth Facility (PRGF).
ii. As the above changes unfolded during the period, variations on longstanding criticisms of the IMF’s work in SSA emerged, with three providing a point of reference for the evaluation. The first is that IMF-supported programs have blocked the use of available aid to SSA through overly conservative macroeconomic programs. The second is that such programs have lacked ambition in projecting, analyzing, and identifying opportunities for the use of aid inflows to SSA countries, which may in turn have tempered donors’ actual provision of aid. The third is that IMF-supported programs have done little to address poverty reduction and income distributional issues despite institutional rhetoric to the contrary.
iii. Board-approved policies underpinned the assessment framework used by the evaluation team in examining staff performance. Also relevant is Management’s translation of Board decisions into operational guidance to staff. IMF communications, through Management and senior staff speeches, press releases, articles, and correspondence with newspapers are germane as well. These communications constitute an important channel for articulating Fund positions and informing external audiences about what the IMF has undertaken to do; they create expectations against which Fund performance is judged externally.
iv. A recurring theme of the evaluation concerned the disconnect in external perceptions between the Fund’s rhetoric on aid and poverty reduction and what it actually did at the country level. In a number of instances, the Fund’s partnership with the World Bank in support of the Poverty Reduction Strategy (PRS) process, Global Monitoring, and other initiatives—and related communications—has blurred perceptions of Fund accountabilities on aid and poverty reduction at the country level. To distinguish the Fund’s work from that of the World Bank and other partners—and the authorities whom their efforts support—the evaluation team focused narrowly on evidence from programs supported by the PRGF, for which the Fund is a principal and on which 29 SSA countries drew during the 1999–2005 evaluation period.
viii
II. FINDINGS v. Underlying the theme of disconnect is a larger issue of attempted—but ultimately unsuccessful—institutional change. When the PRGF was introduced, it was meant to be more than a name change. It set out a new way of working, grounded in the PRS process, with programs based on specific country-owned measures geared to poverty reduction and growth, and an ambitious vision of the Fund’s role on the analysis and mobilization of aid, working in close partnership with the Bank. But in the face of a weakening consensus in the Board and a staff professional culture strongly focused on macroeconomic stability—and, most important, changes in Senior Management and a resulting lack of focused institutional leadership and follow-through—the Fund gravitated back to business as usual.
vi. The good news is that country performance has improved in a number of SSA countries over the period—thanks in part to the advice and actions of the Fund, including through the HIPC Initiative and the MDRI, and in larger part to the actions of the country authorities—and that donor performance has improved as well. In such cases, PRGF-supported macroeconomic program design has eased and become more accommodative of aid. The combination of improved country and donor performance and the associated adaptation of PRGF program design have materially improved SSA’s prospects for growth and poverty reduction.
vii. The evaluation’s specific findings follow:
• PRGF-supported macroeconomic policies have generally accommodated the use of incremental aid in countries whose recent policies have led to high stocks of reserves and low inflation; in other countries additional aid was programmed to be saved to increase reserves or to retire domestic debt. Reserves in the 2-3 months-of-imports range were found to be the threshold for determining whether the increased aid should be used to expand the current account deficit or to increase reserves. The estimated inflation threshold for determining whether the country got to spend or save additional aid lies within the 5-7 percent range. These findings are consistent with Board-approved policy on the accommodation of aid, Management guidance and feedback to staff, and staff views. However, they also help to explain why outside observers perceive the Fund as “blocking” the use of aid: PRGFs in countries with inflation above the threshold are likely to program the saving of at least part of additional aid.
• PRGFs have neither set ambitious aid targets nor identified additional aid opportunities—where absorptive capacity exceeds projected aid inflows. They have indirectly catalyzed aid—through their macroeconomic assessment and support for country efforts to improve the underlying macroeconomic environment and fiscal governance. Their medium-term aid forecasts have shown signs of adapting to the increased persistence of aid to SSA—after having been overly conservative at the start. But IMF staff have done little to analyze additional policy and aid scenarios and to share the findings with the authorities and donors. They have not been proactive in mobilizing aid resources, a topic where the Board remains divided and Fund policy—and operational guidance to staff—are unclear.

ix
• Of the key features distinguishing the PRGF from the ESAF, fiscal governance has been far more systematically treated than other elements, such as the use of social impact analysis or the pro-poor and pro-growth budget provisions. The strong PRGF efforts on fiscal governance reflect clear, consistent, and continuing support from the Board; the issue’s centrality to the Fund’s core macro objectives through its links to budget execution; and effective Fund/Bank collaboration, grounded in professional capacity in both institutions. Executive Directors’ support for Poverty and Social Impact Analysis (PSIA), though strong, has been more measured; social analysis is less central to the Fund’s core mandate; and the tailoring of PSIA to PRGF needs was initially stymied by unrealistic expectations of how Fund/Bank collaboration might work on the issue, with more recent efforts focused on in-house analysis. Weak Fund/Bank collaboration has also been a factor in the Fund’s failure to pay more attention to infrastructure-related growth and competitiveness linkages and their possible macroeconomic implications for the programmed spending and absorption of additional aid.
• IMF communications on aid and poverty reduction have contributed to the external impression that the Fund committed to do more on aid mobilization and poverty-reduction analysis. The resulting disconnect has reinforced cynicism about, and distrust of, Fund activities in SSA and other low-income countries. It was especially large in the early years of the evaluation period, when Management communications stressed the two-way linkages between growth and poverty reduction. But it remains a concern even today, in the context of external communications on IMF support for alternative scenarios, MDG strategies, and the mobilization of aid that overstate what the Fund is doing in the context of PRGFs.
• The Fund has missed opportunities for communicating with a broader audience in SSA. The Fund has a network of resident representatives in SSA. Demands on their time have increased in recent years with the changing aid environment, and donors’ increased decentralization and use of budget support instruments. But staff resources and skills have constrained their ability to fully engage with local partners in this changing environment. Meanwhile, they remain a largely untapped source of information on what is happening on the ground among donors and civil society; their observations do not systematically inform institutional positions.
III. RECOMMENDATIONS
viii. Going forward, the evaluation points to three recommendations for improving the coherence—actual and perceived—of the institution’s policies and actions relating to aid to SSA. They may also be relevant to several undertakings included in the Medium Term Strategy (MTS).
• The Executive Board should reaffirm and/or clarify Fund policies on the underlying performance thresholds for the spending and absorption of additional aid, the mobilization of aid, alternative scenarios, PSIA, and pro-poor and pro-growth budget frameworks. Based on these reaffirmations and/or clarifications, Management should provide clear guidance to staff on what is required,

x
encouraged, permitted, and/or prohibited—including in working with the World Bank and other partners—and ensure effective implementation and results. The External Relations Department should ensure the consistency of institutional communications with Board-approved operational policies and Fund-supported operations.
• Management should establish transparent mechanisms for monitoring and evaluating the implementation of the clarified policy guidance. The Fund’s Ex-Post Assessments should explicitly cover staff actions and contributions to the implementation of existing and clarified policies. But in view of widespread external concerns about IMF staff accountability in SSA, a more periodic and transparent stocktaking across country programs is needed, possibly in the context of Board reviews of the PRGF—or in future reviews of the MTS.
• Management should clarify expectations—and resource availabilities—for resident representatives’ and missions chiefs’ interactions with local donor groups and civil society. It should monitor trends in the institution’s country-level operating environment, including for aid, periodically assessing the cross-country implications for Fund policies and strategies.
1
I. INTRODUCTION
1. This report sets out the main findings and recommendations of an independent evaluation of the IMF’s role and performance in the determination of the external resource envelope in low-income countries in Sub-Saharan Africa (SSA). The evaluation concentrated on aid—the principal source of external financing for most such countries—and in particular on how the IMF has interfaced with country recipients and donors in shaping the provision and use of aid in the pursuit of poverty reduction and other development goals. It focused on programs supported by the Poverty Reduction and Growth Facility (PRGF)—the Fund’s primary instrument for operational work in SSA.
2. The evaluation focused on 1999–2005—a period of major changes in the external context for IMF activities in SSA. This was a time of improving macroeconomic performance in a number of SSA countries, with increasing growth rates and decreasing inflation rates—but almost no change in the share of the population living in poverty. It was a time when the international community came together on the Millennium Development Goals (MDGs), supported by the Monterrey Consensus on the need for better policies by developing countries and more and better aid and trade opportunities by developed countries. It was a time when aid to SSA recovered from the declines of the early 1990s, and donors began to move to multi-donor budget support in many SSA countries. All had implications for the Fund’s work.
3. Within the Fund, the evaluation period begins with the introduction of the PRGF—in the final year of the Camdessus era—and ends with the launch of the Medium-Term Strategy (MTS). The new millennium was approaching, and pressures were building on Fund shareholders for action on debt forgiveness and poverty reduction. Major topics at the Annual Meetings of September 1999 were the Enhanced HIPC Initiative, the Poverty Reduction Strategy (PRS) process, and the transformation of the Enhanced Structural Adjustment Facility (ESAF) into the Poverty Reduction and Growth Facility (PRGF). Under the new approach, which was operationalized by the Board(s) before end-1999, the roles of the Fund and the Bank closely intertwined through the PRSP and HIPC processes. The next few years saw much experimentation, with country ownership through the PRS process gaining momentum.
4. As the above changes unfolded during the period, variations on longstanding criticisms of the IMF’s work in SSA emerged, with three providing a point of reference for the evaluation. The first is that IMF-supported programs have blocked the use of available aid to SSA through overly conservative macroeconomic programs. The second is that such programs have lacked ambition in projecting, analyzing, and identifying opportunities for the use of aid inflows to SSA countries, which may in turn have tempered donors’ actual provision of aid. The third is that IMF-supported programs have done little to address poverty reduction and income distributional issues despite institutional rhetoric to the contrary.
5. Board-approved policies underpin the assessment framework used by the evaluation team in examining staff performance in these areas. Such policies
2
summarize what the IMF Executive Directors have decided is to be the Fund’s role in these areas, thereby providing the mandate for staff behavior.1 Also relevant to the assessment framework is Management’s translation of Board decisions into operational policies for guidance to staff on implementation. IMF communications, through Management and senior staff speeches, EXR press releases, articles, and correspondence with newspapers are germane as well. These communications constitute an important channel for articulating Fund positions and informing external audiences about what the IMF has undertaken to do.
6. A recurring theme of the evaluation concerned the disconnect in external perceptions between what the Fund committed to do on aid and poverty reduction and what it actually did at the country level. In a number of instances, the Fund’s partnership with the World Bank in support of the Poverty Reduction Strategy (PRS) process, Global Monitoring, and other initiatives—and related communications—has blurred perceptions of Fund accountabilities on aid and poverty reduction at the country level. To distinguish the Fund’s unique role and mandate from that of the World Bank and other partners—and the authorities whom their efforts support—the evaluation team focused narrowly on evidence from programs supported by the Poverty Reduction and Growth Facility, which is the Fund’s instrument for supporting countries in implementing the PRSP approach, and on which 29 SSA countries drew during the 1999–2005 evaluation period.
7. Against this background, the report distills the main points of the evaluation, focusing on what the Fund actually did on aid and poverty reduction in SSA against what it had committed to do. The remainder of the report is structured as follows. Chapter II examines the empirical and documentary evidence on how SSA PRGFs have treated (i) the accommodation of aid via the design of macroeconomic policies; (ii) the forecasting and analysis of aid; and (iii) the PRGF pro-poor and pro-growth agenda. Chapter III looks at Fund staff interactions with the authorities—the Fund’s main client—bilateral and multilateral donors, and civil society on aid and related issues. Chapter IV looks at drivers of Fund behavior—Board-approved policies, Management leadership, guidance, and communications, and staff views. Chapter V sets out the evaluation’s findings and recommendations. Annex A summarizes relevant Board conclusions. Annex B describes the evaluation’s quantitative analysis. Annex C profiles the 29 countries in the evaluation sample and discusses the findings of the country desk reviews. Annex D examines the case-study results. Annex E summarizes the evaluation survey’s methodology and results.
1 As background for the discussion, Annex A quotes the Chairman’s concluding remarks and summings-ups of relevant Board discussions; it also includes a timeline to guide the reader through the evolution of Board thinking. See Annex A, Table A1.

3
II. COUNTRY POLICIES AND PROGRAMS 8. This chapter reports on the evaluation’s findings about aid-related issues in the design of PRGF-supported programs. It covers: (i) the links between aid and current account and fiscal adjustment in PRGFs; (ii) PRGFs’ analysis of aid; and (iii) the PRGF’s pro-poor and pro-growth agenda.2 The chapter’s focus is on program design—both for the initial PRGF program period and for subsequent program periods following reviews—as it is at the design stage that Fund staff’s inputs and contributions are most clearly seen.
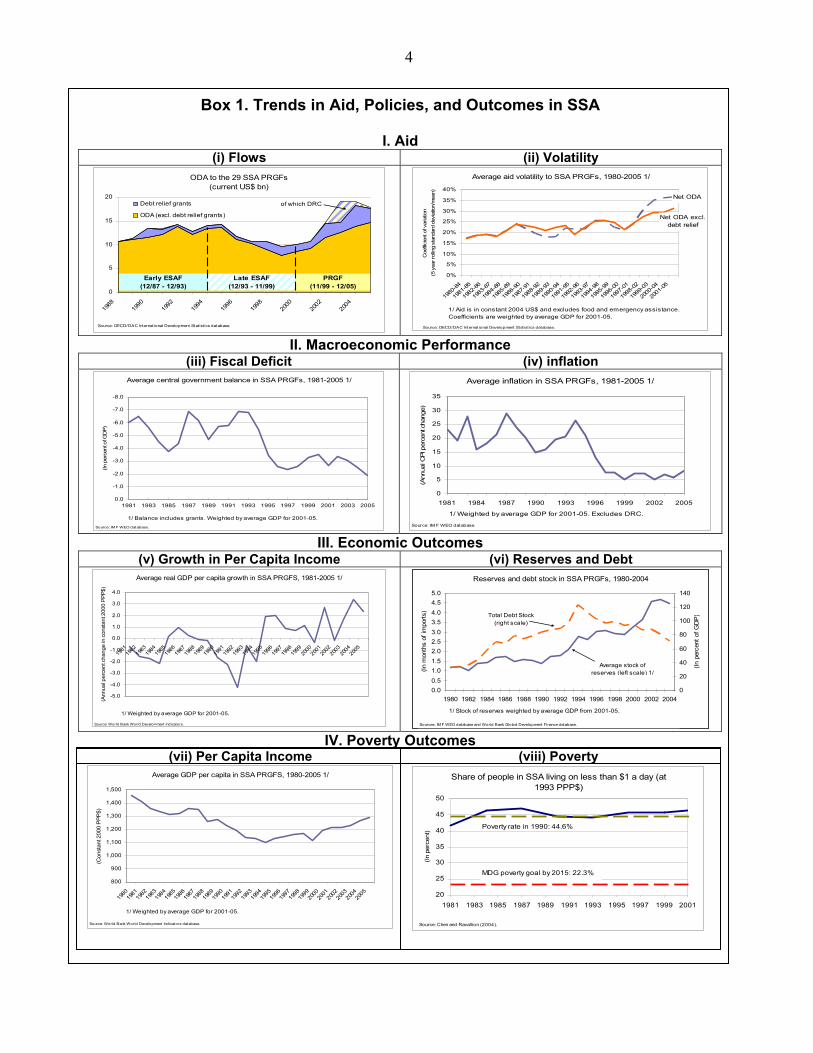
9. Box 1 overviews developments in SSA on aid, macroeconomic indicators, growth, and poverty reduction. Panel (i) summarizes recent aid trends. As illustrated, ODA to the 29 SSA countries under study declined during the ESAF period, bottomed out in 1999, and recovered during the PRGF period. These developments reflect the changing aid environment for SSA since the adoption of the MDGs and the improving performance of many SSA countries, a factor in donor aid plans. Panel (i) also shows trends in debt relief grants, which surged starting in 2002.
10. Three factors in the changing aid profile are worth noting. First, the ESAF period’s aid downswing affected almost all SSA countries, while the PRGF period’s upswing has mainly affected two groups of countries—post-conflict countries and good-performing countries. Second, aid volatility has remained high throughout the period.3 (See panel (ii).) Third, the aid shown in panel (i) include grants and concessional loans with a grant element of at least 35 percent. Under Fund guidelines, all PRGFs strictly limit—and often totally preclude—government contracting or guaranteeing of non-concessional foreign debt, with specific limits placed on the minimum degree of concessionality.4
11. Box 1 also illustrates the improving macroeconomic policies and outcomes in the 29 SSA PRGF countries. As shown in panels (iii) and (iv), both the government deficit and inflation have dropped sharply since the mid-1990s. Growth in per capita income, while still low, has become much more consistently positive, and per capita incomes have begun to recover from their lows of the mid-1990s. Going forward, enormous challenges clearly remain, especially in terms of poverty reduction, which has not yet seen a significant reduction of the proportion of people living on less than US$1 a day.
2 See IMF (2000a). 3 The end-of-period increase in Box 1’s volatility chart reflects the step-up in aid to SSA discussed in paragraph 9. 4 See IMF (2006g). These debt limitations have stemmed from concerns about debt sustainability and free-rider issues in connection with debt relief initiatives. Until recently, they were generally not binding as market conditions limited creditor interest. But in a post-HIPC and post-MDRI world, the situation has changed, with major issues related to controlling the accumulation of new debt going forward.
4
Box 1. Trends in Aid, Policies, and Outcomes in SSA
I. Aid (i) Flows (ii) Volatility
ODA to the 29 SSA PRGFs(current US$ bn)
0
5
10
15
20
1988
1990
1992
1994
1996
1998
2000
2002
2004
Debt relief grants
ODA (excl. debt relief grants)
Source: OECD/DAC Internat ional Development Statist ics database.
of which DRC
PRGF (11/99 - 12/05)
Late ESAF (12/93 - 11/99)
Early ESAF (12/87 - 12/93)
Average aid volatility to SSA PRGFs, 1980-2005 1/
Net ODA
Net ODA excl. debt relief
0%
5%
10%
15%
20%
25%
30%
35%
40%
1980
-84
1981
-85
1982
-86
1983
-87
1984
-88
1985
-89
1986
-90
1987
-91
1988
-92
1989
-93
1990
-94
1991
-95
1992
-96
1993
-97
1994
-98
1995
-99
1996
-00
1997
-01
1998
-02
1999
-03
2000
-04
2001
-05
Coe
ffici
ent o
f var
iatio
n (5
yea
r rol
ling
stan
dard
dev
iatio
n/m
ean)
1/ Aid is in constant 2004 US$ and excludes food and emergency assistance. Coefficients are weighted by average GDP for 2001-05.
Source: OECD/DAC Internat ional Development Stat ist ics database. II. Macroeconomic Performance
(iii) Fiscal Deficit (iv) inflation Average central government balance in SSA PRGFs, 1981-2005 1/
-8.0
-7.0
-6.0
-5.0
-4.0
-3.0
-2.0
-1.0
0.01981 1983 1985 1987 1989 1991 1993 1995 1997 1999 2001 2003 2005
(In p
erce
nt o
f GD
P)
1/ Balance includes grants. Weighted by average GDP for 2001-05.
Source: IM F WEO database.
Average inflation in SSA PRGFs, 1981-2005 1/
0
5
10
15
20
25
30
35
1981 1984 1987 1990 1993 1996 1999 2002 2005
(Ann
ual C
PI p
erce
nt c
hang
e)
1/ Weighted by average GDP for 2001-05. Excludes DRC.
Source: IM F WEO database.
III. Economic Outcomes (v) Growth in Per Capita Income (vi) Reserves and Debt
Average real GDP per capita growth in SSA PRGFS, 1981-2005 1/
-5.0
-4.0
-3.0
-2.0
-1.0
0.0
1.0
2.0
3.0
4.0
1981
1982
1983
1984
1985
1986
1987
1988
1989
1990
1991
1992
1993
1994
1995
1996
1997
1998
1999
2000
2001
2002
2003
2004
2005
(Ann
ual p
erce
nt c
hang
e in
con
stan
t 200
0 P
PP
$)
1/ Weighted by average GDP for 2001-05.
Source: World Bank World Development Indicators.
Reserves and debt stock in SSA PRGFs, 1980-2004
0.00.51.01.52.02.53.03.54.04.55.0
1980 1982 1984 1986 1988 1990 1992 1994 1996 1998 2000 2002 2004
(In m
onth
s of
impo
rts)
0
20
40
60
80
100
120
140
(In p
erce
nt o
f GD
P)Total Debt Stock
(right scale)
Average stock of reserves (left scale) 1/
1/ Stock of reserves weighted by average GDP from 2001-05.
Sources: IM F WEO database and World Bank Global Development Finance database. IV. Poverty Outcomes
(vii) Per Capita Income (viii) Poverty Average GDP per capita in SSA PRGFS, 1980-2005 1/
800
900
1,000
1,100
1,200
1,300
1,400
1,500
1980
1981
1982
1983
1984
1985
1986
1987
1988
1989
1990
1991
1992
1993
1994
1995
1996
1997
1998
1999
2000
2001
2002
2003
2004
2005
(Con
stan
t 200
0 P
PP$)
1/ Weighted by average GDP for 2001-05.
Source: World Bank World Development Indicators database.
Share of people in SSA living on less than $1 a day (at 1993 PPP$)
20
25
30
35
40
45
50
1981 1983 1985 1987 1989 1991 1993 1995 1997 1999 2001
(In p
erce
nt)
Poverty rate in 1990: 44.6%
MDG poverty goal by 2015: 22.3%
Source: Chen and Ravallion (2004).

5
A. Accommodation of Aid 12. This section reports on the evaluation’s findings on the design of PRGF-supported programs as a basis for addressing critics’ concerns that the IMF “blocks” or prevents the full use of available donor funding. To this end, the evaluation looked at how changes in the aid forecast mapped into changes in programmed levels of the fiscal and current account deficits.5 In the parlance of the Fund’s 2005 “spend and absorb” framework (see Box 2), this section of the report asks: (i) how much of increased aid was programmed to be absorbed (in higher net imports); and (ii) how much of increased aid was programmed to be spent (in higher net public expenditures)? It also examines (iii) how PRGFs analyzed aid absorptive capacity and (iv) PRGF program “adjusters” to see whether/how much of aid surprises could be spent and absorbed.
Box 2. Spending and Absorbing Additional Aid
This section’s empirical analysis utilizes the “spend and absorb” terminology set out in “The Macroeconomics of Managing Increased Aid Inflows—Experiences of Low-Income Countries and Policy Implications.”1 The latter was a background paper for the Board’s 2005 PRGF review. Focusing on five countries with aid increases during 1998-2003— Ethiopia, Ghana, Mozambique, Tanzania, Uganda—it compared how much was “absorbed” (as measured by changes in the current account deficit) with how much was “spent” (as measured by changes in the fiscal deficit). It focused on program outcomes, especially on the authorities’ performance in program implementation, which is not subject to this evaluation. This evaluation’s analysis focused on program design, as the primary conduit of the Fund’s influence. __________________ 1 See IMF (2005h) and Annex B of the current report.
(i) Current Account Adjustment
13. The evaluation’s empirical analysis finds that country conditions, as proxied by the level of international reserves, are the main determinant of whether/how much PRGFs permit the absorption of incremental aid. It also finds that on average SSA PRGFs do not call for current account adjustment during the first program year. This represents a departure from SSA ESAFs, which typically called for significant current account adjustment in the initial program year. The evidence points to increased expectations regarding aid inflows for the initial program year as well as improved reserve levels as reasons for this shift in program stance. Abstracting from these two determinants of program design, there is no evidence of an independent shift over time in program design with respect to the programmed absorption of increased aid.
5 More specifically, it looked at the correlation between changes in net aid inflows and changes in the net current account deficit before grants and interests (absorption of aid) and changes in the net primary fiscal deficit before grants (spending of aid) for those program years, in which the Fund anticipated increases in aid compared to one year before. The analysis relied on data from an internal IMF database—Monitoring of Fund Arrangements (MONA)—which contains macro variables for about 600 ESAF/PRGF requests and reviews, covering the period between 1993 and 2005. See Annex B for further details.

6
14. On average, across time and countries, SSA PRGFs programmed an immediate absorption of about 60 percent of anticipated aid increases. As illustrated in Chart 1, anticipated aid increases in SSA PRGFs are on average correlated with a widening of the current account6 of 63 percent of the anticipated increase. The remaining 37 percent is programmed to increase international reserves.7 This relationship is significantly affected by the initial stock of reserves measured in months of imports.
15. Underpinning the average rate of programmed absorption out of incremental aid are country differences in net international reserves. As shown in Chart 1, for countries with reserves below a threshold of 2.5 months of imports, absorption of incremental aid is nearly zero—as those countries are programmed to build their reserve position. This result is consistent with the evidence from the evaluation’s desk reviews, which found programmed increases in international reserves—in cases where initial reserve positions are low—identified as a way to manage vulnerabilities to external shocks associated with variations in the terms of trade or aid volatility. (See Annex C.) For countries with reserve levels above the threshold, programmed absorption averages 100 percent of incremental aid. 8 Case study analysis indicates that debt-sustainability concerns may be an additional factor reducing the programmed level of absorption—and increasing the programmed build up of reserves—in response to an increase in aid.9 (See Annex D.)
(ii) Fiscal Adjustment
16. The empirical analysis finds that country macroeconomic conditions, as proxied by the inflation rate, are the main determinant of whether/how much PRGFs permit the spending of incremental aid.10 It also finds that the sustained
6 Excluding official transfers and interest payments. 7 Assuming no private net capital outflows. The increased reserves do not necessarily have to be accumulated at the central bank but could also be held by the private sector. 8 For aid decreases, the estimated empirical relationship between programmed absorption levels and reserve stocks is smooth—with higher reserves associated with greater reserve financing of aid shortfalls. This is in contrast to the estimated relationship for aid increases, where the threshold of 2.5 months of reserves applies. (See Annex B.) 9 Of course, debt sustainability is also a factor affecting the assessment of country aid absorptive capacity with respect to grants vs. concessional credits. 10 Lack of MONA data on public domestic debt precluded the statistical analysis of its implications for program design, similar to inflation. Desk reviews, however, identified domestic debt as a key program driver. (See paragraph 20).
Chart 1. Programmed Current Account Responses to Aid Increases
Average programmed absorption of increases in aid in SSA PRGFs (in percent of aid increase)
5
100
63
95
37
Low stocks ofreserves
High stocks ofreserves
All
Increases in net imports (absorption) Increased reserves
Note: The cut-off for low and high stocks of reserves is 2.5 months of imports. See Annex B for
definitions, methodology and a discussion of robustness.

7
decline in SSA inflation rates—coupled with the recovery (and more) of donor inflows—has reduced the average fiscal correction in the first program year of new programs by about one percentage point of GDP relative to the ESAF period. The findings of staff interviews and desk reviews are consistent with these findings.
17. On average—that is across all countries experiencing aid increases during the PRF period—SSA PRGFs programmed immediate spending of about 30 percent of anticipated aid increases. Chart 2 illustrates how much of the programmed full absorption that can be observed in SSA countries with sufficient reserve stocks is translated into fiscal expansion (spending). On average, anticipated aid increases in SSA PRGFs are correlated with a widening of the fiscal deficit11 amounting to 28 percent of the anticipated increase. The remaining 72 percent is programmed as public savings, often through the retirement of domestic public debt.
18. Within the average, the evidence points to inflation concerns as a major driver of cross-country differences in programmed spending of incremental aid.12 As shown in Chart 2, differences in programmed spending levels of anticipated aid increases are highly correlated with initial inflation levels. According to the estimation, countries with inflation rates below 5 percent13 get to spend 79 percent of anticipated aid increases, on average; whereas, countries with higher inflation get to spend only 15 percent of such increases, on average.14 Consistent with this finding and as illustrated in Chart 3, cross-country analysis shows that on average SSA PRGFs have targeted inflation rates below 5 percent—with even lower program assumptions in CFA countries. Recently, in 2004 and 2005, while the average remained around 5 percent, greater upside and downside variation in PRGF inflation targets has emerged, with a significant number of programs targeting inflation rates above 7 percent in non-CFA countries.
11 Excluding grants and interest payments. 12 The statistical analysis suggests that the programmed fiscal adjustment to aid reductions is determined not by the initial inflation rate, but by the initial stock of reserves. In other words, even when inflation is 5 percent or less, IMF programs do not allow domestic financing to offset reductions in external aid. If there are sufficient reserves, they can be utilized. But if not, programs on average require the mobilization of increased domestic revenues and/or expenditure cuts to compensate for the reduction in aid. 13 Controlling for other initial conditions like domestic financing and growth, similar results are also found for higher thresholds up to 7 percent. See Annex B. 14 The statistical tests suggest that the 80 percent (associated with inflation rates below 5 percent) is not significantly different from 100 percent; while the 15 percent (associated with inflation rates above 5 percent) is not significantly different from zero.
Chart 2. Programmed Fiscal Responses to Aid Increases
Estimated programmed use of anticipated aid increases in SSA PRGFs with high stocks of reserves
(in % of anticipated aid increases)
15
79
28
85
72
21
Inflation above 5%
Inflation below 5%
All
Net fiscal expansion (spending) Domestic debt reduction / crowding in
Note: See Annex B for definitions, methodology and a discussion of robustness.

8
19. Critics argue that these inflation targets are unnecessarily low and prejudicial to country growth and poverty-reduction objectives. Drawing on the Fund’s own analysis, they argue the targets could be raised without sacrificing stability and growth objectives, thereby providing an additional source of fiscal space for priority programs.15 Survey results illustrated elsewhere in this report suggest that Fund SSA mission chiefs are evenly divided on whether (or not) the Fund should tolerate higher inflation rates in good performers, with no support for relaxing inflation targets in weak performers.16 During interviews, staff said that the authorities—especially of countries where there has been considerable success on stabilization—tended to resist an easing of targets. Meanwhile, IMF policy staff acknowledge that the empirical literature on the inflation-growth relationship is inconclusive, but weighing benefits and costs of inflation argue for an inflation target range of 5 to 10 percent since in their view “the scope for creating more fiscal space through a higher inflation tax is likely limited, if it exists at all.”17 This is consistent with IMF Board policy of single-digit inflation.18
20. The evaluation’s desk reviews support the finding that inflation control and domestic debt management have been key drivers of programmed spending levels. Program documents frequently cite the control of inflation as a factor in explaining program design, especially the setting of monetary and fiscal targets. And interviews with staff confirm that inflation remains a key driver of program design. Desk reviews show that domestic debt considerations loom large in PRGFs—with most programs limiting domestic financing of the government amid concerns about inflation, debt sustainability,
15 See, for example, ActionAid International (2005). 16 See the middle panel of Chart 15. Of the 22 mission chief respondents to the survey, only one said that he/she agreed/strongly agreed that higher inflation should be tolerated in all countries, that is, regardless of performance. 17 See IMF (2005g). 18 IMF (2005k)
Chart 3. Inflation Targets in SSA PRGFs and ESAFs 1/
CFA
Non-CFAAll SSA
SSA Actual 2/
0
5
10
15
20
25
1995 1997 1999 2001 2003 2005
(Ann
ual C
PI p
erce
nt c
hang
e)Targets at T+2
Actuals at T0
Sources: IM F M ONA database and IM F WEO database. 1/ Chart 7 data includes ESAF and PRGF inflation targets for two periods forward (T+2) for SSA countries with current programs. 2/ Actual data are for the initial conditions when the targets were made (T0) weighted by average GDP for 2001-05.

9
and private sector crowding out. (See Annex C.) Among the evaluation’s case studies, Mozambique was a clear case where concerns about crowding-out motivated the limitations on domestic borrowing, while in Ghana the level and sustainability of domestic debt was the main concern behind the program’s constraint on domestic financing.
(iii) Aid Absorptive Capacity
21. The desk reviews also point to PRGF analysis of three aspects of aid absorptive capacity—including competitiveness risks, fiscal/debt sustainability, and fiscal governance—but almost no attention to sectors such as education, health, and infrastructure. The macroeconomic analysis of absorptive capacity typically focused on “Dutch Disease” and competitiveness risks, which were generally found not to be a concern for the levels of aid inflows under discussion.19 Debt sustainability analysis was also common—given the preponderance of HIPCs in the evaluation sample countries—using the Fund’s standard framework for analyzing debt dynamics for low income countries.20 On fiscal governance, PRGFs included structural conditionality on public financial management and accountability, often supported by technical assistance.21 But PRGF attention to aid absorptive capacity constraints in education, health, or infrastructure, where the Bank is the lead agency, were rare, as was the integration of the individual dimensions into an overall assessment that takes account of synergies and tradeoffs across the individual dimensions.
22. These findings are generally consistent with the responses to the evaluation survey’s questions on absorptive capacity. (See Chart 4.) They show much lower scores for the coverage of sectoral and integrated approaches than for the core Fund areas of macro, fiscal governance, and debt sustainability. This pattern is in line with agreed division of labor between the Fund and the Bank, and the Fund’s comparative advantage vis-à-vis the World Bank and other partners. But it suggests a missed opportunity for considering synergies and tradeoffs between areas where the Bank has the lead on one issue and the Fund on another—such as the Bank’s lead on
19 See also IMF (2005g). 20 See IMF (2005a) and IMF (2006e). 21 See the discussion on fiscal governance later in this chapter in Section C (iv).
Chart 4. Survey Views on PRGF Analysis of Absorptive Capacity
Proportions of surveyed respondents who agreed/strongly agreed that PRGF program design reflects a systematic
analysis of absorptive capacity and supply-side effects of:
0
20
40
60
80
100
Macroeconomic Fiscal/debtsustainability
Governance Sectoral Integrated(Multi-
dimensional)
(In p
erce
nt)
IMF staff World Bank staff Donors

10
infrastructure, with its obvious supply-side effects and the Fund’s lead on macro stability/sustainability, including exchange rate competitiveness. The evidence from the evaluation survey suggests that in appraising the feasibility and consistency of the underlying program and its financing—and in determining the corresponding levels for the programmed spending and absorption of aid—IMF staff looked at the macroeconomic aspects of absorptive capacity. There is no evidence that staff took into account possible tradeoffs with sectoral constraints and opportunities.
(iv) Adjusters
23. Almost all SSA PRGFs include automatic adjusters to deal with unanticipated aid shortfalls/windfalls.22 Such adjusters set out the pre-programmed response for targets on international reserves (affecting the current account) and domestic financing of the budget. They typically cover six-month periods; beyond that, program design is reconsidered at the next review.23
24. Limited domestic financing of shortfalls and full saving of windfalls is the most common practice to deal with fluctuations in budget support in SSA PRGFs. In practice, for aid shortfalls, most SSA PRGFs balance concerns about macroeconomic stability against cuts in priority spending and allow for limited domestic financing. For aid windfalls, most SSA PRGFs call for full saving, until the next review—often citing the need to reduce domestic debt.24 This approach is in line with Fund policy and guidance for staff, which calls for full or partial adjustment (to financing shortfalls) depending on various factors including, inter alia, the level of international reserves and the rate of inflation. For windfalls, Fund policy calls for full savings "where desirable."25
25. As the overall stance of policy has eased in good performers in recent years, the adjusters have also eased, allowing for both more spending of windfalls and/or more financing of shortfalls. As discussed more fully in Annex D, in Burkina Faso, Ghana, Mozambique, and Tanzania, for example, aid windfalls have been allowed to be fully or partially spent; shortfalls have been allowed to be fully financed in Tanzania and partially financed in Mozambique and Rwanda.26
26. But the use of adjusters continues to breed controversy among civil society critics of the IMF, which has failed to get across the short time period to which the adjusters apply. For example, in Mozambique adjusters had been interpreted by critics as a way for the Fund to block the use of aid rather than as a way to manage the short-term macroeconomic implications of changing aid flows. Subsequently, the formulation of the adjuster was changed to allow for full spending of aid windfalls, linked to priority poverty-reducing expenditures. 27
22 See Annex B for a comparison with adjusters in non-SSA countries. 23 See IMF (2006g). 24 See Annex B. 25 See IMF (2006g). 26 See Annex D. 27 See Perone (2006) and Hanlon (2006).
11
B. Analysis of Aid
27. As a basis for considering critics’ concerns that the IMF has lacked ambition in projecting, analyzing, and identifying opportunities for the use of aid in SSA countries, this section looks at three issues—(i) the basis for the PRGF aid forecast; (ii) how possible alternatives were taken into account; and (iii) the transparency of the aid forecast.
(i) Forecasting Aid Inflows
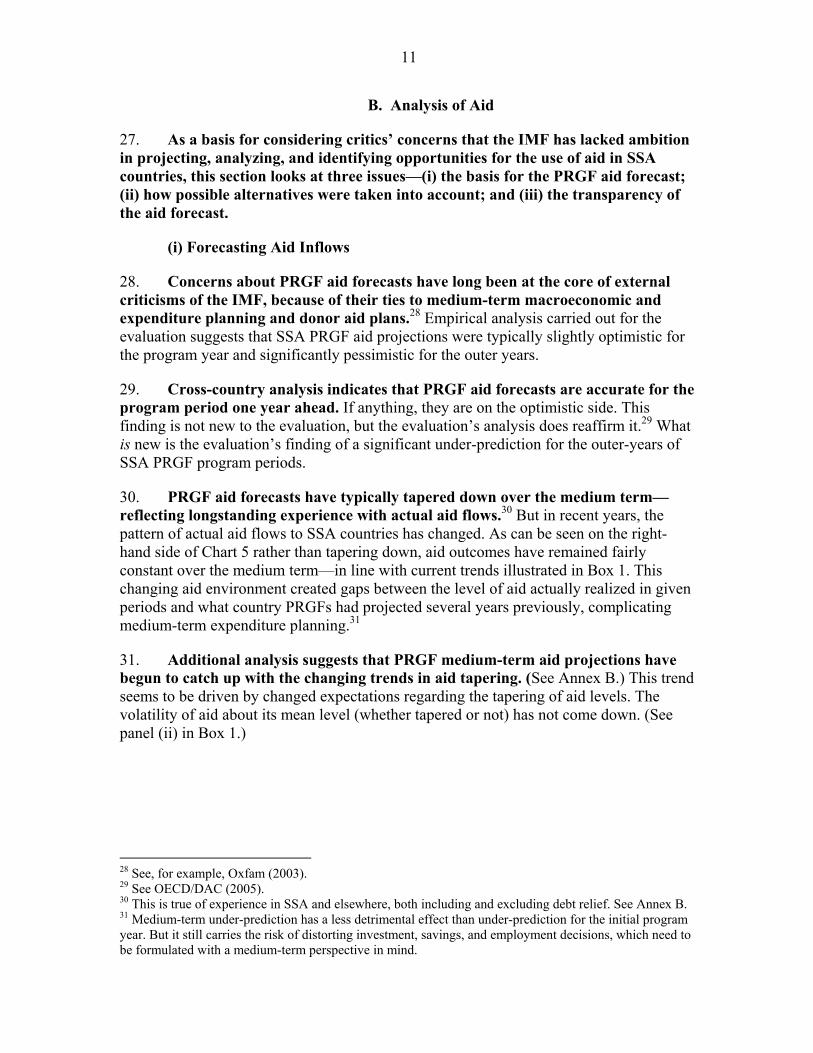
28. Concerns about PRGF aid forecasts have long been at the core of external criticisms of the IMF, because of their ties to medium-term macroeconomic and expenditure planning and donor aid plans.28 Empirical analysis carried out for the evaluation suggests that SSA PRGF aid projections were typically slightly optimistic for the program year and significantly pessimistic for the outer years.
29. Cross-country analysis indicates that PRGF aid forecasts are accurate for the program period one year ahead. If anything, they are on the optimistic side. This finding is not new to the evaluation, but the evaluation’s analysis does reaffirm it.29 What is new is the evaluation’s finding of a significant under-prediction for the outer-years of SSA PRGF program periods.
30. PRGF aid forecasts have typically tapered down over the medium term—reflecting longstanding experience with actual aid flows.30 But in recent years, the pattern of actual aid flows to SSA countries has changed. As can be seen on the right-hand side of Chart 5 rather than tapering down, aid outcomes have remained fairly constant over the medium term—in line with current trends illustrated in Box 1. This changing aid environment created gaps between the level of aid actually realized in given periods and what country PRGFs had projected several years previously, complicating medium-term expenditure planning.31
31. Additional analysis suggests that PRGF medium-term aid projections have begun to catch up with the changing trends in aid tapering. (See Annex B.) This trend seems to be driven by changed expectations regarding the tapering of aid levels. The volatility of aid about its mean level (whether tapered or not) has not come down. (See panel (ii) in Box 1.)
28 See, for example, Oxfam (2003). 29 See OECD/DAC (2005). 30 This is true of experience in SSA and elsewhere, both including and excluding debt relief. See Annex B. 31 Medium-term under-prediction has a less detrimental effect than under-prediction for the initial program year. But it still carries the risk of distorting investment, savings, and employment decisions, which need to be formulated with a medium-term perspective in mind.

12
Chart 5. Programmed and Actual Aid Flows: PRGFs Underpredicted Medium-Term Inflows1
6
8
10
T-1 T 0 T+1 T+2 T+3
Program
(medium-term outlook)(Before program)
(program year)
Outcomes / Updates
Average across all SSA ESAFs (in percent of GDP)
6
8
10
T-1 T 0 T+1 T+2 T+3
Program
Under-
(medium-term outlook)(Before program)
(program year)
Average across all SSA PRGFs (in percent of GDP)
Outcomes / Updates
estimation
1 See Annex B for definitions, methodology, and a discussion of robustness.
32. Evidence from the evaluation’s case studies supports this finding. (See Annex D.) PRGF programs in five major aid recipients—Burkina Faso, Ghana, Mozambique, Rwanda, and Tanzania—show a recent shift in 2005-06 with respect to the forecasting of aid. This shift is characterized by less tapering of projected aid over the medium term than in earlier years of the PRGF period.32 And in three instances (Burkina Faso, Ghana and Tanzania) aid is assumed to remain constant or even increase over the medium term. These program shifts have occurred in the context of improved country macroeconomic conditions and aid prospects.
(ii) Assessing Aid Requirements
33. The larger debate over the IMF’s analysis of aid flows lies in the appropriate concept to be used for the program’s aid “requirements. To provide a common vocabulary for the discussion that follows, Box 3 sets out four different concepts, as used by different members of the international financial and development communities.
34. The evaluation team’s review of documents confirms that PRGFs in the evaluation sample incorporated most-likely-scenario aid forecasts. Assessing program external financing requirements against availabilities and financing gaps has long been a feature of Fund programs, with “satisfactory assurances” of any gap’s being filled an essential pre-requisite for Board consideration of a request for use of Fund resources. In the evaluation sample’s PRGFs, there were few cases of inadequate initial financing. In almost all cases, the forecast of available aid, as discussed above, was above the minimum required for the program.
32 Measured by the change in aid projections in T+1 and the forecast for T0, the immediate program year.

13
Box 3. Different Concepts of Aid Scenarios
Four concepts of aid requirements are used by different members of the development community. These are:
• (i) the minimum requirements for a viable macroeconomic program, in light of other sources of funding and taking account of macroeconomic and other relevant policy adjustments;
• (ii) the most-likely-scenario aid forecast based on donor indications and past experience—basically, the aid forecast before any extraordinary measures to mobilize additional funding;
• (iii) the maximum amount of aid consistent with country absorptive capacity, beyond which capacity constraints materially undermine the net benefits from further increases in aid; and
• (iv) the normative financing requirements for achieving/pursuing the MDGs and/or other development goals.
Fund programs deal with the first and second concepts. If actual aid (and other external resources) appear likely to fall short of the minimum deemed necessary for a viable program, there is a “financing gap”. That gap would need to be filled before any PRGF arrangement could be considered by the Board. Many in the development community focus on the third and fourth concepts, which involve financing gaps. Jeffrey Sachs, for example, argues that the Fund should also utilize these concepts as a way of drawing shareholders’ and donors’ attention to SSAs’ vast needs for pursuing the MDGs.1 (In cases in which the level of aid considered necessary to reach the MDGs exceeds the maximum level currently considered absorbable, policy and institutional reform measures to improve country capacity are the priority.) ___________________ 1 See Sachs (2005, 2006).
35. Evaluation-sample PRGFs did not analyze potentially higher levels of aid than the aid forecast underpinning the program. As detailed in Annex A, during the 2004 and 2005 Board discussions of PRSP implementation, Executive Directors considered how “alternative scenarios” could help to bridge gaps between realism and ambition in national Poverty Reduction Strategies and provide a possible basis for the scaling up of aid at the country level. They “concurred that Fund staff should help those countries that sought assistance in preparing such scenarios.” Subsequently, IMF staff undertook several exercises that covered a range of objectives and levels of complexity in the design of alternative scenarios. An MDG-costing scenario was carried out for Ethiopia at the request of the authorities, while several other country exercises have utilized a simpler methodology.33 But even these exercises have been delinked from the PRGF programs, which remain single-scenario processes, grounded in the most-likely-scenario aid forecast.
33 See IMF (2006f); see also Mattina (2006). In addition to Ethiopia, alternative scenarios have been prepared for CAR (IMF, 2005n), Ghana (IMF, 2006n), Mali (IMF, 2005p), Rwanda (IMF, 2004f), and Zambia (IMF, 2005q). See Gupta et al. (2006) for a discussion of the macroeconomic challenges of scaling up.
14
(iii) Transparency of Aid Forecast
36. PRGF documents say little about the derivation of the aid forecast and its underlying assumptions. This is true both for Board documents that are ultimately published and the internal working documents to which the evaluation team had access. PRGF documents allude to the degree of donor support, noting the importance of good country performance in sustaining donor flows and aid predictability, the need for improvements in donor coordination, and—during the early part of the PRGF period—the desirability of reducing aid dependence. But in-depth discussion of how the forecast is actually made, along with key assumptions—such as discount factors used in translating donor promises into program assumptions and how the current forecast relates to current donor undertakings and past donor performance—is rare. Some program documents note past forecast errors, but typically do not link such observations to the current forecast.34
37. During the evaluation interviews, staff said that they generally took the forecast of the authorities for the program year, validated through discussions with donors. They said that the finance ministries of most SSA countries receiving large volumes of aid are now tracking these flows well, building on the improvements in donor practices in recent years. Nevertheless, where necessary—for example, in post-conflict cases where government capacity was more constrained—Fund staff played a more active role in working with the authorities to aggregate donor plans in the context of the program’s macro framework. Interviewed staff said that the authorities were in many cases very conservative about future aid flows, and, for medium-term forecasts, staff often triangulated between the authorities’ forecast, to which they added a premium, and indications from donors.
38. The lack of transparency about the aid forecast means that readers cannot understand (or challenge) the basis for key program assumptions. Nor can they use Fund documents to track donor actions against promises—although there are exceptions, where quarterly aid projections and actuals are included in the PRGF documents.35 In responding to this point, some staff questioned whether it is the job of the Fund to provide such information for outside partners and observers. But the basis for Fund aid forecasts and the specifics on donor commitments and disbursements are matters of increasing public interest, recognized by the Managing Director and others,36 so greater transparency about their underpinnings could be a useful and cost-effective investment.37
34 See Annex C. 35 See, for example, the recent Tanzania program in IMF (2006d). 36 See, for example, the Managing Director’s statement to the Development Committee—IMF (2006l). 37 Especially as the basic PRGF documents for the 29 evaluation countries are already available on the Fund’s website at www.imf.org.

15
C. Key Features Agenda 39. The “Key Features of PRGF-Supported Programs” was issued by Management as guidance for staff in 2000. They remain central to the staff PRGF handbook.38 (See Box 4.) They were discussed by Executive Directors at an informal seminar in 2000 and re-endorsed as a useful summary and guidance document during the 2002 Board review of the PRGF.39 They were considered in a 2004 IEO evaluation of the IMF’s role in the PRSP and the PRGF.40 Building on these efforts, the current evaluation has focused on those aspects of the key features with particular relevance for the Fund’s role in aid to SSA.41
38 See IMF (2000a). 39 See IMF (2002b). 40 See IEO (2004). 41 As noted in Box 4, the current evaluation does not address the selectivity of structural conditionality, since it is the subject of an ongoing IEO evaluation.
Box 4. PRGF Key Features A Handbook for the Staff on PRGF Arrangements, updated on May 24, 2006, sets out key features that PRGF-supported programs share.1 As summarized in the Handbook, these include:
“Budgets should be pro-poor and pro-growth.”
“Appropriate flexibility in fiscal targets should be ensured by presenting in PRSPs normative macro-projections to signal financing needs and, where warranted, seeking higher aid flow commitments that can be built into the program.”
“The social impact of major macroeconomic adjustments and structural reforms are to be analyzed and taken into account in the formulation of the program.”
“There is strong emphasis on measures to improve public resource management and accountability by opening fiscal policies and objectives to public debate, developing transparent monitoring systems, and considering selective conditionality on fiscal governance measures.”
“Structural conditionality should be selective.”
This evaluation considers all of these features except the last, as it is the subject of an ongoing IEO evaluation on structural conditionality that covers PRGFs as well as other IMF instruments.2 The Handbook notes that the key features were included in a paper discussed with Executive Directors in 2000, and that progress on them was assessed in another paper discussed in early 2002, when Executive Directors “arrived at a broadly favorable assessment but saw the need for an increased focus on the sources of growth in PRGF-supported programs and structural reforms to develop the private sector, increase foreign direct investment, enhance external competitiveness, and increase labor productivity where these goals are critical to the success of the Fund-supported program.” ________________ 1 See IMF (2000a, 2006g). 2 See IEO (2005a).
16
(i) Pro-Poor and Pro-Growth Budgets
40. The key-features agenda has long included pro-poor and pro-growth budgets. At the outset, the expectation was that PRGFs would support “a reorientation of government spending towards the social sectors, basic infrastructure or other activities that demonstrably benefit the poor.” Subsequently, with the Board’s increasing focus on the sources of growth in PRGF-supported programs—as noted in Box 4—the relative importance of infrastructure in the pro-poor and pro-growth budget equation has implicitly risen.
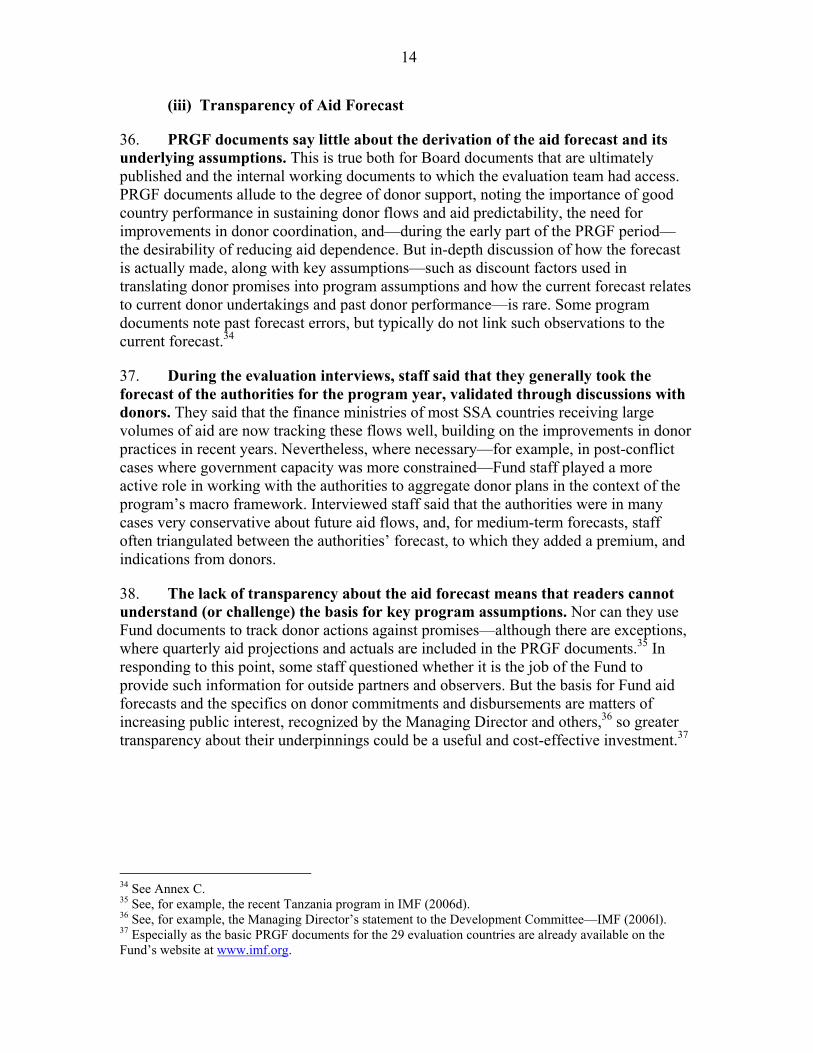
41. Public expenditures for education and health have generally kept pace with overall public spending relative to GDP—while spending for poverty-reducing expenditure (PRE) programs tracked under the HIPC Initiative have expanded more rapidly.42 (See Chart 6.) Though clearly a sectoral area of Bank leadership, Fund staff have played a role in promoting these increases, albeit indirectly. They vet the PRE spending numbers as part of their work with the authorities on budget forecasts and outturns, and on which they are widely perceived by SSA authorities as playing an important role. Most PRGF documents include a table on PREs, which is subsequently reflected in the Bank/Fund annual HIPC implementation reports.43 In addition, a number of SSA PRGFs have included conditionality on such spending, expressed in terms of floors.44 More recently, program adjusters for the spending of unexpected changes in aid flows have been linked to PREs in a number of the evaluation’s desk-review country cases,45 in contrast with the more common approach to
42 PREs are defined in country-specific terms as part of the PRS process; hence, common definitions do not apply across countries. Also, changing definitions of some countries’ PRE “baskets” reduce the measure’s value as a yardstick. To correct for this distortion, the broken line in Chart 6 shows the relationship excluding those countries with changing definitions. 43 See, for example, IMF (2006i). 44 With performance criteria in Chad, Guinea, Rwanda, Uganda, and benchmarks and/or indicative targets in Benin, Ghana, Malawi, Mauritania, and Sierra Leone. 45 Both for using windfalls (in Burkina Faso, CAR, DRC, Ethiopia, and Mozambique) and for financing shortfalls (in DRC, Mozambique, Senegal, and Uganda).
Chart 6. Public Spending on Education, Health, and PRE Average social spending in SSA PRGFs 1/
PRE
Health
Education
PRE excl. countries w ith
change in definition 2/
0
1
2
3
4
5
6
7
8
9
10
1999 2000 2001 2002 2003 2004
(In p
erce
nt o
f GD
P)
Sources: IM F Fiscal Af fairs Department, IM F WETA database and IM F WEO database.
1/ Weighted by average GDP for 2001-05. 2/ Excludes DRC, Guinea, Rwanda, and Zambia.

17
adjusters, which typically calls for the saving of such inflows until the next program review.46
42. Many critics see the Fund as undermining the social sectors—especially through PRGF conditionality on the public sector wage bill. Such conditionality is said to adversely affect health- and education-sector salaries and staffing (sometimes donor financed) and in turn the quality of service delivery.47 After much dialogue and debate between Fund staff and their critics, a consensus is emerging that, with few exceptions,48 PRGF wage bill ceilings in SSA have typically been designed to be sector-neutral—basically macro-focused—but not pro-poor.49 They have generally been included in programs because of concerns about macroeconomic stability and administrative capacity constraints on keeping the wage bill within budget. (See Annex C.) But they are not first-best solutions and clearly have sometimes had unintended consequences. Possible side-effects range from the limited ability to immediately absorb and spend unanticipated aid inflows for the hiring of teachers and nurses to the proliferation of fringe benefits and other non-transparent forms of remuneration designed to circumvent the ceilings. In either case, the Fund has generally reacted to negative publicity and controversy on wage bill ceilings with program modifications at the next review, as for example in Mozambique in 2006 and Zambia in 2004. More proactively—and in an important innovation—program adjusters in the 2005 Malawi PRGF allowed for both increased PRE spending and exemption from the wage bill ceiling in the event of larger-than-programmed disbursements from the multi-donor AIDS SWAp.50
43. By all accounts, public spending for infrastructure fared less well than education and health during the evaluation period.51 Despite weak data, the increasingly widespread view is that SSA’s public-expenditure “pendulum” has gone too far in the direction of pro-poor spending for safety net programs, at the expense of pro-growth spending for infrastructure. This is especially so, given the latter’s importance for private sector development, productivity growth, external competitiveness, and employment creation—and in turn for durable poverty reduction.52 As noted earlier, the Fund has done little to take into account spending composition issues—including between the social sectors and infrastructure—in considering country aid absorptive capacity, despite the implications for the supply-side response over the medium term, and the more immediate implications for the optimal absorption and spending response to additional aid. 46 Of course, increased social spending does not automatically translate into better outcomes. For example, studying PRGFs in four SSA countries, AFRODAD found only mixed effects on services and human welfare. Despite higher social sector spending in Ethiopia and Tanzania, poverty reduction and improvements in social service delivery were modest. AFRODAD also criticized the Fund for tight fiscal controls in Malawi and Zambia that inhibited teacher training and recruitment. See AFRODAD (2005, 2006a-d). 47 See Ooms and Schreker (2005); and Physicians for Human Rights (2004). 48 See, for example, IMF (2005f, 2005p). 49 See, for example, Fedelino et al. (2006) and Wood (2006). 50 See IMF (2005e). 51 See Development Committee (2005), and Estache (2006). 52 See Bevan (2005) and Foster and Killick (2006).
18
44. Government officials in most countries visited by the evaluation team complained about what they characterized as the Fund’s overemphasis on pro-poor spending, which they saw as prejudicial to the needed spending on infrastructure, which they saw as pro-growth. Of course, the Bank is the lead agency on infrastructure, just as it is on health and education. Even so, the indications are that Fund staff could have been more proactive in the dialogue (with the authorities and the Bank) in querying the infrastructure constraints to growth, especially given the relevance to aid-related exchange rate and competitiveness issues, which are at the core of the Fund’s mandate. Indeed, during the Board’s 2005 review of the PRGF, “Executive Directors also encouraged countries in which higher aid-based spending would pose a serious threat to competitiveness to consider using the aid for enhancing productivity and/or removing domestic supply constraints.”53
(ii) Financing Needs for Pro-Poor and Pro-Growth Budgets
45. Where Fund staff deserve more credit for their work on the Key Features is on the increase in fiscal space that opened the way for the expansion of the spending programs discussed above. On average in the 29 SSA PRGF countries, public expenditures rose by about 2.5 percent of GDP over the period.54 In the aggregate, the financing came from increases in aid and domestic revenues and a decline in external debt service, partly offset by the retirement of domestic debt and other transactions.55
46. Through the PRGF, Fund staff played an important role in the increased fiscal space, especially with respect to their support for ambitious measures to mobilize domestic resources. As spelled out in Annex C, most PRGFs called for improving domestic resource mobilization, with their program intent evolving from the avoidance of aid dependency in early PRGF programs to the widening of fiscal space for priority expenditures more recently. In addition, as shown in Annex B, revenue mobilization targets have both increased in PRGFs relative to ESAFs, and more frequently been met or exceeded.
47. But Fund staff were less ambitious externally—in signalling the incremental aid needs for financing larger pro-poor and pro-growth spending, as called for in the Key Features and the PRGF Handbook. 56 As discussed earlier in this report—and because of the policy cautions discussed there—Fund staff have generally not been proactive in analyzing alternative aid scenarios or normative aid requirements for meeting national growth and development objectives, or in discussing with donors additional aid opportunities where country absorptive capacity exceeded projected aid flows.57 Similar reservations clearly apply to the consideration of possibly higher aid commitments for pro-poor and pro-growth programs in education, health, and infrastructure. But there are also other complications, namely that: (i) the Bank is the lead agency in these sectoral areas and (ii) Fund/Bank collaboration is not working 53 See IMF (2005k). 54 Compared with an increase of 1 percentage point over the previous six years (during the ESAF era). 55 See Annex B. 56 Or in the accompanying Staff Report Checklist. See IMF (2006h). 57 See paragraphs 21 and 22 above and Chart 4.

19
particularly well in these areas, because of problems with resources and delivery modalities. (See paragraph 69, below, on Fund/Bank collaboration.)
(iii) Poverty and Social Impact Analysis
48. From the launch of the PRGF, social impact analysis was to inform the consideration of distributional impacts of program design and the identification of countervailing measures to offset adverse impacts. 58 Fund staff were generally not expected to do the PSIA analysis themselves, but rather to integrate the analysis of partners, especially of World Bank staff, into program design.59 As summarized in Annex A, Board discussions have repeatedly emphasized the importance of PSIA for PRGF program design and called for systematic treatment of impacts and countervailing measures in PRGF documents.60 They also have highlighted the fact that the World Bank was the lead agency on PSIA, given its role as the lead agency on poverty reduction.61
49. PSIAs carried out by World Bank staff, DFID, and other agencies have not systematically informed PRGF program design. During interviews, IMF staff said that most PSIAs prepared by other agencies generally lacked the necessary timeliness, relevance, and/or quality to underpin PRGF design. It was for this reason that the Fund’s PSIA Group, set up primarily to help staff integrate PSIAs done by others into PRGF-supported programs, had become a producer of PSIAs. World Bank staff working on PSIAs indicated that they generally lacked incentives and resources to meet the specific needs of Fund-supported programs. However, there have been exceptions when the collaboration worked well, such as in the PRGF for Ethiopia, where Fund staff relied on a World Bank PSIA on petroleum pricing.
50. The findings of PSIAs carried out by IMF staff are now typically reported in PRGF documents, although there is less evidence of material influence on PRGF program design. The results of the nine SSA PSIAs have been presented in program documents—often in freestanding boxes—with the results actually figuring in staff appraisals in fewer cases (Burkina Faso and Djibouti).62 Program documents indicated no specific countervailing measures linked to the PSIAs, in some cases because the recommendations were not adopted (Malawi and Uganda). The Ghana and Mali programs noted that the fiscal space created by the subsidy reduction would be used by the authorities to increase priority expenditures. Going forward, close management of PSIAs is needed to prevent them from becoming a bureaucratic requirement with little impact on program design and outcomes.
51. In the meantime, PSIA is clearly an area of continuing debate about what the Fund has actually committed to do and what is feasible both analytically and with available data and resources. Civil society critics are looking for greater attention to
58 See Inchauste (2002); Robb (2003); and Kpodar (2006). 59 See IMF (2000a). 60 See IMF (2003b and 2004d). 61 See IMF (2004e). 62 Of the nine PSIAs carried out by FAD, six focused on the removal/reduction of subsidies (electricity, petrol, agriculture, fertilizers) and the others on devaluation, external shocks, and taxation.
20
social impact analysis of “macroeconomic” issues, such as a reduction in inflation or the fiscal deficit.63 But Fund staff argue that distributional analysis of such high-order aggregates is not particularly tractable or cost effective; they contend that PSIAs are best done on narrower questions, such as a reduction in energy subsidies or an increase in VAT tax rates, for which clear counterfactuals can be constructed.64 The IMF staff position on the coverage of PSIAs is consistent with the language of the Fund’s initial Key Features document submitted to Executive Directors in 2000, and subsequently posted on the IMF website. The undertaking clearly indicated that “to be feasible, this type of analysis would need to be restricted to substantial macroeconomic adjustments (e.g., a big tax increase, subsidy reform, or exchange rate realignment) or major structural reforms (e.g., civil service downsizing or price liberalization).”65 It also is consistent with the view emerging from PSIA practitioners in DFID and the World Bank, who highlight the importance of clear and narrow questions for successful and cost-effective analysis.66
(iv) Fiscal Governance
52. Of all the key-features agenda items, Fund staff have pursued improvements in the accountability and transparency for the management of public resources the most aggressively. This focus is in line with the priority attached to it by the Board, which has repeatedly stressed the importance of such work for growth, poverty reduction, and aid effectiveness—in the context of the HIPC initiative as well as the PRGF. Executive Directors identified it from the outset as an area where conditionality might be expanded, while recognizing it as an area of shared responsibility with the World Bank. Subsequent feedback—in the context of Board discussions of PRSP and PRGF reviews, HIPC implementation reports, and individual country programs under the PRGF and/or program reviews—has served to further sharpen the focus of staff efforts. Systematic monitoring and reporting by Fund and Bank staff points to progress on fiscal governance but with major challenges remaining.67
53. Fund staff have made a major effort to support the strengthening of public financial management and accountability systems in SSA countries. Their increasing efforts in recent years reflect the confluence of (i) traditional concerns about macroeconomic stability and the underlying processes and systems for ensuring budget execution and reporting; (ii) shareholder concerns about governance and the need to ensure the proper disposition of debt service savings from the HIPC Initiative, and the MDRI more recently; (iii) donor interest in improving country fiduciary systems as a quid pro quo for their own shift to budget support instruments; and (iv) effective Fund/Bank collaboration on the issues, with country teams supported by technical specialists in both institutions.
54. Fiscal transparency and accountability has been a substantial area of PRGF focus, with extensive discussions of budgetary control and transparency issues in 63 See, for example, Griesgraber (2006) and Hayes (2005). 64 See Gillingham (2005). 65 See IMF (2000a). 66 See Bird et al (2005) and Coudel, Dani, and Paternostro (2006). 67 See, for example IMF (2005c).
21
program documents and structural conditionality framed in a variety of ways—from prior actions and performance criteria to indicative targets and benchmarks. Strengthening of ministry of finance capacity for the monitoring of line ministries’ budget planning and execution has been common,68 including the monitoring of public sector employment and remunerations.69 Closely linked to these programs, the Fund has provided extensive technical assistance on budget execution issues—for expenditure monitoring and control—and information systems for the tracking of expenditures.70 Fiscal transparency and accountability issues are a shared responsibility with the Bank, and program documents frequently explain the scope of institutional collaboration and the division of labor (including on the provision of technical assistance), with the Fund generally focusing on budget execution issues—especially expenditure controls and fiscal reporting.
III. IMF RELATIONSHIP MANAGEMENT IN SSA 55. This chapter sets out relevant findings about Fund relationships with the authorities, donors, multilateral partners, and local civil society groups. It draws on face-to-face interviews and the evaluation survey.71 A key contextual issue is the changing operating environment for aid to SSA, with donors increasingly decentralizing resources and decision making to country offices with implications for how the Fund is perceived, given its more limited field presence. (See Box 5.) The evidence presented in the chapter suggests major differences of views between how Fund staff see themselves and how partners and stakeholders see them, especially in the aid arena. It thus raises questions about how the Fund acquires and processes feedback about its own performance—in view of the intrinsic value of such feedback for self-assessment, learning, and accountability and the information that such feedback may carry about changing conditions on the ground, as an input into strategy formulation and action planning.72
68 For example in Cameroon, Mozambique, Rwanda, Senegal, Tanzania, Uganda, and Zambia. 69 As in Mozambique, Tanzania, and Zambia. See Annex C. 70 For example in Burkina Faso, DRC, Ghana, Mozambique, Rwanda, Senegal, Tanzania, Uganda, and Zambia. The Fund’s work on technical assistance for fiscal governance was evaluated as part of the IEO evaluation of IMF technical assistance. See IEO (2005b). 71 Key inputs include: (i) meetings with SSA ministers of finance, central bank governors, and their staff during the 2006 Spring Meetings in Washington; (ii) interviews in Accra, Dar es Salaam, Kigali, Lusaka, Maputo, and Ouagadougou; in Addis Ababa and Tunis; and in donor capitals; and (iii) responses to the evaluation survey from the authorities, donors, local civil society representatives, and staff of the African Development Bank, IMF, UNDP, and World Bank. See Annex E for survey details. 72 IMF (2004g).
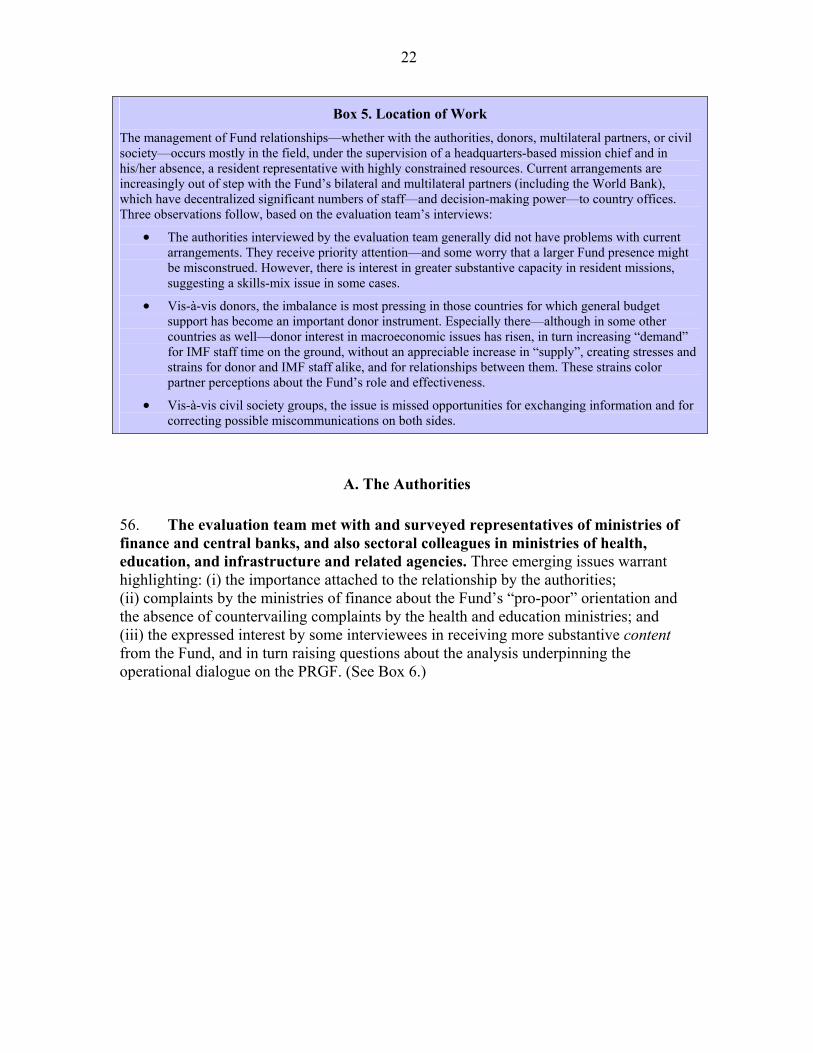
22
A. The Authorities 56. The evaluation team met with and surveyed representatives of ministries of finance and central banks, and also sectoral colleagues in ministries of health, education, and infrastructure and related agencies. Three emerging issues warrant highlighting: (i) the importance attached to the relationship by the authorities; (ii) complaints by the ministries of finance about the Fund’s “pro-poor” orientation and the absence of countervailing complaints by the health and education ministries; and (iii) the expressed interest by some interviewees in receiving more substantive content from the Fund, and in turn raising questions about the analysis underpinning the operational dialogue on the PRGF. (See Box 6.)
Box 5. Location of Work The management of Fund relationships—whether with the authorities, donors, multilateral partners, or civil society—occurs mostly in the field, under the supervision of a headquarters-based mission chief and in his/her absence, a resident representative with highly constrained resources. Current arrangements are increasingly out of step with the Fund’s bilateral and multilateral partners (including the World Bank), which have decentralized significant numbers of staff—and decision-making power—to country offices. Three observations follow, based on the evaluation team’s interviews:
• The authorities interviewed by the evaluation team generally did not have problems with current arrangements. They receive priority attention—and some worry that a larger Fund presence might be misconstrued. However, there is interest in greater substantive capacity in resident missions, suggesting a skills-mix issue in some cases.
• Vis-à-vis donors, the imbalance is most pressing in those countries for which general budget support has become an important donor instrument. Especially there—although in some other countries as well—donor interest in macroeconomic issues has risen, in turn increasing “demand” for IMF staff time on the ground, without an appreciable increase in “supply”, creating stresses and strains for donor and IMF staff alike, and for relationships between them. These strains color partner perceptions about the Fund’s role and effectiveness.
• Vis-à-vis civil society groups, the issue is missed opportunities for exchanging information and for correcting possible miscommunications on both sides.

23
Box 6. Informing the PRGF Dialogue with the Authorities
During the evaluation team’s interviews, some country authorities called for greater focus on substantive content in the dialogue with the Fund. They were especially interested in lessons learned in other countries (inside and outside SSA); analysis of and explanations for proposed wage-bill, tax-rate, and other program targets; and connections between macroeconomic policies and aid, the real economy, growth, and poverty reduction.
This raises the question of what inputs Fund staff use in PRGF preparation and design—and whether those inputs capture the full range of analysis and research available. This question was put to Fund staff in the evaluation survey, with the staff responses summarized in the chart to the right. As shown, large majorities of operational staff respondents to the evaluation survey said they used the analysis carried out by the IMF’s Fiscal Affairs (FAD) and African Departments (AFR) and the World Bank. Majorities said they also used the analysis of the IMF Policy Review Department (PDR), the authorities, and the IMF Monetary and Financial Systems Departments (MFD).1
Minorities said they used the analysis of other sources, including from donors, the IMF Institute (INS), AfDB, academics, and civil society. No respondents said they used the analysis of the IMF Research Department (RES) or UNDP.
These results in turn raise further questions for follow-up. First, how relevant is the Research Department’s analytic work to the macroeconomic challenges that SSA countries face? Second, how open are Fund staff to analysis and ideas that go beyond immediate operational concerns, whether generated inside or outside the Fund? Third, how does the Fund ensure that its advice is adequately informed by up-to-date research and analysis?
___________________________________________
1 MFD was recently merged with the International Capital Markets Department to form the Monetary and Capital Markets Department.
57. Feedback provided to the evaluation team in face-to-face meetings with representatives of finance ministries and central banks points to increasing openness, flexibility, and tolerance for the accommodation of aid flows by Fund missions and programs. But there also were complaints. Some interviewees criticized Fund missions for listening too little, demanding too much, and imposing their views despite the institution’s rhetoric on “ownership.” Some recalled earlier days of heated debates and difficult discussions during their countries’ stabilization periods. Others complained about mission members’ weak language skills, where relevant, and about
Proportions of IMF staff respondents who agreed/strongly agreed that they used the
analytical work and experience of:
0
20
40
60
80
100
FADAFR
World Ban
kPDR
Authori
ties
MFDDon
ors INS
AFDBAca
demics
CSOsRES
UNDP
(In p
erce
nt)
IMF DepartmentsExternal Resources
24
staff turnover. One said that changes in mission chiefs were especially disruptive, sometimes triggering wholesale revisions of the program. But several interviewees said that turnover below the level of the mission chief was also a problem; it undermined rather than built capacity, by taking scarce official time to “retrain” new Fund staff all too often.73 On the positive side, the authorities volunteered praise for the work of AFRITAC, whose one-on-one coaching style they very much appreciated, and for IMF Institute courses on financial programming.
58. The evaluation team also met with representatives of ministries of education, health, and infrastructure in the six countries it visited. The most immediate and striking response to questions about possible influence of the IMF on their sectoral resource envelopes and access to aid was the emphasis placed on country ownership. Several sectoral interviewees even took exception to the questions, stressing that the budget was their country’s and that they and their colleagues made all the decisions. More generally, there was little blaming of the IMF for any resource shortfalls that their sectors may have encountered; interviewees said any blame belonged with their own government. Some interviewees applauded the IMF’s positive influence on the development of more realistic plans. Of course, the education and health ministries were major beneficiaries of funding from HIPC savings, which may have favorably inclined them towards the IMF. Representatives from infrastructure ministries generally made two points: (i) the need to broaden the criteria for priority expenditures to include basic infrastructure projects, a plea that was sometimes specifically supported by their colleagues in the health ministries, based on a recognition that investments in water and roads are necessary to meet the health MDGs; and (ii) their desire to loosen Fund-imposed constraints on borrowing abroad to finance high-return investments in infrastructure.74 In Ghana, for example, the constraint on non-concessional borrowing is a major issue for the authorities, who want to borrow commercially to expand infrastructure investment. Similar issues—albeit on a smaller scale and with a more distant time horizon—have arisen in Rwanda and Zambia. In all three cases, PRGF limits on commercial borrowing for infrastructure was a recurring complaint of the authorities during the evaluation team’s face-to-face country interviews.
59. The authorities’ responses to the evaluation survey were more positive on most questions than other surveyed groups, except for Fund staff. This is a striking and significant result, although to some extent it may reflect selection bias among survey respondents and/or reluctance to criticize Fund staff for fear of adverse consequences, despite reassurances of confidentiality. As pictured in Chart 7, the authorities and Fund staff generally see eye to eye on the Fund’s performance on bread-and-butter activities such as the timing of missions, the openness of the dialogue, and the use of the authorities’ analysis and experience—statistically, their responses are not significantly different from each other. However, there were two exceptions in highly relevant areas—first, on the accommodation of aid, where the authorities were significantly less positive
73 Empirical analysis carried out by the evaluation team suggests that similar mission turnover rates characterize all program countries. 74 See Development Committee (2006a) and IMFC (2006a).

25
than Fund staff on all questions, especially on infrastructure;75 second, and even more important, the difference in views on the use of additional aid scenarios in PRGF design, for which only 47 percent of the authorities agreed that these were used, compared with 88 percent of Fund staff respondents. Otherwise, the authorities and Fund staff tended to respond in broadly similar ways—and quite differently from the other groups—on other substantive questions, as noted elsewhere in this report. Almost 90 percent of the respondents from the authorities’ group were from ministries of finance and central banks, representing 25 of the 29 SSA countries under study. The remaining 10 percent were from sectoral ministries, whose survey response rates tended to be much lower. 76
B. Donors
60. Three findings about the relationship between the IMF and SSA donors emerge from the evidence considered by the evaluation team. The first is the continuing high marks the donors give to the Fund’s macroeconomic assessment.77 This is true for donors with traditional project-based aid programs and donors with larger portfolios of general and sectoral budget support operations. The second finding, elaborated below, is the low marks that donors give to Fund staff proactivity in engaging with donors both one-on-one and in formal and informal meetings—largely because they
75 See Chart 9 below. 76 Given the small number of returns from this group, it is not possible to differentiate their responses from those of the central bank and ministry of finance representatives in a statistically significant way. This said, their responses tended to be broadly in line with those of their finance ministry and central bank colleagues—albeit somewhat more positive on IMF work on the MDGs and less positive on IMF work on aid. 77 See also survey in IMF (2005m).
Chart 7. Survey Views on IMF Staff/Authorities Interface: Connect
Proportions of respondents who agreed/strongly agreed that:
0
20
40
60
80
100
IMF missionscame at an
appropriate timefor the
government'swork on the
budget
IMF missionscame at an
appropriate timefor the
government'swork on aidmobilization
Meetingsbetween IMF
and theauthorities
involved full andfair exchangesof views with
respect topolicies
Meetingsbetween IMF
and theauthorities
involved full andfair exchangesof views withrespect to aid
IMF countryteams used theanalytical workand experience
of the authoritiesfor PRGF
analysis anddesign
(In p
erce
nt)
IMF staff Authorities
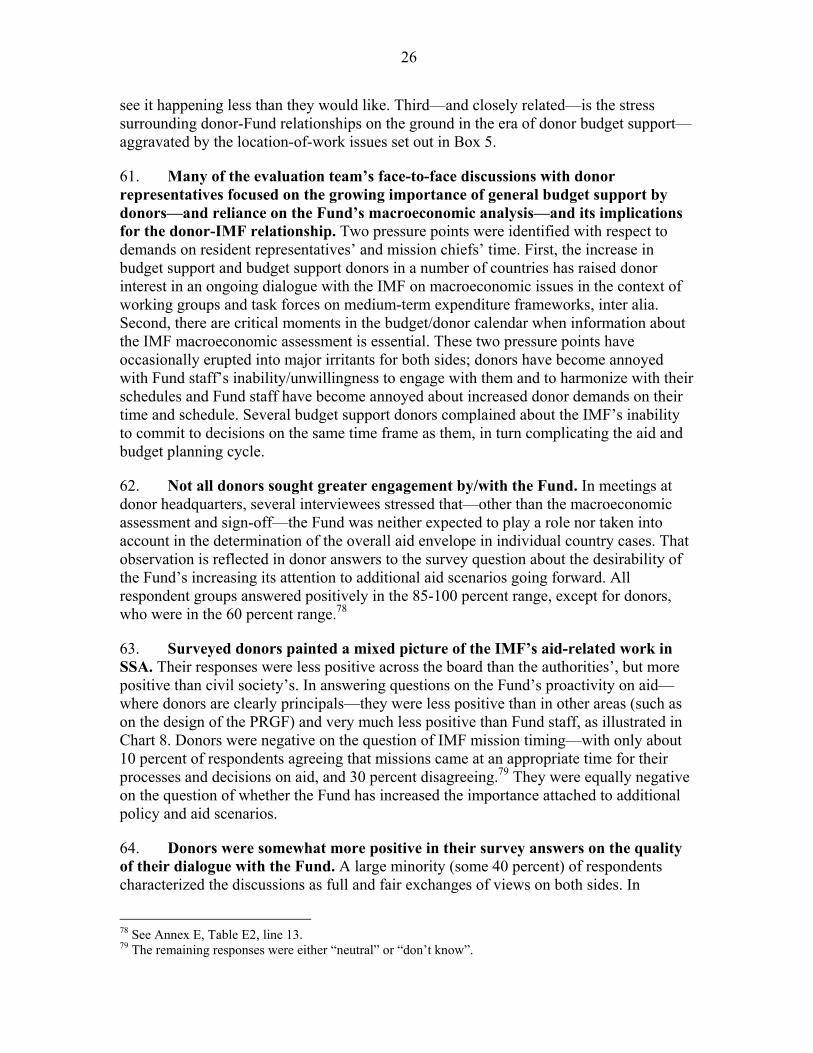
26
see it happening less than they would like. Third—and closely related—is the stress surrounding donor-Fund relationships on the ground in the era of donor budget support—aggravated by the location-of-work issues set out in Box 5.
61. Many of the evaluation team’s face-to-face discussions with donor representatives focused on the growing importance of general budget support by donors—and reliance on the Fund’s macroeconomic analysis—and its implications for the donor-IMF relationship. Two pressure points were identified with respect to demands on resident representatives’ and mission chiefs’ time. First, the increase in budget support and budget support donors in a number of countries has raised donor interest in an ongoing dialogue with the IMF on macroeconomic issues in the context of working groups and task forces on medium-term expenditure frameworks, inter alia. Second, there are critical moments in the budget/donor calendar when information about the IMF macroeconomic assessment is essential. These two pressure points have occasionally erupted into major irritants for both sides; donors have become annoyed with Fund staff’s inability/unwillingness to engage with them and to harmonize with their schedules and Fund staff have become annoyed about increased donor demands on their time and schedule. Several budget support donors complained about the IMF’s inability to commit to decisions on the same time frame as them, in turn complicating the aid and budget planning cycle.
62. Not all donors sought greater engagement by/with the Fund. In meetings at donor headquarters, several interviewees stressed that—other than the macroeconomic assessment and sign-off—the Fund was neither expected to play a role nor taken into account in the determination of the overall aid envelope in individual country cases. That observation is reflected in donor answers to the survey question about the desirability of the Fund’s increasing its attention to additional aid scenarios going forward. All respondent groups answered positively in the 85-100 percent range, except for donors, who were in the 60 percent range.78
63. Surveyed donors painted a mixed picture of the IMF’s aid-related work in SSA. Their responses were less positive across the board than the authorities’, but more positive than civil society’s. In answering questions on the Fund’s proactivity on aid—where donors are clearly principals—they were less positive than in other areas (such as on the design of the PRGF) and very much less positive than Fund staff, as illustrated in Chart 8. Donors were negative on the question of IMF mission timing—with only about 10 percent of respondents agreeing that missions came at an appropriate time for their processes and decisions on aid, and 30 percent disagreeing.79 They were equally negative on the question of whether the Fund has increased the importance attached to additional policy and aid scenarios.
64. Donors were somewhat more positive in their survey answers on the quality of their dialogue with the Fund. A large minority (some 40 percent) of respondents characterized the discussions as full and fair exchanges of views on both sides. In
78 See Annex E, Table E2, line 13. 79 The remaining responses were either “neutral” or “don’t know”.
27
addition, majorities of donor respondents acknowledged changes in the Fund over the past five years towards greater focus on poverty reduction and public expenditure management—both areas they would like enhanced attention to in the next five years. Also in other areas—such as growth, private sector development, and infrastructure—where fewer respondents saw increased attention in the past five years, majorities wanted more IMF attention over the next five years.
C. Multilateral Partners
65. The evaluation team also canvassed the views of World Bank, AfDB, and UNDP staff—both through face-to-face interviews in the context of the country visits and through the evaluation survey.
(i) World Bank Staff
66. The complexity of the Fund/Bank staff relationship in SSA is reflected in the evaluation survey results. In some contexts, the IMF/Bank relationship is one of partners, for example, in Fund and Bank staff’s work in supporting country efforts to design and implement Poverty Reduction Strategies. While in other interactions, the Bank works more closely with donors than with the IMF. For example, in the context of the Bank’s participation in donor budget support groups through its Poverty Reduction Support Credits, the Bank behaves more like a donor, sharing donor concerns about IMF mission timing and the effect of macroeconomic policies on the absorption and spending of aid. As a result, for some survey questions, Bank staff responses are closer to those of Fund staff, while for others they are closer to donors.
Chart 8. Survey Views on IMF Staff/Donor Interface: Disconnect
Proportions of respondents who agreed/strongly agreed that:
0
20
40
60
80
100
IMF has beenpro-active inCG and other
meetings
IMF has beenpro-active in
informalconsultations
with donorgroups
IMF has beenpro-active inone-on-onemeeting withlead donors
IMF missionscame at anappropriate
time for donordecisions on
aid
IMF hasattached moreimportance to
additionalpolicy and aid
scenarios in itsinteractionswith donors
(In p
erce
nt)
IMF staff Donors

28
67. One example in which Bank staff are closer to donors in their views than to Fund staff is with respect to PRGFs’ accommodation of aid earmarked for sectors such as education, health, and infrastructure. Chart 9 illustrates the results, which show a large disconnect between Fund staff thinking and that of Bank staff and donors—and the authorities, especially on infrastructure. The disconnect probably reflects different meanings attached to the word “accommodate” by Fund staff and by other survey respondents—with Fund staff meaning in line with Fund policy on the accommodation of aid, which as seen in Chart 2 can mean a very low spending rate out of incremental aid for countries with inflation rates above the critical 5-7 percent threshold. Whereas, to donors and Bank staff “accommodate” may mean that additional aid is simply allowed to be spent. Nevertheless, the size of the gap is worrying, especially the gap between Fund and Bank staff views given that it relates to views on the interface between core operational products of the two institutions—the PRGF in the Fund and financial support for key sectors (education, health, and infrastructure) in the Bank.
68. On the critical partnership issue, the quality of the collaboration between the two institutions received disappointing responses from surveyed Fund and Bank staff. Chart 10 suggests that about half of surveyed staff are positive on the collaboration on strategy issues for growth and poverty reduction. The good news is that Fund and Bank staff have similar views on these questions, and the apparent differences between their responses are not statistically significant. The bad news is that the (shared) view of the collaboration is not more positive. Ideally, effective collaboration on SSA would be a top priority for both institutions, and fully reflected in staff views about how it is actually working on the ground.
Chart 9. Survey Views on Accommodation of Earmarked Aid
Proportions of respondents who
agreed/strongly agreed that PRGFs accomodated the use of aid earmarked for:
0
20
40
60
80
100
Education Health Infrastructure
(In p
erce
nt)
IMF staff Authorities World Bank staff Donors
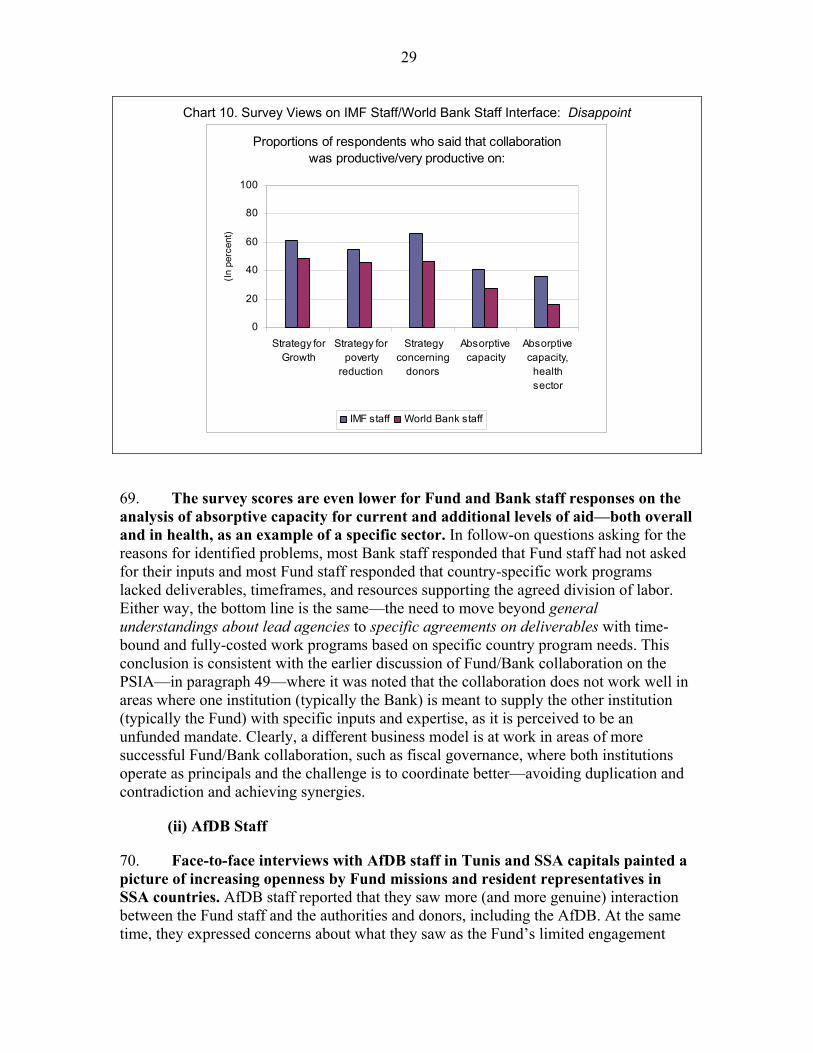
29
69. The survey scores are even lower for Fund and Bank staff responses on the analysis of absorptive capacity for current and additional levels of aid—both overall and in health, as an example of a specific sector. In follow-on questions asking for the reasons for identified problems, most Bank staff responded that Fund staff had not asked for their inputs and most Fund staff responded that country-specific work programs lacked deliverables, timeframes, and resources supporting the agreed division of labor. Either way, the bottom line is the same—the need to move beyond general understandings about lead agencies to specific agreements on deliverables with time-bound and fully-costed work programs based on specific country program needs. This conclusion is consistent with the earlier discussion of Fund/Bank collaboration on the PSIA—in paragraph 49—where it was noted that the collaboration does not work well in areas where one institution (typically the Bank) is meant to supply the other institution (typically the Fund) with specific inputs and expertise, as it is perceived to be an unfunded mandate. Clearly, a different business model is at work in areas of more successful Fund/Bank collaboration, such as fiscal governance, where both institutions operate as principals and the challenge is to coordinate better—avoiding duplication and contradiction and achieving synergies.
(ii) AfDB Staff
70. Face-to-face interviews with AfDB staff in Tunis and SSA capitals painted a picture of increasing openness by Fund missions and resident representatives in SSA countries. AfDB staff reported that they saw more (and more genuine) interaction between the Fund staff and the authorities and donors, including the AfDB. At the same time, they expressed concerns about what they saw as the Fund’s limited engagement
Chart 10. Survey Views on IMF Staff/World Bank Staff Interface: Disappoint
Proportions of respondents who said that collaboration was productive/very productive on:
0
20
40
60
80
100
Strategy forGrowth
Strategy forpoverty
reduction
Strategyconcerning
donors
Absorptivecapacity
Absorptivecapacity,
healthsector
(In p
erce
nt)
IMF staff World Bank staff

30
with civil society. They said they looked forward to increased collaboration on governance and sectoral policies and strategies as the AfDB increased its investment in economic and sector work. In their survey responses, AfDB staff was positive about IMF proactivity at formal and informal aid meetings. Looking forward, almost all AfDB respondents stressed the importance of greater investment by the Fund in additional policy and aid scenarios and involvement in policy monitoring efforts conducted jointly by donors at the local level.
(iii) UNDP Staff
71. UNDP resident representatives interviewed by the evaluation team also commented favorably on what they saw as recent changes in the IMF approach. They said that IMF staff now consult more broadly with stakeholders and are more willing to adapt the macroeconomic policy stance to accommodate needed social expenditures. Going forward, they highlighted the importance of a more collaborative IMF strategy to help SSA countries achieve the MDGs.80 Despite the relatively favorable survey responses from its staff, UNDP case studies and research criticize IMF activities and impact. Its Ghana case study argued that the Fund’s fixation on fighting inflation crowded out attention to economic growth, employment creation and poverty reduction.81 Its Zambia case study focused on what it saw as excessive involvement by the Fund and other IFIs, including on the use of aid, which it said stifled domestic initiative and constrained social service provision and in turn poverty reduction and growth.82
D. Civil Society
72. Evaluation survey responses and interviews during country visits point to limited and ineffective IMF engagement with country-based members of civil society. This translates into missed opportunities for dialogue on key issues, including “on the links between the macroeconomic framework and growth and poverty reduction outcomes in the context of work on PRGF-supported programs,” as the Board agreed staff needed to more actively explain to a broad audience, including civil society.83
80 In their survey responses, UNDP staff were closely aligned with those of civil society, although the low number of responses to most questions means that they are not statistically significant. 81 See Weeks and McKinley (2006). 82 See Epstein and Heintz (2006). 83 See IMF (2002b).

31
73. The very clear message from civil society survey responses—and from the evaluations team’s face-to-face meetings with civil society groups during the country visits—was that Fund staff are generally unknown and unavailable to civil society in SSA. This contrasts with Fund staff opinion. As Chart 11 illustrates, about 80 percent of Fund staff respondents report progress in their engagement with civil society over the past five years; whereas, only 20 percent of civil society respondents see such progress. Going forward, majorities of all respondent groups—including the authorities and Fund staff—agreed that greater outreach efforts were important.
74. The evaluation team’s face-to-face interviews with civil society representatives reinforced the finding of limited interaction with IMF staff. They pointed to even more limited agreement on assumptions about how Fund-supported policies impact the use of aid and poverty reduction and the MDGs. In Mozambique, for example, local civil society organizations complained about the design of PRGF program adjusters, which they said blocked Mozambique’s use of aid, and wage bill ceilings, and complained of limited dialogue with Fund staff. As it turned out, those program elements had been recently modified, but the civil society representatives had not learned about the changes, despite efforts on their part to find out. Interviews with resident mission staff suggest that while Fund policies encourage outreach and communications with civil society, they have received little actual support for such work. Yet this is the area where the dialogue is most difficult—where differences of views between civil society and government policies make the dialogue especially sensitive. There are also time and other resource constraints to be considered, as suggested by Chart 12, which shows mission chiefs’ and resident representatives’ views on the time they have available to meet with the authorities, donors, and civil society. Moreover, the evaluation interviews revealed that in some instances it is the authorities who prefer that the Fund have a low profile in discussions with civil society.
Chart 11. Survey Views on IMF Staff/Local Civil Society Interface: Major Disconnect
Proportions of respondents who agreed/strongly agreed that IMF has been doing:
0
20
40
60
80
100
More Listening More Explaining More Efforts toIncrease
Transparency
(In p
erce
nt)
IMF staff Civil Society
Chart 12. With Whom Do Staff Spend their Time?
Proportion of staff respondents who
agreed/strongly agreed that Fund missions and resident representatives had ample time
to meet with:
0
20
40
60
80
100
Authorities Donors Civil Society
(In p
erce
nt)
Missions Resident Representatives

32
IV. INSTITUTIONAL DRIVERS OF IMF BEHAVIOR 75. This chapter looks at the institutional drivers of the trends discussed above. It focuses on Board-approved policies, Management communications and guidance, and the implications for priorities for action by operational staff.
A. Executive Directors
76. Board positions on the three issues—accommodation of aid, analysis and mobilization of aid, and poverty reduction and growth effects—are briefly summarized below. The discussion builds on Annex A, which sets out relevant content of Chairman’s Concluding Remarks and Summings-Up.
77. Fund policy on the accommodation of aid in PRGF-supported programs is clear. When the PRGF was introduced in 1999, Executive Directors agreed that increased aid should be allowed to affect the fiscal and external stance within a stable macroeconomic environment and in a non-inflationary manner.84 In 2003, the Board endorsed the accommodation of additional aid within PRGF-supported programs, as long as the flows were sufficiently concessional and did not endanger macroeconomic stability.85 During the discussion, Executive Directors highlighted potentially adverse effects of aid on external competitiveness and fiscal and debt sustainability, which needed to be taken into account in programming decisions including for the accommodation of aid. In 2005, Executive Directors clarified how program design should be tailored to changing aid levels, according to country conditions and policies. 86 The Acting Chair’s Summing-up said: “Directors were of the view that, given a large increase in aid inflows, if absorption capacity is adequate and adverse effects on the tradables sector are contained, a spend and absorb strategy would be appropriate…Directors considered, however, that a more restrained spending policy could be in order if the effectiveness of higher spending is constrained by absorptive capacity, if there is a tension between aid volatility and spending rigidities, or if there is an unacceptable erosion of competitiveness…Directors considered that [the] inflows could help underpin macroeconomic stability, by financing fiscal deficits and crowding in private sector investment through lower interest rates.”
78. Fund policy on the mobilization of aid in the context of the PRGF is not clear. Fund policy requires that programs considered by the Board have no unfilled financing gaps. In this context, alternative scenarios, as discussed earlier in this report, are not relevant to PRGF operational programs, but only to more upstream stages of program development when the authorities are thinking through possible options, including for approaching donors. But Fund policy on the role of the Fund—and Fund staff—in such an approach to donors is not clear. Box 7 sets out five possible roles for the Fund—from catalyst to convener/coordinator, with intermediate roles in between. Starting at the top, Executive Directors agree on the Fund’s catalytic role, which is
84 See IMF (1999e). 85 See IMF (2003b). 86 See IMF (2005k).

33
grounded in a long tradition of Fund work, and most would probably agree on the partner role, although this is not a policy matter on which the Board would need to take a position. The Fund’s advisory role is also longstanding. Where there are disagreements is on Fund activities on mobilizing and coordinating aid, as emerged in the 2004 discussion of the Role of the Fund in Low-Income Member Countries. At the conclusion of that meeting, the Acting Chair said: “By helping members develop appropriate macroeconomic frameworks, and by providing financial support through the PRGF, the Fund could play an important catalytic role in mobilizing development assistance. Directors agreed, however, that the Fund’s role in mobilizing aid on behalf of low-income countries for MDG financing needs to be clarified. Many Directors held the view that the Fund should not play a role in mobilizing aid…but rather its contribution in this area lies in providing policy advice based on sound assessments of financing gaps and macroeconomic implications of aid flows, in terms of both levels and variability. Some Directors preferred a broader role of the Fund, including in promoting and coordinating aid inflows for MDG purposes.”87
79. Fund policy on the treatment of pro-poor expenditures and social impacts in the context of PRGFs is clear; but because of proximity to the PRSP and shared responsibilities with the World Bank, the precise outlines of Fund policy are not always clearly perceived either inside or outside the Fund. It is indeed difficult to distinguish what exactly is the Fund’s role in low income countries (as defined in the discussions of the PRGF) from the role of the authorities and the Bank (as defined in Board discussions of the PRSP and HIPC, based on papers prepared jointly by Fund and Bank staff). Quite naturally, these Board discussions have addressed a number of issues related to country activities, Bank activities, and Fund activities. But one result of these
87 See IMF (2004d).
Box 7. Fund Engagement with Donors: different possible roles
Catalyst—with the Fund’s macro sign-off (in the PRGF and/or other instruments) taken by donors as the green light to proceed with their disbursements (assuming donors’ other conditions are met).
Partner—with the Fund participating in local donor events—especially related to budget support—and harmonizing staff mission timing to the extent possible.
Advisor—with the Fund providing information to the authorities and donors, based on its analysis of alternative policy and aid scenarios.
Mobilizer—with the Fund advocating higher aid levels for individual countries.
Convener/Coordinator—with the Fund playing a lead role in convening donors.

34
many discussions of closely related topics is a blurring of perceptions of the boundaries between the two institutions’ responsibilities and accountabilities. Notwithstanding precise wording of Summings-Up and Concluding Remarks, it takes a very close read to keep straight the specific responsibilities accorded to the Fund under the PRGF, as opposed to the Bank and/or the authorities under the PRSP.
B. Management
80. Management, which chairs the Executive Board, has a particular responsibility to seek to forge a clear consensus on the Board and to translate that consensus into communications of Fund positions and operational guidance for staff. In light of the Board discussions, the following paragraphs look at the Fund’s evolving institutional posture and communications on aid and poverty reduction in SSA and how that evolving posture informed the guidance and feedback provided to operational staff working on PRGFs.
(i) Communications
81. Introduced in 1999 towards the end of the Camdessus era, the PRGF was distinguished from its predecessor the ESAF by its explicit poverty-reduction orientation. The documentation introducing the PRGF acknowledged that growth was essential for poverty reduction—but it also emphasized that poverty could be an impediment to growth. It specifically argued that: “To be effective and sustained, growth-oriented policies should be implemented in a framework in which the pressing need to reduce poverty is also a central objective. From this…has come a commitment to making Fund-supported programs for low-income countries better integrated with policies to fight poverty, better-owned, and better-financed.”88
82. The approach was highlighted in Management’s Key Features document, cited earlier, which was re-endorsed by the Board in 2002 as guidance for staff.89 It was still operative in 2003, when a senior FAD official characterized the “new Fund view” as: “Growth is seen as necessary for poverty reduction, but poverty reduction is recognized as a factor contributing to the achievement of high quality growth.”90 But this view—emphasizing the two-way linkages between poverty reduction and growth that Management had emphasized in 199991—had by then already lost much ground within the Fund.
83. Today—in the context of the MTS—Management’s message is very different. In the past few years, there has been a refocusing of Management’s message onto growth as a necessary ingredient for poverty reduction, with the acknowledgement that critical
88 See IMF (1999d). 89 See IMF (2000a). 90 See Heller (2003). 91 See IMF (1999d).
35
programs in health and education are important and warrant protection and support in government budgets and grant funding from donors.92
84. Institutional communications continue to suggest a more expansive view of the Fund’s role in aid mobilization, advocacy for aid, and alternative MDG scenarios than the Board has agreed.93 For example, the IMF website indicates that: “The IMF contributes to this effort [to achieve the MDGs] through its advice, technical assistance, and lending to countries as well as its role in mobilizing donor support.”94 It later states that the IMF helps poor countries achieve the growth levels needed to reduce poverty through inter alia “advocating for increased aid” from developed countries and that it encourages countries to develop and analyze alternative frameworks for achieving the MDGs—which is at variance with the evaluation’s findings with respect to work on PRGFs. In a similar vein, a recent issue of IMF in Focus states that the IMF encourages countries to develop and analyze alternative frameworks for achieving the MDGs and to use these to underpin their poverty reduction strategies.” In responding to Jeffrey Sachs’, Thomas C. Dawson, then Director of EXR stated: “that same sense of urgency [that characterized IMF follow-up to the G-8 call for IFI debt relief] is present when IMF teams work with countries and development partners … to consider their strategies for meeting the MDGs.”95 The evaluation did not find strong support for these statements either in Fund policy or in PRGF operations.
(ii) Guidance to Staff
85. As with Board policies, operational guidance to staff is clear on Fund policy governing the macroeconomic foundations of the accommodation of aid; unclear on the analysis and mobilization of aid; and clear on the treatment of social impacts and poverty reduction issues but less clear on what constitutes a pro-growth budget.
86. The Fund’s internal review process focuses on a short list of issues centered on the pre-conditions for macroeconomic stability, customized to the particulars of country situations. In the documentary evidence, attention to the monitoring of priority expenditures, the analysis of distributional issues, and/or proactivity in the seeking of additional donor funding was rare, although there were isolated instances in which PDR and/or FAD reviewers raised them. Nor is this agenda reflected in the 20 ex-post assessments that have been carried out for SSA PRGF countries, which are focused on bread-and-butter macro issues, albeit expanded in recent months to include aid-related issues.96
87. Mirroring the lack of agreement on the Board, the institution’s operational guidance is not clear on what IMF staff are to do on aid. As noted earlier in Box 4, the Key Features (also included in the PRGF Handbook) call for “normative macro-projections to signal financing needs and, where warranted, seeking higher aid flow
92 See de Rato (2006). 93 The italics in this paragraph are not in the original; they have been added for emphasis. 94 See http://www.imf.org/external/np/exr/facts/mdg.htm. 95 See Dawson (2006). 96 See, for example, the Uganda EPA, IMF (2005d).

36
commitments that can be built into the program.”97 But it is not clear how this differs from the development of alternative scenarios and the mobilization of aid, nor how staff should proceed in light of the Board’s more cautious stance.
88. The PRGF Staff Report Checklist magnifies the confusion.98 It states: “Especially for strong performers, PRGF staff reports demonstrate that staff have sought higher commitments of donor resources and consider presenting normative projections of grants and concessional loans based on poverty and growth goals. Staff reports should identify the incremental poverty-related spending that could be funded by additional external or fiscal resources should they become available.”
89. On social impacts, as noted in Chapter II, the PRGF Handbook and Checklist provide the basis for staff inputs. That guidance is clear and consistent with Board discussions that budgets supported by PRGFs should be pro-poor and pro-growth, although the guidance is not particularly clear on what constitutes a pro-growth budget. On PSIA, the guidance is clear—that PSIA, where available, should inform the design of countervailing measures as needed.
C. Operational Staff
90. During interviews with the evaluation team, SSA mission chiefs said that their focus in the PRGF was on macroeconomic stability. They said they considered other issues in the context of the PRGF, including the composition of public expenditures—and their possibly pro-poor and/or pro-poor orientation—and the use of poverty and social impact analysis, but this could only be substantively done when timely and relevant analysis was provided by other sources, especially the World Bank. Meanwhile, less than 40 percent of surveyed staff agreed that the PRSP provided the basis for the PRGF, with twice as many agreeing that the PRGF provided the macro basis for the implementation of the PRSP. (See Chart 13.)
97 See IMF (2006g ). 98 See IMF (2006h).
Chart 13. Survey Views on the Relevance of PRSP for PRGF and Vice Versa
Proportions of IMF staff respondents who agreed/strongly agreed that:
0
20
40
60
80
100
The PRSP provided thebasis for PRGF analysis
and design
The PRGF provided theoperational framework forPRSP implementation interms of macroeconomic
policies
(In p
erce
nt)

37
91. All mission chief respondents to the evaluation survey agreed that PRGFs have focused on macroeconomic issues and influenced government macroeconomic policies. A majority agreed that PRGFs have focused on and influenced government policies on growth. (See Chart 14.) A minority (45 percent) agreed PRGFs have focused on poverty reduction and actually influenced relevant government policies. Less than 20 percent agreed that PRGFs have focused on other MDGs, although twice that many agreed that PRGFs have actually influenced relevant policies.
92. Chart 15 shows how mission chiefs see the institution’s changing posture towards the fiscal deficit, inflation, and domestic debt. Over 80 percent support greater easing of the fiscal deficit in good-performing countries, with much smaller proportions supporting the relaxation of inflation and domestic debt targets even in good performers.99 There is no appetite among mission chiefs for a relaxation of fiscal policy, inflation goals, or domestic debt targets in weak-performing countries. This position is consistent with Board approved policy on the accommodation of aid, as discussed above, which conditions the accommodation of increased aid through increased spending and absorption on the strength of country policies, inter alia.
99 Mission chiefs’ responses for the current account deficit and “spend and absorb” were very similar to those for the fiscal deficit; their responses for foreign debt were very similar to those for domestic debt.
Chart 14. Survey Views on Relevance of PRGFs for Macro, Growth, Poverty Reduction, and Other MDGs
Proportions of Mission Chief respondents who agreed/strongly agreed that PRGF program design
focused on/influenced government policy on:
0
20
40
60
80
100
Macro Growth PovertyReduction
MDGs(In
per
cent)
PRGF design focus PRGF influenced
Chart 15. Surveyed Mission Chief Views on Fiscal Deficits, Inflation, and Domestic Debt Proportions of SSA Mission Chiefs who agreed/strongly agreed that IMF should/has:
0
20
40
60
80
100
Tolerate(d)higher level
in allcountries
Tolerate(d)higher level
only ingood
performers
Notchange(d)
Tolerate(d)higher level
in allcountries
Tolerate(d)higher level
only ingood
performers
Notchange(d)
Tolerate(d)higher level
in allcountries
Tolerate(d)higher level
only ingood
performers
Notchange(d)
(In p
erce
nt)
Past 5 years Next 5 years
Fiscal Deficit Inflation Domestic Debt
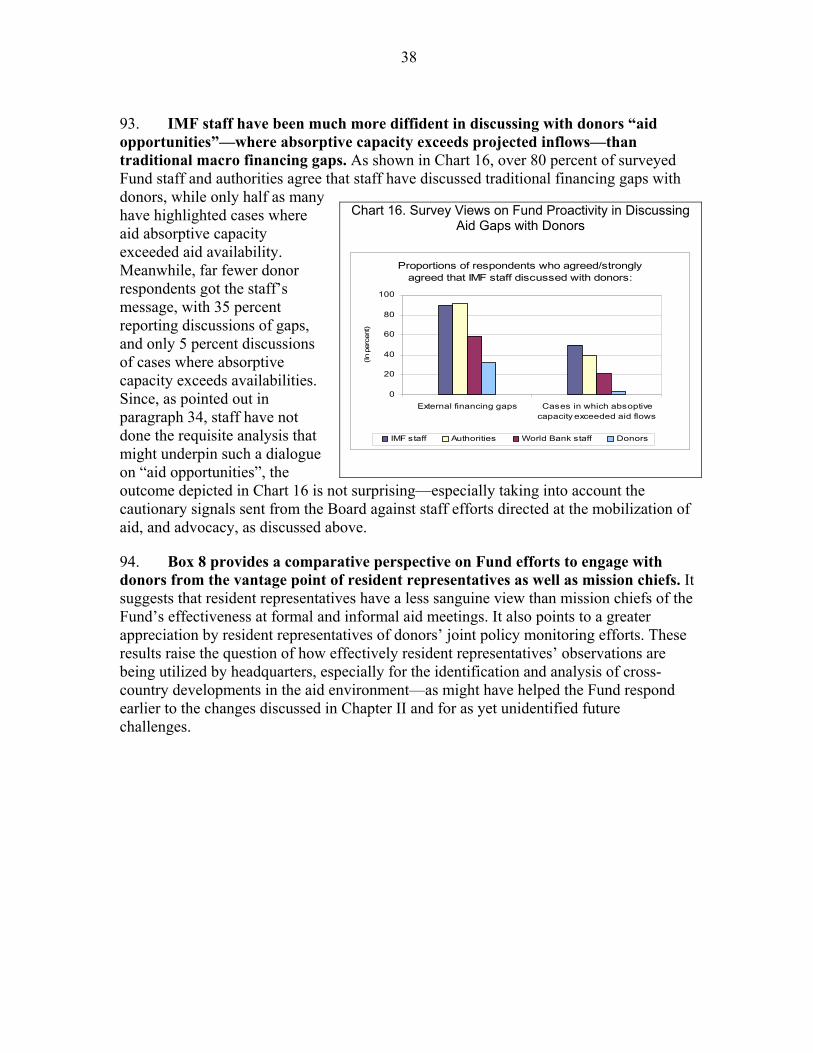
38
93. IMF staff have been much more diffident in discussing with donors “aid opportunities”—where absorptive capacity exceeds projected inflows—than traditional macro financing gaps. As shown in Chart 16, over 80 percent of surveyed Fund staff and authorities agree that staff have discussed traditional financing gaps with donors, while only half as many have highlighted cases where aid absorptive capacity exceeded aid availability. Meanwhile, far fewer donor respondents got the staff’s message, with 35 percent reporting discussions of gaps, and only 5 percent discussions of cases where absorptive capacity exceeds availabilities. Since, as pointed out in paragraph 34, staff have not done the requisite analysis that might underpin such a dialogue on “aid opportunities”, the outcome depicted in Chart 16 is not surprising—especially taking into account the cautionary signals sent from the Board against staff efforts directed at the mobilization of aid, and advocacy, as discussed above.
94. Box 8 provides a comparative perspective on Fund efforts to engage with donors from the vantage point of resident representatives as well as mission chiefs. It suggests that resident representatives have a less sanguine view than mission chiefs of the Fund’s effectiveness at formal and informal aid meetings. It also points to a greater appreciation by resident representatives of donors’ joint policy monitoring efforts. These results raise the question of how effectively resident representatives’ observations are being utilized by headquarters, especially for the identification and analysis of cross-country developments in the aid environment—as might have helped the Fund respond earlier to the changes discussed in Chapter II and for as yet unidentified future challenges.
Chart 16. Survey Views on Fund Proactivity in Discussing Aid Gaps with Donors
Proportions of respondents who agreed/strongly agreed that IMF staff discussed with donors:
0
20
40
60
80
100
External financing gaps Cases in which absoptivecapacity exceeded aid flows
(In p
erce
nt)
IMF staff Authorities World Bank staff Donors

39
Box 8. Resident Representatives’ Perspective on Donor Coordination
The SSA resident representatives are the Fund’s eyes and ears—and voice—on the ground. As such, their responses to some survey questions were of special interest—particularly when they differed from those of the mission chiefs. This occurred on a number of aid- and donor-related questions, where resident representatives have many more opportunities to interact with the local donor community than mission chiefs, who are more removed from the local aid scene. The chart to the right, for example, suggests that the resident representatives have a less sanguine view than mission chiefs of the Fund’s effectiveness at formal and informal aid meetings.1
Resident representatives also show more awareness of donors’ joint policy monitoring efforts than mission chiefs, and greater appreciation of the importance
of Fund involvement in these efforts going forward. As shown in the chart to the left, some 75 percent of resident representative respondents reported that such efforts have become more important to the Fund over the past 5 years and 100 percent see the need for greater attention over the next five years. The shares for mission chiefs are significantly lower—and unchanging—50 percent looking back over the past five years and 50 percent looking ahead to the next five years.
______________________ 1 The chart also shows a less positive view of the Fund’s effectiveness in one-on-one meetings with lead donors. However, that difference between the residents representatives’ and mission chiefs’ responses is not statistically significant.
Surveyed Staff Views on Effectiveness of Their Efforts in Interacting with Donors
Proportions of IMF Staff who agreed/strongly
agreed that the Fund was effective in:
0
2040
6080
100
CG and othermeetings
Informalconsultations
with donorgroups
One-on-onemeetings withlead donors
(In p
erce
nt)
Mission Chiefs Resident Representatives
Surveyed Staff Views on the Importance to IMF of Joint Donor Policy Monitoring
Proportions of staff respondents who agreed/strongly agreed that joint donor policy
monitoring became more important to the Fund over the past five years or should be more important to
the Fund over the next five years:
02040
6080
100
Past 5 years Next 5 years
(In p
erce
nt)
Mission Chiefs Resident Representatives

40
V. FINDINGS AND RECOMMENDATIONS 95. Chapters II-IV have set out many facts on Fund policies and practices in SSA, and on perceptions about Fund policies and practices. This chapter presents the evaluation team’s assessment of what those facts add up to, and its recommendations for addressing the identified challenges going forward.
96. An overarching lesson of the evaluation is the critical importance of operationalizing institutional change strategies with credible mechanisms and incentives—and sustained leadership. For macroeconomic (and closely related) undertakings, the Fund’s strong institutional culture and staff skills require little day-to-day management beyond the agreement on targets for key variables. But those same strengths that make the institution’s core job relatively easy to manage, make departures from it difficult to manage—especially when they involve complicated relationships with partners such as the World Bank with very different operational structures and staff incentives. They require strong follow-through—with close monitoring and high-level management attention—to ensure implementation and accountability. Such attention was clearly needed for the aid and poverty reduction components of the PRGF’s key-features agenda, which faltered after senior Management changed, institutional energy for the initiative dissipated, except for communications by senior FAD officials and EXR, and—with some important exceptions—the Fund gravitated back to business as usual.
97. The good news is that country performance has improved in a number of SSA countries over the period—thanks in part to the advice and actions of the Fund, including through the HIPC Initiative and the MDRI, and in larger part to the actions of the country authorities—and that donor performance has improved as well. In such cases, PRGF-supported macroeconomic program design has eased and become more accommodative of aid. The combination of improved country and donor performance and the associated adaptation of PRGF program design have materially improved SSA’s prospects for growth and poverty reduction.
A. Findings
98. The evaluation’s specific findings follow:
• PRGF-supported macroeconomic policies have generally accommodated the use of incremental aid in countries whose recent policies have led to high stocks of reserves and low inflation; in other countries additional aid was programmed to be saved to increase reserves or to retire domestic debt. Reserves in the 2-3 months-of-imports range were found to be the threshold for determining whether the increased aid should be used to expand the current account deficit or to increase reserves. The estimated inflation threshold for determining whether the country got to spend or save additional aid lies within the 5-7 percent range. These findings are consistent with Board-approved policy on the accommodation of aid, Management guidance and feedback to staff, and staff views. However, they also help to explain why outside observers perceive the Fund as “blocking” the use of aid: PRGFs in

41
countries with inflation above the threshold are likely to program the saving of at least part of additional aid.
• PRGFs have neither set ambitious aid targets nor identified additional aid opportunities—where absorptive capacity exceeds projected aid inflows. They have indirectly catalyzed aid—through their macroeconomic assessment and support for country efforts to improve the underlying macroeconomic environment and fiscal governance. Their medium-term aid forecasts have shown signs of adapting to the increased persistence of aid to SSA—after having been overly conservative at the start. But IMF staff have done little to analyze additional policy and aid scenarios and to share the findings with the authorities and donors. They have not been proactive in mobilizing aid resources, a topic where the Board remains divided and Fund policy—and operational guidance to staff—are unclear.
• Of the key features distinguishing the PRGF from the ESAF, fiscal governance has been far more systematically treated than other elements, such as the use of social impact analysis or the pro-poor and pro-growth budget provisions. The strong PRGF efforts on fiscal governance reflect clear, consistent, and continuing support from the Board; the issue’s centrality to the Fund’s core macro objectives through its links to budget execution; and effective Fund/Bank collaboration, grounded in professional capacity in both institutions. Executive Directors’ support for Poverty and Social Impact Analysis (PSIA), though strong, has been more measured; social analysis is less central to the Fund’s core mandate; and the tailoring of PSIA to PRGF needs was initially stymied by unrealistic expectations of how Fund/Bank collaboration might work on the issue, with more recent efforts focused on in-house analysis. Weak Fund/Bank collaboration has also been a factor in the Fund’s failure to pay more attention to infrastructure-related growth and competitiveness linkages and their possible macroeconomic implications for the programmed spending and absorption of additional aid.
• IMF communications on aid and poverty reduction have contributed to the external impression that the Fund committed to do more on aid mobilization and poverty-reduction analysis. The resulting disconnect has reinforced cynicism about, and distrust of, Fund activities in SSA and other low-income countries. It was especially large in the early years of the evaluation period, when Management communications stressed the two-way linkages between growth and poverty reduction. But it remains a concern even today, in the context of external communications on IMF support for alternative scenarios, MDG strategies, and the mobilization of aid that overstate what the Fund is doing in the context of PRGFs.
• The Fund has missed opportunities for communicating with a broader audience in SSA. The Fund has a network of resident representatives in SSA. Demands on their time have increased in recent years with the changing aid environment, and donors’ increased decentralization and use of budget support instruments. But staff resources and skills have constrained their ability to fully engage with local partners in this changing environment. Meanwhile, they remain a largely untapped source of

42
information on what is happening on the ground among donors and civil society; their observations do not systematically inform institutional positions.
B. Recommendations
99. Going forward, the evaluation points to three recommendations for improving the coherence—actual and perceived—of the institution’s policies and actions relating to aid to SSA. They may also be relevant to several undertakings included in the Medium Term Strategy (MTS).
• The Executive Board should reaffirm and/or clarify Fund policies on the underlying performance thresholds for the spending and absorption of additional aid, the mobilization of aid, alternative scenarios, PSIA, and pro-poor and pro-growth budget frameworks. Based on these reaffirmations and/or clarifications, Management should provide clear guidance to staff on what is required, encouraged, permitted, and/or prohibited—including in working with the World Bank and other partners—and ensure effective implementation and results. The External Relations Department should ensure the consistency of institutional communications with Board-approved operational policies and Fund-supported operations.
• Management should establish transparent mechanisms for monitoring and evaluating the implementation of the clarified policy guidance. The Fund’s Ex-Post Assessments should explicitly cover staff actions and contributions to the implementation of existing and clarified policies. But in view of widespread external concerns about IMF staff accountability in SSA, a more periodic and transparent stocktaking across country programs is needed, possibly in the context of Board reviews of the PRGF—or in future reviews of the MTS.
• Management should clarify expectations—and resource availabilities—for resident representatives’ and missions chiefs’ interactions with local donor groups and civil society. It should monitor trends in the institution’s country-level operating environment, including for aid, periodically assessing the cross-country implications for Fund policies and strategies.

INTERNATIONAL MONETARY FUND
INDEPENDENT EVALUATION OFFICE
An Evaluation of The IMF and Aid to Sub-Saharan Africa
Annexes and References
March 12, 2007

43
ANNEX A. BOARD PERSPECTIVE ON RELEVANT ISSUES
1. This annex provides background on Executive Board discussions of topics covered in the main text. For the most part, it quotes from relevant Chairman’s Summings Up and Concluding Remarks. It follows the order of Chapter II of the main text—starting first with aid issues, before turning to issues related to the stance of macroeconomic policy, and finally to issues included in the Key Features agenda.1 Table A1 at the end of the annex provides a timeline of key events and Board discussions.
I. AID AND MACRO STANCE
2. The importance of aid to the macroeconomic framework was emphasized early on by the IMF Board. At the inception of the PRSP/PRGF in 1999, “[Directors] agreed that external financing would need to play a crucial role in meeting poverty objectives within a stable macroeconomic environment.”2 And also that aid would have an impact on the fiscal and external stance, but need not compromise stability: “Directors agreed that the policies to meet poverty reduction objectives would have an impact on the design of the macroeconomic framework, and they could have an impact on the level of the fiscal and external deficits. Directors emphasized, however, that government spending would need to be financed in a non-inflationary manner.”
3. The Board recognized in 2003 the importance of accommodating aid, taking into account its terms and impact: “Directors generally agreed that additional aid inflows should be accommodated within PRGF-supported programs if these flows are sufficiently concessional and their use does not endanger overall macroeconomic stability. In particular, such an assessment should be based on an evaluation not only of the macroeconomic impact of increased aid inflows, but also of their effect on competitiveness and on fiscal and external debt sustainability, including the recurrent cost implications of additional aid-financed spending.”3
4. In 2005, the Board endorsed Management’s recommendation on the macroeconomic accommodation of aid: “…Directors noted the useful distinction between aid-related “spending”…and “absorption.”…Directors were of the view that, given a large increase in aid inflows, if absorption capacity is adequate and adverse effects on the tradable sector are contained, a spend-and-absorb strategy would be appropriate. Directors considered that, within this scenario, programs should have adjusters to allow higher-than-anticipated aid inflows to be spent, when countries have finance constrained plans for productive spending. Directors also considered that program design could provide greater leeway to draw down reserves when shortfalls in aid materialize, through adjusters on domestic financing, unless
1 See IMF (2000a). 2 See IMF (1999e). 3 See IMF (2003a, b).

44
reserve levels are inadequate. Directors considered, however, that a more restrained spending policy could be in order if the effectiveness of higher spending is constrained by absorptive capacity, if there is a tension between aid volatility and spending rigidities, or if there is an unacceptable erosion of competitiveness…Directors also encouraged countries in which higher aid-based spending would pose a serious threat to competitiveness to consider using the aid for enhancing productivity and/or removing domestic supply constraints.” In this context, Directors highlighted the impact of aid and monetary/fiscal policy coordination on the private sector: “Directors considered that these inflows could help underpin macroeconomic stability, by financing fiscal deficits and crowding in private sector investment through lower interest rates.”4
II. AID: FUND ROLE IN MOBILIZATION AND ALTERNATIVE SCENARIOS
A. Aid Mobilization
5. The Board has discussed the Fund’s role in the mobilization of aid on several occasions, usually in the context of PRSP and PRGF reviews. Following the Board discussion of the 1999 paper on PRGF operational issues, the Chairman concluded: “Directors hoped that the PRSP would identify priority program elements for poverty reduction, to guide adjustments in spending should funding differ from what was assumed. Most Directors considered that Bank and Fund staff should take an active role in identifying financing needs and in mobilizing additional donor resources on appropriate terms for the countries that most need and can effectively use such support.”5
6. Arguments over the appropriate role for the Fund in helping mobilize aid flows to meet the MDGs were summarized in an August 2004 paper on “The Role of the Fund in Low Income Countries.”6 That paper stated: “The role of the Fund in mobilizing the aid flows needed to meet the MDGs should be elaborated more clearly…Some believe the Fund should help its members present their case for how much aid is necessary to meet the MDGs. While the World Bank and other…donors are better equipped to craft estimates, the Fund could provide a coherent macroeconomic and financial framework…Some would have the Fund play an advocacy role in the international community by assessing how much aid has already been pledged, how much more is needed, how much debt a country can afford to service, and how the aid could be timed to minimize the potential for macroeconomic disruption. Others see a more limited role for the Fund, in which it concentrates on its macroeconomic advisory role…The IEO has raised similar issues. With the focus on MDG financing increasing in the international discussions of aid, further clarity will be important.” In a parallel paper reviewing progress in PRSP implementation, staff commented on the Fund’s wider potential
4 See IMF (2005k). 5 See IMF (1999c, d, e). 6 See IMF (2004c, d).
45
role in the process of donor coordination, alignment and harmonization, noting that “the Bretton Woods Institutions will be expected to play a central role in this effort.”7
7. These arguments were left largely unresolved at the subsequent Board discussion on August 30, 2004. The Acting Chair’s Summing Up records that “Directors underscored that it is not the Fund’s role to provide long term development assistance but rather to assist members in responding to balance of payments problems. By helping members develop appropriate macroeconomic frameworks, and by providing financial support through the PRGF, the Fund could play an important catalytic role in mobilizing development assistance. Directors agreed, however, that the Fund’s role in mobilizing aid on behalf of low-income countries for MDG financing needs to be clarified. Many Directors held the view that the Fund should not play a role in mobilizing aid…but rather its contribution in this area lies in providing policy advice based on sound assessments of financing gaps and macroeconomic implications of aid flows, in terms of both levels and variability. Some Directors preferred a broader role of the Fund, including in promoting and coordinating aid inflows for MDG purposes.”8
8. Subsequently, in the 2005 review of the PRS approach, the Board agreed on the Fund’s critical role in the analysis of the macroeconomic impact of additional aid. The Acting Chair’s Summing Up stated: “Directors considered that the Fund would play a critical role in helping countries to analyze this impact and adapt the macroeconomic framework appropriately to accommodate higher aid inflows.”9
B. Alternative Scenarios
9. Executive Directors have also discussed alternative scenarios in low-income countries on several occasions, mostly in the context of their periodic reviews of PRSP implementation. What emerges from those discussions is Board encouragement of countries to undertake contingency planning and alternative scenario analysis as part of their budget and PRSP preparations, with the Fund extending assistance where asked and in close collaboration with the Bank.
10. For example, at the end of the 2002 Board discussion of the PRSP review, which had focused on country vulnerability to shocks, the Chairman concluded: “Countries should work to incorporate contingency-based alternative macroeconomic scenarios in their PRSPs, with Fund support.”10
11. At a 2003 Board seminar on aligning the PRGF and PRSP approach, Executive Directors focused on the disconnect between PRSPs’ optimistic projections and PRGFs’ 7 See IMF (2004b). 8 See IMF (2004c, d). 9 See IMF (2005l). 10 See IMF (2002e, f).

46
realistic projections. The Chairman concluded: “Directors considered that the potential risks and uncertainties, including those resulting form exogenous shocks, should be explicitly identified and taken into account through sensitivity analyses and alternative scenarios. They called for this work to be undertaken in close collaboration with the World Bank, drawing on its particular expertise in this area…More generally, all Directors believed that the PRSP should start from the existing capacity and financial constraints in the current budget, and then set out credible plans on policies that can alleviate these constraints and lead to more ambitious outcomes. This analysis would also need to be reflected in the design of PRGF-supported programs…and would require a greater degree of involvement by Fund staff early in the PRSP process.”11
12. Directors returned to this topic in the 2004 PRSP review, with the Chairman concluding: “Greater use of contingency planning and alternative scenarios could help make the macroeconomic frameworks more effective, particularly in response to shocks. Some Directors noted that alternative scenarios could also be used to demonstrate how a country would scale up its efforts and use additional external resources to speed up progress toward the MDGs, while maintaining the operational realism of the PRSP framework.”12
13. In the 2005 PRSP review, the Chairman concluded: “Directors considered that the use of alternative scenarios in PRSs could bridge the gap between realism and ambition, and provide a credible framework for scaling up assistance at the country level. They concurred that Fund staff should help those countries that sought assistance in preparing such scenarios.”13
III. POVERTY REDUCTION AND GROWTH EFFECTS
A. Poverty and Social Impact Analysis
14. Social impact analysis (PSIA) was included as one of the key features of PRGF-supported programs.14 In discussing PSIA in the context of their consideration of the PRGF, the Acting Chair concluded that Directors generally welcomed the progress, “but indicated that there was scope for a more systematic treatment of this issue in PRGF documents. They requested that documents for PRGF-supported programs routinely provide a description of the PSIA being carried out in the country, including a qualitative description of the likely impact of major macroeconomic and structural measures on the poor and a summary of countervailing measures being implemented to offset any adverse effects.”15
11 See IMF (2003a, b). 12 See IMF (2004b, e). 13 See IMF (2005j, l). 14 See IMF (2000a). 15 See IMF (2002a, b).

47
15. Subsequently in the Board’s August 2002 discussion of PRSP implementation, the Chairman concluded that “Directors also urged further efforts by the Bank and other donors to help countries undertake PSIA on a more generalized and systematic basis. They reaffirmed that PRGF program design and documentation should continue to incorporate available PSIA.”16
16. In the April 2003 Board Seminar on aligning the PRSP and PRGF approach, the Chairman concluded that: “Directors agreed on the importance of PSIA for the PRSP process and for the design and evaluation of Fund-supported programs. Several EDs stressed that PSIA of critical reforms should be carried out early in the PRSP and PRGF process, and they urged Fund staff to work closely with the Bank and other donors to assist national authorities in accelerating the pace of this work.” In discussing the links between the PRSP and the PRGF, and particularly the options that were considered in PRGF formulation, the Chairman said: “Directors also called for setting out the role of PSIA in informing program design and policy choices. They also welcomed the intention to specify the links between program conditionality and PRSP priorities, and strengthen the reporting on PSIA activities.”17
17. More recently, in the September 2004 review of PRSP implementation, the Chairman summed up the discussion of PSIA as follows: “Directors welcomed the rising use of PSIA to inform policy choices and underpin PRS design. They agreed on the need for realistic expectations as to what could be covered by PSIA…They called on Fund staff to step up efforts to integrate PSIA into PRGF program design, focusing Fund efforts on the impact of macroeconomic policy on poverty, and to report regularly on the results of this work in staff reports.”18
B. Pro-Poor and Pro-Growth Budgets
18. In the December 1999 discussion of the PRSP and PRGF, the Chairman concluded that: “[Directors] supported the integration into the macroeconomic frameworks of key specific, costed measures to increase growth and reduce poverty, noting that this will enhance existing efforts to increase social and other priority spending where appropriate and to identify targeted social safety nets.” But at the same time, the Fund should not venture into areas outside its core responsibilities: “Directors broadly supported the proposed division of labor between the Bank and the Fund in supporting the preparation of PRSPs. They emphasized that Fund staff should not be expected to—and should not—offer assistance in areas that are primarily the responsibility of the Bank.”19
16 See IMF (2002e, f). 17 See IMF (2003a, b). 18 See IMF (2004b, e). 19 See IMF (1999e).

48
19. In 2002, in the context of discussions of the Status of Implementation of the HIPC Initiative, the Board noted in general terms the expected contribution of debt relief to higher poverty-reducing expenditures: “[Directors noted]…HIPC debt relief to these countries represents a reduction in their outstanding debt stock by two-thirds. This will reduce debt-service payments for most HIPCs to less than 10 percent of exports, helping these countries to increase substantially their poverty-reducing expenditures.”20
20. In 2005, the Board also clarified its views on the role of pro-poor expenditures vis-à-vis the MDGs: “Directors saw a need for increased spending in many low-income countries, in particular for public investments, health care and education, if these countries are to meet the MDGs. However, they emphasized that progress towards the MDGs is not contingent on higher public expenditures alone, noting the potential tensions between higher government spending and both debt sustainability and private sector activity, which could be crowded out.”21
20 See IMF (2002d, g). 21 See IMF (2005l).
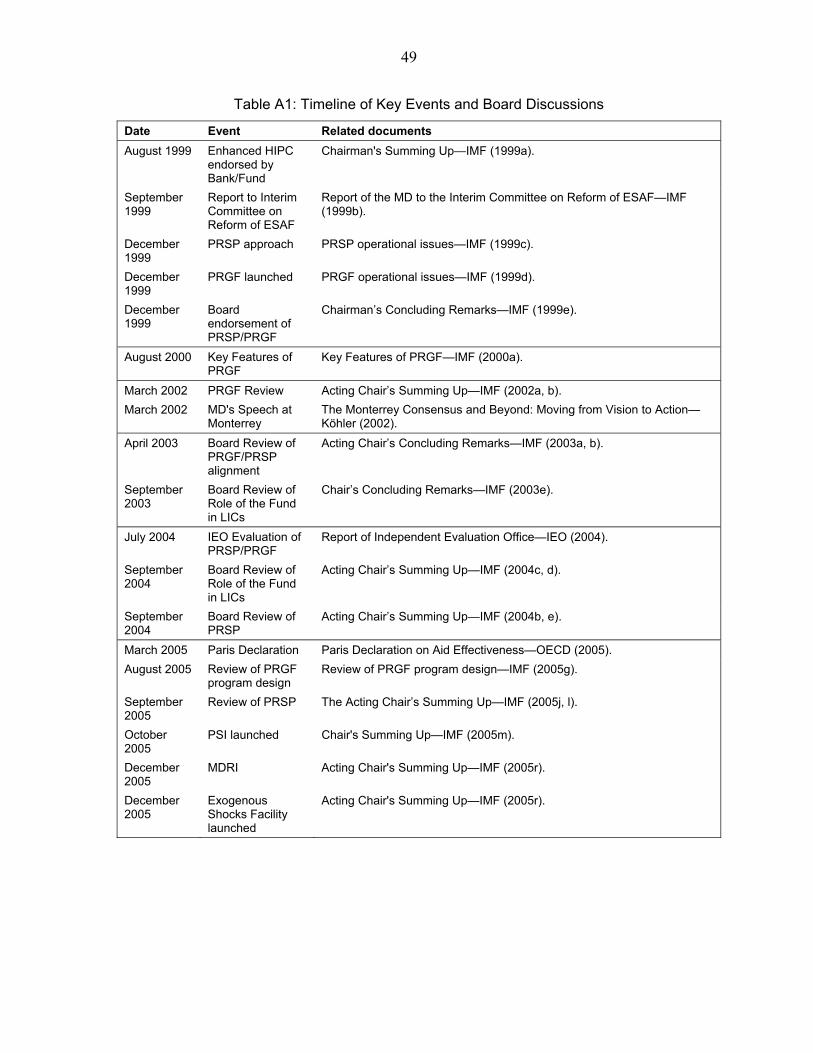
49
Table A1: Timeline of Key Events and Board Discussions
Date Event Related documents August 1999 Enhanced HIPC
endorsed by Bank/Fund
Chairman's Summing Up—IMF (1999a).
September 1999
Report to Interim Committee on Reform of ESAF
Report of the MD to the Interim Committee on Reform of ESAF—IMF (1999b).
December 1999
PRSP approach PRSP operational issues—IMF (1999c).
December 1999
PRGF launched PRGF operational issues—IMF (1999d).
December 1999
Board endorsement of PRSP/PRGF
Chairman’s Concluding Remarks—IMF (1999e).
August 2000 Key Features of PRGF
Key Features of PRGF—IMF (2000a).
March 2002 PRGF Review Acting Chair’s Summing Up—IMF (2002a, b). March 2002 MD's Speech at
Monterrey The Monterrey Consensus and Beyond: Moving from Vision to Action—Köhler (2002).
April 2003 Board Review of PRGF/PRSP alignment
Acting Chair’s Concluding Remarks—IMF (2003a, b).
September 2003
Board Review of Role of the Fund in LICs
Chair’s Concluding Remarks—IMF (2003e).
July 2004 IEO Evaluation of PRSP/PRGF
Report of Independent Evaluation Office—IEO (2004).
September 2004
Board Review of Role of the Fund in LICs
Acting Chair’s Summing Up—IMF (2004c, d).
September 2004
Board Review of PRSP
Acting Chair’s Summing Up—IMF (2004b, e).
March 2005 Paris Declaration Paris Declaration on Aid Effectiveness—OECD (2005). August 2005 Review of PRGF
program design Review of PRGF program design—IMF (2005g).
September 2005
Review of PRSP The Acting Chair’s Summing Up—IMF (2005j, l).
October 2005
PSI launched Chair's Summing Up—IMF (2005m).
December 2005
MDRI Acting Chair's Summing Up—IMF (2005r).
December 2005
Exogenous Shocks Facility launched
Acting Chair's Summing Up—IMF (2005r).
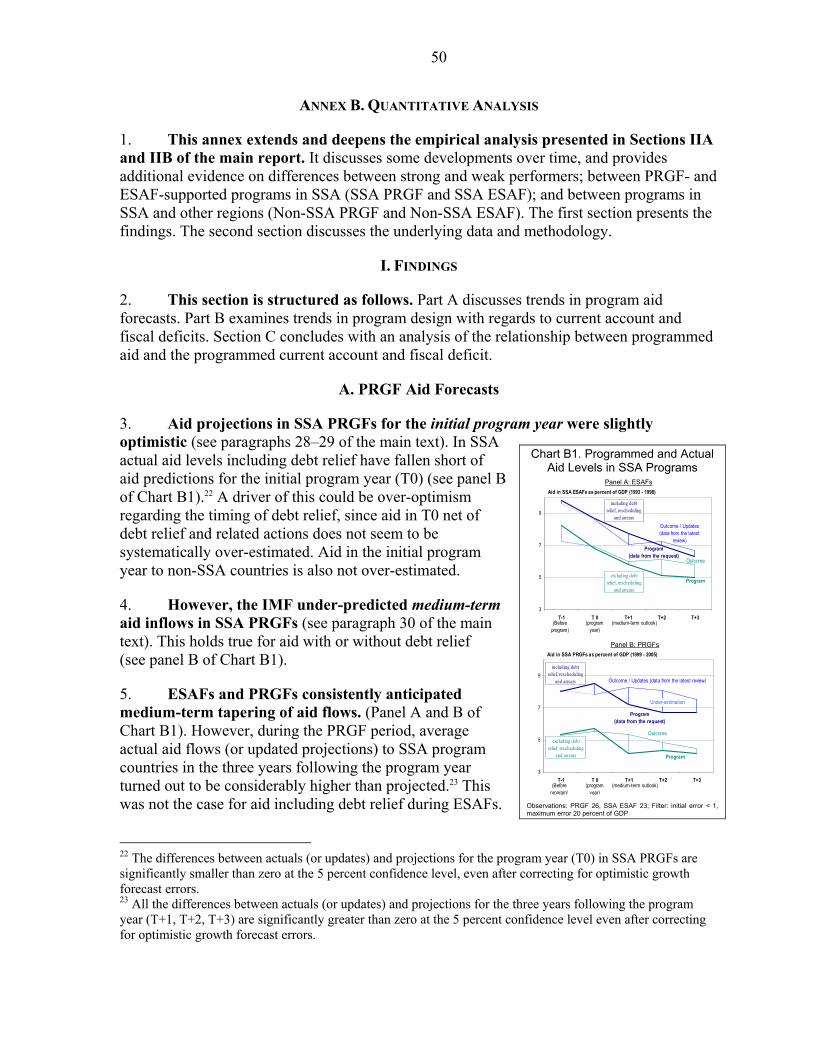
50
ANNEX B. QUANTITATIVE ANALYSIS
1. This annex extends and deepens the empirical analysis presented in Sections IIA and IIB of the main report. It discusses some developments over time, and provides additional evidence on differences between strong and weak performers; between PRGF- and ESAF-supported programs in SSA (SSA PRGF and SSA ESAF); and between programs in SSA and other regions (Non-SSA PRGF and Non-SSA ESAF). The first section presents the findings. The second section discusses the underlying data and methodology.
I. FINDINGS
2. This section is structured as follows. Part A discusses trends in program aid forecasts. Part B examines trends in program design with regards to current account and fiscal deficits. Section C concludes with an analysis of the relationship between programmed aid and the programmed current account and fiscal deficit.
A. PRGF Aid Forecasts
3. Aid projections in SSA PRGFs for the initial program year were slightly optimistic (see paragraphs 28–29 of the main text). In SSA actual aid levels including debt relief have fallen short of aid predictions for the initial program year (T0) (see panel B of Chart B1).22 A driver of this could be over-optimism regarding the timing of debt relief, since aid in T0 net of debt relief and related actions does not seem to be systematically over-estimated. Aid in the initial program year to non-SSA countries is also not over-estimated.
4. However, the IMF under-predicted medium-term aid inflows in SSA PRGFs (see paragraph 30 of the main text). This holds true for aid with or without debt relief (see panel B of Chart B1).
5. ESAFs and PRGFs consistently anticipated medium-term tapering of aid flows. (Panel A and B of Chart B1). However, during the PRGF period, average actual aid flows (or updated projections) to SSA program countries in the three years following the program year turned out to be considerably higher than projected.23 This was not the case for aid including debt relief during ESAFs.
22 The differences between actuals (or updates) and projections for the program year (T0) in SSA PRGFs are significantly smaller than zero at the 5 percent confidence level, even after correcting for optimistic growth forecast errors. 23 All the differences between actuals (or updates) and projections for the three years following the program year (T+1, T+2, T+3) are significantly greater than zero at the 5 percent confidence level even after correcting for optimistic growth forecast errors.
Chart B1. Programmed and Actual Aid Levels in SSA Programs
Panel A: ESAFs
3
5
7
9
T-1 T 0 T+1 T+2 T+3
Program
(medium-term outlook)(Before program)
(program year)
Program(data from the request)
Outcome / Updates (data from the latest
review)
Outcome
Aid in SSA ESAFs as percent of GDP (1993 - 1998)
including debt relief, rescheduling
and arrears
excluding debt relief, rescheduling
and arrears
Panel B: PRGFs
3
5
7
9
T-1 T 0 T+1 T+2 T+3
Outcome / Updates (data from the latest review)
Program
Under-estimation
(medium-term outlook)(Before program)
(program year)
Program(data from the request)
Outcome
Aid in SSA PRGFs as percent of GDP (1999 - 2005)
including debt relief, rescheduling
and arrears
excluding debt relief, rescheduling
and arrears
Observations: PRGF 26, SSA ESAF 23; Filter: initial error < 1, maximum error 20 percent of GDP

51
6. Medium-term under-prediction of aid was not observed outside of SSA. Chart B2 shows that in other regions, average outcomes followed PRGF projections for the outer years more closely.24
7. IMF program design appears to have caught up with the increased persistence of aid flows to SSA by reducing programmed tapering in recent years. Chart B3 displays annual average differences between aid levels that were projected for the program year and for two years later. It shows the development over time for the overall average and for two groups of countries distinguished by macroeconomic performance.25 As illustrated, programmed aid tapering in the medium term has decreased over time, especially in programs of countries with good macro performance.
B. Program Design
8. This section discusses programmed current account and fiscal deficits. The discussion of the latter is further disaggregated into programmed public spending and domestic revenue generation. For each of these dimensions, developments over time are discussed as well as how outcomes relate to program design.
(i) Current Account
9. The Fund became more accommodative regarding current account adjustments. Chart B4 shows the average programmed change in the non-aid current account during the program year in SSA. While under early ESAFs, sharp adjustments
24 Forecast errors are not significantly different from zero in non-SSA PRGFs. For T+1 and T+2, there is a significant positive difference in forecast errors between SSA and non-SSA PRGFs at the 5 percent confidence level even after correcting for optimistic growth forecast errors. 25 ‘Good performance’ defined as initial conditions of inflation below 10 percent, positive growth and domestic financing below 1 percent of GDP.
Chart B2. Programmed and Actual Aid Levels in SSA and Other Regions
Panel A: ESAFs Panel B: PRGFs
2
4
6
8
10
12
14
T-1 T 0 T+1 T+2 T+3(medium-term outlook)(program
year)
Program
ProgramOutcome
Outcome
Non-SSA
SSA
(In percent of GDP)
Aid including debt rescheduling, relief and arrears in PRGFs (1999–2005)
2
4
6
8
10
12
14
T-1 T 0 T+1 T+2 T+3(medium-term outlook)(program
year)
Program
Program
Outcome
Outcome
Non-SSA
SSA
(In percent of GDP)
Aid including debt rescheduling, relief and arrears in ESAFs (1993–98)
Observations: SSA PRGF 26, Non-SSA PRGF 9, SSA ESAF 23; Filter: initial error < 1, maximum error 20 percent of GDP.
Chart B3. Trends in Programming the Persistence of Aid Flows to SSA
Overall average
Weak performers-5
-4
-3
-2
-1
0
1
1993 1994 1995 1996 1997 1998 1999 2000 2001 2002 2003 2004 2005
%-p
oint
per
GD
P di
ffere
nces Programmed tapering-off of aid flows in SSA (T+2 - T0)
More tapering off
ESAF
PRGF
Less tapering offGood performers
186 observations spread out over the entire period, Filter: Aid>0 percent
Chart B4. Programmed Current Account Adjustments in SSA
-5-4-3-2-10123
1993 1994 1995 1996 1997 1998 1999 2000 2001 2002 2003 2004 2005
%-p
oint
per
GD
Pdi
ffere
nces
ESAF
linear trend of averages
Expansion
Con
tract
ion
Non-aid current account deficit: difference T0 – T-1PRGF
305 observations spread out over the entire period, Filter: abs(ΔCA[T0–T-1])<20 percent

52
of the current account deficit in the program year were common, average adjustments in PRGFs have hovered around zero.
10. The typical SSA PRGF envisaged a medium-term consolidation of the non-aid current account deficit. However, Chart B5 shows that, in the medium term, realized current account deficits were greater on average than programmed—financed by the higher-than-expected aid inflows discussed above.
(ii) Fiscal Balance
11. SSA PRGFs—in contrast to ESAFs—allowed for increases in expenditures during the program year. Chart B6 shows that the programmed difference in expenditures26 between the program year and the year before has shifted upward from tightening in the earlier ESAF years to accommodation of increased expenditures during PRGF.
12. But like ESAFs, SSA PRGFs envisaged medium-term consolidation of expenditures (see Chart B7). However, outcomes show that this consolidation did not materialize, as expenditures increased instead. This difference between programmed and actual medium-term expenditures was again financed by higher-than-expected aid levels.
Chart B7. Programmed and Actual Expenditures and Revenues in SSA ESAFs and PRGFs
Fiscal variables in SSA ESAFs
14
16
18
20
22
24
T-1 T 0 T + 1 T + 2 T + 3
(In
perc
ent o
f GD
P)
Program
Outcome / Update
(medium-term outlook)(Before program)
(program year)
Non-interest expenditures
Domestic revenue Program
Outcome / Update
Fiscal variables in SSA PRGFs
14
16
18
20
22
24
T-1 T 0 T + 1 T + 2 T + 3
(In
perc
ent o
f GD
P) Program
Outcome / Update
(medium-term outlook)(Before program)
(program year)
Non-interest expenditures
Domestic revenue
Program
Outcome / Update
27 observations Filters: initial error < 1 percent of GDP 28 observations Filters: initial error < 1 percent of GDP
26 Expenditures exclude interest payments.
Chart B5. Average Current Account Deficits in SSA PRGF Programs
10
12
14
16
T-1 T 0 T + 1 T + 2 T + 3
(% o
f GD
P)
Programmed projection(data from the request)
Outcome / Update(data from the latest review)
(medium-term outlook)(Before program)
(program year)
Average current account deficit before grants and interests
34 observations Filters: initial error <2 percent, maximum error <20 percent
Chart B6. Programmed Expenditure Adjustment in SSA
-2
-1
0
1
1993 1994 1995 1996 1997 1998 1999 2000 2001 2002 2003 2004 2005
perc
enta
ge-p
oint
diff
eren
ces
per G
DP
ESAF
PRGFExpansion
Con
tract
ion
306 observations spread out over the entire period
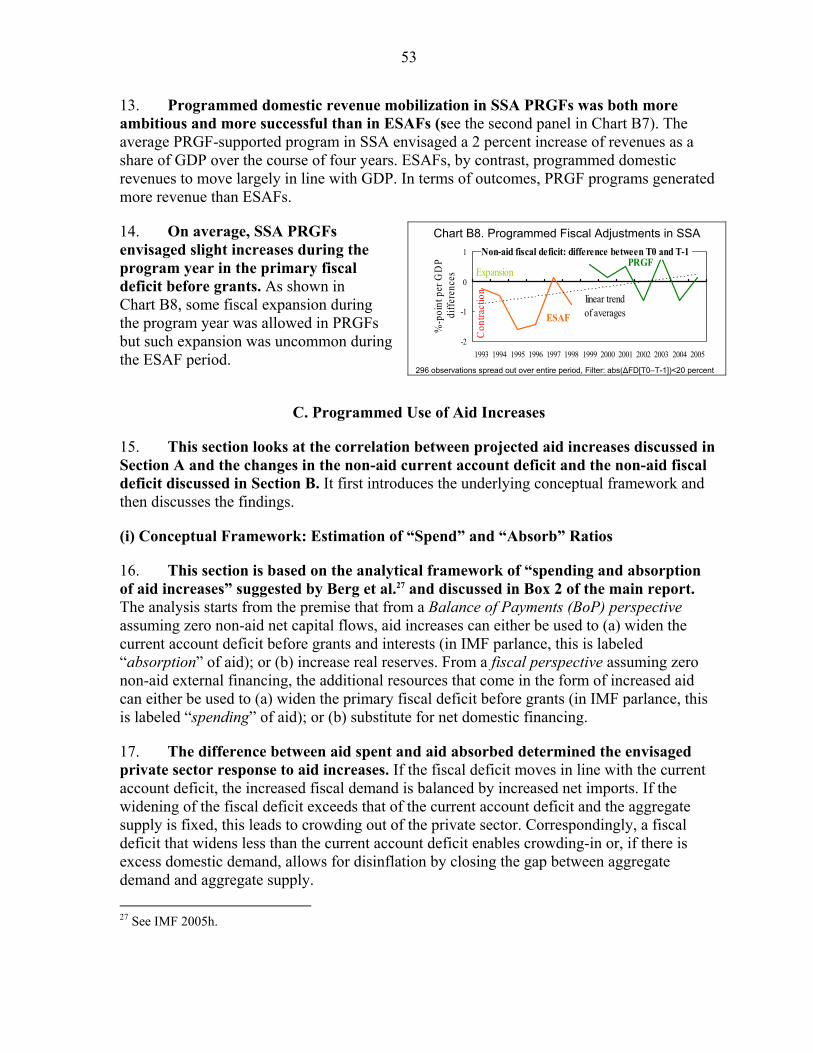
53
13. Programmed domestic revenue mobilization in SSA PRGFs was both more ambitious and more successful than in ESAFs (see the second panel in Chart B7). The average PRGF-supported program in SSA envisaged a 2 percent increase of revenues as a share of GDP over the course of four years. ESAFs, by contrast, programmed domestic revenues to move largely in line with GDP. In terms of outcomes, PRGF programs generated more revenue than ESAFs.
14. On average, SSA PRGFs envisaged slight increases during the program year in the primary fiscal deficit before grants. As shown in Chart B8, some fiscal expansion during the program year was allowed in PRGFs but such expansion was uncommon during the ESAF period.
C. Programmed Use of Aid Increases
15. This section looks at the correlation between projected aid increases discussed in Section A and the changes in the non-aid current account deficit and the non-aid fiscal deficit discussed in Section B. It first introduces the underlying conceptual framework and then discusses the findings.
(i) Conceptual Framework: Estimation of “Spend” and “Absorb” Ratios
16. This section is based on the analytical framework of “spending and absorption of aid increases” suggested by Berg et al.27 and discussed in Box 2 of the main report. The analysis starts from the premise that from a Balance of Payments (BoP) perspective assuming zero non-aid net capital flows, aid increases can either be used to (a) widen the current account deficit before grants and interests (in IMF parlance, this is labeled “absorption” of aid); or (b) increase real reserves. From a fiscal perspective assuming zero non-aid external financing, the additional resources that come in the form of increased aid can either be used to (a) widen the primary fiscal deficit before grants (in IMF parlance, this is labeled “spending” of aid); or (b) substitute for net domestic financing.
17. The difference between aid spent and aid absorbed determined the envisaged private sector response to aid increases. If the fiscal deficit moves in line with the current account deficit, the increased fiscal demand is balanced by increased net imports. If the widening of the fiscal deficit exceeds that of the current account deficit and the aggregate supply is fixed, this leads to crowding out of the private sector. Correspondingly, a fiscal deficit that widens less than the current account deficit enables crowding-in or, if there is excess domestic demand, allows for disinflation by closing the gap between aggregate demand and aggregate supply. 27 See IMF 2005h.
Chart B8. Programmed Fiscal Adjustments in SSA
Chart Title
-2
-1
0
1
1993 1994 1995 1996 1997 1998 1999 2000 2001 2002 2003 2004 2005
%-p
oint
per
GD
Pdi
ffere
nces
ESAF
linear trend of averages
Expansion
Con
tract
ion
Non-aid fiscal deficit: difference between T0 and T-1PRGF
296 observations spread out over entire period, Filter: abs(ΔFD[T0–T-1])<20 percent

54
18. A series of regressions produced estimates of programmed average spending and absorption of aid increases in SSA PRGFs. To illustrate the methodology, Chart B9 plots programmed current account and fiscal adjustments28 against anticipated aid increases. The observations are drawn from PRGF program requests and reviews between 1999 and 2005 for all SSA countries. Regressions on this data with suppressed constants produced slope estimates of the current account and fiscal responses to increases in aid (Table B1).29 These are the basis for absorption and spending estimates for incremental aid, respectively, used throughout this report.30 Estimates of the proportion of incremental aid used to reduce domestic debt are derived from the difference between spending and absorption, and estimated reserve accumulation from the difference between absorption and the aid increase.
(ii) Findings
19. As reported in paragraph 15 of the main text, initial levels of reserves were a key driver of differences in programmed absorption of aid increases in SSA PRGFs. Chart B10 below shows that countries with reserve levels below 2.5 months of imports were programmed to use almost all of the anticipated aid increases (95 percent on average31) to raise reserve levels. Programs for countries with higher initial reserve stocks, on the other hand, allowed for the full use of the additional resources to increase net imports. The coefficients of the first regression reported in Table B2 show that this difference stems from differences in both adjustments that were independent of changes in aid and from a steeper
28 Programmed changes between one year before the program and the program year 29 Obviously, both deficits are influenced by many more factors than the deliberately few variables used in this regression, which serve the purpose of shedding some light on correlations with expected changes in aid rather than testing whether the underlying model is complete. The dashed lines in the graph show the linear estimates for the unconstrained model, while solid lines show these estimates for the constrained model, which by suppressing the constant, forces all changes in the two deficits to be linked to aid increases. The results of the regressions reported in the tables show that the constant was positive but not significantly different from zero. Hence, its suppression had only a limited upward bias on the reported estimates. At the same time, the suppression of the constant helps avoid an underestimation of spending ratios that would arise from measurement errors in the unconstrained model. 30 All charts presented show only differences found to be significant at least at the 10 percent level in the constrained and/or unconstrained regressions. Significance in one of the two tests sufficed for depiction. 31 Not significantly different from 100 percent.
Chart B9. Derivation of Estimates for Spending and Absorption of Anticipated Aid in SSA PRGFs
-50
510
15P
rogr
amm
ed c
hang
es in
def
icits
0 5 10Anticipated aid increases
Best fits for: Aid (45 degree)
Current Account Fiscal
Average Programmed Use of Aid Increases in SSA PRGFs
(in percent of aid increase)
27 37
6437
Increased net imports (absorption) Reserve accumulation
Net fiscal expansion (spending)
Net fiscal expansion (spending)
Domestic debt reduction / crowding in
Reserve accumulation
Table B1. Regressions: Base model: SSA PRGFs
Unconstrained Suppressed Constant CAD FD CAD FD Delta aid 0.503 0.137 0.635 0.266 (0.086)+ (0.237) (0.004)** (0.003)** Constant 0.601 0.586 (0.504) (0.104) Observations 65 65 65 65
p values in parentheses, + significant at 10%; * significant at 5%; ** significant at 1%, Filter: 0 < ΔAid[T0–T-1] < 10%
Reserves
Crowding in
Fiscal expansion

55
response to aid increases for countries with high reserves. This adds up to a significant difference between the two groups of countries depending on reserves level in the constrained model.
Chart B10. Spending and Absorption in PRGFs: Importance of Initial Conditions
79
15
5
21
85
95
High reserves, lowinflaton
High reserves, highinflaton
Low reserves
Initia
l con
ditio
ns
Net f iscal expansion (spending)Domestic debt reduction / crow ding inReserve accumulation
Table B2. Regressions: PRGFs in SSA: Importance of initial conditions
All reserve levels High reserves CAD CAD FD FD Delta aid 0.323 0.054 0.096 0.147 (0.501) (0.868) (0.631) (0.240)
0.416 0.945 High reserves interaction term (0.484) (0.027)*
0.488 0.645 Low inflation interaction term (0.279) (0.023)*
2.442 High reserves dummy (0.221)
0.09 Low inflation dummy (0.938) Constant -1.314 0.323 (0.442) (0.739) Observations 65 65 46 46 p values in parentheses, + significant at 10%; * significant at 5%; ** significant at 1%, Filter: 0 < ΔAid[T0–T-1] < 10%
Note: Thresholds are reserves of 2.5 months of imports and inflation of 5%
20. As reported in paragraph 18 of the main text, initial inflation levels were key determinants of SSA PRGF program approaches to the spending of incremental aid. Chart B10 illustrates that observed inflation before the start of a program influenced the average programmed spending for countries with high reserves. Countries with inflation levels below 5 percent32 were allowed to spend almost all the anticipated aid increases (79 percent on average33), while countries with higher inflation were programmed to use nearly all incremental aid (85 percent on average34) to reduce domestic financing, instead.
21. The criteria typically used to identify “mature stabilizers” had a significant impact on programmed spending of aid increases but not on their absorption. Programs in countries with initial conditions of single digit inflation, positive growth, and domestic financing below 1 percent of GDP envisage spending increases of about half of anticipated aid increases, on average. This compares with almost no spending of incremental aid increases (17 percent on average35) in countries that do not meet these conditions (see Chart B11).
32 5 percent was identified by the data as the threshold, which generates the most significant difference between programs with low and high initial inflation. Without controlling for other initial conditions like domestic financing or growth, the highest inflation threshold with significant differences was found to be 7 percent. Once we control for those other conditions, even higher thresholds like 10 percent generate significant differences. However, even then only for programs with initial inflation below 7 percent, the estimated average spending ratio is not significantly different from 100%. 33 Not significantly different from 100 percent. 34 The coefficient on the fiscal deficit of 15 percent is not significantly different from zero percent. 35 Significantly different from zero.
Chart B11. Spending and Absorption in SSA: The “Mature Stabilizer”
Performance Criteria1
17
49
46 37
3714
Weakperformers
Goodperformers
Fiscal expansionDom. debt reduct./ crow ding inIncrease reserves
•
1 Following the Fund’s definition of “mature stabilizers,” good performance was defined as inflation below 10%, positive growth and domestic financing below 1% before the program.
Table B3. Regressions: SSA: Influence of performance
FD FD Delta aid 0.228 0.173 (0.119) (0.086)+
-0.028 0.319 Performance Interaction (0.907) (0.087)+
1.355 Performance dummy (0.059)+ Constant -0.273 (0.612) Observations 65 65 p values in parentheses, + significant at 10%; * significant at 5%; ** significant at 1%, Filter: 0 < ΔAid[T0–T-1] < 10%
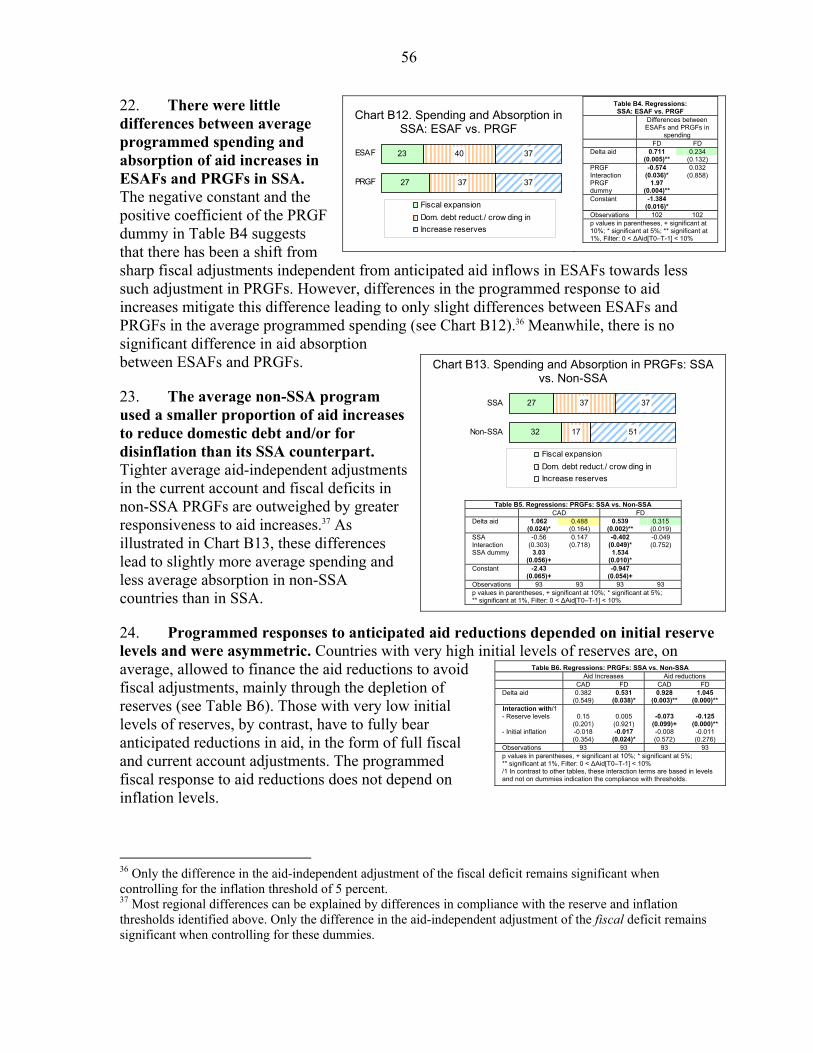
56
22. There were little differences between average programmed spending and absorption of aid increases in ESAFs and PRGFs in SSA. The negative constant and the positive coefficient of the PRGF dummy in Table B4 suggests that there has been a shift from sharp fiscal adjustments independent from anticipated aid inflows in ESAFs towards less such adjustment in PRGFs. However, differences in the programmed response to aid increases mitigate this difference leading to only slight differences between ESAFs and PRGFs in the average programmed spending (see Chart B12).36 Meanwhile, there is no significant difference in aid absorption between ESAFs and PRGFs.
23. The average non-SSA program used a smaller proportion of aid increases to reduce domestic debt and/or for disinflation than its SSA counterpart. Tighter average aid-independent adjustments in the current account and fiscal deficits in non-SSA PRGFs are outweighed by greater responsiveness to aid increases.37 As illustrated in Chart B13, these differences lead to slightly more average spending and less average absorption in non-SSA countries than in SSA.
24. Programmed responses to anticipated aid reductions depended on initial reserve levels and were asymmetric. Countries with very high initial levels of reserves are, on average, allowed to finance the aid reductions to avoid fiscal adjustments, mainly through the depletion of reserves (see Table B6). Those with very low initial levels of reserves, by contrast, have to fully bear anticipated reductions in aid, in the form of full fiscal and current account adjustments. The programmed fiscal response to aid reductions does not depend on inflation levels.
36 Only the difference in the aid-independent adjustment of the fiscal deficit remains significant when controlling for the inflation threshold of 5 percent. 37 Most regional differences can be explained by differences in compliance with the reserve and inflation thresholds identified above. Only the difference in the aid-independent adjustment of the fiscal deficit remains significant when controlling for these dummies.
Chart B12. Spending and Absorption in SSA: ESAF vs. PRGF
27
23
37 37
3740
PRGF
ESAF
Fiscal expansionDom. debt reduct./ crow ding inIncrease reserves
Table B4. Regressions: SSA: ESAF vs. PRGF
Differences between ESAFs and PRGFs in
spending FD FD Delta aid 0.711 0.234 (0.005)** (0.132)
-0.574 0.032 PRGF Interaction (0.036)* (0.858)
1.97 PRGF dummy (0.004)** Constant -1.384 (0.016)* Observations 102 102 p values in parentheses, + significant at 10%; * significant at 5%; ** significant at 1%, Filter: 0 < ΔAid[T0–T-1] < 10%
Chart B13. Spending and Absorption in PRGFs: SSA vs. Non-SSA
32
27
17 51
3737
Non-SSA
SSA
Fiscal expansionDom. debt reduct./ crow ding inIncrease reserves
Table B5. Regressions: PRGFs: SSA vs. Non-SSA CAD FD Delta aid 1.062 0.488 0.539 0.315 (0.024)* (0.164) (0.002)** (0.019)
-0.56 0.147 -0.402 -0.049 SSA Interaction (0.303) (0.718) (0.049)* (0.752)
3.03 1.534 SSA dummy (0.056)+ (0.010)*
Constant -2.43 -0.947 (0.065)+ (0.054)+ Observations 93 93 93 93 p values in parentheses, + significant at 10%; * significant at 5%; ** significant at 1%, Filter: 0 < ΔAid[T0–T-1] < 10%
Table B6. Regressions: PRGFs: SSA vs. Non-SSA Aid Increases Aid reductions CAD FD CAD FD Delta aid 0.382 0.531 0.928 1.045 (0.549) (0.038)* (0.003)** (0.000)** Interaction with/1
0.15 0.005 -0.073 -0.125 - Reserve levels (0.201) (0.921) (0.099)+ (0.000)** -0.018 -0.017 -0.008 -0.011 - Initial inflation (0.354) (0.024)* (0.572) (0.276)
Observations 93 93 93 93 p values in parentheses, + significant at 10%; * significant at 5%; ** significant at 1%, Filter: 0 < ΔAid[T0–T-1] < 10% /1 In contrast to other tables, these interaction terms are based in levels and not on dummies indication the compliance with thresholds.

57
25. Almost 80 percent of SSA PRGFs limited the possibility of authorities to fully spend unanticipated windfalls in aid or fully finance unanticipated shortfalls. As seen in Chart B14, this stance is similar to the Fund’s position towards unanticipated changes in aid in other regions.
II. METHODOLOGY AND DATA
26. This section discusses data definitions and methodology used to derive the results presented in the evaluation report. MONA, the principal data source used in the analysis, had a break in series in 2001. All programs starting before the break in 2001 plus the 2002 PRGF for the Democratic Republic of Congo are captured in MONA I. MONA II, which has a different set of macroeconomic variables, captures all other programs.
27. The proxy variable for net aid inflows was derived from balance of payments (BoP) data by adding changes in liabilities to official creditors (disbursements—amortization) to official current transfers and capital transfers, deducting external interest payments and—where applicable—adding the programmed financing gap and external arrears (Table B7). 38 The variables “projected new rescheduling” and “other BoP support” were often not available in the database. In these cases, the value was assumed to be either zero or captured by some other variables. Hence, they were omitted in the calculations.
38 To check whether there is a systematic bias of the estimated spending ratios given that the proxy for aid inflows was derived from BoP data and the fiscal deficit was derived from fiscal data, fiscal aid data compiled from the case studies was compared with the BoP derived proxy from MONA. Both were highly correlated and without a significant bias.
Chart B14. Treatment of Unanticipated Aid Inflows in PRGFs (in percent of programs)
SHORTFALLS WINDFALLS
No domestic financing of shortfalls
Limited domestic financing
Full domestic financing
No spending of windfalls
Limited spending
Full spending
SSA
Non-SSA
Note: Graph depicts percentages of different adjusters as observed in the initial request.
216712`
256313`
57 21 21`
79 8 13`
Table B7. Proxies for “Net Aid” per GDP MONA I MONA II
(Official Transfers, net +Other BOP Support –Scheduled Net Interest Payments +Official borrowing from multilateral and bilateral lenders (excl. Fund) –Scheduled Principal Payments (excl. Fund) +Rescheduling contracted before program +Projected New Rescheduling +Increases in External Payments Arrears + Programmed Financing Gap) / GDP
(Official current transfers, net - Interest payments + Capital account balance + [Changes in] Liabilities to official creditors – [of which:] Credit and loans from IMF (excludes reserve position in the Fund) + Arrears, net change (in the financial account) (+increase) + Programmed financing gap) / GDP
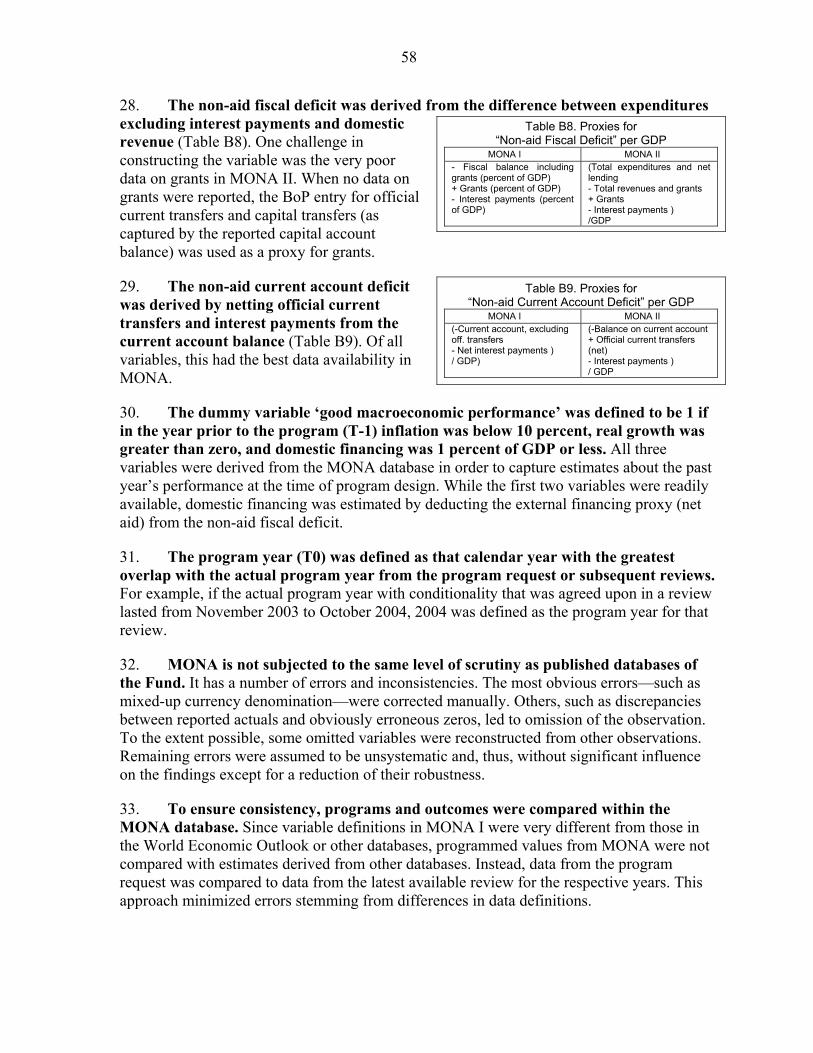
58
28. The non-aid fiscal deficit was derived from the difference between expenditures excluding interest payments and domestic revenue (Table B8). One challenge in constructing the variable was the very poor data on grants in MONA II. When no data on grants were reported, the BoP entry for official current transfers and capital transfers (as captured by the reported capital account balance) was used as a proxy for grants.
29. The non-aid current account deficit was derived by netting official current transfers and interest payments from the current account balance (Table B9). Of all variables, this had the best data availability in MONA.
30. The dummy variable ‘good macroeconomic performance’ was defined to be 1 if in the year prior to the program (T-1) inflation was below 10 percent, real growth was greater than zero, and domestic financing was 1 percent of GDP or less. All three variables were derived from the MONA database in order to capture estimates about the past year’s performance at the time of program design. While the first two variables were readily available, domestic financing was estimated by deducting the external financing proxy (net aid) from the non-aid fiscal deficit.
31. The program year (T0) was defined as that calendar year with the greatest overlap with the actual program year from the program request or subsequent reviews. For example, if the actual program year with conditionality that was agreed upon in a review lasted from November 2003 to October 2004, 2004 was defined as the program year for that review.
32. MONA is not subjected to the same level of scrutiny as published databases of the Fund. It has a number of errors and inconsistencies. The most obvious errors—such as mixed-up currency denomination—were corrected manually. Others, such as discrepancies between reported actuals and obviously erroneous zeros, led to omission of the observation. To the extent possible, some omitted variables were reconstructed from other observations. Remaining errors were assumed to be unsystematic and, thus, without significant influence on the findings except for a reduction of their robustness.
33. To ensure consistency, programs and outcomes were compared within the MONA database. Since variable definitions in MONA I were very different from those in the World Economic Outlook or other databases, programmed values from MONA were not compared with estimates derived from other databases. Instead, data from the program request was compared to data from the latest available review for the respective years. This approach minimized errors stemming from differences in data definitions.
Table B8. Proxies for “Non-aid Fiscal Deficit” per GDP
MONA I MONA II - Fiscal balance including grants (percent of GDP) + Grants (percent of GDP) - Interest payments (percent of GDP)
(Total expenditures and net lending - Total revenues and grants + Grants - Interest payments ) /GDP
Table B9. Proxies for “Non-aid Current Account Deficit” per GDP
MONA I MONA II (-Current account, excluding off. transfers - Net interest payments ) / GDP)
(-Balance on current account + Official current transfers (net) - Interest payments ) / GDP
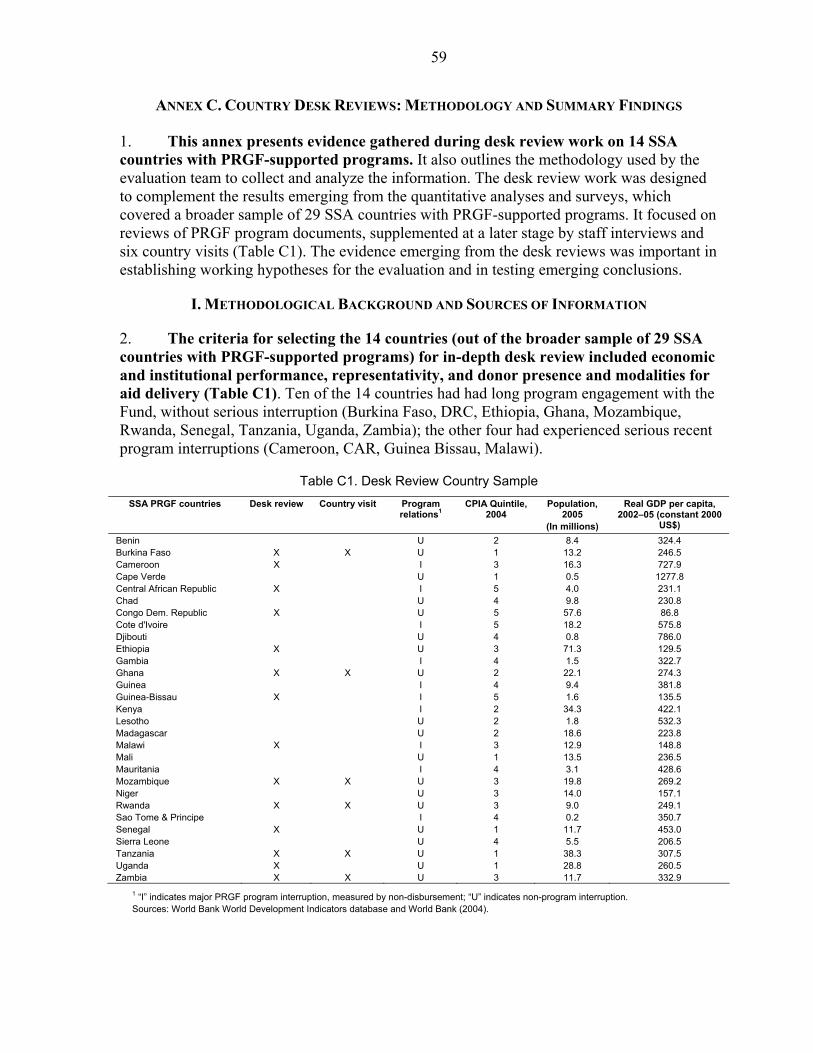
59
ANNEX C. COUNTRY DESK REVIEWS: METHODOLOGY AND SUMMARY FINDINGS
1. This annex presents evidence gathered during desk review work on 14 SSA countries with PRGF-supported programs. It also outlines the methodology used by the evaluation team to collect and analyze the information. The desk review work was designed to complement the results emerging from the quantitative analyses and surveys, which covered a broader sample of 29 SSA countries with PRGF-supported programs. It focused on reviews of PRGF program documents, supplemented at a later stage by staff interviews and six country visits (Table C1). The evidence emerging from the desk reviews was important in establishing working hypotheses for the evaluation and in testing emerging conclusions.
I. METHODOLOGICAL BACKGROUND AND SOURCES OF INFORMATION
2. The criteria for selecting the 14 countries (out of the broader sample of 29 SSA countries with PRGF-supported programs) for in-depth desk review included economic and institutional performance, representativity, and donor presence and modalities for aid delivery (Table C1). Ten of the 14 countries had had long program engagement with the Fund, without serious interruption (Burkina Faso, DRC, Ethiopia, Ghana, Mozambique, Rwanda, Senegal, Tanzania, Uganda, Zambia); the other four had experienced serious recent program interruptions (Cameroon, CAR, Guinea Bissau, Malawi).
Table C1. Desk Review Country Sample SSA PRGF countries Desk review Country visit Program
relations1 CPIA Quintile,
2004 Population,
2005 (In millions)
Real GDP per capita, 2002–05 (constant 2000
US$) Benin U 2 8.4 324.4 Burkina Faso X X U 1 13.2 246.5 Cameroon X I 3 16.3 727.9 Cape Verde U 1 0.5 1277.8 Central African Republic X I 5 4.0 231.1 Chad U 4 9.8 230.8 Congo Dem. Republic X U 5 57.6 86.8 Cote d'Ivoire I 5 18.2 575.8 Djibouti U 4 0.8 786.0 Ethiopia X U 3 71.3 129.5 Gambia I 4 1.5 322.7 Ghana X X U 2 22.1 274.3 Guinea I 4 9.4 381.8 Guinea-Bissau X I 5 1.6 135.5 Kenya I 2 34.3 422.1 Lesotho U 2 1.8 532.3 Madagascar U 2 18.6 223.8 Malawi X I 3 12.9 148.8 Mali U 1 13.5 236.5 Mauritania I 4 3.1 428.6 Mozambique X X U 3 19.8 269.2 Niger U 3 14.0 157.1 Rwanda X X U 3 9.0 249.1 Sao Tome & Principe I 4 0.2 350.7 Senegal X U 1 11.7 453.0 Sierra Leone U 4 5.5 206.5 Tanzania X X U 1 38.3 307.5 Uganda X U 1 28.8 260.5 Zambia X X U 3 11.7 332.9
1 “I” indicates major PRGF program interruption, measured by non-disbursement; “U” indicates non-program interruption. Sources: World Bank World Development Indicators database and World Bank (2004).
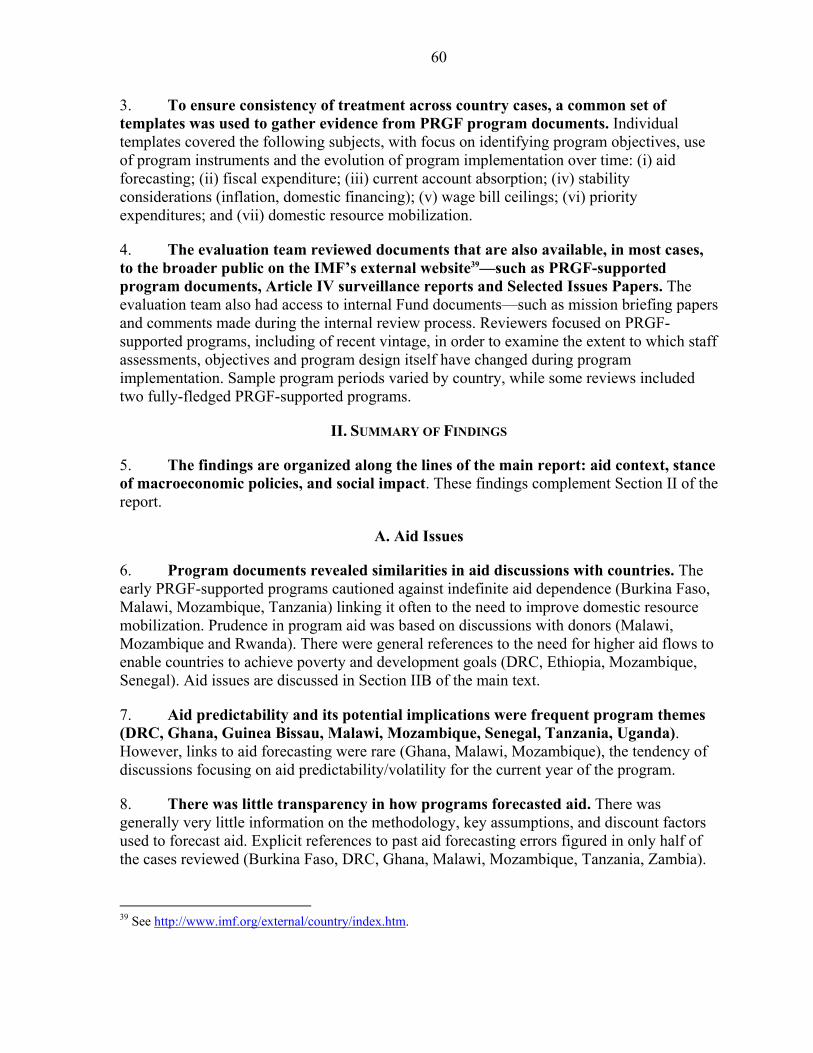
60
3. To ensure consistency of treatment across country cases, a common set of templates was used to gather evidence from PRGF program documents. Individual templates covered the following subjects, with focus on identifying program objectives, use of program instruments and the evolution of program implementation over time: (i) aid forecasting; (ii) fiscal expenditure; (iii) current account absorption; (iv) stability considerations (inflation, domestic financing); (v) wage bill ceilings; (vi) priority expenditures; and (vii) domestic resource mobilization.
4. The evaluation team reviewed documents that are also available, in most cases, to the broader public on the IMF’s external website39—such as PRGF-supported program documents, Article IV surveillance reports and Selected Issues Papers. The evaluation team also had access to internal Fund documents—such as mission briefing papers and comments made during the internal review process. Reviewers focused on PRGF-supported programs, including of recent vintage, in order to examine the extent to which staff assessments, objectives and program design itself have changed during program implementation. Sample program periods varied by country, while some reviews included two fully-fledged PRGF-supported programs.
II. SUMMARY OF FINDINGS
5. The findings are organized along the lines of the main report: aid context, stance of macroeconomic policies, and social impact. These findings complement Section II of the report.
A. Aid Issues
6. Program documents revealed similarities in aid discussions with countries. The early PRGF-supported programs cautioned against indefinite aid dependence (Burkina Faso, Malawi, Mozambique, Tanzania) linking it often to the need to improve domestic resource mobilization. Prudence in program aid was based on discussions with donors (Malawi, Mozambique and Rwanda). There were general references to the need for higher aid flows to enable countries to achieve poverty and development goals (DRC, Ethiopia, Mozambique, Senegal). Aid issues are discussed in Section IIB of the main text.
7. Aid predictability and its potential implications were frequent program themes (DRC, Ghana, Guinea Bissau, Malawi, Mozambique, Senegal, Tanzania, Uganda). However, links to aid forecasting were rare (Ghana, Malawi, Mozambique), the tendency of discussions focusing on aid predictability/volatility for the current year of the program.
8. There was little transparency in how programs forecasted aid. There was generally very little information on the methodology, key assumptions, and discount factors used to forecast aid. Explicit references to past aid forecasting errors figured in only half of the cases reviewed (Burkina Faso, DRC, Ghana, Malawi, Mozambique, Tanzania, Zambia).
39 See http://www.imf.org/external/country/index.htm.

61
Discussions of how these translated into current forecasts were not explicit or remained at a general level.
B. Current Account Issues
9. Current account absorption issues were addressed in connection with international reserves positions and Dutch Disease. These issues are discussed in Section IIA of the main text.
10. Discussions of the treatment of international reserves were prevalent in PRGF-supported programs (except for CFA-franc zone countries). Document reviews showed that for many countries in the sample, programs had, at some point in time, targeted higher NIRs in order to reduce vulnerabilities to external shocks—including terms of trade and aid volatility—but with differences in emphasis. For cases with low NIR positions (Cameroon, DRC, Ethiopia, Ghana, Malawi, Zambia) programs underlined the need to raise international reserves. For countries where NIRs were at an appropriate level, the focus was on maintaining reserves at such levels (Tanzania, Uganda). In a few cases, reserve accumulation was considered to have been excessive (as in Rwanda) and programs dwelt on the issues of excessive reserves accumulation and insufficient aid absorption.
11. Dutch Disease was not a major concern—although the exchange rate and issues of competitiveness were common themes in program discussions. Table C2 shows that there was some early program concern regarding exchange rate appreciation and possible Dutch Disease, which gave way to concerns about aid under-utilization in Tanzania; while in Rwanda, Dutch Disease concerns persisted, albeit with reduced implication for the programmed absorption of aid. Program discussions on exchange rate issues relied on indicators of competitiveness and real exchange rates (Ghana, Mozambique, Zambia), with competitiveness sometimes framed in terms of enhancing productivity, efficiency, and growth through structural reforms and infrastructure investment (Ethiopia, Zambia).
C. Fiscal Issues
12. The document review focused on issues of domestic financing of the fiscal deficit, domestic resource mobilization, the public sector wage bill, and fiscal governance. These issues are discussed in Section IIA and IIC of the main text.
13. Domestic financing was a key program parameter, linked to macro stability and private sector crowding-in/out. Most PRGFs limited domestic financing of the fiscal deficit. The size of the fiscal deficit or domestic financing was typically used as a performance criterion (Ethiopia, Ghana, Guinea Bissau, Malawi, Mozambique, Rwanda, Senegal, Tanzania, Uganda, Zambia). PRGF documents often justified this on (i) limited capacity to borrow domestically without significant negative impact on macro stability and growth —crowding out private sector investment and other spending (Cameroon, CAR, DRC, Ethiopia, Ghana, Guinea Bissau, Malawi, Mozambique, Rwanda, Tanzania, Uganda, and Zambia); (ii) domestic demand pressures (Ethiopia, Guinea Bissau, Mozambique); (iii) need to reduce domestic debt and large debt-service burdens (Ghana, Malawi, Rwanda, Senegal).

62
14. Revenue mobilization was a frequent program theme in PRGFs. Many programs had tax revenue targets, mostly in the form of indicative targets/benchmarks (Burkina Faso, Cameroon, CAR, Ghana, Guinea Bissau, Mozambique, Senegal, Tanzania, Uganda). However, discussions of the rationale for greater tax revenue mobilization have evolved over the years from the early “aid dependency” reduction motive (Burkina Faso, Malawi, Mozambique) to creating fiscal space for priority expenditures (CAR, Ghana, Mozambique, Uganda) and building adequate capacity for government operations (Tanzania, Uganda) in recent years.
15. Wage bill targets were common in PRGFs, stemming from fiscal concerns as well as macro stability considerations. Wage bill conditionality has featured widely—five of the 14 cases reviewed had PCs at some point in time, eight had indicative targets/benchmarks, and Malawi had both in various program reviews (Table C4). In some cases, repeated slippages led to strengthened conditionality (from indicative targets to PCs in Malawi), while in others with good performance, targets were downgraded (from PC to benchmark in CAR). In two cases, the wage bill target was eliminated altogether (Mozambique in 2006 in the context of better-than-expected fiscal performance, and Tanzania in 2003 with the focus having shifted to civil service pay reform). In terms of rationale, documents revealed that program targets on the wage bill stemmed from macro stability concerns, in most cases with reference to large wage bill increases in the immediate past (Ethiopia, Guinea Bissau, Ghana, Malawi, Mozambique, Zambia). Additional motivation included the need to free up fiscal space for other expenditures, including PRE (CAR, Mozambique). Wage bill ceilings were also linked frequently to discussions of civil service reforms (DRC, Ghana, Mozambique, Senegal, Tanzania, Uganda). The latter was especially important in Mozambique and Tanzania, in connection with the aforementioned elimination of the wage bill targets.
16. Fiscal governance and transparency were important pillars of PRGFs. Discussions of public expenditure management and financial accountability (PEFA) issues centered around fiscal governance and transparency issues, including budgetary frameworks, budget execution, monitoring and reporting, and financial management and information systems. The use of structural conditionality in PEFA was extensive (as in Cameroon, CAR, DRC, Ghana, Malawi, Mozambique, Rwanda, Tanzania, Uganda, Zambia), covering expenditure execution, monitoring and control (including on commitments), coverage and timing of budget reporting, information systems (including on public sector payrolls), and in some instances more specific areas—public procurement, auditing, code of ethics in civil service. The program focus on PEFA has been complemented by extensive technical assistance from the Fund, notably in public expenditure management and financial accountability (Burkina Faso, DRC, Ghana, Mozambique, Rwanda, Senegal, Tanzania, Uganda, Zambia), including budget preparation and execution, expenditure monitoring and control, and information systems (including for tracking PRE).40
40 Recent evaluations of the effectiveness of Fund Technical Assistance in the PEFA area indicate a mixed picture, mirroring the performance of IMF-supported programs (IMF (2004a, 2005i)). Countries further ahead in the reform process (for example, Cameroon, Uganda, Tanzania, Rwanda) showed greater progress in the PEFA area than those where the reform pace had been slower (for example, Cote d’Ivoire, CAR, Malawi,
(continued)

63
D. Social Impact
17. With respect to Priority Poverty-Reducing Expenditures (PRE), the PRGF-supported programs’ focus was generally on tracking activities, and less so on program adjusters or conditionality. Documents reviewed showed that direct program targets on priority expenditures (PCs in Rwanda and Uganda, indicative targets in Ghana and Malawi) were infrequent (Table C5). But programs did track priority expenditures, with tables dedicated to this in staff reports. In some instances, documents described in general terms recent developments with priority expenditures and government plans going forward (for example Mozambique, Zambia). As discussed in Section IIC of the main text, program adjusters for incremental aid were linked to priority expenditures in eight of the 14 cases reviewed. But, except in a few instances (DRC, Guinea Bissau, Uganda) where the pressing nature of social needs and protecting government commitments were noted, there was little explicit rationale for linking adjusters to priority expenditures.
18. Wage bill ceilings were often set without consideration of the impact on expenditures in priority areas. In only a few cases (CAR, Guinea Bissau, Mozambique) did documents acknowledge explicitly that program design took priority sectors into account while setting wage bill ceilings (and not throughout the evaluation period but only more recently, as in the case of Mozambique). Only in the case of Malawi were adjusters included to allow additional aid to be used to increase wages in priority areas. In Zambia, the PRGF was adjusted in the context of the program review to accommodate additional employment in priority sectors, when the wage bill ceiling proved binding.
19. PSIA results were frequently reported but rarely informed PRGF programs. Since the creation of the PSIA group in FAD in 2004, the Fund has conducted nine assessments (Table C6); six were focused on subsidies (electricity, petrol, agriculture, fertilizers) and the rest on other macro areas (taxation, devaluation, external shocks). The results from PSIAs were generally presented in program documents (except in Mali, Malawi), but were rarely part of appraisals (except for Burkina Faso, Djibouti). Program documents indicated no specific countervailing measures linked to the PSIAs, in some cases because the recommendations were not adopted (Malawi, Uganda). In two instances, programs noted that the resulting fiscal space would be used by authorities to increase priority expenditures (Ghana, Mali).
E. Other Issues
20. Bank/Fund collaboration was most frequently noted on PEFA and financial sector work. Program documents reported frequently, but not always, on the division of labor between the Bank and the Fund, specifying the lead institution as well as areas requiring joint work (Burkina Faso, Ghana, Mozambique, Rwanda, Senegal, Tanzania, Zambia). In general, PRGF programs put macro issues within the Fund’s core areas of
Zambia). On the effectiveness of Technical Assistance delivery in PEFA, a recent IEO evaluation (IEO (2005b)) noted that longer-term, resident technical assistance was more effective than shorter-term interventions, due to greater access to expertise and training possibilities.

64
responsibility and sectoral and social issues within those of the World Bank. As noted above, the Fund and the World Bank shared responsibilities for PEFA and financial sector work. More specific delineations of inputs into the collaborative effort were sometimes indicated. For example, in some programs the Fund would focus on financial management information systems or medium term expenditure frameworks and the Bank on other areas of PEFA (Mozambique, Zambia). With respect to alternative scenarios, and with the exception of Ethiopia, program documents were not clear on the role collaboration with the Bank played.
21. Private sector development and its contribution to economic development and growth were frequent themes in PRGF-supported programs. It was discussed in relation to removing obstacles to private sector growth by improving the business climate, including the regulatory and judicial environment, and basic infrastructure. But programs left specific work to the World Bank. PRGFs rarely included structural conditionality in these areas and the Fund did not provide technical assistance. The main channel through which the Fund addressed private sector development issues in program design was in the context of crowding-out considerations when setting fiscal targets (as discussed above), and in a few instances through structural conditionality in the financial sector (Mozambique, Tanzania, Zambia). The latter especially related to the regulatory and supervisory infrastructure—including for microfinance. The Fund has also provided significant technical assistance for financial sector issues, including through FSAPs (as in Ghana, Rwanda, Tanzania, Uganda, Zambia).

65
Table C2. Spending and Absorption Issues1
Spending Case Micro Macro
Dutch Disease
Burkina Faso (2003)
General absorptive capacity concerns. Rather liberal stance throughout program.
Not an issue.
Cameroon (2000)
Weak spending capacity limited HIPC-relating spending. FAD also expressed concerns over capacity to absorb large spending increase in investment at program request.
Program aimed at consolidating fiscal adjustment achieved in previous program.
No overvaluation of real effective exchange rate. Acknowledged that Cameroon maintained large competitiveness gains that resulted from 1994 devaluation of CFA.
Central African Republic (1998)
Only micro issues are mentioned. Weak administrative capacity of government is named as risk to program but is not explicitly related to spending limits.
DRC (2002)
No specific discussion of limitations to spending aid.
Stabilization, focus
Ethiopia (2001)
Program aims at limiting inflation to low single digits while rebuilding international reserves.
Although authorities argued for weaker exchange rate, in face of increasing aid flows, staff noted that case was not compelling.
Ghana (1999, 2003)
Absorption issues not a significant concern.
Fiscal consolidation and containing domestic debt.
No reference.
Guinea-Bissau (2000)
Weak administrative capacity of government mentioned but not explicitly linked to spending limits.
Malawi (2000)
Program allowed higher expenditure if foreign financing is available (PDR showed concerns over capacity to implement an expenditure increase in PRSP priority areas).
Program aimed at fiscal consolidation throughout entire program period.
No explicit concerns over appreciation pressures.
Mozambique (1999, 2004)
Absorptive capacity limitations called for saving exceptional/peak aid flows (1999) and posed challenges for achieving MDGs (2004).
Overall program context in 1999 and 2004 one of maintaining macro stability and fiscal consolidation. By 4th review of 2004, broad program context highlighted better-than-programmed fiscal situation.
No overvaluation of exchange rate (according to various measures and export volumes).
Rwanda (2002)
Continuous concerns about expenditure transparency and allocation of resources towards military spending led to program that was inflexible regarding spending of unanticipated resources without prior discussion with IMF.
Dutch Disease concerns discussed in 2002 program; also in fourth review (2005), along with under-absorption concerns.
Senegal (1998, 2003)
Capacity constraints in Finance and spending ministries, in spite of ambitious spending plans.
Fiscal consolidation program objectives.
Not a concern at prevailing aid level, analysis needed of potential Dutch Disease effects of higher aid (2003 program).
Tanzania (2000, 2003)
Budget system inefficient—i.e., unable to absorb all aid resources available. Need to enhance fiscal transparency.
Initial Dutch Disease concerns expressed in 2000 program, but no longer a concern by 2003 program.
Uganda (1997, 2002)
Limited expenditure efficiency—capacity and governance issues in social spending, notably universal primary education.
Program objectives maintain low inflation (5 percent) and comfortable level of international reserves.
During first two years of program, aid inflows (and high level of remittances) led to currency appreciation (1997). Liquidity injected into economy by donor-funded poverty reduction spending posed threat to price stability (2002).
Zambia (2004)
Need to strengthen budgetary processes and public expenditure management.
Centerpiece of policy framework is strong, front-loaded fiscal adjustment to halt unsustainable rising of domestic debt and interest payments, and increase poverty-reducing spending.
Appreciation pressures not yet a concern.
1 The base for the evidence presented in the table is PRGF documentation, except for additional information as indicated including internal review process comments. The year indicated in parentheses identifies the program (and subsequent reviews) analyzed. Specific review information is indicated when appropriate.

66
Table C3. Evidence on Adjusters1 Case Aid Shortfall Financing Rationale Aid Windfall Spend/Absorb Rationale
Burkina Faso (1999, 2003)
Limited financing. No explicit rationale. Full spending was replaced by full saving in 2001. Full saving was replaced by limited spending on social sectors in 2005
No explicit rationale.
Cameroon (2000)
Domestic financing for 50 percent of shortfall.
No explicit rationale. Reduce domestic financing for full amount of excess.
For crowding-in.
Central African Republic (1998)
Limited financing. No explicit rationale. Equivalent amount deducted from government borrowing. Adjusters in 2004 and 2006 EPCA allowed use for priority spending/reduction of debt—no proportions specified.
No explicit rationale.
DRC (2002)
No financing until 3rd review, which stated that 50 percent of any foreign financing shortfall could be financed. By 5th Review, full financing was allowed.
No explicit rationale. Excess foreign financing to be used to finance poverty reduction expenditure. Subsequent reviews added need to use excess external assistance to reduce net banking system credit to the government.
Government’s ambition to reach HIPC completion point was a factor in targeting pro-poor spending. Subsequent focus on reducing banking system credit to government was to ensure success of stabilization effort.
Ethiopia (2001)
50 percent financing up to $20 million.
Restrain demand pressures. Full saving for any amounts exceeding those programmed. By 4th review limited use for poverty reduction expenditures.
Build reserves—which staff noted were precarious, given needs and shocks.
Ghana (1999, 2003)
Full financing (1999), from 3rd review, limited financing. Limited financing continued in 2003 program but from 3rd review, no financing allowed.
No explicit rationale. Equivalent amount deducted from limit on government borrowing. From 3rd review of 2003 PRGF, full use.
No explicit rationale.
Guinea-Bissau (2000)
Financing of 50 percent. No explicit rationale. 50 percent can be used for priority spending on social and infrastructure areas.
Pressing nature of social needs.
Malawi (2000)
Initially a maximum of $50 million financing but reduced to zero at the time of Emergency Assistance (2002) and 1st review (2003).
Need to reduce domestic debt to lower interest rates. Strengthened over time in response to repeated slippages.
Initially a maximum of $50 million could be used but raised to unlimited.
Need to reduce domestic debt.
Mozambique (2004)
Initially no domestic financing. By 4th review, partial financing.
Maintain pace of fiscal consolidation and create room for private sector. Context of change in adjusters (4th review) was one of better-than-expected fiscal performance, with aid decline no longer perceived a risk to the program.
Initially partial use (on capital expenditures) and absorption. By 4th review, full use (on priority spending) and absorption.
Justified initially on high yearly volatility of aid.
Rwanda (2002)
Initially no domestic financing, then changed to limited financing in 2003.
No explicit rationale. Full saving. Concern that resources would be diverted to military spending.
Senegal (1998, 2003)
Limited financing to CFAF 20 billion.
Level of adjustment had to be consistent with regional protocol on monetary policy and fixed exchange rate.
No use of excess funds allowed. Level of adjustment had to be consistent with regional protocol on monetary policy and fixed exchange rate.
Tanzania (2000, 2003)
Initially limited (to $60 million). By 3rd review, (2000), full financing allowed and retained in following program.
Initially to safeguard international reserves—relaxed as reserves increased to give government more flexibility in making financing/spending decisions.
Initially no use of excess foreign financing allowed. By 4th review (2000), full use allowed which continued in 2003 program.
Initially to build international reserves, but use of excess resources later left to government discretion.
Uganda (1997, 2002)
Full financing allowed (with exception of R2 in first PRGF).
Enable government to meet commitments, notably those of Poverty Action Fund (PAF). Net credit to government ceiling would be lowered for any unspent PAF commitments.
Full saving for any excess, throughout programs.
Enable country to meet debt payments, especially arrears.
Zambia (2004)
Partial financing (initially $14 million increased to $20 million)
Full saving of windfalls, except to reduce domestic debt.
1 The base for the evidence presented in the table is PRGF documentation, except for additional information as indicated including internal review process comments. The year indicated in parentheses identifies the program (and subsequent reviews) analyzed. Specific review information is indicated when appropriate.

67
Table C4. Wage Bill Ceilings1 Country Instrument2 Rationale Consideration of impact on
priority sectors in design Adjustment in context of program review
Burkina Faso (2003)
Indicative target. Contain medium-term pressures on expenditures.
Cameroon (2000)
No formal conditionality. But program underlined importance of containing wage escalation.
Ensure targeted non-interest expenditure and aimed at containing large wage increase at beginning of the program.
Stronger program wording reflecting repeated fiscal slippages.
Central African Republic (1998)
PC. In addition, civil service positions (including military and security forces) were not to grow (PA).
Ceiling is part of an effort to ensure that adequate resources are available for social spending and critical infrastructure investment.
Ceiling allowed for recruitment of 880 new personnel in priority sectors of education and health.
PC was turned into a benchmark for the 2nd annual program, with actual wage and salaries in 1998 sectors programmed.
DRC (2002)
Ceiling on wage arrears for civil service (kept at zero).
Raise morale in civil service. Not explicit—but implication on efficiency in public sector and service delivery.
Ethiopia (2001)
Indicative targets. Limit size of wage bill. Program concerns with wage bill eased as issues of macroeconomic management took hold.
Ghana (1999, 2003)
In 1999, no target. In 2003, a PA was used in 2nd review, and a PC was used from 3rd review onwards. In addition, two structural PCs were introduced relating to civil service reform.
Past increases in wage bill that contributed to non-completion of 5th review of 1999 program.
Guinea-Bissau (2000)
Performance indicator. Ceiling is part of fiscal consolidation, reflecting demobilization of troops.
Ceiling allowed for an increase in number of civil servants.
Malawi (2000)
Benchmark (1st review). Need tight stance in order to restore fiscal discipline. Also aimed at containing large wage increase at beginning of program.
In 2005, wage bill for priority sector protected by ceiling adjuster (linked to additional aid for health SWAp).
Stronger form of conditionality toward end of program in response to repeated fiscal slippages.
Mozambique (1999, 2004)
In 1999 no target, in 2004 indicative target. Target abandoned in 4th review.
In 2004, in the context of fiscal consolidation and past large wage increases and need of public sector reform (ghost workers). Target abandoned in 4th review (2006) in the context of better than expected fiscal position.
Target set with explicit reference to greater employment in health and education.
Rwanda (2002)
None.
Senegal (2003)
PC Contain impact on expenditure. Not explicit. But program anticipated that improvements in wage reform would have positive impact on social service delivery.
No change. Monitoring included monthly reporting to Fund on changes in wage bill.
Tanzania (2000, 2003)
Indicative targets. Contain expenditure on wages, rationalize wage bill.
Compensation and wage incentives identified as key for public service delivery.
Uganda (2002)
No wage ceilings.
Zambia (2004)
Benchmark Limit wage increases of recent past.
Program modified in the course of first review—in coordination with additional donor assistance—to allow for additional hiring in priority sectors.
1 The base for the evidence presented in the table is PRGF documentation, except for additional information as indicated including internal review process comments. The year indicated in parentheses identifies the program (and subsequent reviews) analyzed. Specific review information is indicated when appropriate. 2 Prior Action (PA), Performance criteria (PC).

68
Table C5. Priority Poverty-Reducing Expenditures1 Country Instrument Aid Shortfall Adjuster:
Link to Priority Expenditure
Aid Windfalls Adjuster: Link to Priority Expenditure
Burkina Faso (2003)
No conditionality. No link to priority expenditure
Adjuster allowing limited spending of windfalls only on poverty reduction and special programs as defined by HIPC/PRSP process.
Cameroon (2000)
No conditionality.
Central African Republic (1998)
No conditionality. No link to priority expenditure.
No link to priority expenditure in 1998 program. The adjusters on windfalls in 2004 and 2006 EPCA allow for priority public spending/reduction of domestic arrears/reduction of domestic and/or external debt—but no proportions specified.
DRC (2002)
Ceiling on net credit to government raised to meet programmed financing of poverty reduction.
Excess to be used for poverty reduction spending.
Ethiopia (2001)
No link to priority expenditures
Up to $50 million of excess foreign financing (including HIPC relief) would be targeted at poverty reduction, and a similar amount on “special programs (fourth review).
Ghana (1999, 2003)
Indicative target.
Guinea-Bissau (2000)
No conditionality. No link to priority expenditure.
Given pressing nature of social needs, adjusters were to partially allow for increased directed spending with 50 percent of resources to be spent on social and infrastructure projects identified in collaboration with World Bank.
Malawi (2000, 2005)
Indicative target on pro-poor expenditure, 1st review, 2003.
No adjusters on indicative targets on pro-poor expenditure.
No adjusters on indicative targets on pro-poor expenditure.
Mozambique (2004)
No program targets on PRSP expenditures, but tracking of developments and government plans.
In 4th review, partial financing of shortfalls. No link to priority expenditure.
Limited accommodation for additional capital outlays financed by budgetary grants. By 4th review, full accommodation to be used in priority expenditures identified in budget.
Rwanda (2002)
Performance criteria on broadly defined “priority spending” (mainly social and infrastructure) and “exceptional expenditures” (mainly post-genocide related expenditures).
Senegal (2003)
Indicative targets on programmed spending of HIPC debt relief—but sectors of focus not specified.
Ceiling on net cumulative change on credit to government to be raised for aid shortfalls on HIPC-related (i.e., priority) expenditure from programmed levels.
Ceiling to be lowered from higher HIPC-related (i.e., priority) expenditure than programmed levels.
Tanzania (2003)
No conditionality. No link to priority expenditure.
No adjuster on excess financing—use left to government’s direction.
Uganda (2002)
A PC on minimum expenditures under Poverty Action Fund (including universal primary education). An adjuster indicated that any amounts falling below those programmed would lead to lowering of the ceiling on net government credit.
No link to priority expenditure.
Ceiling on net credit to the government was to be lowered (raised) by shortfall (excess) expenditure on areas in Poverty Action Fund—universal education, primary healthcare, access to clean water, etc.
Zambia (2004)
No program target.
1 The base for the evidence presented in the table is PRGF documentation, except for additional information as indicated including internal review process comments. The year indicated in parentheses identifies the program (and subsequent reviews) analyzed. Specific review information is indicated when appropriate. 2 PC=Performance criteria.

69
Table C6. Poverty and Social Impact Analyses conducted by FAD1 Country (PSIA completion date)
Sector/Topic Discussion in PRGF documents Countervailing measures
Burkina Faso2 (2006)
Electricity tariff reform
PSIA recommendation on electricity tariffs reflected in 6th review of PRGF in 2006 (recommendation was to raise tariffs because of marginal impact on the poor).
No explicit countervailing measures in PRGF for increase in electricity tariffs. PSIA report had argued that few poor households were connected to electricity grid.
Djibouti3 (2005)
Devaluation PSIA finding that devaluation would be disruptive because of import dependence, featured prominently in Staff Report of 2005 Article IV and staff monitored program. Board discussions also alluded to PSIA findings.
No devaluation suggested by the staff-monitored program. Concerned over competitiveness, the staff-monitored program suggested lowering government wages—taking into account poorest households.
Ghana4 (2005)
Petroleum pricing PSIA was done before a number of petrol pricing reforms undertaken in February 2005, notably implementation of a new automatic price adjustment mechanism (see Staff Report 2005 Article IV).
The “fiscal space” created, inter alia, by removal of petroleum price subsidies was to be spent on health and education and infrastructure in rural areas (MEFP in Staff Report for 2005 Article IV).
Madagascar5 (2006)
Rice subsidies N/A
Malawi6 (2006)
Fertilizer subsidies PSIA pricing reforms not explicitly reflected in August 2006 PRGF review. Reforms put off by drought and food crisis.
PSIA report had no policy impact on fertilizer subsidy, and so no mitigation in PRGF required.
Mali7 (2006)
Petroleum pricing The 4th Review of PRGF (June 2006) mentions that “external” studies were crucial in determining petroleum pricing mechanism.
No special measures for mitigation considered in PRGF—but authorities indicated that the resulting fiscal space was to be used to develop infrastructure and transport networks to address poverty.
Mali8 (2005)
Impact of external shocks and macro responses on poverty
No explicit reference to PSIA exercise in subsequent staff reports, but general reference to strategies for poverty reduction (see 4th review, June 2006).
Senegal9
(2005) Reform of groundnut marketing
Groundnut sector reform was an ongoing process before PSIA. But groundnut parastatal was privatized after PSIA (had failed before), although there was little change in edible oil pricing policies (private company still a protected monopoly). This was discussed in 3rd and 4th reviews (December 2005).
No countervailing measures in PRGF (PSIA measures not implemented).
Uganda10
(2005) VAT PSIA analysis used in staff report of May 2005
to suggest two alternative means of raising revenue with minimum negative impact on poor: change VAT rate (from 17 to 18 percent) and increased excise taxes (on petrol).
No countervailing measures in PRGF as tax changes were not adopted by government.
1 The base for the evidence presented in the table is PRGF documentation, except for additional information as indicated including internal review process comments. The year indicated in parentheses identifies the program (and subsequent reviews) analyzed. Specific review information is indicated when appropriate. 2 See Newhouse (2006). 3 See Newhouse and Simone (2005). 4 See Coady and Newhouse (2005). 5 See Coady (2006). 6 See Gillingham and Mishra (2006). 7 See Kpodar (2006). 8 See Simone (2005). 9 See Gillingham and Newhouse (2005). 10 See El-Said and Gillingham (2005).
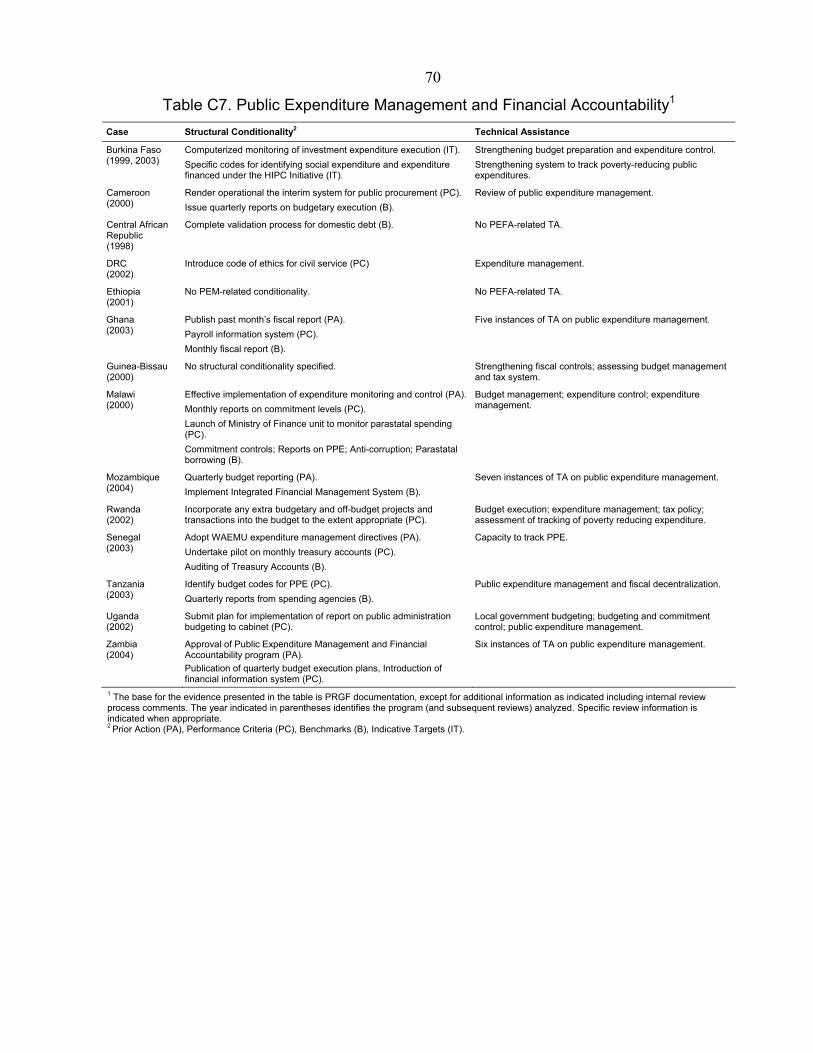
70
Table C7. Public Expenditure Management and Financial Accountability1
Case Structural Conditionality2 Technical Assistance
Burkina Faso (1999, 2003)
Computerized monitoring of investment expenditure execution (IT). Specific codes for identifying social expenditure and expenditure financed under the HIPC Initiative (IT).
Strengthening budget preparation and expenditure control. Strengthening system to track poverty-reducing public expenditures.
Cameroon (2000)
Render operational the interim system for public procurement (PC). Issue quarterly reports on budgetary execution (B).
Review of public expenditure management.
Central African Republic (1998)
Complete validation process for domestic debt (B). No PEFA-related TA.
DRC (2002)
Introduce code of ethics for civil service (PC) Expenditure management.
Ethiopia (2001)
No PEM-related conditionality. No PEFA-related TA.
Ghana (2003)
Publish past month’s fiscal report (PA). Payroll information system (PC). Monthly fiscal report (B).
Five instances of TA on public expenditure management.
Guinea-Bissau (2000)
No structural conditionality specified. Strengthening fiscal controls; assessing budget management and tax system.
Malawi (2000)
Effective implementation of expenditure monitoring and control (PA). Monthly reports on commitment levels (PC). Launch of Ministry of Finance unit to monitor parastatal spending (PC). Commitment controls; Reports on PPE; Anti-corruption; Parastatal borrowing (B).
Budget management; expenditure control; expenditure management.
Mozambique (2004)
Quarterly budget reporting (PA). Implement Integrated Financial Management System (B).
Seven instances of TA on public expenditure management.
Rwanda (2002)
Incorporate any extra budgetary and off-budget projects and transactions into the budget to the extent appropriate (PC).
Budget execution; expenditure management; tax policy; assessment of tracking of poverty reducing expenditure.
Senegal (2003)
Adopt WAEMU expenditure management directives (PA). Undertake pilot on monthly treasury accounts (PC). Auditing of Treasury Accounts (B).
Capacity to track PPE.
Tanzania (2003)
Identify budget codes for PPE (PC). Quarterly reports from spending agencies (B).
Public expenditure management and fiscal decentralization.
Uganda (2002)
Submit plan for implementation of report on public administration budgeting to cabinet (PC).
Local government budgeting; budgeting and commitment control; public expenditure management.
Zambia (2004)
Approval of Public Expenditure Management and Financial Accountability program (PA). Publication of quarterly budget execution plans, Introduction of financial information system (PC).
Six instances of TA on public expenditure management.
1 The base for the evidence presented in the table is PRGF documentation, except for additional information as indicated including internal review process comments. The year indicated in parentheses identifies the program (and subsequent reviews) analyzed. Specific review information is indicated when appropriate. 2 Prior Action (PA), Performance Criteria (PC), Benchmarks (B), Indicative Targets (IT).

71
ANNEX D: COUNTRY CASE STUDIES: PROGRAM CHANGE IN MAJOR AID RECIPIENTS
1. This annex describes the context and evolution of program design in five major aid recipients: Burkina Faso, Ghana, Mozambique, Rwanda, and Tanzania.41 It complements the desk review analysis set out in Annex C. It begins with a description of a framework for analyzing the evolution of program design in PRGFs and concludes with specific examples of program change from each of the five case study countries.
I. FRAMEWORK
2. This section highlights three sources of change in program design. The changes all took place against the backdrop of improving macroeconomic policies and outcomes.
3. The first is a relaxation of fiscal policy in Tanzania and Rwanda to allow greater use of available aid. In both countries, the relaxation occurred at the same time as improving macroeconomic conditions and in the context of discussions with donors and the authorities. The programmed fiscal deficit increased both as a share of GDP (Chart D1) and as a share of total expected aid (Chart D2).
Chart D1. Programmed Fiscal Deficit as Percent of GDP
Rwanda
Tanzania
0
5
10
15
2000 2001 2002 2003 2004 2005 2006 2007
(In p
erce
nt o
f GD
P)
Notes: Fiscal Deficit defined as the difference between expenditure (excluding interest payments) and revenue (excluding grants). Dates indicate year for which program targets apply.
Chart D2. Programmed Ratio of Fiscal Deficit to Aid
Rwanda
Tanzania
0.0
0.2
0.4
0.6
0.8
1.0
1.2
2000 2001 2002 2003 2004 2005 2006 2007
(Fis
cal D
efic
it/Ai
d)
Notes: Fiscal Deficit defined as the difference between expenditure (excluding interest payments) and revenue (excluding grants). Aid defined as the sum of grants, net foreign financing, financing gap and the net change in external arrears, minus external interest payments. Dates indicate year for which program targets apply.
4. The second is a change in the medium-term forecasting of aid and the fiscal deficit.42 As discussed in the main text, throughout the early PRGF period the IMF generally forecast the tapering of aid beyond the program year, in line with experience with actual aid flows. But this has begun to change, with recent medium-term aid forecasts catching up with ongoing changes in the aid environment. Chart D3 shows the difference between the medium-term forecast of aid (T+1) and the aid projection for the program year (T0). As seen, programs forecast a decline in aid flows over the medium term before 2005, but started to project less or no tapering by 2006. At the same time programs have also begun to project
41 Each of the five case studies included a country visit by the evaluation team. 42 This aspect of change in program design was not observed in other desk review cases, including those with more pressing macro performance issues (e.g., CAR, Cameroon and Zambia) and in mature cases where programs had already been forecasting more stable aid and spending (e.g., Senegal and Uganda).

72
less tapering of the fiscal deficit. Chart D4 shows the trend for the medium-term forecast of the fiscal deficit. Before 2005 programs generally forecast a medium-term tightening of the fiscal deficit compared to the program year, but by 2006 they assume less tapering beyond the program year.43
Chart D3. Change in Medium Term Aid Forecasting Over Program Year
-3.0-2.5-2.0-1.5-1.0-0.50.00.51.01.5
2003 2004 2005 2006
Aid/
GD
P in
(T+1
) - (T
0)
Rw anda Tanzania Mozambique Burkina Faso Ghana
Note: Difference between aid forecasts (as percent of GDP) in T+1 and T0 (the program year).
Chart D4. Change in Medium Term Fiscal Deficit Over Program Year
-2.5
-2.0
-1.5
-1.0
-0.5
0.0
0.5
1.0
2003 2004 2005 2006
Fisc
al d
efic
it in
(T+1
) - (T
0)
Rw anda Tanzania Mozambique Burkina Faso Ghana
Note: Difference between forecasts for fiscal deficit (as percent of GDP) in T+1 and T0 (the program year).
5. The third is a change in program adjusters to give countries more flexibility in responding to unanticipated changes in aid flows. Chart D5 shows the programmed reaction, through program target adjusters, to shortfalls in aid before and after changes in program design.44 Before the changes, three out of the five programs did not permit domestic financing of aid shortfalls. After the changes, all programs but Ghana’s provided flexibility to finance shortfalls, at least partially. Chart D5 also presents adjusters for aid windfalls, and again shows greater flexibility in more recent programs. Before the programs changed, none of the five countries could fully spend aid windfalls before the next review. But after the changes, three of the five countries could fully spend aid windfalls—with Rwanda the only country that could not spend any.
Chart D5. Program Adjusters for Spending of Unanticipated Shortfalls/Windfalls of Aid Financing of Aid Shortfalls Spending of Aid Windfalls
Before RWA MOZ BFA GHA TZA
RWA BFA GHA MOZ TZA
After GHA RWA MOZ BFA TZA
RWA BFA GHA MOZ TZA
No domestic financing of shortfalls
Limited domestic financing Full domestic financing
No spending of windfalls Limited spending Full spending
Year of change: Tanzania (TZA): 2001/02; Rwanda (RWA): 2003; Burkina Faso (BFA): 2005; Ghana (GHA): 2005; Mozambique (MOZ): 2006
43 This change in both charts is reflected by a forecast difference between T+1 and T0 that begins negative and moves toward zero. 44 The change in program design did not occur at the same time in all five countries. The year of program change for each country is listed at the bottom of Chart D5.

73
II. COUNTRY EVIDENCE
6. This section gives specific examples of how program design has changed in each of the five case-study countries. (For each case, the year of program design change is in parentheses.)
A. Tanzania (2000, 2005)
7. Prior to the 2000 PRGF, Tanzania’s programmed fiscal policy stance assumed a substantial reduction of net domestic debt of the government, which meant that a significant share of available aid could not be spent. Programs justified this fiscal stance as necessary to correct the fiscal slippages incurred at the end of the previous ESAF program and to build-up reserves, and out of concerns about macro stability and Dutch Disease. The continued compression of public expenditures, even after a degree of macro stability had been achieved in 2000–01, triggered a debate between the Fund and the authorities, donors, and civil society.45 As discussed in a previous IEO evaluation of the PRSP/PRGF process, these discussions took place in the context of the public expenditure reviews (PER) initiated by the World Bank and were informed by donor-financed studies done by an outside academic.46
8. In the context of more predictable aid and sustained macro stability, PRGF programs began to relax the fiscal policy stance in 2001, allowing for greater programmed expenditure of projected aid.47 This is illustrated in Chart D2. By the end of 2001, IMF internal reviews were calling for more ambitious government expenditure, and programs started subsequently to project less tapering of expenditures beyond the first program year as well. Although the discussions with donors and the authorities that preceded the changes in Fund stance did not feature prominently in mission briefs or the internal review process, internal correspondence between IMF and World Bank staff show that the debate on fiscal policy was very active.
9. Program adjusters were also changed in 2001 to allow for the full use of aid windfalls and the full financing of aid shortfalls (Chart D5). Prior to this change, Tanzania had been unable to finance any aid shortfalls and allowed to partially spend windfalls.
10. PRGF programs started to forecast less tapering of aid over the medium term in the third PRGF review of 2005 (Chart D3). This change was underpinned by Tanzania’s strong performance in core structural areas in 2003 and 2004, the finalization of the second generation PRSP in 2005, and the continued stability of aid inflows between 2003 and 2004.
45 See IEO (2004). 46 Bevan (2000, 2001). 47 The 2006 EPA for Tanzania was silent on the discussions about fiscal stance in the early programs and subsequent program design changes. (See IMF 2006c). It noted that the design of programs had been broadly appropriate: Programs were appropriately anchored on strengthening fiscal performance, sufficiently flexible to accommodate large aid inflows and adapted to facilitate greater absorption.
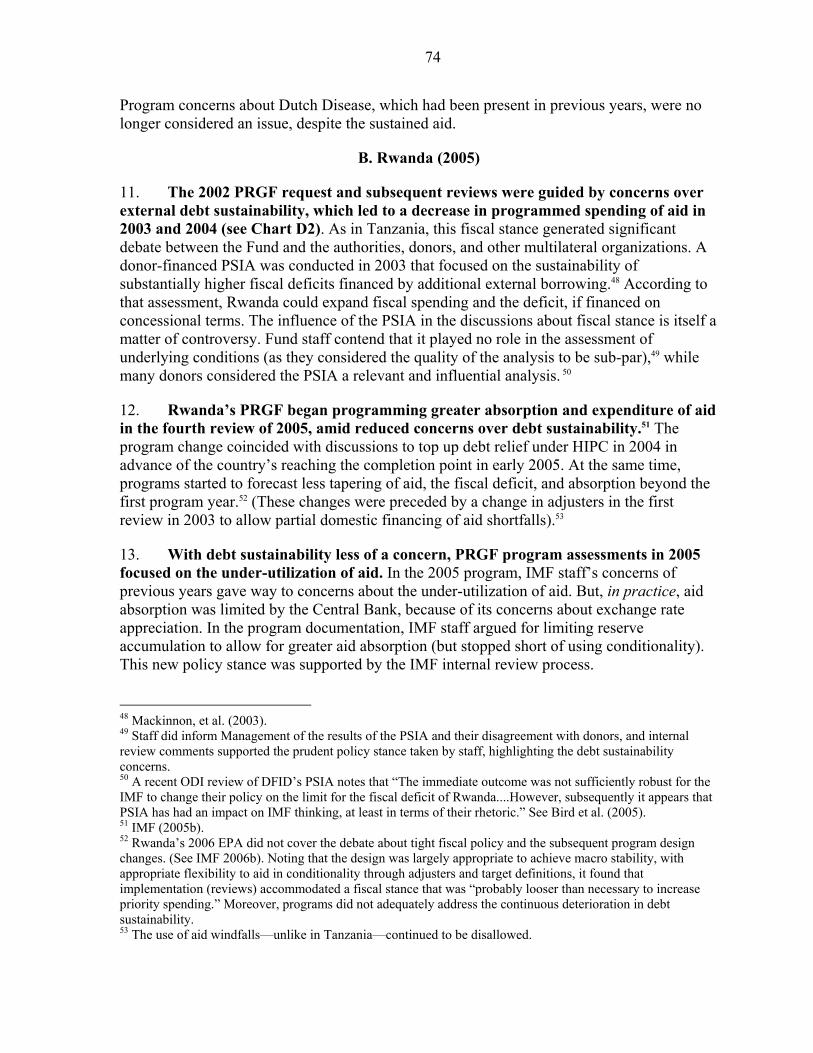
74
Program concerns about Dutch Disease, which had been present in previous years, were no longer considered an issue, despite the sustained aid.
B. Rwanda (2005)
11. The 2002 PRGF request and subsequent reviews were guided by concerns over external debt sustainability, which led to a decrease in programmed spending of aid in 2003 and 2004 (see Chart D2). As in Tanzania, this fiscal stance generated significant debate between the Fund and the authorities, donors, and other multilateral organizations. A donor-financed PSIA was conducted in 2003 that focused on the sustainability of substantially higher fiscal deficits financed by additional external borrowing.48 According to that assessment, Rwanda could expand fiscal spending and the deficit, if financed on concessional terms. The influence of the PSIA in the discussions about fiscal stance is itself a matter of controversy. Fund staff contend that it played no role in the assessment of underlying conditions (as they considered the quality of the analysis to be sub-par),49 while many donors considered the PSIA a relevant and influential analysis. 50
12. Rwanda’s PRGF began programming greater absorption and expenditure of aid in the fourth review of 2005, amid reduced concerns over debt sustainability.51 The program change coincided with discussions to top up debt relief under HIPC in 2004 in advance of the country’s reaching the completion point in early 2005. At the same time, programs started to forecast less tapering of aid, the fiscal deficit, and absorption beyond the first program year.52 (These changes were preceded by a change in adjusters in the first review in 2003 to allow partial domestic financing of aid shortfalls).53
13. With debt sustainability less of a concern, PRGF program assessments in 2005 focused on the under-utilization of aid. In the 2005 program, IMF staff’s concerns of previous years gave way to concerns about the under-utilization of aid. But, in practice, aid absorption was limited by the Central Bank, because of its concerns about exchange rate appreciation. In the program documentation, IMF staff argued for limiting reserve accumulation to allow for greater aid absorption (but stopped short of using conditionality). This new policy stance was supported by the IMF internal review process.
48 Mackinnon, et al. (2003). 49 Staff did inform Management of the results of the PSIA and their disagreement with donors, and internal review comments supported the prudent policy stance taken by staff, highlighting the debt sustainability concerns. 50 A recent ODI review of DFID’s PSIA notes that “The immediate outcome was not sufficiently robust for the IMF to change their policy on the limit for the fiscal deficit of Rwanda....However, subsequently it appears that PSIA has had an impact on IMF thinking, at least in terms of their rhetoric.” See Bird et al. (2005). 51 IMF (2005b). 52 Rwanda’s 2006 EPA did not cover the debate about tight fiscal policy and the subsequent program design changes. (See IMF 2006b). Noting that the design was largely appropriate to achieve macro stability, with appropriate flexibility to aid in conditionality through adjusters and target definitions, it found that implementation (reviews) accommodated a fiscal stance that was “probably looser than necessary to increase priority spending.” Moreover, programs did not adequately address the continuous deterioration in debt sustainability. 53 The use of aid windfalls—unlike in Tanzania—continued to be disallowed.

75
C. Burkina Faso (2005)
14. Driven by a long record of macro stability, PRGFs had long allowed the use of anticipated aid in Burkina Faso. This was noted by the 2006 Ex Post Assessment, which highlighted the strong economic performance and record of program implementation.54
15. By the combined second and third review of the PRGF in 2005, program design changed to forecasting less tapering of aid and the fiscal deficit over the medium term. The program also started to correct for past overestimation of aid at the first program year.55 With the change in medium-term forecasts of aid, projected spending also became more stable with less programmed tapering off.
16. Adjusters also changed in 2005 to allow greater program flexibility in the spending of aid windfalls. The switch to more accurate aid projections for the initial program year was accompanied by a change in program adjusters. In contrast to previous programs where all aid windfalls had to be saved until the next review, adjusters now allowed for limited use of such windfalls for priority spending. As before, adjusters continued to allow for limited financing of aid shortfalls.
D. Ghana (2005)
17. The 2003 PRGF program request was concerned with macroeconomic stability, through containing both domestic debt and the rapid expansion of public expenditures. The program stance was influenced by the serious fiscal and quasi-fiscal slippages in 2002 that precluded the completion of the fifth and final review of the 1999–2002 PRGF arrangement. The budget slippages related to, inter alia, large public sector wage bill overruns, non-implementation of revenue measures, delays with the divestiture program of public enterprises, and shortfalls in donor financing related to country performance.56
18. The third PRGF review in 2005 started to forecast less tapering of aid and the fiscal deficit over the medium term. This program change stemmed from improved macroeconomic performance during 2003/04, including contained domestic government borrowing.
54 However the EPA was silent about the program design changes that ensued, highlighting strong program implementation and “exemplary” observance of conditionality. Program design was found to be broadly adequate, including pointing out limited absorptive capacity (but with greater attention needed on tax collection). IMF (2006j). 55 Due to limited documentation, it is not possible to identify why actual aid flows have constantly fallen behind aid projections until this change beyond the observed basic pattern of programs usually projecting aid increases for the initial program year while actuals remain flat. 56 A background paper to the 2005 PRGF review examined the macroeconomics of managing increased aid inflows, focusing on the actual use of incremental aid for the period 2001–03. It found for Ghana that in practice there was neither spending nor absorption of additional aid for that period as a whole. Moreover, program design allowed absorption but only partial spending of expected incremental aid. See IMF (2005h).
76
19. Program adjusters were also changed in 2005 to allow for the full use of aid windfalls. But, as before, financing of aid shortfalls was not allowed, reflecting lingering concerns over domestic debt.
20. The restriction on non-concessional borrowing has been the subject of an on-going debate in Ghana between the authorities and the Fund and donors. The program has maintained throughout this period limits on non-concessional borrowing, which the authorities describe as overly restrictive of their infrastructure investment plans. The discussions between the authorities and donors and the Fund on non-concessional borrowing have taken place for example in the context of the Consultative Group meetings. A waiver on the related performance criteria was granted during the third review in 2005 when conditionality was breached for unintended reasons. The authorities were expecting concessional financing that did not materialize, and to avoid a sizable penalty under previous investment commitments by the government, alternative financing arrangements were made.57
E. Mozambique (2006)
21. In line with earlier programs, the 2004 PRGF request was concerned with macroeconomic stability, fiscal consolidation and growth-enhancing structural reforms.58 The program placed special emphasis on strengthening government revenues and improving public expenditure management. These concerns, combined with an expected reduction in aid flows, led to a programmed reduction of the domestic primary fiscal deficit (moving to a surplus over the medium term). The program rationale for the fiscal policy stance included the reduction of pressures on domestic interest rates.59
22. In the fourth PRGF review in 2006, the program projected higher aid and expenditure for the program year, and forecast less tapering of aid and spending beyond the program horizon. These changes arose from the explicit program recognition that macro and fiscal performance had been better than expected, even in the face of revenue shortfalls. In addition, the program also noted the recent increase in aid and the expectation that it would be sustained. The latter was reflected in the program appraisal, with aid flows no longer considered a main risk to the program as in previous years.
23. Program adjusters were also changed in 2006 to allow for the full use of aid windfalls and the partial financing of aid shortfalls. Prior to these changes, the program design was a matter of controversy in 2005, with NGOs arguing that program targets and adjusters restricted the use of additional aid.60 The Fund responded publicly in 2006 on the 57 Ghana obtained a US$ 40 million loan from Nigeria to finance its participation in the West Africa Gas Pipeline. 58 Mozambique’s EPA took place in December 2003 (IMF, 2003h). It called for sustaining the efforts to consolidating macroeconomic stability and deepening structural reforms. The aforementioned background paper to the 2005 PRGF review found that Mozambique in practice mostly spent and absorbed additional aid for that period as a whole. IMF (2005h). 59 But the program made also a general reference that to achieve poverty and development goals a significant scaling up of aid would be required, noting also that sectoral absorptive capacity needed to be improved. 60 Hanlon (2006).

77
use of adjusters and program reviews with respect to aid.61 In due course, the fourth PRGF review in 2006 adjusted the definition of fiscal targets in the program to focus on domestic financing rather than the primary deficit, as was the case in previous programs and reviews.
61 Perone (2006).

78
ANNEX E. EVALUATION SURVEY
1. This annex provides background on the evaluation survey. Section I overviews the approach followed in preparing the questionnaire and in identifying recipients. Sections II and III, respectively, profile survey recipients and respondents. Section IV presents selected survey results and findings.
I. APPROACH
2. The survey aimed to collect views on IMF activities in SSA from the authorities in the 29 PRGF countries, local donor representatives, local civil society representatives, and the staffs of the African Development Bank (AfDB), IMF, UNDP, and World Bank. A Washington-based research firm, Fusion Analytics (Fusion), assisted in the preparation of the questionnaire and administered the survey. To protect the anonymity of the respondents, all survey responses were handled by Fusion, and survey recipients were advised of the confidentiality of their responses. The survey was developed in English and translated into French and Portuguese.
3. The survey had four main parts. An introductory section sought information on respondents’ background, including the nature and timing of any engagement with a PRGF-supported program. The second part of the survey posed questions about PRGF program design and its impact on economic outcomes and aid mobilization. The third part looked at specific aspects of PRGF preparation, including the extent to which it was grounded in national processes and whether it took into account the analytical work and experience of other stakeholders. This section also included questions relating to IMF missions and quality of dialogue with the authorities and other stakeholders, including civil society. The fourth part asked respondents’ views on the evolution of the IMF’s approach on a range of issues such as macroeconomic stability and the MDGs.
II. SURVEY RECIPIENTS
4. The evaluation team relied on a variety of methods to obtain the initial list of survey recipients and to secure adequate response rates. As part of its design, the survey targeted groups expected to be knowledgeable about the IMF and its operations.
5. The survey was sent to 100 government representatives from the 29 PRGF countries. Survey recipients were drawn mostly from ministry of finance (50 recipients) and central bank staff (30 recipients). There were 20 recipients from ministries of health, education, and infrastructure. Government representatives were identified on the basis of lists provided by the offices of the three IMF Executive Directors representing SSA countries and IMF and World Bank staff (both in operational departments and external relations). In the event, some 50 recipients responded to the survey, representing 25 (or 86 percent) of the 29 PRGF countries under study. Of this, 25 came from finance ministries, 20 from central banks and 5 from sector ministries—suggesting some selection bias in favor of ministries of finance.
6. The evaluation team aimed to reach donor representatives resident in SSA countries. Contact information was gathered from agency headquarters, agency websites,

79
and IMF and World Bank sources, including Executive Directors’ offices. The donor sample of 92 survey recipients included staff from the aid agencies of Austria, Belgium, Canada, Denmark, the European Union, Finland, France, Germany, Ireland, Italy, Japan, the Netherlands, Norway, Portugal, Sweden, Switzerland, the United Kingdom, and the United States. For each SSA country, the choice of included donors was based on their relative importance in terms of aid flows to that country.62 Fifty-two donor representatives (or 57 percent) responded.
7. The list of survey recipients from the AfDB comprised all 26 of the Bank’s country economists working on SSA PRGF countries. The AfDB response rate was high, with 20 economists (or 77 percent) responding.
8. The IMF staff survey recipient list was extracted from an IMF database of resident representatives, mission chiefs and country desk economists for ESAF and PRGF countries from 1998 to the present. The IMF sample was set at 71, including only current or former mission members with at least three missions and IMF Resident Representatives. IMF staff answered the survey online, with 44 total responses (62 percent of the sample). Of those, slightly over one-half were mission chiefs and 40 percent resident representatives.
9. The UNDP staff survey recipient list was developed from UNDP country websites, validated through discussions with UNDP Africa Bureau staff. In all, 22 UNDP offices were included in the sample, with 11 responses.
10. The list of 71 World Bank staff recipients was extracted from country team lists from 1998 to the present, augmented by informal contacts with World Bank sources. Of 44 (or 62 percent) responding World Bank staff, about half were country managers or country directors and the other half country or sector economists.
11. The evaluation team used information and contacts from several sources to construct the survey recipient list for civil society. These included: the external relations departments of the IMF and the World Bank; IMF resident representatives and World Bank staff from the Africa Region; and staff of international CSOs, including ActionAid, Christian Aid, EURODAD, Save the Children, Trocaire, and VSO International. A total of 87 civil society recipients were identified and 46 responses received for a response rate of 53 percent. Of the civil society respondents, 23 answered in English, 18 in French and 5 in Portuguese.
62 Generally, the donors to whom surveys were sent were among the five top providers of aid to the country in question. Aid disbursements were calculated using the most recent OECD/DAC data. See OECD/DAC (2006).

80
III. RESPONDENT CHARACTERISTICS
12. The evaluation team sent questionnaires to 469 people. Out of these, 266 people responded, for an overall response rate of 57 percent (Table E1).
Table E1. Evaluation Survey Responses
Authorities Donors AfDB IMF UNDP World Bank Civil Society Total
Number of Survey Recipients 100 92 26 71 22 71 87 469 Number of Respondents 50 52 20 44 11 44 46 266 Percent Response Rate 50 57 77 62 50 62 53 57
Note: For the authorities, the 50 responses covered 25 of the 29 PRGF countries under study, or about 86 percent. 13. The total sample of responses was fairly evenly distributed across the authorities, donors, civil society, and IMF and World Bank staff. Responses from UNDP and AfDB comprised small shares of the total. The response rate for each of the seven categories of survey recipients was at least 50 percent. These response rates are broadly comparable to those from surveys used in other IMF reports and evaluations.63
14. Respondents from all non-IMF groups expressed familiarity with the IMF’s work in SSA, including the PRGF process. Excluding civil society representatives (who were not asked specifically about the PRGF), a majority of respondents were actively involved in the PRGF process; over half were involved in the design and 68 percent took part in implementation. Twenty-three percent of respondents reported no involvement with PRGF processes.
15. While civil society representatives were not asked directly about their involvement with PRGFs, they were asked about their familiarity with the work of the IMF. Specifically, respondents were asked about their main sources of information on IMF activities. The most common source of IMF information was participation in national consultation processes (around one-third of respondents). Chart E1 also shows the main sectors of civil society respondents’ work. As illustrated, those focused on human development issues (including health, education and gender advocacy) had the highest representation in the sample.
63 See, for example, IMF (2005m), IMF/World Bank (2004), and IEO (2006a).
Chart E1. Characteristics of Civil Society Representatives
Focus area of civil society respondents(n = 46)
Human development (e.g., health, education,
gender)46%
Economic (e.g., international trade, debt)
28%
Societal (e.g., parliamentarians,
media, justice)26%

81
IV. OTHER ISSUES
16. The main text presents the survey results in the form of simple charts. This section provides details on significance tests and a summary table of survey results.
17. Despite the statistical tests suggesting significance for a number of questions, the survey results should be interpreted with caution and as indicative of the views of the relevant respondent groups. There is, of course, no way to completely remove selection bias from the choice of recipients, or from the responses received, which are more likely to come from those familiar with the work of the IMF and from those with strong opinions on Fund activities in SSA—both positive and negative.
18. To strengthen the interpretation of the results, tests examined the statistical significance of within-group and between-groups’ differences in responses. The evaluation team used two tests for the purpose: (i) a t-test for the difference of means—used to compare two group responses—with the null hypothesis that the difference between the two means is zero; and, (ii) construction of confidence intervals around the responses of each individual group.
19. Table E2 provides details on responses by all seven groups to a broad range of survey questions, including results of the difference of means t-tests described above. The questions listed are divided along thematic lines, and include queries on the IMF’s influence and effectiveness, the Fund’s role in the mobilization and use of aid, the design of PRGF programs, and communications and relationships with other stakeholders. As shown in the table, there are statistically significant differences between IMF staff and civil society responses for most questions, especially on issues of aid mobilization, IMF mission outreach, and concern for poverty issues. There are also significant differences between IMF staff and World Bank staff and between IMF staff and donor responses on many issues, including aid mobilization, the influence of PRGF programs, and the effectiveness of Fund communications. IMF staff responses are statistically closer to those of the authorities than to the other groups for many questions, though these two also differ significantly on issues of aid mobilization and use. UNDP and AfDB staff responses were generally not high enough for meaningful significance tests.
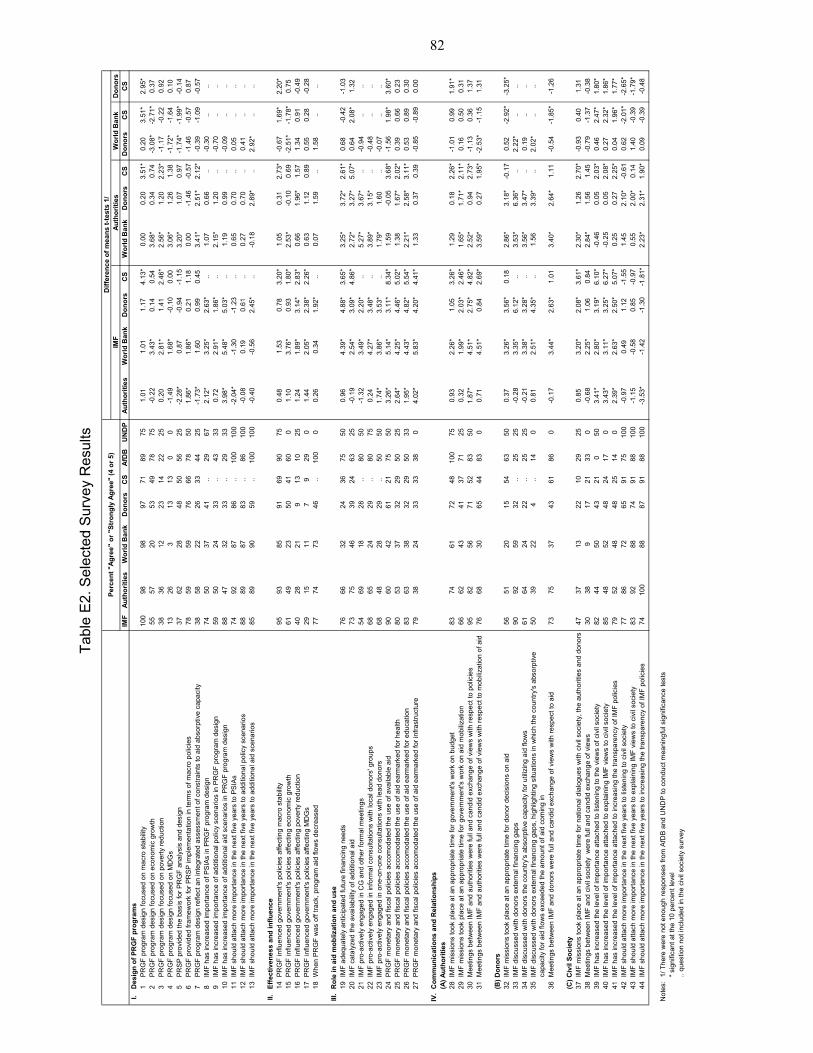
82
Tabl
e E
2. S
elec
ted
Sur
vey
Res
ults
D
iffer
ence
of m
eans
t-te
sts
1/IM
FAu
thor
ities
Wor
ld B
ank
Don
ors
IMF
Auth
oriti
esW
orld
Ban
kD
onor
sC
SAf
DB
UN
DP
Auth
oriti
es W
orld
Ban
k D
onor
sC
S W
orld
Ban
k D
onor
sC
SD
onor
sC
SC
SI.
Des
ign
of P
RG
F pr
ogra
ms
1PR
GF
prog
ram
des
ign
focu
sed
on m
acro
sta
bilit
y10
098
9897
7189
751.
011.
011.
174.
13*
0.00
0.20
3.51
*0.
203.
51*
2.95
*2
PRG
F pr
ogra
m d
esig
n fo
cuse
d on
eco
nom
ic g
row
th55
5720
5349
7875
-0.2
23.
43*
0.14
0.54
3.68
*0.
340.
74-3
.08*
-2.7
1*0.
373
PRG
F pr
ogra
m d
esig
n fo
cuse
d on
pov
erty
redu
ctio
n38
3612
2314
2225
0.20
2.81
*1.
412.
46*
2.56
*1.
202.
23*
-1.1
7-0
.22
0.92
4PR
GF
prog
ram
des
ign
focu
sed
on M
DG
s13
263
1313
00
-1.4
91.
68*
-0.1
00.
003.
06*
1.26
1.38
-1.7
2*-1
.64
0.10
5PR
SP
prov
ided
the
basi
s fo
r PR
GF
anal
ysis
and
des
ign
3762
2848
5056
25-2
.28*
0.87
-0.9
4-1
.15
3.20
*1.
070.
97-1
.74*
-1.9
9*-0
.14
6PR
GF
prov
ided
fram
ewor
k fo
r PR
SP im
plem
enta
tion
in te
rms
of m
acro
pol
icie
s78
5959
7666
7850
1.86
*1.
86*
0.21
1.18
0.00
-1.4
6-0
.57
-1.4
6-0
.57
0.87
7PR
GF
prog
ram
des
ign
refle
ct a
n in
tegr
ated
ass
essm
ent o
f con
stra
ints
to a
id a
bsor
ptiv
e ca
paci
ty38
5822
2633
4425
-1.7
3*1.
600.
990.
453.
41*
2.51
*2.
12*
-0.3
9-1
.09
-0.5
78
IMF
has
incr
ease
d im
porta
nce
of P
SIAs
in P
RG
F pr
ogra
m d
esig
n74
5037
41..
2967
2.12
*3.
25*
2.63
*..
1.07
0.66
..-0
.30
....
9IM
F ha
s in
crea
sed
impo
rtanc
e of
add
ition
al p
olic
y sc
enar
ios
in P
RG
F pr
ogra
m d
esig
n59
5024
33..
4333
0.72
2.91
*1.
86*
..2.
15*
1.20
..-0
.70
....
10IM
F ha
s in
crea
sed
impo
rtanc
e of
add
ition
al a
id s
cena
rios
in P
RG
F pr
ogra
m d
esig
n88
4732
33..
2933
3.98
*5.
48*
5.03
*..
1.19
0.99
..-0
.09
....
11IM
F sh
ould
atta
ch m
ore
impo
rtanc
e in
the
next
five
yea
rs to
PS
IAs
7492
8786
..10
010
0-2
.04*
-1.3
0-1
.23
..0.
650.
70..
0.05
....
12IM
F sh
ould
atta
ch m
ore
impo
rtanc
e in
the
next
five
yea
rs to
add
ition
al p
olic
y sc
enar
ios
8889
8783
..86
100
-0.0
80.
190.
61..
0.27
0.70
..0.
41..
..13
IMF
shou
ld a
ttach
mor
e im
porta
nce
in th
e ne
xt fi
ve y
ears
to a
dditi
onal
aid
sce
nario
s85
8990
59..
100
100
-0.4
0-0
.56
2.45
*..
-0.1
82.
89*
..2.
92*
....
II.Ef
fect
iven
ess
and
influ
ence
14P
RG
F in
fluen
ced
gove
rnm
ent's
pol
icie
s af
fect
ing
mac
ro s
tabi
lity
9593
8591
6990
750.
481.
530.
783.
20*
1.05
0.31
2.73
*-0
.67
1.69
*2.
20*
15PR
GF
influ
ence
d go
vern
men
t's p
olic
ies
affe
ctin
g ec
onom
ic g
row
th61
4923
5041
600
1.10
3.76
*0.
931.
80*
2.53
*-0
.10
0.69
-2.5
1*-1
.78*
0.75
16PR
GF
influ
ence
d go
vern
men
t's p
olic
ies
affe
ctin
g po
verty
redu
ctio
n40
2821
913
1025
1.24
1.89
*3.
14*
2.83
*0.
661.
96*
1.57
1.34
0.91
-0.4
917
PRG
F in
fluen
ced
gove
rnm
ent's
pol
icie
s af
fect
ing
MD
Gs
2915
117
929
01.
442.
05*
2.38
*2.
26*
0.63
1.12
0.89
0.55
0.28
-0.2
818
Whe
n PR
GF
was
off
track
, pro
gram
aid
flow
s de
crea
sed
7774
7346
..10
00
0.26
0.34
1.92
*..
0.07
1.59
..1.
58..
..
III.
Rol
e in
aid
mob
lizat
ion
and
use
19IM
F ad
equa
tely
ant
icip
ated
futu
re fi
nanc
ing
need
s76
6632
2436
7550
0.96
4.39
*4.
88*
3.65
*3.
25*
3.72
*2.
61*
0.68
-0.4
2-1
.03
20IM
F ca
taly
zed
the
avai
labi
lity
of a
dditi
onal
aid
7375
4639
2463
25-0
.19
2.54
*3.
09*
4.86
*2.
72*
3.27
*5.
07*
0.64
2.08
*1.
3221
IMF
pro-
activ
ely
enga
ged
in C
G a
nd o
ther
form
al m
eetin
gs54
6918
28..
8050
-1.3
23.
49*
2.20
*..
5.27
*3.
67*
..-0
.94
....
22IM
F pr
o-ac
tivel
y en
gage
d in
info
rmal
con
sulta
tions
with
loca
l don
ors'
gro
ups
6865
2429
..80
750.
244.
27*
3.48
*..
3.89
*3.
15*
..-0
.48
....
23IM
F pr
o-ac
tivel
y en
gage
d in
one
-on-
one
cons
ulta
tions
with
lead
don
ors
6848
2829
..50
501.
74*
3.86
*3.
53*
..1.
79*
1.60
..-0
.07
....
24PR
GF
mon
etar
y an
d fis
cal p
olic
ies
acco
mod
ated
the
use
of a
vaila
ble
aid
9060
4261
2175
503.
26*
5.14
*3.
11*
8.34
*1.
59-0
.05
3.68
*-1
.56
1.98
*3.
60*
25PR
GF
mon
etar
y an
d fis
cal p
olic
ies
acco
mod
ated
the
use
of a
id e
arm
arke
d fo
r hea
lth80
5337
3229
5025
2.64
*4.
25*
4.46
*5.
02*
1.38
1.67
*2.
02*
0.39
0.66
0.23
26PR
GF
mon
etar
y an
d fis
cal p
olic
ies
acco
mod
ated
the
use
of a
id e
arm
arke
d fo
r edu
catio
n83
6338
3229
5033
1.95
*4.
43*
4.82
*5.
54*
2.21
*2.
58*
3.11
*0.
530.
890.
3027
PRG
F m
onet
ary
and
fisca
l pol
icie
s ac
com
odat
ed th
e us
e of
aid
ear
mar
ked
for i
nfra
stru
ctur
e79
3824
3333
380
4.02
*5.
83*
4.20
*4.
41*
1.33
0.37
0.39
-0.8
5-0
.89
0.00
IV.
Com
mun
icat
ions
and
Rel
atio
nshi
ps(A
) Aut
horit
ies
28IM
F m
issi
ons
took
pla
ce a
t an
appr
opria
te ti
me
for g
over
nmen
t's w
ork
on b
udge
t83
7461
7248
100
750.
932.
26*
1.05
3.26
*1.
290.
182.
26*
-1.0
10.
991.
91*
29IM
F m
issi
ons
took
pla
ce a
t an
appr
opria
te ti
me
for g
over
nmen
t's w
ork
on a
id m
obiliz
atio
n66
6243
4137
7125
0.32
1.99
*2.
03*
2.46
*1.
65*
1.71
*2.
11*
0.16
0.50
0.31
30M
eetin
gs b
etw
een
IMF
and
auth
oriti
es w
ere
full
and
cand
id e
xcha
nge
of v
iew
s w
ith re
spec
t to
polic
ies
9582
5671
5283
501.
87*
4.51
*2.
75*
4.82
*2.
52*
0.94
2.73
*-1
.13
0.36
1.37
31M
eetin
gs b
etw
een
IMF
and
auth
oriti
es w
ere
full
and
cand
id e
xcha
nge
of v
iew
s w
ith re
spec
t to
mob
iliza
tion
of a
id76
6830
6544
830
0.71
4.51
*0.
842.
69*
3.59
*0.
271.
95*
-2.5
3*-1
.15
1.31
(B) D
onor
s32
IMF
mis
sion
s to
ok p
lace
at a
n ap
prop
riate
tim
e fo
r don
or d
ecis
ions
on
aid
5651
2015
5463
500.
373.
26*
3.56
*0.
182.
86*
3.18
*-0
.17
0.52
-2.9
2*-3
.25*
33IM
F di
scus
sed
with
don
ors
exte
rnal
fina
ncin
g ga
ps90
9259
32..
2525
-0.2
83.
35*
6.12
*..
3.53
*6.
36*
..2.
22*
....
34IM
F di
scus
sed
with
don
ors
the
coun
try's
abs
orpt
ive
capa
city
for u
tiliz
ing
aid
flow
s61
6424
22..
2525
-0.2
13.
38*
3.28
*..
3.56
*3.
47*
..0.
19..
..35
IMF
disc
usse
d w
ith d
onor
s ex
tern
al fi
nanc
ing
gaps
, hig
hlig
htin
g si
tuat
ions
in w
hich
the
coun
try's
abs
orpt
ive
capa
city
for a
id fl
ows
exce
eded
the
amou
nt o
f aid
com
ing
in50
3922
4..
140
0.81
2.51
*4.
35*
..1.
563.
39*
..2.
02*
....
36M
eetin
gs b
etw
een
IMF
and
dono
rs w
ere
full
and
cand
id e
xcha
nge
of v
iew
s w
ith re
spec
t to
aid
7375
3743
6186
0-0
.17
3.44
*2.
63*
1.01
3.40
*2.
64*
1.11
-0.5
4-1
.85*
-1.2
6
(C) C
ivil
Soci
ety
37IM
F m
issi
ons
took
pla
ce a
t an
appr
opria
te ti
me
for n
atio
nal d
ialo
gues
with
civ
il so
ciet
y, th
e au
thor
ities
and
don
ors
4737
1322
1029
250.
853.
20*
2.08
*3.
61*
2.30
*1.
262.
70*
-0.9
30.
401.
3138
Mee
tings
bet
wee
n IM
F an
d ci
vil s
ocie
ty w
ere
full
and
cand
id e
xcha
nge
of v
iew
s30
389
1721
330
-0.6
82.
25*
1.06
0.84
2.84
*1.
561.
45-0
.79
-1.3
7-0
.38
39IM
F ha
s in
crea
sed
the
leve
l of i
mpo
rtanc
e at
tach
ed to
list
enin
g to
the
view
s of
civ
il so
ciet
y82
4450
4321
050
3.41
*2.
80*
3.19
*6.
10*
-0.4
60.
052.
03*
0.46
2.47
*1.
80*
40IM
F ha
s in
crea
sed
the
leve
l of i
mpo
rtanc
e at
tach
ed to
exp
lain
ing
IMF
view
s to
civ
il so
ciet
y85
4852
4824
170
3.43
*3.
11*
3.25
*6.
27*
-0.2
50.
052.
08*
0.27
2.32
*1.
86*
41IM
F ha
s in
crea
sed
the
leve
l of i
mpo
rtanc
e at
tach
ed to
incr
easi
ng th
e tra
nspa
renc
y of
IMF
polic
ies
7952
4848
2514
02.
39*
2.63
*2.
50*
5.07
*0.
250.
272.
25*
0.04
1.96
*1.
77*
42IM
F sh
ould
atta
ch m
ore
impo
rtanc
e in
the
next
five
yea
rs to
list
enin
g to
civ
il so
ciet
y77
8672
6591
7510
0-0
.97
0.49
1.12
-1.5
51.
452.
10*
-0.6
10.
62-2
.01*
-2.6
5*43
IMF
shou
ld a
ttach
mor
e im
porta
nce
in th
e ne
xt fi
ve y
ears
to e
xpla
inin
g IM
F vi
ews
to c
ivil
soci
ety
8392
8874
9188
100
-1.1
5-0
.58
0.85
-0.9
70.
552.
00*
0.14
1.40
-0.3
9-1
.79*
44IM
F sh
ould
atta
ch m
ore
impo
rtanc
e in
the
next
five
yea
rs to
incr
easi
ng th
e tra
nspa
renc
y of
IMF
polic
ies
7410
088
8791
8810
0-3
.53*
-1.4
2-1
.30
-1.8
1*2.
23*
2.31
*1.
90*
0.09
-0.3
9-0
.48
Not
es:
1/ T
here
wer
e no
t eno
ugh
resp
onse
s fro
m A
fDB
and
UN
DP
to c
ondu
ct m
eani
ngfu
l sig
nific
ance
test
s* s
igni
fican
t at t
he 1
0 pe
rcen
t lev
el..
ques
tion
not i
nclu
ded
in th
e ci
vil s
ocie
ty s
urve
y
Perc
ent "
Agre
e" o
r "St
rong
ly A
gree
" (4
or 5
)

83
REFERENCES
ActionAid International, 2004, “Blocking Progress: How the Fight against HIV/AIDS is Being Undermined by the World Bank and the International Monetary Fund,” (Washington: ActionAid International).
__________, 2005, “Contradictory Commitments: How the Achievements of Education for All is Being Undermined by the International Monetary Fund,” September, (Washington: ActionAid International).
African Forum and Network on Debt and Development (AFRODAD), 2005, “The Impact of the Poverty Reduction and Growth Facility on Social Services in Ethiopia,” Study Report, available at http://www.afrodad.org/downloads/publications/Ethiopian%20Study.pdf.
__________, 2006a, “Assessing the Impact of the PRGF on Social Services. The Case of Malawi,” Study Report, available at http://www.afrodad.org/downloads/publications/PRGF%20Case%20Study%20Malawi.pdf.
__________, 2006b, “Assessing the Impact of the PRGF on Social Services. The Case of Tanzania,” Study Report, available at http://www.afrodad.org/downloads/publications/PRGF%20Case%20Study%20Tanzania.pdf.
__________, 2006c, “Assessing the Impact of the PRGF on Social Services. The Case of Zambia,” Study Report, available at http://www.afrodad.org/downloads/publications/PRGF%20Study%20Zambia.pdf.
__________, 2006d, “Assessing the Impact of the PRGF on Social Services in Selected African Countries,” A synthesis report on Ethiopia, Malawi, Zambia, and Tanzania, March, available at http://www.afrodad.org/downloads/publications/PRGF%20Synthesis.pdf.
Aiyar Shekhar, Andrew Berg, and Mumtaz Hussain, 2005, “The Macroeconomic Challenge of More Aid,” Finance and Development, Volume 42, Number 3, September.
Bevan, David, 2000, “Public Expenditure Review: Tanzania 1999/2000—Fiscal Policy and the macroeconomic Context,” Department of Economics (Oxford: Oxford University).
__________, 2001, “Public Expenditure Review: Tanzania 2000/2001—The Fiscal Deficit and the Sustainability of Fiscal Policy,” Department of Economics (Oxford: Oxford University).

84
__________, 2005, “An Analytical Overview of Aid Absorption: Recognizing and Avoiding Macroeconomic Hazards,” Paper Presented at a Seminar on Foreign Aid and Macroeconomic Management, Maputo, March.
Bird, Kate, Zaza Curran, Alison Evans and Sophie Plagerson, 2005, “What Has DFID Learned from the PSIA Process,” Poverty and Public Policy Group (London: Overseas Development Institute).
Center for Global Development, 2006, “CGD Working Group to examine whether IMF-supported programs unduly constrain health spending,” available at http://blogs.cgdev.org/globalhealth/2006/08/cgd_working_gro.php.
Coady, David, 2006, “Evaluating Alternative Approaches to Social Assistance in Madagascar: Rice Trade Liberalization versus Targeted Transfers,” September, (Washington: International Monetary Fund).
Coady, David and David Newhouse, 2005, “Ghana: Evaluation of the Distributional Impacts of Petroleum Price Reforms (Technical Assistance Report),” April, (Washington: International Monetary Fund).
Chen, Shaohua and Martin Ravallion, 2004, “How Have the World’s Poorest Fared since the Early 1980s?” The World Bank Research Observer, Vol.19, No.2.
Coudouel, Aline, Anis A. Dani, and Stefano Paternostro, Editors, (2006), Poverty and Social Impact Analysis of Reforms: Lessons and Examples from Implementation (Washington: World Bank).
Dawson, Thomas, C., 2006, “IMF Focus is to Help Nations Grow even When Aid Promises Fall Short,” Letter to the Editor, January 3, Financial Times, London.
de Rato, Rodrigo, 2006, “Renewing the IMF’s Commitment to Low-Income Countries,” Speech by IMF Managing Director at the Center for Global Development, July, (Washington: International Monetary Fund), available at http://www.imf.org/external/np/speeches/2006/073106.htm.
Development Committee, 2005, “ Infrastructure and the World Bank: A Report in Progress,” presented to Joint Ministerial Committee of the Boards of Governors of the Bank and the Fund on the Transfer of Real Resources to Developing Countries, September, (Washington: World Bank and International Monetary Fund), available at http://siteresources.worldbank.org/DECOMMINT/Documentation/20651863/DC2005-0015(E)-Infrastructure.pdf.
__________, 2006a, “Joint Ministerial Committee of the Boards of Governors of the Bank and the Fund on the Transfer of Real Resources to Developing Countries,” Development Committee Communiqué, April, (Washington: World Bank and International Monetary Fund), available at http://siteresources.worldbank.org/DEVCOMMINT/NewsAndEvents/20898432/Apr_2006_DC_Communique_E.pdf.

85
__________, 2006b, “Joint Ministerial Committee of the Boards of Governors of the Bank and the Fund on the Transfer of Real Resources to Developing Countries,” Development Committee Communiqué, September, (Washington: World Bank and International Monetary Fund), available at http://siteresources.worldbank.org/DEVCOMMINT/NewsAndEvents/20898379/Sept__2006_DC_Communique_E.pdf.
Easterly, William, 2005, “How to Assess the Needs for Aid? The Answer: Don’t Ask,” Paper prepared for the Third ADF/EUDN Conference; Financing Development: What Are the Challenges in Expanding Aid Flows? Paris, December 14, available at http://www.nyu.edu/fas/institute/dri/Easterly/File/How%20to%20assess%20the%20needs%20for%20aid%20Bill%20Easterly.pdf.
El-Said, Moataz and Robert Gillingham, 2005, “Uganda: Distributional Effects of Alternative Indirect Tax Reforms (Aide-Memoire),” May, (Washington: International Monetary Fund).
Epstein, Gerald and James Heintz, 2006, “Monetary Policy and Financial Sector Reform for Employment Creation and Poverty reduction in Ghana,” Country Study 2, International Poverty Centre, UNDP.
Estache, Antonio, 2006, “Infrastructure: A Survey of Recent and Upcoming Issues,” Paper Presented at the World Bank ABCDE Conference, Tokyo.
European Network on Debt and Development, 2005, “EURODAD Submission to the World Bank/IMF 2005 PRS Review,” (Brussels: EURODAD).
Fedelino, Annalisa, Gerd Schwartz, and Marijn,Verhoeven, 2006, “Aid Scaling Up: Do Wage Bill Ceilings Stand in the Way?” IMF Working Paper 06/106, May (Washington: International Monetary Fund), available at http://www.imf.org/external/pubs/ft/wp/wp9868.pdf.
Foster, Mick and Tony Killick, 2006, “What Would Doubling Aid Do for Macroeconomic Management in Africa: A Synthesis Paper,” ODI Working Paper 264, April.
Gillingham, Robert, 2005, “Letter to Ms. Lucy Hayes, Poverty Impact Project Manager, EURODAD,” April (Washington: International Monetary Fund).
Gillingham, Robert and Prachi Mishra, 2006, “Malawi: Distributional Effects of Agricultural Input Subsidies,” (PSIA Aide-Memoire), April, (Washington: International Monetary Fund).
Gillingham, Robert and David Newhouse, 2004, “Senegal: Distributional Effects of Reforming the Groundnut Sector (Aide-Memoire),” November (Washington: International Monetary Fund).
86
Global Campaign for Education, et al., 2004, “Undervaluing Teachers—IMF Policies Squeeze Zambia's Education System,” September, available at http://www.campaignforeducation.org/resources/Sep2004/Zambia_IMF.doc.
Goldsbrough, David, 2006, "The Nature of the Debate Between The IMF and its Critics," Background Note for the Working Group on IMF-Supported Programs and Health Expenditures, August, (Washington: Center for Global Development).
Goldsbrough, David and Ehui Adovar, 2006, “What Has Happened to Health Spending and Fiscal Flexibility in Low-Income Countries with IMF-Supported Programs?” Background Note for the Working Group on IMF-Supported Programs and Health Expenditures, August, (Washington: Center for Global Development).
Griesgraber, Jo Marie, 2006, “On Poverty and Social Impact Assessment,” Letter to Ngozi Okonjo-Iweala, in her capacity as member of the World Bank/IMF Review Panel, July 20.
Gupta, Sanjeev, Robert Powell, and Yongzheng Yang, 2006, “Macroeconomic Challenges of Scaling Up Aid to Africa,” (Washington: International Monetary Fund), available as IMF Working Paper at http://www.imf.org/external/pubs/ft/wp/2005/wp05179.pdf.
Hanlon, Joseph, 2006, “Donor Concern over IMF Cap on Aid Increases,” available at http://www.open.ac.uk/technology/mozambique.
Hayes, Lucy, 2005, “Joint Letter to IMF from Christian Aid, Eurodad, Oxfam GB, and Save the Children UK, on the Lack of Progress to date in Poverty and Social Impact Analysis,” (Brussels: EURODAD).
Heller, Peter, S., 2003, “Wealth Creation and Social Justice: an IMF Perspective,” Speaking Notes Prepared for World Council of Churches’ Meeting with World Bank—IMF, February (Geneva).
Inchauste, Gabriela, 2002, “Poverty and Social Impact Analysis in PRGF-Supported Programs,” IMF Policy Discussion Papers 02/11, (Washington: International Monetary Fund), available at http://ideas.repec.org/p/imf/imfpdp/02-11.html.
Independent Evaluation Office, 2004, “Evaluation of the IMF’s Role in PRSPs and the PRGF,” (Washington: International Monetary Fund), available at http://www.imf.org/ieo/2004/prspprgf/eng/index.htm.
__________, 2005a, “Evaluation of Structural Conditionality in IMF-Supported Programs,” Issues Paper, May, (Washington: International Monetary Fund), available at http://www.imf.org/external/np/ieo/2005/sc/051805.pdf.
__________, 2005b, “Evaluation of IMF Technical Assistance,” (Washington: International
Monetary Fund), available at http://www.imf.org/external/np/ieo/2005/ta/eng/013105.htm.

87
__________, 2006a, “Report on the Evaluation of the Financial Sector Assessment Program,” (Washington: International Monetary Fund), available at http://www.imf.org/external/np/ieo/2006/fsap/eng/index.htm.
__________, 2006b, “Issues Paper: The IMF’s Role in the Determination of the External Resource Envelope in Sub-Saharan African Countries,” May, (Washington: International Monetary Fund), available at http://www.imf.org/External/NP/ieo/2005/ssa/eng/121305.pdf.
International Monetary and Financial Committee, 2006a, “Communiqué of the International Monetary and Financial Committee of the Board of Governors of the International Monetary Fund,” April (Washington: International Monetary Fund), available at http://www.imf.org/external/np/sec/pr/2006/pr0681.htm.
__________, 2006b, “Communiqué of the International Monetary and Financial Committee of the Board of Governors of the International Monetary Fund,” September (Washington: International Monetary Fund), available at http://www.internationalmonetaryfund.org/external/np/cm/2006/091706.htm.
International Monetary Fund, 1998a, “External Evaluation of the ESAF, Report by a Group of Independent Experts,” June, (Washington: International Monetary Fund), available at http://www.imf.org/external/pubs/ft/extev/index.HTM.
__________, 1998b, “Report of the Managing Director to the Interim Committee on Lessons
from the Evaluation and Review of the ESAF,” ICMS/Doc/51/98/6, September, (Washington: International Monetary Fund).
__________, 1999a, “Chairman’s Summing Up on Modifications to the Heavily Indebted Poor Countries Initiative,” FO/DIS/99/109, August, (Washington: International Monetary Fund).
__________, 1999b, “Report of the Managing Director to the Interim Committee on Reform of the ESAF,” ICMS/Doc/53/99/5, September, (Washington: International Monetary Fund).
__________, 1999c, “Poverty Reduction Strategy Papers—Operational Issues,” SM/99/290, December, (Washington: International Monetary Fund), available at http://www.imf.org/external/np/pdr/prsp/poverty1.htm.
__________, 1999d, “Poverty Reduction and Growth Facility—Operational Issues,” SM/99/293, December, (Washington: International Monetary Fund), available at http://www.imf.org/external/np/pdr/prsp/poverty2.htm.
__________, 1999e, “Concluding Remarks by the Chairman—Poverty Reduction Strategy Papers—Operational Issues, Poverty Reduction and Growth Facility—Operational Issues,” BUFF/99/154, December, (Washington: International Monetary Fund).

88
__________, 2000a, “Key Features of IMF PRGF-Supported Programs,” SM/00/193, August, (Washington: International Monetary Fund), available at http://www.imf.org/external/np/prgf/2000/eng/key.htm.
__________, 2000b, “Key Features of PRGF Arrangements—Checklist,” Memo from Jack Boorman to Heads of Area Departments, October, (Washington: International Monetary Fund)
__________, 2002a, “Review of the Poverty Reduction and Growth Facility—Issues and Options,” SM/02/51, February, (Washington: International Monetary Fund), available at http://www.imf.org/external/np/prgf/2002/021402.pdf.
__________, 2002b, “Summing Up by the Acting Chair—Review of the Poverty Reduction and Growth Facility—Issues and Options,” BUFF/02/40, March, (Washington: International Monetary Fund).
__________, 2002c, “Review of the Key Features of the Poverty Reduction and Growth Facility—Staff Analyses,” SM/02/51, March, (Washington: International Monetary Fund) http://www.imf.org/external/np/hipc/2002/status/092302.pdf.
__________, 2002d, “HIPC Initiative—Status of Implementation,” SM/02/94, March, (Washington: International Monetary Fund), available at http://www.imf.org/External/Np/prgf/2002/031502.htm.
__________, 2002e, “Poverty Reduction Strategy Papers: Progress in Implementation,” SM/02/250, September, Washington: International Monetary Fund), available at http://www.imf.org/external/np/prspgen/2002/eng/091102.pdf.
__________, 2002f, “Concluding Remarks by the Chairman—Poverty Reduction Strategy Papers—Progress in Implementation,” BUFF/02/144, September, (Washington: International Monetary Fund).
__________, 2002g, “The Acting Chair’s Summing Up: HIPC Initiative—Status of Implementation; and Update of PRGF and HIPC Operations and Subsidization of Post-Conflict Emergency Assistance,” BUFF/02/147, September, (Washington: International Monetary Fund).
__________, 2003a, “Aligning the Poverty Reduction and Growth Facility and the Poverty Reduction Strategy Papers (PRSP) Approach—Issues and Options,” SM/03/94, April, (Washington: International Monetary Fund), available at http://www.imf.org/external/np/prsp/2003/end/042503.htm..
__________, 2003b, “Concluding Remarks by the Acting Chair—Aligning the Poverty Reduction and Growth Facility and the Poverty Reduction Strategy papers (PRSP) Approach—Issues and Options,” BUFF/03/55, April, (Washington: International Monetary Fund).

89
__________, 2003c, “Mali—Sixth Review Under the Poverty Reduction and Growth Facility,” EBS/03/92, June, (Washington: International Monetary Fund), available at http:/www.imf.org/external/pubs/ft/scr/2003/cr03246.pdf.
__________, 2003d, “Benin—Fifth Review Under the Poverty Reduction and Growth Facility and Request for Waiver of Performance Criteria,” EBS/03/126, August, (Washington: International Monetary Fund), available at http:/www.imf.org/external/pubs/ft/scr/2003/cr03322.pdf.
__________, 2003e, “Summary of Key Issues in Implementing the PRSP Approach and Suggestions for Staff,” Office Memorandum, August, (Washington: International Monetary Fund).
__________, 2003f, “Concluding remarks by chair—The Role of the Fund in Low-Income Countries over the Medium Term and Fund Assistance to Countries Facing Exogenous Shocks,” BUFF/03/164, September, (Washington: International Monetary Fund).
__________, 2003g, “Guide for Staff Relations with Civil Society,” October, (Washington: International Monetary Fund), available at http://www.imf.org/external/np/cso/eng/2003/101003.htm.
__________, 2003h, “Republic of Mozambique—Ex Post Assessment of Performance Under Fund-Supported Programs,” SM/03/382/ December, (Washington: International Monetary Fund), available at http://www.imf.org/external/pubs/ft/scr/2004/cr0453.pdf.
__________, 2004a “Technical Assistance Evaluation Program—Findings of Evaluations and Updated Program,” SM/04/67, March, (Washington: International Monetary Fund), available at http://www.imf.org/external/np/ta/2004/eng/03104.htm.
__________, 2004b, “Poverty Reduction Strategy Papers—Progress in Implementation,” SM/04/292, August, (Washington: International Monetary Fund), available at http://www.imf.org/external/np/prspgen/2004/092004.pdf.
__________, 2004c, “The Role of the Fund in Low-Income Member Countries,” SM/04/285, September, (Washington: International Monetary Fund), available at http://www.imf.org/external/np/pdr/2004/eng/081304.htm.
__________, 2004d, “The Acting Chair’s Summing Up: The Role of the Fund in Low-Income Member Countries,” BUFF/04/170, September, (Washington: International Monetary Fund).
__________, 2004e, “The Acting Chair’s Summing Up—Poverty Reduction Strategy Papers—Progress in Implementation,” BUFF/04/175, September, (Washington: International Monetary Fund).
90
__________, 2004f, “Rwanda—Staff Report for the 2004 Article IV Consultation,” September, (Washington: International Monetary Fund), available at http://www.imf.org/external/pubs/ft/scr/2004/cr04382.pdf.
__________, 2004g, “AFR External Communications Report,” Memorandum from Aboulaye Bio-Tchané, Director AFR to the Managing Director, IMF, November, (Washington: International Monetary Fund).
__________,2005a, “Operational Framework for Debt Sustainability Assessments in Low-Income Countries—Further Considerations,” SM/05/109, March, (Washington: International Monetary Fund), available at http://www.imf.org/external/np/pp/end/2005/032805.pdf.
__________, 2005b, “Rwanda—Fourth Review Under the Three-Year Arrangement Under the Poverty Reduction and Growth Facility and Requests for Waiver of Nonobservance of Performance Criteria and for Extension of the Arrangement,” EBS/05/55, March, (Washington: International Monetary Fund), available at http://www.imf.org/external/pubs/ft/scr/2005/cr05171.pdf.
__________, 2005c, “Update on the Assessments and Implementation of Action Plans to Strengthen Capacity of HIPCs to Track Poverty-Reducing Public Spending,” SM/05/134, April, (Washington: International Monetary Fund), available at http://www.imf.org/external/np/pp/eng/2005/041205a.pdf.
__________, 2005d, “Uganda—Ex Post Assessment of Performance Under Fund-Supported Programs,” SM/05/223, June, (Washington: International Monetary Fund), available at http://www.imf.org/external/pubs/ft/scr/2006/cr0624.pdf.
__________, 2005e, “Malawi—Request for a Three-Year Arrangement Under the Poverty Reduction and Growth Facility,” EBS/05/113, July, (Washington: International Monetary Fund), available at http:/www.imf.org/external/pubs/ft/scr/2005/cr05285.pdf.
__________, 2005f, “Benin—Request for a Three-Year Arrangement Under the Poverty Reduction and Growth Facility,” EBS/05/114, July, (Washington: International Monetary Fund), available at http:/www.imf.org/external/pubs/ft/scr/2005/cr05288.pdf.
__________, 2005g, “Review of PRGF Program Design,” SM/05/304, August, (Washington: International Monetary Fund), available at http://www.imf.org/external/np/pp/eng/2005/080805r.htm.
__________, 2005h, “The Macroeconomics of Managing Increased Aid Inflows—Experiences of Low-Income Countries and Policy Implications,” SM/05/306, August, (Washington: International Monetary Fund), available at http://www.imf.org/external/np/pp/eng/2005/080805a.pdf.
91
__________, 2005i, “IMF Technical Assistance Evaluation—Public Expenditure Management Reform in Selected African Countries,” SM/05/313, August, (Washington: International Monetary Fund), available at http://www.imf.org/external/pubs/ft/scr/2006/cr0667.pdf.
__________, 2005j, “2005 Review of the Poverty Reduction Strategy Approach—Balancing Accountabilities and Scaling Up Results,” SM/05/331, Supplement 1, August, (Washington: International Monetary Fund), available at http://www.imf.org/external/np/pp/eng/2005/091905s.htm.
____________, 2005k, “The Acting Chair’s Summing Up—Review of PRGF Program Design,” BUFF/05/148, September, (Washington: International Monetary Fund).
__________, 2005l, “The Acting Chair’s Summing Up—2005 Review of the Poverty Reduction Strategy Approach—Balancing Accountabilities and Scaling Up Results—Synthesis,” BUFF/05/154, September, (Washington: International Monetary Fund).
__________, 2005m, “Implementation of the Policy Support Instrument,” Report prepared by the Policy Development and Review and Legal Departments, September, available at: http://www.imf.org/external/np/pp/eng/2005/061005.htm.
__________, 2005n, “Central African Republic—Staff Report for the 2005 Article IV Consultation,” SM/05/368, October, (Washington: International Monetary Fund), available at http://www.imf.org/external/pubs/scr/2005/cr05424.pdf.
__________, 2005o, “The Chairman’s Summing Up—Implementation of the Policy Support Instrument,” Buff/05/161, October, (Washington: International Monetary Fund).
__________, 2005p, “Mali—Staff Report for the 2005 Article IV Consultation, Second and Third Review Under the Poverty Reduction and growth Facility, and Request for Waiver of Nonobservance of Performance Criteria,” EBS/05/172, December, (Washington: International Monetary Fund), available at http://www.imf.org/external/pubs/scr/2006/cr0673.pdf.
__________, 2005q, “Zambia—Staff Report for the 2005 Article IV Consultation, Third Review Under the Three-Year Arrangement Under the Poverty Reduction and Growth Facility, Request for Waiver and Modification of Performance Criterion, and Financing Assurances Review,” EBS/05/199, December, (Washington: International Monetary Fund), available at http://www.imf.org/external/pubs/scr/2006/cr0639.pdf.
__________, 2005r, “The Acting Chair’s Summing Up—Multilateral Debt Relief Initiative and Exogenous Shocks Facility—Proposed Decisions,” BUFF/05/194, December, (Washington: International Monetary Fund).
__________, 2006a, “Guide for IMF Staff Outreach to Legislators,” External Relations Department, January, (Washington: International Monetary Fund).
92
__________, 2006b, “Rwanda—Ex Post Assessment of Longer-Term Program Engagement,” SM/06/5, January, (Washington: International Monetary Fund).
__________, 2006c, “United Republic of Tanzania—Ex Post Assessment of Longer-Term Program Engagement,” SM/06/117, March, (Washington: International Monetary Fund), available at http://www.imf.org/external/pubs/ft/scr/2006/cr06198.pdf.
__________, 2006d, “United Republic of Tanzania—Fifth Review Under the Three-Year Arrangement Under the Poverty Reduction and Growth Facility,” EBS/06/41, March, (Washington: International Monetary Fund), available at http://www.imf.org/external/pubs/ft/scr/2006/cr06138.pdf.
__________, 2006e, “Review of Low-Income Country Debt Sustainability Framework and Implications of the Multilateral Debt Relief Initiative (MDRI),” SM/06/123, March, (Washington: International Monetary Fund).
__________, 2006f, “The Federal Democratic Republic of Ethiopia—Selected Issues and
Statistical Appendix,” April (Washington: International Monetary Fund), available at http://www.imf.org/external/pubs/ft/scr/2006/cr06122.pdf.
__________, 2006g, “A Handbook for the Staff on PRGF Arrangements,” PDR document updated in May 2006, (Washington: International Monetary Fund).
__________, 2006h, “Staff Report Checklist—POD Review Work,” PDR document revised in May 2006, (Washington: International Monetary Fund).
__________, 2006i, “Initiative for Heavily Indebted Poor Countries (HIPC) and Multilateral Debt Relief Initiative (MDRI)—Status of Implementation,” SM/06/289, August (Washington: International Monetary Fund), available at http://www.imf.org/external/np/pp/eng/2006/082106.pdf.
__________, 2006j, “Burkina Faso—Ex Post Assessment of Long-Term Engagement,” SM/06/294, August, (Washington: International Monetary Fund).
__________, 2006k, African Times: News, Views and Events in the IMF's African Department, Vol. 3, No.5, May.
__________, 2006l, “Development Committee: The Managing Director’s Written Statement,” September, (Washington: International Monetary Fund), available at http://www.imf.org/external/np/pp/eng/2006/091506d.pdf.
__________, 2006m, “IMF in Focus,” IMF Survey, September (Washington: International Monetary Fund).
__________, 2006n, “Ghana—Sixth and Final Review Under the Three-Year Arrangement Under the Poverty Reduction and Growth Facility and Request for Waiver of Nonobservance of Performance Criterion,” EBS/06/132, October, (Washington: International Monetary Fund).

93
International Monetary Fund and World Bank, 2003, “Bank/Fund Collaboration on Public Expenditure Issues,” Prepared by IMF’s Fiscal Affairs Department and the World Bank’s Poverty Reduction and Economic Management Network, February, (Washington: World Bank and International Monetary Fund), available at http://www.imf.org/external/np/fad/pubexpen/2003/021403.htm.
__________, 2004 “Strengthening IMF-World Bank Collaboration on Country Programs and Conditionality—Progress Report,” SM/04/57, February, (Washington: World Bank and International Monetary Fund), available at http://www.imf.org/external/np/pdr/cond/2004/eng/022404.pdf
__________, 2006 “Review of Low-Income Country Debt Sustainability Framework and Implications of the Multilateral Debt Relief Initiative (MDRI),” SM/06/123, March, (Washington: World Bank and International Monetary Fund), available at http://www.imf.org/external/np/pp/eng/2006/032406.pdf.
Kpodar, Kangni, 2006, “Distributional Effects of Oil Price Changes on Household Expenditures: Evidence from Mali," IMF Working Paper No.06/91 (Washington, International Monetary Fund), available at http://www.imf.org/external/pubs/ft/wp/2006/wp0691.pdf.
Köhler, Horst, 2002, “The Monterrey Consensus and Beyond: Moving From Vision to Action,” Statement by the Managing Director, IMF, March, available at http://www.imf.org/external/np/speeches/2002/032102.htm
Mackinnon, John, et al., 2003, “Poverty and Social Impact Assessment. The Impact of Increases in Public Expenditure on Poverty in Rwanda,” Study commissioned by DFID (Oxford: Oxford Policy Management).
Mattina, Todd, D., 2006, “Money Isn’t Everything: The Challenge of Scaling Up Aid to Achieve the Millennium Development Goals in Ethiopia,” IMF Working Paper No.06/192, (Washington, International Monetary Fund), available at http://www.imf.org/external/pubs/ft/wp/2006/wp06192.pdf.
Newhouse, David, 2006, “Evaluating the Distributional Effects of Electricity Subsidies in Burkina Faso, May (Washington: International Monetary Fund).
Newhouse, David and Alejandro Simone, 2005, “Djibouti: The Distributional Impact of Devaluation,” August, (Washington: International Monetary Fund).
OECD, 2005, “Paris Declaration on Aid Effectiveness,” March, (Paris: OECD), available at http://www.mfdr.org/sourcebook/2-1Paris.pdf.
OECD/DAC, 2005, “Baselines and Suggested Targets for the 12 Indictors of Progress—Paris Declaration on aid Effectiveness,” August (Paris: OECD), available at http://www.oecd.org/dataoecd/45/46/35230756.pdf.
94
__________, 2006, “Aid from DAC members,” (Paris: OECD), available at http://www.oecd.org.
Ooms, Gorik and Ted Schrecker, 2005, “Expenditure Ceilings, Multilateral Financial Institutions, and the Health of Poor Populations,” The Lancet, Vol. 365, May 21.
Oxfam International, 2003, “The IMF and the Millennium Goals. Failing to Deliver for Low Income Countries,” Oxfam Briefing Paper, 54.
__________, 2005, “Beyond HIPC—Debt Cancellation and the Millennium Development Goals,” Oxfam Briefing Paper, 78.
__________, 2006, “Kicking the Habit: How the World Bank and the IMF are Still Addicted to Attaching Economic Conditions to Aid,” Oxfam Briefing Paper, 96.
Perone, Perry, 2006, “A Response to Joseph Hanlon’s Recent Article, Donor Concern over IMF Cap on Aid Increases,” Letter from IMF’s Resident Representative to Mozambique, available at http://www.imf.org/external/np/vc/2006/020706.htm.
Physicians for Human Rights, 2004, “An Action Plan to Prevent Brain Drain: Building Equitable Health Systems in Africa,” available at http://www.phrusa.org/publications/aids.html.
Radelet, Steven, 2006, “IMF Facilities for Post Stabilization in Low-Income Countries,” Chapter 20 in Reforming the IMF for the 21st Century, Special Report 19, (Washington: Institute for International Economics).
Robb, Caroline M. Kende, 2003, “Poverty and Social Impact Analysis—Linking Macroeconomic Policies to Poverty Outcomes: Summary of. Early Experiences,” IMF Working Paper 03/43 (Washington: International Monetary Fund), available at http://www.imf.org/external/pubs/ft/wp/2003/wp0343.pdf.
Sachs, Jeffrey, 2005, The End of Poverty: Economic Possibilities in Our Time, Penguin Group USA.
__________, 2006, “IMF can help to end shortfalls in aid that threaten death to the poor,” Letter to the Editor in Financial Times, January 5.
Simone, Alejandro, 2004, “Mali: Assessing the Poverty Impact of Macroeconomic Shocks,” November (Washington: International Monetary Fund).
Weeks, John and Terry McKinley, 2006, “Does Debt Relief Increase Fiscal Space in Zambia? The MDG Implications,” Country Study 5, International Poverty Centre, UNDP.
95
Wood, Angela, 2005, “Back to Square One. IMF Wage Freeze Leaves Zambian Teachers out in the Cold. Again,” Briefing paper, Global Campaign for Education, available at http://www.campaignforeducation.org/resources/Jun2005/back_to_square_one_tcm8-4743.pdf.
__________, 2006, “IMF Macroeconomic Policies and Health Sector Budgets,” available at www.bothends.org/politiekcafe/polcaf27-Synthesis_Report.pdf.
World Bank, 2004, Country Policy and Institutional Assessment Database, available at
http://siteresources.worldbank.org/IDA/Resources/2004CPIAweb1.pdf.

DOCUMENT OF INTERNATIONAL MONETARY FUND AND FOR OFFICIAL USE ONLY
BUFF/07/23
February 22, 2007
Statement by the Managing Director on the Independent Evaluation Office Report on the IMF and Aid to Sub-Saharan Africa
Executive Board Meeting March 5, 2007
1. We welcome the IEO report on the IMF and Aid to Sub-Saharan Africa (SSA) as an important contribution to making the Fund’s engagement with low-income countries more effective. The report’s candid assessments and useful recommendations will help management and the Board clarify further the institution’s mandate and policies to help SSA achieve growth and reduce poverty. The report should be considered in the context of the Fund’s Medium-Term Strategy (MTS), which reiterates the Fund’s commitment to low-income countries and sets out the framework for more focused engagement in those countries.
2. It is encouraging that the IEO report confirms the improvement in macroeconomic performance that has taken place in Sub-Saharan African (SSA) countries in recent years, and notes that this is due in part to the advice and actions of the Fund. The report acknowledges that Sub-Saharan Africa (SSA) has experienced a period of unprecedented high growth and low inflation, which in turn contributed to a reduction in poverty. While several factors were at play, the Fund’s policy advice was instrumental in promoting sound macroeconomic policies and in better accommodating the use of aid. In addition, the HIPC Initiative and MDRI have greatly reduced debt-related vulnerabilities and the costs of debt servicing, thus enabling the more effective use of increased aid.
3. The report recognizes that through the Poverty Reduction and Growth Facility, the Fund has delivered in those areas that are its primary responsibility—promoting macroeconomic stability and high quality growth. There were many improvements in the Fund’s assistance to low-income countries as the Fund moved from the enhanced structural adjustment facility (ESAF) to the PRGF. The report notes, for example, the promotion of higher domestic resource mobilization and higher social spending, including through the introduction of program floors on such spending. It highlights, in particular, the improvements in the Fund’s efforts to support fiscal governance. The report also recognizes the continued evolution in the Fund’s policy advice in the face of changing circumstances, including helping low-income countries to manage the macroeconomic challenges of using aid as effectively as possible. In light of these improvements, we would take issue with the report’s assessment that practices under the PRGF have gravitated back to “business as usual”.
2
4. The Fund’s engagement in low-income countries has been and will continue to be focused on its core mandate of providing advice and support for sound macroeconomic policies as a prerequisite to sustained poverty reduction. We would have expected performance to be evaluated against the Fund’s mandate in SSA, but in some instances, the report evaluates Fund performance in terms of the expectations of external stakeholders—thus complicating the interpretation of some of the findings. For example, the report finds limited progress in Fund-supported programs in incorporating distributional issues. However, distributional policies generally lie outside the Fund’s core mandate. In fact, the Fund’s role in this area is not direct action, but rather to be a cooperative partner with those whose expertise is in fighting poverty, most notably the World Bank. This is also consistent with the Fund’s engagements under the Monterrey Consensus. It has always been expected, for example, that poverty and social impact analysis (PSIA) would be conducted by other agencies in the context of the PRSP process (and then utilized by Fund staff in the design of programs). We accept the report’s view, however, that there is scope for further clarifying this point, especially in our external communications.
5. The report also finds that the Fund has played a limited role in the international effort to mobilize more aid, in part because of mixed guidance from the Fund’s Executive Board. This finding underscores the importance of further clarification by the Board regarding the Fund’s mandate and policies on several aid-related issues.
6. We agree with the report’s emphasis on the importance of accommodating higher aid flows through higher spending and net imports, while underscoring that this should not jeopardize macroeconomic stability. The report finds that, in line with Board-approved policies, PRGF-supported programs have generally accommodated the use of new aid in countries with adequate reserves and moderate inflation. By contrast, the report finds that in countries with low foreign exchange reserves levels and high inflation a portion of the aid was saved. Resolving problems of macroeconomic instability, inadequate reserves, or unsustainable debt burdens, is at the heart of Fund work. In some cases, reserves were previously so low that they could not safeguard against shocks; in other cases, the build-up in reserves was of a more temporary nature and thus did not allow resources to be used effectively over time. The Fund’s strategy will therefore continue to be implemented on a case-by-case basis—with the general objective being to bring all its low-income members to a situation in which aid can be fully absorbed and effectively spent.
7. The report’s suggestion that institutional communications should be more consistent with Board-approved operational policies is well taken. Efforts are underway to strengthen this process significantly. For example, the African Department has developed a strengthened external communications strategy, comprising both country-specific and general policy messages. More generally, there has been a stepped-up internal communications effort across the Fund to better align staff understanding with institutional priorities.

3
8. Going forward, we will build on our commitment to support low-income countries as laid out in the Medium-Term Strategy. In particular, the 2006 report on implementing the MTS notes: “the Fund’s policy advice, capacity building, and financial assistance should focus on macro-critical issues, including institutions relevant to financial stability and economic growth. It is true that macroeconomic policies and institutions are only part of the story, and that these do not necessarily translate into growth and poverty reduction unless a more multi-disciplinary view of development is taken. But, equally, a relatively small international institution such as the Fund cannot be engaged in too many areas without compromising effectiveness—including in its core macroeconomic mandate.”
9. In this context, Fund management agrees with the thrust of the IEO’s three specific recommendations.
• The first recommendation calls for further clarification by the Executive Board on several aid-related issues, including the mobilization of aid, alternative scenarios, PSIA, and pro-poor and pro-growth budget frameworks. We look forward to the Board’s guidance on this in the context of the discussions of the IEO report and forthcoming staff papers on related topics.
• The second recommendation calls on management to establish transparent mechanisms for monitoring and evaluating the implementation of the clarified policy guidance. While there already exists a well-developed internal review process to ensure that Board directives are consistently implemented across countries, we agree that there is merit in strengthening mechanisms for follow up, such as ex-post assessments of past Fund arrangements and broader stocktaking in the context of periodic Board reviews of the PRGF.
• The third recommendation calls for a clarification of expectations—and resource availabilities—for resident representatives’ and missions chiefs’ interactions with local donor groups and civil society. The generally positive assessment by the country authorities of their working relationship with the Fund is encouraging. However, the more mixed responses from donor groups indeed call for improved coordination and communication. We also need to engage better with other external stakeholders, including civil society organizations and parliamentarians. Given the constraints on staff time and budget, this needs to be done in a strategic way.
10. Following the Board discussion of this IEO report, and consistent with the new policies governing the work of staff in response to IEO reports, we will return to the Board with a detailed and costed work plan. Under the Fund’s work program, the Board is already scheduled to discuss several staff papers over the next few months that will consider most of the issues raised in the IEO report—including the role of the Fund in the PRSP process, donor collaboration and management of aid flows and issues relating to program design in low-income countries. We anticipate that these discussions, in addition to the

4
lessons learned from the IEO report, will help improve the Fund’s effectiveness in low-income countries. We will consider and report to the Board any needed modifications to our work program in order to address the issues raised by this report and in light of the Board’s guidance.
11. Again, Fund management welcomes the IEO report and we look forward to building on its lessons learned. The accompanying staff comments provide some further detailed responses to the IEO’s findings and recommendations.
DOCUMENT OF INTERNATIONAL MONETARY FUND AND FOR OFFICIAL USE ONLY
BUFF/0724
February 22, 2007
Staff Response to the Independent Evaluation Office Report on the IMF and Aid to Sub-Saharan Africa
Executive Board Meeting March 5, 2007
The IEO report underscores the challenges and complexities of the Fund’s work related to both the availability of aid for countries in Africa and its effective use. The report contains insightful analysis, and staff concurs with many of its findings, conclusions, and recommendations, which will prove helpful in our ongoing efforts to define more clearly the institution’s mandate and strengthen its effectiveness. The recommendations should be considered in the context of the Fund’s Medium-Term Strategy (MTS), which sets out the framework for more focused engagement in low-income countries. The MTS has launched a process that will address substantive aspects of the IEO report’s recommendations and these findings will be useful in ensuring that the MTS work is focused on the right problems. The report acknowledges that Sub-Saharan Africa (SSA) has experienced a period of unprecedented high growth and low inflation, contributing to a reduction in poverty. Most of the report presents the improved performance in SSA as part of the “external context” in which the Fund’s work in low-income countries took place, rather than analyzing the extent to which PRGF-supported programs, or other forms of Fund assistance, contributed to this outcome. While several factors were at play, the Fund’s policy advice was instrumental in promoting sound macroeconomic policies and accommodating the effective use of aid. This advice was complemented by the Fund’s extensive technical assistance on a range of fiscal, monetary and financial sector issues. In addition, the HIPC Initiative and MDRI have greatly reduced debt-related vulnerabilities and the costs of debt servicing, thus increasing fiscal space. The report also acknowledges that the Fund has made progress in projecting aid inflows in the face of a changing and sometimes uncertain aid environment, and has catalyzed aid through the PRGF’s macroeconomic assessment. The report speaks throughout of considerable learning and adaptation in a range of areas, including a flexible approach to accommodating aid and a stronger pro-poor focus. Many specific improvements are discussed (for example, the promotion of higher domestic resource mobilization, floors for social spending, support for fiscal governance, and more relaxed program adjusters). In this context, the finding that the Fund “gravitated back to business as usual” by the end of the period seems at odds with the discussion in the main body of the paper.
In general, the interpretation of some findings is complicated by ambiguity about the evaluation standard utilized. The expected measure of the Fund’s performance would be its mandate as given by the Executive Board or stated by management. While the report

2
sometimes uses this as an evaluation standard, in many instances Fund performance is evaluated against the expectation of a subset of external stakeholders. We recognize that part of the report’s criticism relates to areas in which the mandate is ambiguous, but in several instances the report could have been more explicit about whose expectations were or were not fulfilled. Also, while the Fund’s mandate as defined by the Board provides a benchmark for part of the assessments, the IEO’s interpretation of this mandate does not always coincide with staff’s reading of the Board’s directions. PRGF-supported programs focus on macroeconomic stability and growth, which in turn will support the desired goals of higher living standards and poverty reduction. The “poverty-reduction orientation” of the PRGF, and the choices made by management and staff to help countries reduce poverty, need to be understood with these overarching directives in mind, and specific criticisms made by the IEO should be evaluated in that light: • The Fund’s role in mobilizing and advocating a scaling up of aid is a central topic of
this report. The IEO notes that the Fund has done little to mobilize aid, while acknowledging that this is an area in which the Board has not given staff a clear mandate. At the same time, Fund staff are expected to make sure that each program approved by the Board is “fully financed”. Here we recognize that clarifying the meaning of the term “fully-financed” in the context of a growth-oriented development strategy will be important.
• Implicit in the report’s analysis is also a supposition that the Fund should be more active in helping countries confront distributive issues associated with programming for higher growth. But again guidance from the Board has made it clear that while the Fund should be mindful of the distributive consequences of the programs it supports, the Fund is not intended to be the lead agency on a wide range of policies that impinge upon distribution—this mandate lies with the Bank and other donors.
• Finally, Fund staff should incorporate, whenever available, good-quality poverty and social impact analysis (PSIA) into its advice and programs. However, Fund staff is not responsible for conducting PSIA—even though staff has conducted limited PSIAs in house on an ad-hoc basis when resources allowed, focusing largely on reducing costly and inefficient transfers or subsidies or mitigating the impact of fuel price increases on vulnerable groups. We accept, however, the report’s view that there may still be scope for enhancing coordination with the World Bank on the use of PSIA in program design. In this context, we would note that the finding that Fund staff considered that the Bank did not always provide timely and quality PSIA, points to the initial lack of clarity on the role of the Bank rather than to the substance of the Bank’s work per se. We would also note some additional successful examples of Bank-Fund collaboration on PSIA, such as on Ghana (electricity reform) and Burkina Faso (cotton sector reform).
3
The Accommodation of Aid Inflows We appreciate the report’s emphasis on the importance of accommodating higher aid, through higher spending and net imports. Indeed, as noted in the report, Board guidance fully supports a “spend and absorb” strategy for countries where it is compatible with maintaining macroeconomic stability. However, the report’s suggestion that the Fund had promised a “shift in program design with respect to the programmed absorption of increased aid” (paragraph 13) needs to be nuanced because, under the PRGF, securing macroeconomic stability and limiting financial vulnerabilities continue to be the primary objectives of program design, in part by building up a prudent reserve buffer. While countries are establishing stability, full spending and absorption may not be the best path to sustained growth and poverty reduction. The Fund has indeed modified its program design in the post-stabilization countries (so called mature stabilizers), where the objective has shifted from stabilization to accelerated growth. The question then is whether the Fund’s approach to accommodating aid use has gone far enough, fast enough. One could read the report as advocating that immediate spending and absorption of aid is always the preferred strategy; for example, the report suggests that the Fund has unduly blocked the use of aid in some countries with low reserves. We prefer to emphasize a strategy that, as countries emerge from instability, could include saving part of aid inflows as a prudent and fully justifiable policy—for example, to build up an external reserve buffer, curb an excessive debt burden, smooth expenditures over time in the context of aid volatility and limited absorptive capacity, or support disinflation.1 On a more technical note, while the quantitative analysis of the programmed use of aid is innovative and thought-provoking, its methodology and scope do not permit an assessment of whether Fund programs are accommodating the use of aid over time, in the context of a multi-year strategy. In particular: • The analysis of the link between aid and spending and absorption is static. It suggests
that in countries with problems of macroeconomic instability part of aid is programmed to be saved. This policy is good when it leads eventually to a situation where aid can be fully absorbed and spent—but the analysis gives us no insight into this.
• The focus on the immediate (i.e., same-year) use of increases in aid implies that any attempt at expenditure smoothing will show up as less than full spending and absorption.2
1 In this context, the repeated reference to a minimum level of reserves equivalent to 2 or 3 months of imports (which is modest in light of the prevalence of shocks) as “high” gives the impression that Fund teams were overly zealous.
2 See Appendix 1 for an overview of further problems related to the methodology for estimation.

4
Aid projections We see merit in the report’s call for greater transparency about the derivation of the Fund’s aid forecasts. Fund projections have broadly reflected the changing aid environment, adapting to the evidence of scaling up in certain countries in recent years. In addition, we were encouraged by the important finding that aid forecasts are accurate for the program period one year ahead, which has the largest operational relevance. Nonetheless, the report’s finding that it is hard for readers to understand the nature of the projections in Fund-supported programs calls for better explanations of the program strategy. In particular, in the absence of longer-term commitments by donors, outer-year Fund projections tend to be more cautious. Against this background, Fund-supported programs are being updated frequently (usually at least every six months), while outer-year projections have less operational impact. Moreover, in the context of aid uncertainty, the authorities often prefer cautious projections, avoiding costly disruptions to the budget process (for example through start-and-stop projects).
We concur on the importance of the authorities, with the input of the Fund and other partners, developing alternative macroeconomic frameworks, based on different scenarios for aid inflows. PRGF-supported programs are necessarily based on a single baseline scenario to guide authorities in their immediate economic policy decision making, while being subject to frequent revision as the external environment, including aid allocations, changes. At the same time, there has been increasing use of alternative scenarios in PRSPs, debt sustainability analyses, and Fund surveillance reports, as encouraged by the Board, and more should be done in that context.
The “Key Features” Agenda and the PRSP 3 The valid concerns expressed in the IEO report concerning the social impact of economic policies under PRGF-supported programs need to be taken up in the context of PRSPs, where these issues are considered by country authorities, in consultation with other stakeholders. The PRGF was expected to draw heavily on the PRSP on such issues as the identification of pro-poor spending, prioritization of expenditures, PSIA, absorptive capacity, and alternative expenditure scenarios. Accordingly, weaknesses in these areas can often be traced to the PRSP process (in which admittedly the Fund needs to play a key role), and in some cases the underlying issue may be need for more effective country/Bank/Fund collaboration in the PRSP context. • The need to undertake an analysis of absorptive capacity constraints for sectoral
programs points to a tension in the agreed division of labor between the Fund and the Bank. The report first notes that the Fund's relative lack of "attention to aid absorptive capacity constraints in education, health, or infrastructure, where the Bank is the lead agency" is in line with this division of labor, but then goes on to note that
3 The IEO report takes as a benchmark the “Key Features” agenda, a list of elements of PRGF program design that support the specific focus of these programs on growth and poverty alleviation anchored by the PRSP.
5
this was a "missed opportunity for considering synergies between areas where the Bank has the lead on one issue and the Fund on another.” The intimate link between microeconomic and macroeconomic policies in this area requires a closer institutional cooperation than now exists, as also recognized in the MTS. The suggestions for improved cooperation in the report are useful in this regard.
• Concerns about overly-constraining definitions of priority spending will also need to be addressed through the PRSPs, where such spending is defined. It should be noted that the Fund, with the donor community, has shown flexibility in the definition of priority spending in countries where the authorities’ definition has evolved. In particular in the area of infrastructure, in order to determine whether spending can be considered as priority or pro-poor, the Fund has to follow the advice from other experts. A further observation is that there appears to be some tension between the statements in the IEO report that: (i) staff did not systematically encourage pro-poor budget provisions, (ii) the authorities considered that staff put too much emphasis on pro-poor spending.
• In summary, the suggestion that the Fund has “done little to take into account spending composition issues” merits qualification. In the division of responsibilities between the Bank and the Fund, the Bank is the lead agency in expenditure composition issues. However, within this framework, the Fund has been active on expenditure allocation concerns.4 Indeed, as noted in the report, Fund efforts have helped to ensure that poverty-reducing spending expanded rapidly during the evaluation period (in fact, some authorities considered that staff put too much emphasis on pro-poor spending). In addition, recourse to wage bill ceilings reflected, in part, a concern to ensure that sufficient resources should be directed to priority non-wage or capital outlays. At the same time, recent Fund guidance to mission chiefs in SSA countries has been to discourage the use of wage ceilings, given their blunt nature.5
Communications Strategy and Coordination with Donors The report’s overall finding of a disconnect in external perceptions between the Fund’s rhetoric on aid and its actual work at the country level calls for improvements in the Fund’s communications. Future efforts should comprise both the clarification of the Fund’s mandate, in the context of the MTS, and better communication on discussions and policies at the country level. These steps can build on recent work to strengthen external outreach. In 4 The report could have mentioned the Fund’s analytical work and pilot studies on public investment (including for Ethiopia and Ghana) and public private partnerships.
5 In addition, country authorities have sometimes found wage ceilings useful instruments to help address wage pressures, overstaffed civil services, strong unions, or sectoral lobbies.
6
particular, in 2004 the African Department developed an external communications strategy comprising both country-specific and general policy messages. An External Communications Team comprising staff from the African and External Relations Departments has been established and country-specific strategies developed for eight countries. In this context, the relatively positive assessment by the authorities of their working relationship with the Fund is important. The authorities are the Fund’s primary counterpart, as the Fund’s role is to target macroeconomic stability and growth through policy advice, financial support, and capacity building. A strong working relationship with the authorities is essential, and it appears the Fund has established that with its primary counterparts in the government (usually, the Ministry of Finance and Central Bank). However, in recent years, missions have regularly reached out to a broader set of ministries, including health and education, and to other official institutions. The need to improve coordination with donors is of particular concern. Effective communication between Fund country teams and donors is critical for both sides to be effective in assisting LICs. These relationships are inherently complex, given the diversity of operations across the donor community. The Fund and donors are aware of coordination difficulties, and the Fund will continue to be an active participant in the international effort to work for better donor coordination in the context of the 2005 Paris Declaration. It is also important to recognize the complexity of improving relationships with local NGOs. As the report recognizes, time constraints may not allow meeting them all, and the views of the authorities have to be considered. In the face of an extensive and diverse NGO community, better prioritization of outreach efforts is needed. In this context, the usefulness of developing regular communications between Fund country teams and parliamentarians also deserves mention. Recommendations In line with the above observations and assessments, staff concurs with each of the recommendations of the IEO Report. The first recommendation calls for further clarification by the Executive Board of the Fund’s mandate and policies on several aid-related issues. The IEO report demonstrates the scope for defining more clearly the Fund’s commitments to outside stakeholders. In addition, on several issues, staff would benefit from greater clarity in their mandate, building on the MTS, in particular concerning the Fund’s role in aid mobilization. The IEO suggests that further guidance should also cover thresholds for spending and absorption of aid increases, but general thresholds cannot properly take into account the wide variety of country-specific considerations (concerning, for example, absorptive capacity, macroeconomic vulnerabilities, the monetary and exchange rate regime, and the budgetary framework). Accordingly, guidance should focus on clarifying the conceptual framework and agreed best practices, which can then be applied for each country. In this context, the upcoming Board reports on the PRSP process, on aid inflows and program design, on the appropriate fiscal framework for managing scaled-up aid, and on public financial
7
management issues in the context of scaled-up aid flows should provide useful vehicles for beginning to address this recommendation. We also welcome the auxiliary recommendation to ensure the consistency of institutional communications with Board approved operational policies. The Fund’s External Relations Department has initiated such a process, by putting in place new procedures to integrate better Fund operations with communications. The second recommendation aims to establish transparent mechanisms for monitoring and evaluating the implementation of clarified policy guidance. In this context, we note that a well-developed internal review process is in place to ensure that Board directives are consistently implemented across countries. We acknowledge, however, the case for additional mechanisms, in particular to address external concerns. In this context, we concur that both ex-post assessments of past Fund arrangements for specific countries and a broader review of such issues in the context of periodic Board reviews of the PRGF could be helpful. The report’s final recommendation calls for a clarification of expectations—and resource availabilities—for resident representatives' and mission chiefs' interactions with local donor groups and civil society. As noted above, the mixed responses from donor groups are of particular concern and warrant new efforts to improve communication and coordination. The Fund will seek to address the serious and complex challenges to missions and resident representatives posed by the changing aid modalities and decentralization of donor operations, while also taking into account budget and staffing constraints. In this context, we note that the IEO report does not consider the need for prioritization in the current budgetary environment.
8
Appendix 1. Comments on the Quantitative Analysis of the Use of Aid Increases
In addition to the problems identified in the main text, several additional problems also impinge on the estimation and interpretation of the degree to which higher programmed aid inflows are accommodated in the form of increased fiscal spending and current account deficits. In particular, • The focus on averages and regression results in analyzing the degree spending and
absorption of aid in program design could be misleading. For example, if all countries either “spend and absorb” or “don’t spend and don’t absorb”, the average would show partial spending and partial absorption. The latter pattern would then be presented as the typical case, even though no country actually exhibited this behavior.
• The regressions supporting the results emphasized in the report exclude the constant term—a choice that may lead to biased estimates and incorrect inference.
• While the report suggests that programmed aid-based spending is limited if inflation exceeds 5-7 percent, efforts to reduce high domestic government borrowing may actually be driving this result. In the econometric estimation, macroeconomic conditions are always proxied by inflation. However, this abstracts from the potentially important role of high domestic public sector borrowing, which is often the cause of high inflation. In our view, this omission is sufficiently important to cast substantial doubt on any policy conclusions based on the results.
• The report does not always take account of the interaction of absorption and spending decisions. For instance, in Appendix B, the equations are estimated separately for absorption and for spending. However, from a policy perspective, the degree of absorption and spending are codetermined (for example, higher inflation can be related to a reluctance to absorb previous aid flows, leading to excessive liquidity injections as this aid was spent. In this situation, it would be wise to program lower spending, but because of the low expected absorption, not because of the high inflation per se).
• A question stems from the approach to measuring aid projections against outturns using the ratio of aid to GDP. The analysis does not indicate the reason for deviations between predictions and outcomes; is it a result of under-estimating nominal aid or over-estimating real GDP growth?
The analysis would have benefited from a distinction between the different types of aid delivery and a discussion of their treatment under Fund programs (i.e., “budget” versus “project” support). Program targets generally accommodate project disbursements in full, given that these are directly tied to specific project expenditures—usually with a large import content—and may be subject to specific procedures with individual donors. By contrast, fiscal targets and program adjustors typically apply to budget support, which is not linked to

9
specific outlays and may be less predictable in timing and amounts, particularly in outer years (i.e., given donor budget cycles). This distinction—full accommodation for project disbursements and targets and adjustors for budget support—might also have helped address some of the “disconnect in external perceptions”. It could also explain part of the apparent “bias” against infrastructure spending, since infrastructure spending tends to be linked to project disbursements, which are not offset when they are delayed or do not take place.

10
Appendix 2. Factual corrections/typos • The claim in footnote 4 that the (usually zero) limits on nonconcessional borrowing
have generally not been binding (and, by implication, superfluous) is tenuous. The binding nature of zero limits can not be observed directly. Moreover, there have been several cases in which these limits were breached.
• Paragraph 11 of the report suggests that there has not been significant poverty reduction in the 29 SSA PRGF countries, over the 2000-2005 period that the review largely focuses on. This claim is based on Chen and Ravallion (2004). However the data used in the latter study end in 2001 (see panel viii of Box 1 of the report). One might expect that in 2001-2005, some poverty reduction was achieved in the SSA PRGF countries, as per capita income rose significantly (see panel vii of Box 1).
• Debt sustainability analysis using the Fund’s standard framework for analyzing debt dynamics for low-income countries is mandatory for all low-income countries and is, thus, not limited to HIPC cases (paragraph 21).
• There is an inconsistency in the language of the third bullets of paragraphs vii and 98. The authors give a sensible account of experience with PSIA in these bullets and also in paragraphs 48-51 that indicates the constraints on the Fund’s involvement and stops short of blaming anyone. However, when one looks at the beginning of the last sentence of the bullets, the use of ‘also’ implies that this experience is an example of weak Bank-Fund collaboration, which is not really the case. We would drop the "also."
Country-Specific Comments Benin • Page 16, footnote 44: Benin has not had any formal conditionality (floor) on poverty
reducing expenditure under its PRGF-supported programs (current and past). However, under the 2002-05 PRSP, spending for priority sectors (education and health, agriculture, public works and energy, and water management) was targeted at 28 percent of total spending.
Cameroon • Page 62, paragraph 15: Cameroon did not have a ceiling on the wage bill but rather
on goods and services. The reference in this paragraph should be nuanced in line with Table C4 (page 67).
Ghana • Page 32: Staff’s data do not show a projected increase in aid over the medium-term.

11
• Page 24: On non-concessional borrowing, the correct formulation is that the authorities are interested in nonconcessional borrowing only after exhausting all concessional financing sources and for high-return investment projects.
• Page 61, para.11: Ghana also belong to the group of countries where discussion of the exchange rate included discussions of productivity, and efficiency reforms to increase competitiveness.
• Page 61: The size of the fiscal deficit was not a performance criterion in Ghana's 2003-06 PRGF. The performance criterion was on net domestic financing of the government.
• Page 61-62, paragraph 14: The report mentions that the revenue ratio was a program conditionality, which was not the case.
• Page 76, paragraph. 20: Same revision as regards page 24 above on non-concessional borrowing. In addition to discussion of this issue in the Consultative Group, the issue was also discussed in the context of some review missions.
• Table C6. In the case of Ghana, it should be noted that the PSIA was completed ex ante (before the petrol pricing reform in February 2005) rather than ex post. Indeed, the countervailing measures adopted by the authorities were largely drawn from the findings of PSIA carried out by FAD.
Malawi • Page 16, Footnote 44: Malawi does not have any conditionality (floor) on poverty
reducing expenditure under the current 2005 PRGF arrangement. For the 2000 PRGF arrangement, neither the original program nor the 2003 first review included conditionality (floor) on poverty reducing expenditure.
• Page 17, paragraph 42, last sentence: under the current 2005 PRGF arrangement, program adjustors allowed for increased central government discretionary expenditures in the event of higher than programmed health SWAp-financed other recurrent expenditures, and allowed for increased spending on central government wages and salaries in the event of higher than programmed health SWAp-financed wage expenditures. Poverty reducing expenditure was not a quantitative target in the 2000 PRGF arrangement and hence there were no adjustors.
• Page 19, paragraph 50: the report is correct that program documents (to date) have not indicated any countervailing measures linked to PSIAs. However, this is largely because the fertilizer PSIA was undertaken in February 2006 and the last issued staff report was in August 2006. However, as of now, the government has not indicated whether it would adopt the recommendations of the PSIA.
• Page 61, paragraph 13: Malawi has not had any conditionality on the size of the fiscal deficit under either the current PRGF arrangement approved in 2005, nor the previous

12
one approved in 2000. In both instances, a performance criterion was placed on the central government domestic borrowing.
• Page 63, paragraph 17: Malawi has not had any conditionality on priority expenditures under either the current PRGF arrangement approved in 2005, nor the previous one approved in 2000. The current 2005 PRGF includes a ceiling on central government discretionary spending.
• Page 63: paragraph 17: the current Malawi PRGF arrangement only includes an adjustor for higher wage spending in the event of higher SWAp-financed wage spending in the health sector, not in priority areas in general.
• Page 67, Table C5: The 2000 PRGF arrangement expired with only the first review being completed in October 2003. There was no second review. In neither instance was there quantitative conditionality on the wage bill. This conditionality exists in the 2005 PRGF arrangement.
• Page 68, Table C5: The 2000 PRGF arrangement expired with only the first review being completed in October 2003. In neither instance was there an indicative target in poverty reducing expenditure. What is the reference to the 2002 program?
Mali • Table C6, page 69 (which discusses the use of PSIA) should mention the Mali
selected issues paper issued in March 2006, which assesses the distributional effects of an increase in petroleum prices.
Rwanda • The report states that Dutch disease was not a major concern (paragraph 11, Annex C
and also Annex D). This does not correctly reflect staff’s views. In fact, in EBS/05/55 (4th PRGF review, ¶11), staff wrote “As large external inflows could put pressure on the real exchange rate to appreciate penalizing net exports, it is essential to raise productivity in the export sector...” Also in subsequent reviews and the new PRGF, export promotion was a critical program element, acknowledging that a further real appreciation of the exchange rate is likely with a scaling up of aid.
• We believe that there is too much emphasis on the PSIA, given the questionable quality of the document (paragraph 11, Annex 4).
Tanzania • Para 13 on page 61: Tanzania programs used NDF, not fiscal deficits as performance
criteria; the language should be altered to reflect that.

13
• Chart D5 on page 72: in the row "before" of the column on "financing of aid shortfalls", the Tanzania box should not be red but yellow; Tanzania did allow limited domestic financing of shortfalls before 2001/02.
Uganda • The performance criterion on poverty-reducing expenditure (paragraph 41, footnote
44, and Appendix C, paragraph 17, and Table C5) was changed to an indicative target under the last (2002) PRGF arrangement.
Zambia • Para 42, page 17: The report misrepresents the process that took place in modifying
the indicative target for the wage bill ceiling in Zambia in 2004. A modification to the program was made on the basis of the authorities’ request, and was not a reaction to negative publicity and controversy on wage bill ceilings. That is, when the wage bill ceiling could have potentially interfered with teacher hiring, the ceiling was appropriately modified. Persistent claims that the Fund-supported program in Zambia restricted the hiring of teachers and health workers have repeatedly been refuted (see the link below from November 2004). The IEO report could have usefully pointed this out. See:
http://www.imf.org/external/np/vc/2004/111804.htm • Annex C, Para. 10, page 61: We would categorize Zambia as having a low level of
international reserves. The PRGF-supported program aimed for a gradual buildup of reserves over the medium term.
• Annex C, Para. 13, page 61: “The size of the fiscal deficit was typically used as a performance criterion (… Zambia).” The fiscal performance criterion in the program for Zambia is a ceiling on net domestic financing. While an adjustor for excess budget support implicitly creates a temporary cap on the fiscal deficit, the program would allow for spending the excess in subsequent periods (by drawing down government deposits) after appropriate expenditures have been identified and budgeted for.
• Annex C, Para. 14, page 62: Tax revenue was not an indicative target in the PRGF arrangement for Zambia approved by the Board in June 2004.


DOCUMENT OF INTERNATIONAL MONETARY FUND AND FOR OFFICIAL USE ONLY
BUFF/07/27
February 28, 2007
IEO Comments on Management and Staff Responses to the Evaluation of the IMF and Aid to Sub-Saharan Africa
Executive Board Meeting March 5, 2007
1. We welcome the support by management and staff for the report’s recommendations, and concurrence with many of the report’s findings. The responses also call for clarification in some areas, as set out below.
Management response
2. The evaluation uses Board-approved policies and management guidance as the yardstick for judging staff performance. Chapter IV and Annex A of the report summarize the relevant Board-approved policies and management guidance. The evaluation does not assess IMF performance against an external yardstick, as implied by the management response (paragraph 4). However, external perspectives—in part driven by past IMF communications failures—do provide an important context for the evaluation.
3. IEO welcomes the clarification of management’s position on the accommodation of aid. Straightforward language—as used in paragraph 6 to spell out management’s program intent with respect to the implementation of Board-approved policy—should become a standard for IMF communications externally and internally. We urge greater clarity on operational policies and guidance to staff, including on the use of alternative scenarios and the Fund’s role in the mobilization of aid, poverty and social impact analysis (PSIA), the PRSP process, and the achievement of the Millennium Development Goals, following clarifications by the Board where needed.
4. IEO agrees that IMF staff should concentrate on macro-critical issues and analysis, as indicated in paragraph 8 of the management response. But good practice requires the use of sectoral analysis from the World Bank and other partners.1 The evaluation finds such use rare, despite its relevance to the economy’s likely supply-side response and to PRGF program design. Going forward, the challenge for the Fund is to proactively manage
1 As noted in the Report of the External Review Committee on Bank-Fund Collaboration, February 2007: “The Fund cannot focus on macroeconomic stability and the fiscal aggregates, without regard for what is happening at the sectoral level.”

2
the interface with the Bank and other partners to secure the analytic inputs that staff need—as part of a broader approach to the rationalization of institutional partnerships and Fund/Bank collaboration. Otherwise, as the evaluation shows, staff will revert to their macro silos—business as usual—with adverse implications for the quality of their work and for the policy advice they can provide to Sub-Saharan African countries.
5. IEO believes that solving the problems that currently bedevil the use of PSIA also requires proactive management by the Fund. Management notes (paragraph 4) that “it has always been expected, for example, that PSIA[s] would be conducted by other agencies in the context of the PRSP process (and then utilized by Fund staff in the design of programs).” As detailed in the evaluation, this expectation has not been realized—arguably because not everyone had the same expectations, including those whom Fund staff expected would deliver the PSIAs to them. Indeed, as the IEO report observes (paragraph 69), Fund/Bank collaboration has not worked well in areas where one institution (typically the Bank) is expected to supply the other institution (typically the Fund) with specific inputs and expertise—and where they are perceived to be unfunded mandates by staff in the supplying institution. Such considerations put a premium on the Fund’s proactively managing its side of the partnership—including by determining and communicating its needs in a timely manner and elevating concerns to higher levels of management in partner organizations as needed—to see that the job gets done.
Staff response
6. A central message of the IEO report is the need for (i) greater candor and directness by the Fund in communicating externally; (ii) greater proactivity (and less passivity) in partnering with the Bank and others; and (iii) greater accountability for both. We disagree with staff’s reading of this central message as it applies to four key areas, as summarized below.
• The IEO report does not advocate the immediate spending and absorption of aid in all cases. However, it does advocate clear and transparent communications of the Fund’s stance in all cases—and the rationale for that stance—including any implicit tradeoffs between reducing inflation and/or increasing reserves on the one hand and spending and/or absorbing aid on the other. Public debate on these issues is important. The report also calls for more proactive communications of the Fund’s analysis of aid absorptive capacity with donors and other partners.
• The IEO report does not call for the Fund to become the lead agency on Bank-led mandates, such as on the composition of public expenditures, the sectoral underpinnings of aid absorption capacity and growth, or distributional issues. However, it does call for the Fund to be a more active and engaged partner with the Bank and others—and user and requestor of partners’ analysis—in areas of material importance to the Fund’s work. In these areas, the Fund must occupy the middle
3
ground—neither passively waiting for analysis by others nor taking over the production of that analysis, given the resources constraints the Fund faces and the agreed division of labor with the Bank and more broadly.
• The IEO report does argue that Fund staff have taken too little account of spending composition issues in assessing aid absorptive capacity—drawing on the inputs of the Bank and other partners—including in areas of direct relevance to the Fund’s core responsibilities. Paragraphs 21-22 of the report show that PRGFs rarely address the sectoral dimensions of country capacity to absorb and spend aid, while paragraphs 43-44 highlight PRGFs’ neglect of infrastructure’s supply-side linkages to the macro assessment and program design.
• The IEO report recognizes that Board-approved policy does not require the Fund to prepare PSIAs, but to reflect existing PSIAs in PRGF program design. Yet this does not happen. Interviewed IMF staff said that most PSIAs prepared by the Bank and other agencies generally lacked the necessary timeliness, relevance, and/or quality to underpin PRGF design. Nor did the evaluation find evidence of compliance with the Fund’s operational guidance calling for the provision of at least a qualitative description of likely impacts of major reforms in the Fund’s core areas of expertise even if no PSIA work is available.
7. IEO takes note of the many detailed comments in the two appendices to the staff’s response. We note the tensions between page 3’s description of the “quantitative analysis of the programmed use of aid [as] innovative and thought-provoking” and the cautions expressed in Appendix 1. Most of the comments included in Appendix 2 are qualifications and clarifications of staff views (rather than factual corrections); they will remain as part of the record of the evaluation.

DOCUMENT OF INTERNATIONAL MONETARY FUND AND FOR OFFICIAL USE ONLY
BUFF/07/32
March 9, 2007
The Acting Chair’s Summing Up Independent Evaluation Office—the IMF and Aid to
Sub-Saharan Africa Executive Board Meeting 07/19
March 5, 2007
Executive Directors welcomed the evaluation by the Independent Evaluation Office of the IMF and Aid to Sub-Saharan Africa, which they regarded as especially timely in view of its relevance for the planned Board discussions on aspects of the Fund’s role in low-income countries and the report of the External Review Committee on IMF-World Bank collaboration, as well as the Fund’s external communications strategy. They considered that the report’s candid findings and useful recommendations would provide important inputs to the Fund’s continuing efforts to clarify the institution’s mandate and policies for helping Sub-Saharan Africa, and low-income countries more broadly, achieve growth and reduce poverty. Directors stressed that, although the external perspective provided useful background, the report should be considered in the context of the Fund’s current mandate, as well as its priorities envisaged in the Medium-Term Strategy (MTS), which provides the framework for more focused engagement in low-income countries. Directors took this opportunity to reiterate the Fund’s commitment to the Monterrey Consensus and the critical importance of the Fund’s continued involvement in low-income countries, including through well-designed financial and policy support in the context of surveillance, Fund arrangements, and technical assistance.
Directors were encouraged by the report’s confirmation of the improvement in macroeconomic performance in Sub-Saharan African countries over the past decade. While recognizing the contribution of the authorities’ own efforts and exogenous factors, they noted the role of the Fund’s advice and actions. The Fund’s policy advice had been instrumental in promoting sound macroeconomic policies and in better accommodating the use of aid. In addition, the HIPC Initiative and the MDRI had greatly reduced debt-related vulnerabilities and the costs of debt servicing. Directors also noted the various improvements in the Fund’s assistance to low-income countries that had occurred since the introduction of the Poverty Reduction and Growth Facility, including the adaptations related to the promotion of higher domestic resource mobilization and higher social spending, and the Fund’s efforts to support fiscal governance. More generally, Directors were encouraged by the IEO report’s finding that the assessment by the country authorities of their working relationship with the Fund was generally positive.
Notwithstanding the Fund’s positive contributions to the use of aid in Sub-Saharan Africa, Directors generally agreed with the report’s assessment that considerable scope remains for further improvements. They considered that any improvements in the Fund’s engagement in low-income countries should, in line with the MTS, continue to be focused on

2
its core mandate of providing advice and support for sound macroeconomic policies as a prerequisite for sustained growth and poverty reduction. In this context, most Directors confirmed that distributional policies generally lie outside the Fund’s core mandate and that poverty and social impact analysis (PSIA) should be conducted by other agencies in the context of the PRSP process, although others saw a continuing role for the Fund. Directors noted that PSIAs have not systematically supported PRGF program design, and emphasized the importance of improving Fund collaboration with development partners, in particular the World Bank, to take these issues into account when helping countries formulate their macroeconomic policies.
Directors confirmed the importance of accommodating higher aid flows through higher spending and net imports, provided that this would not jeopardize macroeconomic stability. They considered that this approach should continue to be implemented on a case-by-case basis and in the context of a multi-year strategy—with the general objective being to bring all low-income members to a situation in which aid can be fully absorbed and effectively spent. Directors concurred on the need for improved transparency and clear communications by the Fund on its stance regarding the use of aid, and on the trade-offs involved.
With regard to other aid-related issues noted in the report, Directors also offered a range of views. On the role of the Fund in developing alternative aid scenarios, many Directors indicated that, in the context of the PRSP, the staff should be available to prepare scenarios that illustrate the macroeconomic challenges of scaling up aid, including, in the view of some Directors, those based on estimates by others of additional resources needed for the MDGs when available. Most Directors emphasized, however, that the Fund’s role should be limited to assessing the consistency of additional aid flows with macroeconomic stability and the absorption capacity of the country, with more normative advice and the preparation of less likely aid scenarios falling outside the Fund’s mandate. On budget frameworks, Directors generally considered that the World Bank and other MDBs should be the lead agencies in providing advice related to expenditure composition issues.
Directors supported the report’s recommendation on the need for further clarification of Fund policy on several aid-related issues, including the mobilization of aid, alternative scenarios, poverty and social impact assessments of macroeconomic policies, and pro-poor and pro-growth budget frameworks. Directors asked the staff to come back with specific and costed proposals on how to clarify relevant policies and implement the report’s recommendations.
Directors welcomed the report’s recommendation to establish transparent mechanisms for monitoring and evaluating the implementation of the clarified policy guidance. In this context, they agreed that existing mechanisms for follow up, such as ex-post assessments of past Fund arrangements, might be strengthened. They also noted the usefulness of broader stocktaking in the context of periodic Board reviews of the PRGF. They asked for staff proposals in these areas.
Directors also welcomed the final recommendation in the IEO report to clarify expectations under Fund policies—and resource availabilities—for resident representatives’

3
and missions chiefs’ interactions with local donors and civil society groups. They emphasized that, in particular, the concerns raised by donor groups called for improved coordination and communication, while stressing that the Fund should not itself play the role of coordinator or convener of donor activities and assistance. In addressing these challenges, in their view, attention should be paid to changing aid modalities and increasing decentralization of donor operations, while also taking into account the Fund’s budget and staffing constraints. Most Directors recognized the particular importance of the role played by resident representatives in this context, but stressed that any further consideration of their role should be informed by a careful cost-benefit analysis, given the high costs involved and the Fund’s current resource pressures. Directors agreed that the Fund’s engagement with development partners would benefit from ensuring that institutional communications—both internal and external—are consistent with Board-approved operational policies.
More generally, Directors noted that a common theme in the IEO recommendations is the need for improved and more realistic Fund communications. Directors were concerned over the disconnect between the Fund’s communication on aid and poverty reduction policy and what is the actual experience at the country level in low-income countries; the resulting expectations gap might put the Fund's credibility at stake. Thus, Directors supported the report’s call for greater clarity in the Fund’s external relations on what the Fund can and cannot do in its low-income country work. Directors welcomed management’s intention to take further steps to build on the efforts to strengthen the communications process that is already under way. They also underscored the importance of a stepped-up internal communications effort across the Fund to align better staff’s ongoing work with institutional priorities. At the same time, Directors emphasized that, given the budgetary constraints, improvements in coordination and communication would need to be implemented in a strategic manner.
Directors looked forward to management’s proposals on implementing the IEO’s recommendations. Some Directors suggested that the IEO may also usefully provide comments to the Board on implementation plans. Noting that several policy issues raised in the IEO report would benefit from greater clarity regarding delineation of Bank-Fund responsibilities, Directors looked forward to reviewing these issues further in the context of their forthcoming consideration of the report on IMF-Bank collaboration. In particular, they noted that greater clarity of the respective institutions’ objectives, responsibility for expected deliverables, and accountability for quality would be crucial to help address several of the issues raised by both the reports.