An equilibrium analysis of low income property development ... · An equilibrium analysis of low...
23
Who wants affordable housing in their backyard? An equilibrium analysis of low income property development Rebecca Diamond & Tim McQuade Stanford GSB & NBER April 6, 2017 Diamond & McQuade (Stanford GSB & NBER) LIHTC Effects April 6, 2017 1 / 20
Transcript of An equilibrium analysis of low income property development ... · An equilibrium analysis of low...

Who wants affordable housing in their backyard?An equilibrium analysis of low income property development
Rebecca Diamond & Tim McQuade
Stanford GSB & NBER
April 6, 2017
Diamond & McQuade (Stanford GSB & NBER) LIHTC Effects April 6, 2017 1 / 20

Affordable Housing as Place-Based Policy
Increasing geographic income segregation & housing costs puts gov’s rolein promoting affordable housing at forefront of policy debate
Policy question of where to build affordable housing
Large Diversity in Geographic Targeting of Affordable Housing
SJ, SF, NYC incentivize 15-20% of new development affordable in same buildingLIHTC: Larger subsidy to poorest neighborhoods
Low-income housing may have equilibrium effects on neighborhood
Benefits to tenants in affordable housing must be considered along with costs andbenefits to surrounding neighborhood residents
Diamond & McQuade (Stanford GSB & NBER) LIHTC Effects April 6, 2017 2 / 20

Welfare effects of LIHTC on neighborhood residents
Quantify costs & benefits of affordable housing to surrounding neighborhoodresidents
Analyze affordable housing construction funded by Low-Income HousingTax Credit (LIHTC)
Develop housing choice model:
Identify preferences for LIHTC proximity by measuring LIHTC impacts onhouse prices and households’ housing purchases
Analyze neighborhood welfare impacts of LIHTC
Compare impacts across neighborhoods of different income and racialcomposition
Diamond & McQuade (Stanford GSB & NBER) LIHTC Effects April 6, 2017 3 / 20

Preview of Results
Reduced Form Prices Effects of LIHTC construction after 10 years:
6.5% price appreciation in lowest income areas
2.5% price depreciation higher income, low minority areas
No depreciation in high minority areas
Welfare Impacts
LIHTC in lowest income, low minority area:
Avg HH benefits $8,843Aggregate benefit of $116 Million
LIHTC in higher income, low minority area:
Avg HH benefits -$3,295Aggregate loss of $12 Million
Diamond & McQuade (Stanford GSB & NBER) LIHTC Effects April 6, 2017 4 / 20
Outline
1 Data
2 Model & Estimation Method
3 Reduced Form Estimates
4 Preference Estimates & Welfare
5 Conclusion/Next Steps
Diamond & McQuade (Stanford GSB & NBER) LIHTC Effects April 6, 2017 5 / 20

Data
DataQuick: 1988-2012
Transaction history & property characteristics collected from countyrecorders’ and assessors’ offices
Home Mortgage Disclosure Act (HMDA): 1991-2012
Merged with DataQuick to observe income of homebuyers
HUD Public Use LIHTC Database: 1987-2012
Contains information on 39,094 LIHTC projects
Project address, year funds allocated, number of units
Diamond & McQuade (Stanford GSB & NBER) LIHTC Effects April 6, 2017 6 / 20

Counties in Sample
Diamond & McQuade (Stanford GSB & NBER) LIHTC Effects April 6, 2017 7 / 20

Identifying LIHTC Treatment Effect on House Prices
Exploit highly local, micro aspect of our data:
Very local difference-in-differences strategy
Compare price changes close to LIHTC vs. price changes slightly further away
Key Assumption:
LIHTC construction uncorrelated with highly local price trends
Prices can’t trend differentially 0.1 miles vs 0.2 miles from LIHTC site other thanb/c of LIHTC developmentWe test this: No trends in of this nature before LIHTC construction
Diamond & McQuade (Stanford GSB & NBER) LIHTC Effects April 6, 2017 8 / 20

Impact of LIHTC on House PricesProjects located in Census Block Groups with Median Income < $26k
-0.01
1.2
0
0.01
1
0.02
10
0.03
Log
Hou
sing
Pric
e
0.8
0.04
Miles to LIHTC Site
0.6 5
0.05
Years Since Funding
0.06
0.40
0.2
0 -5
Diamond & McQuade (Stanford GSB & NBER) LIHTC Effects April 6, 2017 9 / 20

Impact of LIHTC on House PricesProjects located in Census Block Groups with Median Income $26k-$38k
-0.03
1.2
-0.02
1
-0.01
10
0
Log
Hou
sing
Pric
e
0.8
0.01
Miles to LIHTC Site
0.02
0.6 5
Years Since Funding
0.03
0.40
0.2
0 -5
Diamond & McQuade (Stanford GSB & NBER) LIHTC Effects April 6, 2017 10 / 20
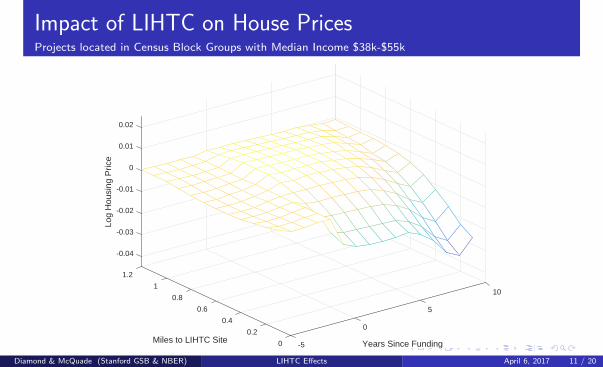
Impact of LIHTC on House PricesProjects located in Census Block Groups with Median Income $38k-$55k
-0.04
1.2
-0.03
1
-0.02
10
-0.01
Log
Hou
sing
Pric
e
0.8
0
Miles to LIHTC Site
0.01
0.6 5
Years Since Funding
0.02
0.40
0.2
0 -5
Diamond & McQuade (Stanford GSB & NBER) LIHTC Effects April 6, 2017 11 / 20

Impact of LIHTC on House PricesProjects located in Census Block Groups with Median Income > $55k
-0.04
1.2
-0.03
1
-0.02
10
-0.01
Log
Hou
sing
Pric
e
0.8
0
Miles to LIHTC Site
0.01
0.6 5
Years Since Funding
0.02
0.40
0.2
0 -5
Diamond & McQuade (Stanford GSB & NBER) LIHTC Effects April 6, 2017 12 / 20

Impact of LIHTC on House PricesProjects located in Census Block Groups with Income < $38k, % Minority >50
-0.021.2
-0.01
0
1
0.01
10
Log
Hou
sing
Pric
e
0.8
0.02
0.03
Miles to LIHTC Site
0.6 5
0.04
Years Since Funding
0.05
0.40
0.2
0 -5
Diamond & McQuade (Stanford GSB & NBER) LIHTC Effects April 6, 2017 13 / 20

Impact of LIHTC on House PricesProjects located in Census Block Groups with Income > $38k, % Minority >50
-0.03
1.2
-0.02
1
-0.01
10
0
Log
Hou
sing
Pric
e
0.8
0.01
Miles to LIHTC Site
0.02
0.6 5
Years Since Funding
0.03
0.40
0.2
0 -5
Diamond & McQuade (Stanford GSB & NBER) LIHTC Effects April 6, 2017 14 / 20
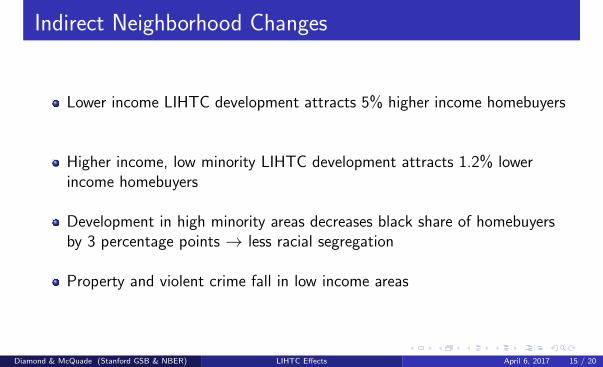
Indirect Neighborhood Changes
Lower income LIHTC development attracts 5% higher income homebuyers
Higher income, low minority LIHTC development attracts 1.2% lowerincome homebuyers
Development in high minority areas decreases black share of homebuyersby 3 percentage points → less racial segregation
Property and violent crime fall in low income areas
Diamond & McQuade (Stanford GSB & NBER) LIHTC Effects April 6, 2017 15 / 20

Welfare Analysis
Quantify welfare benefits of local neighborhood change
Decompose into impacts on:HomeownersRentersAbsentee landlords
Assumptions for renter welfareHouse prices equal to present value of rentsRenter preferences same as homeowners given race and income
Assume no moving costs
Diamond & McQuade (Stanford GSB & NBER) LIHTC Effects April 6, 2017 16 / 20

Mean Utility Benefit per Household: Low Minority Areas
Med Income <26K Med Income >55k
Average Benefit perHome Owner
23,402 -3,972
Average Benefit perRenter
6,502 67
Average Benefit perLandlord
6,011 -2,416
Mean welfare benefit from LIHTC construction to households who choose to live nearby. Utility is
measured in 2012 dollars.
Diamond & McQuade (Stanford GSB & NBER) LIHTC Effects April 6, 2017 17 / 20
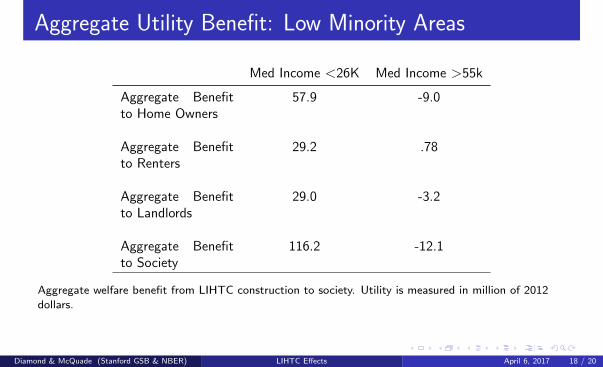
Aggregate Utility Benefit: Low Minority Areas
Med Income <26K Med Income >55k
Aggregate Benefitto Home Owners
57.9 -9.0
Aggregate Benefitto Renters
29.2 .78
Aggregate Benefitto Landlords
29.0 -3.2
Aggregate Benefitto Society
116.2 -12.1
Aggregate welfare benefit from LIHTC construction to society. Utility is measured in million of 2012
dollars.
Diamond & McQuade (Stanford GSB & NBER) LIHTC Effects April 6, 2017 18 / 20

Incorporating Tenant Welfare
Our analysis considers only place based effects of LIHTC development
Incorporate the welfare effects on affordable housing tenantsUse MTO(Chetty, Hendren, & Katz, 2015): $99,000 PV per childWelfare benefit to tenants is $26.7 million.
Opportunity cost of not building in low income neighborhood: $116million.
Place-based effects lead to larger benefits for low-incomepopulation
Diamond & McQuade (Stanford GSB & NBER) LIHTC Effects April 6, 2017 19 / 20

Conclusion
Neighborhood impacts of affordable housing vary substantially byneighborhood income levels
LIHTC in poor areas improves neighborhoodLIHTC in richer areas lowers local neighborhood quality
Affordable housing programs often criticized when housing located inalready poor or high minority neighborhoods
80/20 mixing of market rate and affordable housing (SF & NYC)Large opportunity costs of not improving low income communities
Diamond & McQuade (Stanford GSB & NBER) LIHTC Effects April 6, 2017 20 / 20

Mean Utility Benefit per Household: High Minority Areas
Income Q1 Income Q2 Income Q3 Income Q4
Average Benefit perHome Owner
16857 2414 996 3255
Average Benefit perRenter
6475 190 342 971
Average Benefit perLandlord
6099 1288 375 1090
Mean welfare benefit from LIHTC construction to households who choose to live nearby. Utility is
measured in 2012 dollars.
Diamond & McQuade (Stanford GSB & NBER) LIHTC Effects April 6, 2017 20 / 20

Aggregate Utility Benefit: High Minority Areas
Income Q1 Income Q2 Income Q3 Income Q4
Aggregate Benefitto Home Owners
63,460 1,446 3,615 14,508
Aggregate Benefitto Renters
73,417 314.7 1,903 4,861
Aggregate Benefitto Landlords
74,236 2,672 2,262 5,907
Aggregate Benefitto Society
211,113 4,433 7,780 25,277
Aggregate welfare benefit from LIHTC construction to society. Utility is measured in thousands of 2012
dollars.
Diamond & McQuade (Stanford GSB & NBER) LIHTC Effects April 6, 2017 20 / 20