An Empirical Examination of Burglary. Offense and Offender ...
65
,( l.f313/1 ," 'I )/ I Crime-Specific Analysis An Empirical Examination of Burglary. Offense and Offender Characteristics , p , \ . , i \ -'-p. . \ . - <'1 - . .. . . • • I U.S. DEPARTMENT OF JUSTICE Law Enforcement Assistance Administration National Criminal Justice Information and Statistics ServiCe UTILIZATION OF CR1MINAL JUSTICE STATISTICS ANALYTIC REPORT 12 **l. If you have issues viewing or accessing this file contact us at NCJRS.gov.
Transcript of An Empirical Examination of Burglary. Offense and Offender ...

,( l.f313/1 ," 'I
)/ ~<'\ I
Crime-Specific Analysis An Empirical Examination of Burglary. Offense and Offender Characteristics
, p , \
~ . ,
i \
-'-p. . \ .
-<'1 - . .~ ..
. . • • I
U.S. DEPARTMENT OF JUSTICE Law Enforcement Assistance Administration National Criminal Justice Information and Statistics ServiCe UTILIZATION OF CR1MINAL JUSTICE STATISTICS ANALYTIC REPORT 12
**l.
If you have issues viewing or accessing this file contact us at NCJRS.gov.

o
National Criminal Justice Information and Statistics Servrce Reports
Utilization of Criminal Justice Statistics Proj9ct: Sourcebook of Criminal Justice Statistics 1976 (annual) Public Opinion Regardi.ng Crime, Criminal Justice, and
Related Topics Now Directions in Processing of Juvenile Offenders: The
Denver Model Who Gets Detained? An Empirical Analysis of the Pre
Adjudicatory Detention of Juveniles In Denver
«.
Juvenile Dispositions: Social and Legal Factors Related to the Processing of Denver Delinquency Cases
Offender-Based Transaction Statistics: New Directions In Data Collection and Reporting
Sentencing of California Felony Offenders The Judicial Processing of Assault and Burglary
Offenders in Selected California Countres Pra-AdJudlcatory Detention In Three Juvenile Courts Delinquency Dispositions: An Empirical AnalYsis of
Processing Decisions In Three Juvenile Courts The Patterns and Distribution of Assault Incident
Characteristics Among Social Areas Patterns of Robbery Characteristics and Their
Occurrence Among Social Areas • Crime-Specific Analysis:
The Characteristics of Burglary Incidents An Empirical Examination of Burglary Offender
Characteristics An Empirical Examination of Burglary Offenders and
Offense Characteristics
Vic\\!mlzatlon Surveys: I':rlmlnal Victimization In the United States (annual):
A Comparison of 19i'5 and 1976 Findings A Comparison of 1974 and 1975 Findings A Comparison of 1973 and 1974 Findings 1975 (final report) 1974 (final report) 1973 (final report)
Criminal Victimization Surveys In Boston, Buffalo, Cincinnati, Houston, Miami, Milwaukee, Minneapolis, New Orleans, Oakland, Pittsburgh, San Diego, San I=ranclsco, and Washlnglon, D.C. (final report, 13 vols.)
Criminal Victimization Surveys In 13 American Cities (summary report. 1 vol.)
Criminal Vlctlml.zatlon Surveys In Chicago, Detroit, Loa Angeles, New York, ~nd Philadelphia! A ComparIson of 1972 and 1974 Findings .
Criminal Victimization Surveys in the Natlol'l's Five Largest CIties: National Crime Panel Survey In Chicago, Detroit, Los Angeles, New Yor\{, !and Philadelphia. 1972
Criminal Victimization Surveys !n t:;lght American CIties: A Comparison of 1971172 and 1974/75 FindingsNational Crime S\lrv~vJi\ In Atlanta, Baltimore, Cleveland, Dallaa,Yenver, Newark, Portland, and St. Louis
Crime In Eight Ainerlcan Cities: National Crime Panel Sur\!e\!~ i~ .'\Uanta. Baltimore, Cleveland, Dallas, . Der,v~··t'lNewark, Portland, and St.louiS-Advance Report, 1911172
·f;!rlmol'J and Victims: A Report on the Dayton-San Jose Pilot Survey of Victimization
Applications of the National Crime Survey Victimization and Attitude Data:
Public Opinion About Crime: The Attftudes of V!ctlms and Nonvlctlms In Selected Cities
Local Victim Surveys: A Review of the !ssues The Police and Public Opinion: An Analysis of
VictlmlO!atfon and Attitude Data from 13 American CIties An Introduction to the National Crime Survey Compensating Victims of Violent Crime: Potential
Costs and Coverage of a National Program National Prisoner Statistics:
Capital Punishment (annual): ' 1976 Advance Report 1975 (final report)
Prisoners in State lind Federallnlltitutlona (annual): Deoember 31 , 1976; Advance Report December 31,1975 (final report)
CenslIs of State Correctional Facilities, 1974: Advance Report Survey of Inmates of State Correctional Facilities, 1974:
Advance Report Census of Prisoners In State Correctional Facilities, 1973
Tho Nation's Jails: A report on the census of Jails from the 1912 Survey of
Inmates of Local Jails Survey of Inmates of Local Jails 1972: Advance Report
Children In Custody: Juvenlle Detention and Correctional Facility Census Advance Report, 1975 census Advance Report, 1974 census Advance Report, 1972-73 census Final Report, 1971 census
State and Local Probation and Pl'lrole Systems
State and Local Prosecution atld Civil Attorney Systems
National Survey of Court Organization: 1977 Supplement to State Judicial Systems 1975 Supplemont to State Judicial Systems 1971 (full m{iort)
Criminal JUiUce Agencies In R.oglons1-10 (10 volumes)
Trend~ in Expenditure and Emnloyment Data for the Criminal Justice System, 1971·75 (annual)
~:p9ndlture and Employment Data for the Criminal Justice System-1975 (annual)
Dictionary of Criminal Justice Data Terminology: Terms and De:flnltlons Propo.~ for Interstate and National DQta Collection and Exchange Pl'ogram Plan for Statistics, 1977-81
Single caples are available at no charge from the National Criminal Justice Reference Service, Box 6000, Rockville, Md. 20850. Multiple caples are for sale by the SUperintendent of Documents, U.S. Government Printing Office, Washington D.C 20402. '
IMPORTANT
We have provided an evaluation form at the end of this publication. It will assist us In Improving future reports If you complete and return It at your convenience. It Is a self-mailing form and needs no stamp.

Utilization of Criminal Justice Statistics Project ANALYTIC REPORT 12
CRIME:'SPECIFIC ANALYSIS: An Empirical Examination of Burglary Offense and Offender Characteristics
by CARL E. POPE Research Analyst
CRIMINAL JUSTICE RESEARCH CENTER Albany, New York
This project was supported by Grant No. 75-SS-99-6001, awarded 'to the Criminal Justice Research Center, Albany, New York by !he Statistics Division, National Criminal Justice Information and Statistics Services, Law Enforcement Assistance Administration, U.S. Department of Justice, under the Omnibus Crime Control and Safe Streets Act of 1968, as amended; the project, entitled "Utilization of Criminal Justice Statistics," is being directed for ths Criminal Justice Research Center by Michael J. Hindelang and monitored for LEAA by Sue A. Lindgren. Points of view or opinions stated in this document are tho!)e of the authcH'(s) and do not necessarily represent the official position or policies of the U.S. Department of Justice. LEAA authorizes any person to reproduce, publish, translate, or otherwise use all or any part of the copyrighted material in this publication, with the exception of those items indicating that they are copyrighted by or reprinted by permission of any source other than the Criminal Justice Research Center.
Copyright 1977 by Criminal Justice Research Center. SDaAR-12 1977 IWF __ .. ______________ u. ________________________________________________ __
U.S. DEPARTMENT OF JUSTICE
Law Enforcement Assistance Administration
National ClI'imlnal Justice Information and Statist~s Service

U.S. DEPARTMENT OF JUSTICE Law Enforcement Assistance Administration
James M.H. Gregg, Acting Administrator
Harry Bratt, Assistant Administrator National Criminal Justice Information and Statistics Service
Benjamin H. Renshaw, Director Statistics Division
Library of Congress Cataloging In Publication Data
Pope, Carl E Crime-specific analysis, an empirical examination of
burglary offense and offender characteristics.
(AnalYtic report-Utllization of Criminal Justice Statistics Project; 1 2)
"SD-AR-121977." Bibliography: p. 51 1. Burglary-Unlted States. I. Title. II. Series: Criminal
Justice Research Center. Utilization 6f Criminal Justice Statistics Project. Analytic report-Utllization of Criminal Justice Statistics Project; 12. HV6658.P672. 364.1 '62 76-50124
iii
--~ry:f-' -------~--------______ _ 1,'}For salo by tho Suporlntendent oC Docwnonts, U.S. Govenunent Printing Office 'ff Washington, D,C, 20402
j' Stock No. 027-000-00649-3 I
1 ( Ib

G
THE UTILIZATION OF CRIMINAL JUSTICE STATISTICS Project was funded initially in 1972 by the National Criminal Justice Information and Statistics Service of the Law Enforcement Assistance Administration. One primary aim of the project is the production of annual editions of the Sourcebook of Criminal Justice Statistics, a compilation of available nationwide criminal justice statistical data. A second aim has been and continues to be an examination of the utility that a variety of criminal justice statistical data bases have for addressing questions of practical and theoretical interest in the field.
One product of that examination is a series of analytic reports, of which this volume is one; These reports, written by research staff members of the Utilization of Criminal Justice Statistics Project, all have a common theme: the discussion of a central criminal justice topic using an exemplary or innovative criminal justice data base. Each report in the series not only discusses substantive findings in regard to particular issues, but also considers the qualities and limitations of the data, as well as techniques and problems of analysis, in relatIon to the. substantive findings.
At a time when criminal justice statistics development is extensive, and often expensive, these analytic reports focus attention on one often overlooked function of criminal justice .statistics-the analysis of current issues and questions based on available d~t~. In fact, the utilization issue is perhaps as important as any in the area of cihhinal justice statistics. It often happens that data are collected-usually at great expense-without subsequent efforts to utilize such data to address the pressing problems that confront criminal justice. This series of Analytic Reports explores the problems and prospects inherent in the application of various sources of criminal justice statistical .data to issues of interest and concern to agency personnel, planners, research~rs, and the public alike.
MICHAEL J. HINDELANG Project Director
/I ,'I
§
J !
- -- -...!---.....~ --- -~

~------------------,~(----~------"------~---------------;\r
( !

ACKNOWLEDGMENTS
THIS STUDY could not have been undertaken without access to the burglary data base generously supplied by the California Bureau of Criminal Statistics. I would like to express appreciation t<f Bureau Chief Willard Hutchins and Crime Studies Analyst Quinton Hegner for patiently answering my many questions concerning these data. Interpretation of the data is the responsibility of the author and opinions expressed here do not necessarily represent the official position or politics of the California Bureau of Criminal Statistics.
," , ,
"

I ,
(1l
.) 1\
))

r
f ! I 1
~
l I r
I I
1
I I~
PREFACE
THIS IS the third of three reports focusing upon various characteristics and patterns associated with the cr"ime of burglary. The overall objective of the series is basically threefold: first, to examine the characteristics of reported burglary incidents imd their interrelationships; second, to explore both the social and legal characteristics of those individuals apprehended for the crime of-burglary; and third, to specify the extent to which various offense and offender characteristics are related. The fi.rst report provided an extended discussion of the data base that is used throughout the series and reviewed research findings pertaining to burglary incidents. Noting the limitations of much of the research that deals with the crime of burglary, this report undertook a detailed analysis of various incident characteristics including such factors as the type of structure burglarized, the amount of property stolen, methods used to gain entry~ and the like. This analytic method was continued in the second report, which~hmined such factors as the age, race, sex, and previous criminal history of those arrested for the commission of burglary offenses. Analysis also focused upon the initial police decision to release the suspect without a complaint being filed or to file a complaint, which leads to prosecution.
The findings of these two reports lent support to previous research focusing on'the crime of burglary. That is, relationships among incident characteristics were discovered to be quite similar to those found in other studies, whether official data 01' victim survey techniques were used. Distinct relationships were ovident for both offense and offender characteristics, indicating:that many of the correlates of burglary are not rand~mly distributed but instead show evidence of being patterned events.
Although research on violent and personal crime has demonstrated the existence of patterned relationships among offense and offender characteristics in crimes such as homicide, rape, and robbery, different types of burglary offenders have rarely been correlated with distinct types of burglary incidents. Certain offense and offender relationships have been found, but overall patterns were not distinctive. This report examines the empirical link between offense and offender characteristics in an attempt to determine whether and to what extent certain types of burglary offenses were committed by certain types of offenders.
Carl E. Pope School of Social Welfare Criminal Justice Program University of Wisconsin Milwaukee,Wisconsin 1976
o
7

" r , "
l ,-~, \
> i' t i' 1 1
I" ,,' 1
\ I
i ,
o
""j' , '
:'

! (
I·
CONTENTS
Preface.................. ... .. •. .. . . . . . . . . . . . . . . . . . . . 7
Highlights of the Findings. . . . . . . . . . . . . . . . . . . . . . . . . . . .. 13
Introduction. . . . . . . . . . . . . . . . . . . . . . . . . . . . . . . . . . . . . . . . .. 1 5
Interrelationship Among Cri.me Characteristics. . . . . . . . .. 15
Analytic Format. ...... , . • . . . . . . . . . . . . . . . . . . . . . . . . . . .. 17
Methods of Dimensional Analysis. . . . . . . . . . . . . . . . . . . . .. 18
Incident Data. . . . . . . . . . . . . . . . . . . . . . . . . . . . . . . . • . . . . . . .. 18
Results of the Cluster Analysis ........ , . . . . . . . . . . . . . .. 20
Findings (Cluster Analysis) ..•. ~ . . . • . . . . . . . . . . . . . . . . . .. 22
Type of Offender and Type of Property Stolen. . . . . .. 23
Type of Offender and Amount o~ Financial Loss. . . . .. 27
T~pe of Offense and Type of Property Stolen. . . . . • •. 27
Type of Offense and Amount of Financial Loss. . . . . .. 27 Offense/Offender Types and Sex of Apprehended
Offenders. . . . . . . . . . . . . . . . . . . . . . . . . . . . . . . • . . . . . .. 29
Offense/Offender Types and Distance From Residence to Burglary Site ......•.... ': . . . . . . . . . 31
Offense/Offender Types and Temporal CharacteristiCs. . . . . . . . . . . . . . . . . . . . . . • . . . . . . . . . 31
Summary of Offense/Offender Typological Analysis.. 31
Analysis of Demographic Characteristics. . . • . . . . . • . . . .. 31
Sex. " ..... " ... " .... , .. , . ~ " . " . I II •••• ~ " " 11 " 11 ............. • " 31
Race ..... "." .. I1/. <1" ••• " ••••• " ••• "" ••• 1.1 ••••• · •••• .,. 35
Age ........ " .. " " . 11/ ••••• " •••• " " ",. " II , • " " " " •••• " • " ". 38
Summary and Discussion. . . • . . . • . • . . . . . . . . . • . . . . . . . . .. 41
9
--~------------------------~---------------------------~

Conclusions: The Nature of Burglary. . . . . . . . . . . . . . . . . .. 41
Patterns of Burglary., ............................. 43
Temporal Characteristics. . . . . . . . . . . . . . . . . . . . . . . . .. 43
Methods .......................................... 44
Attempted Versus Completed Burglaries. . . . . . . . . . .. 45
Burglary Clearances ............................... 45
Prior Criminal History .............................. 46
Mobility. . . . . . . . . . . . . . . . . . . . . . . . . . . . . . . . . . . . . . . . .. 46
Single and Multiple Offender Burglaries. . . . . .. . . . . .. 48
Police Screening. , . . . . . . . . . . . . . . . . . . . . . . . . . . . . . . .. 48
Methodological Observations...................... 49
" References. . . . . . . . . . . . . . . . . . . . . . . . . . . . . . . . . . . . . . . . . .. 51
10
i
1 ! I
} 1 1
I J 1 i
I .~
l t

TABLES
Table 1 Characteristics of burglary incidents cleared by arrest. . . . . . .. 19
Table 2 Distribution of burglary incidents cleared by arrest, by census tract characteristics. . . . . . . . . .. 20
Table 3 Cluster analysis solution for burglary incident characteristics.. 22
Table 4 Cluster analysis solution for burglary offender characteristics.. 23
Table 5 Type of burglary incident, by type of offender .. .. .. .. .. .. .. .. ... 24
Table 6 Type of offender, by type of prop-erty stolen ................... 26
Table 7 Type of offender, by amount of financial loss . . • . . . . . . . . . . . . . .• 28
Table 8 Type of burglary .. incident, by type of property stOlen.. ... ........ 29
Table 9 Type of burglary incident, by amount' of financial loss ....... ·30
Table 10 Temporal characteristics of burglary incidents, by sex of ap-prehended offenders ........ ~. 32
Table 11 Methods employed in burglary incidents, by sex of apprehended of-fenders .....•.•... " ..... / ....... 33
()
Table 12 Selected characteristics of burgla-ry incidents, by sex of apprehended offenders. . . . • . • . .. 34
Table 13 Temporal characte~istics of burglary incidents, by race of apprehended offenders . . . . • . . . .. 35
Table 14 Methods employed in burglary incidents. by race of apprehended offenders. . . . . . . • • . . . . . . . • . • •. 36
Table 15 Selected characteristics of burgla-ry incidents, by race of apprehended offenders. • . . . . . • .. 31
Table 16 Temporal characteristics of burglary incidents, by age of ap ... prehended offenders . . . . . • . . .. 38
Table 11 Methods employed in burglary incidents, by age of apprehended offenders. . . . . . . . . . . . . . • . . . . .. 39
. Table 18 Selected characteristics of burgla-ry incidents, by age of apprehended offenders ....•. , • .. 40
Table '19 Whether or not loss resulted from burglary, by type of arrest of apprehended offenders •.... , . • .• 41
(' "~ 1,1


Highlights of the Findings
IN THIS REPORT, the characteristics of burglary incidents that occurred in 'six separate police jurisdictions over a I-year period were examined. The focus here was on a patterned link between burglary offense and offender characteristics. That is, an attempt was made to determine whether certain types of burglary offenders committed certain types of burglaries. Females were substantially mOJe likely than males to burglarize nonresidential structures, using.little orno foice to gain entry. Black/other offenders were more likely than w.hite offenders to use a tool, make forcible entries and damage property. Those 18 years of age and older were more likely than those younger to commit burglaries at night and i\
during the winter. Aside from some minor relationships, however. burglary was not found to be a patterned event-that is, certain types of burglary offenders did not tend to commit particular types of burglaries. .
13

~ I !
"

-CRIME-SPECIFIC ANALYSIS: An Empirical Examination of Burglary Offense and Offender Characteristics
Introduction
A PRIMARY OBJECTIVE of this report is to examine the relationship between burglary incidents and individuals apprehended for these burglaries. In other words, are certain kinds of burglaries committed by certain kinds of burglars? The research question and subsequent findings represent the culmination of an analysis begun in two earlier reports (Pope, 1977, 1977a). The data in these reports indicated, for example, that arrested juvenile offenders (those 17 years of age or younger) tended to commit burglaries less than 1 mile of their residences and in the company of others, and that arrested female offenders were more likely to commit burglaries outside the areas of their residences and with other persons. A number of burglary incident characteristics were also found to be related. For example, residential burglaries were more likely than nonresidential burglaries to involve financial loss and to occur during the daylight hours and on weekdays.
Thesf""{indings illustrate that the characteristics of burgl~.,y offenders as well as burglary incidents exhibit certain patterns. Knowledge of burglary is incomplete, however, without knowing if Of how these patterns intersect. That is, by knowing something about burglary incidents, does one also know something about those offenders who were involved in the incidents and vice versa?
Before proceeding with the analysis of patterned relationships in the commission of burglary, a few preliminary remarks are in order. As noted above: this report is a continuation of two previous works focusing on incident and offender characteristics in burglary. Although the data base is briefly described in this report, a more detailed discussion can be found in the two earlier reports. Ful'thermor"e, the procedul'es used to analyze the d~ta in this report are
at times quite complex and mathematically sophisticated. An attempt has been made to limit the complexity of the presentation by minimizing the technical discussion and briefly summarizing the procedures. Emphasis is focused on the conceptual rather than technical aspects of this undertaking. A summary of the major findings of the three reports begins 011 page 41.
Interrelationship Among Crime Characteristics
As Wolfgang observed in his classic study of homicide,
Most previous research has examined either the victim or the offenaer. In the present work, analysis has been made of both victims and offenders, separately, as distinct units, but also as mutually int'fracting par~ ticipants. , .. It is one type of analysis to consider victims a$ a social group and offen~ ders as another social group, it is quite a different and more refined type of analysis to consider specific victim-offender rell\tionships, and to find race, sex, agejand other patterns among them (1958:319).
By examining these victim.offender patterns, Wolfgang contri,buted both substantive and theoretical knowledge about homicide and other violent crimes. Although homicide was generally found to be an unplanned act, a number of empirical uniformities were noted. In two~thirds of the cases analyzed, alcohol was present in the victim, the offender, or both (Wolfgang, 1958:322). Wives wel'e substantially more likeiy"td<be slain by their husbands than vice versa (Wolfgang, 1958:325). Approximately one-fourth of all homicides were found to be victim precipitated, in that t.he victim had some
15

,-------~------------~--~
hand in his own death, for example, by initiating an altercation (Wolfgang, 1958:325). Furthermore, certain characteristics were found to be associated with victim-precipitated homicides, leading Wolfgang to conclude:
c'
The role~ and the characteristics of the victim and the offender are reversed, and the victim assumes the role of determinant. This study has been one of the first to provide significant empirical data to support yon Hentig's assertions about the contribution of the victim to. the genesis of his own victimization (1958:326).
The characteristics of those individuals predominantly involved in the killing of others laid the foundation for Wolfgang's theory abol,lt the existence of a subculture of violence. Those p~rsons were hypothesized to share certain values and norms that conflict with those of the larger culture, so that forces leading toward an eventual homicide would be expected and homicide would be seen as a normal reaction by members of the subculture. For example, whereas persons internalizing the norms of the larger culture may simply shrug off an insult, subcultural members would be more likely to respond with physical aggression. In an examination of rape events in Philadelphia, Amir also found the existence of significant patterns in the relationship between the victim and offender. Again, rape offenders exhibited distinct characteristics in relation to those incidents in which they were involved. These findings lent further support to the subculture of yiolence theory. As Amir stated: "Of course, it is always people who commit rape, but the rate of rape is conditioned by the cultural norms and social organization or disorganization of the group to which they belong" (1971 :320).
Without such analyses of both incident and offender characteristics, much less would be known about homicide and rape. Furthermore, many erroneous theories concerning such acts, for example, that blacks disproportionately kill or rape white victims, would still be accepted by many as fact: Without the empirical analysis initiated by Wolfgang, knowledge about and implications ofvictim-precipitated crime would still be untested conjecture,' as
,j"
would the existence of a subculture of violence. More recently, Normandeau's (1968) examination of interrelated patterns in robbery has suggested a refinement of the subculture of violence hypothesis. Normandeau notes:
16
There i,') no trace among the arrested robbers (Negroes or whites) in our study of a large class of robbers with long previous recO'rds of violence. They are not a special class but are primarily thieves who occasionally, though rather rarely, use force to achieve their objectives. The display of violence in this context is on the whole an isolated episode (1968:309).
,Therefore', robbery offenders may be better characterized as falling into a subculture of theft rather than of violence.
Aside from the theoretical knowledge drawn from studies such as those just noted, practical implications are also apparent. If violent offenders are somehow conditioned or molded by subcultural contacts, such as peer group role models, then treatment or rehabilitation programs focusing on the individual offender are likely to prove futile if the total social environment is not considered. If an individualized treatment program is applied to such offenders, either in an insti.tution or other setting, any rehabilitative effects are likely to be nullified when the offender must oO'.::e again adapt to the subcultural environment in olLder to survive. In an article focusing on classification of offenders for treatment purposes, Warren notes the following about offenders who identify with the subculture: '
The essential characteristics of this type of offender is that the individual, although developing "normally" in most respects, has internalized the value system of a deviant subculture (1971 :253).
Warren then recommends two levels of treatment, one aimed at stopping the antisocial behavior and the gther directed toward changing the content of the offender's value system. The latter approach might involve a broadening of the offender's self image by providing a strong identity model representing the values of the larger culture. Regardless ofthe merits of such an approach, the point is simply that empirical findings may provide the foundation for a 'program of planned change.
Unfortunately, analysis of the patte,rning of property offenses is far behind similar research on violent and personal crimes. As noted in earlier reports, little information currently exists concerning the characteristics of burglary offenders, especially as they relate to burglary incidents. Although Reppetto (1974) constructed profiles of offender characteristics, they were based primarily on personal interviews with adjudicated burglars.

Furthermore, these profiles were formed on singular defining characteristics and were found to overlap substantially. Scarr's (1973) profiles or typologies are even less compelling, because they were based upon impressions gained from criminal justice func~ tionaries. In neither case are the distinctions made among burglary characteristics empirically grounded. Thus, answers to many questions about the nature of burglary are. still unclear. The findings reported later represent an effort to provide some of these answers by undertaking an empirical analysis of the correlate~ of burglary offenses and. offenders, and their patterning.
Analytic Format , I(
The data utilized to exffuine the patterning ·of offense and offender characteristics were derived from a crime-specific burglary program conducted by the California Council on Crime and Justice. Burglary data were compiled in six separate police
. jurisdictionsl and covered a 1 ~year period from April 1972 to May 1973 .. Information was provided on both characteristics of the incidents (e.g., type of target, time of day, method of entry) and on characteristics of offenders who were apprehended during the course of the project (e.g., race, age). Overall, the data contain much more information ,on both offenses and offenders than do data that are normally appended to police incident report forms; it thus provides a solid basis for the present undertaking.2
lThe six agencies involved in the California burglary proJect Included the San Francisco, Oakland, los Angeles, and
,San Diego Police Departments plus the los Angeles and Orange County Sheriffs' offices. The reader is referred to the first report in this series for a more detailed discussion of the data base (Pope, 1977a).
2For both offense and offender Infc.lrmation, a distinct crime report number was appended to ;he original coding form, which provided a means of linking together offense and offender characteris~ics. Thus" if an offender was apprehended for a burglary offense committed in one of the target areas durIng the course of the project, the otfender was provided with the same crime number as the incident Itself. Since It was possible that more than one offender was involved in a particular incident or1hat one offender committed a number of burQlarles, it was necessary to repeat each Information fklld to provide for multiple offenses and offenders. That is, It more than one offender was involved in a burglary incident, burgJary offense information Was repeated fot each offender. Similarly, It more than one offense was associated with a particular offender then the offende.r information was repeated. The end result was a matched data set of 1,196 cases in which each of.
(;:; Although it might have been possible to discern interrelated patterns by cross-tabulating each offense variable by each offende~ variahl~~':lch a process is often ineff~cient and wasteful of infOrmation. The use of bivariate cross-tabulation, for example, would effectively preclude the simultaneous consideration of numerous variables that may interact )Vith one another:. The earlier analysis indicated that some variables evidence a highly interrelated structure.
In light of the limitations of analytic techniques such as those noted above, a viable alternative for maximizing the amount qf information in the data would be to establish dimtmsions (subsets of interrelated variables) of both offense and offender charac-
. teristics and then classify various cases (entities) on the basis of these dimensions. The rationale behind this procedure is actually quite simple. The process begins by forming separate offense and offender dimensions of mutually colinear variables, I.e., those. that are highly related to each other. Next, those cases exhibiting similar patterns across these dimensions are grouped together. The end result is an empirical typology of both offenses and offenders that can then be cross-classified to assess the degree to which the various patterns are related.
A hypothetical example may help to clarify the process. Consider the relationship between two possible offense and offender types. Offense type A consists of daytime burglaries of residences in which no force was used to gain entry and the value of the property stolcn was minor. Type B includes nighttime burglaries of commercial establishments in which entry was gained via the roof and the amount of loss was substantial. Offense type A may be considered a burglary of opportunity, whereas type B shows evidence of sophisticatioJ1<:. and planning. Individuals subsumed under offender type A may be ., juvenile males with prior drug arrests who were on parole at the time of their arrest. Offender type B may include adUlt males who have a history of prior burglary arrests and work in groups. Offenders classified under type A evidence adrug-survivaJ orientation; type B offenders exhibit qualities of the semiprofessional burglar. The labelS attached to each type,are, of course, provisional.
fender was linked to each Incident and vice versa. Although the procedure introduces a certain degree of error, a'rlY biasIngeffects should be minimal because we are primarily concerned'with the correlates of Individual offense and offender characteristics, " ~::
(;) 17

Cross-classificatiQn of the offense and offender types would test the accuracy of the labels. For examplejif "burglaries of opportunity" are committed by those showing characteristics of "drug survival" and if few "semiprofessional burglars" are found to commit such offenses (because they are more likely to commit planned burglaries in which profits are relatively lucrative), then the conceptualizations of the types will have survived an important test. If, on the other hand, the types have no predictiv,e validity, then the theory implied in conceptualizatibnpf the types is falsified. Of course, in practice, types are first constructed empiric all y, and conceptualization occU:~s only after predictive validity has been established (or in the process of determining the utility of the types). If the types prove to be nonpredictIve, conceptual or theoretical extensions are doomed a priori.
Methods of Dimensional Analysis
Because the first task in the process outlined above is to establish empirical dimensions of mutually colinear variables on which cases may later by typed, cluster analysis would seem to be an appropriate method for accomplishing this objective.3
3Both factor and cluster analysis are appropriate techniques for redUcing data to a manageable subset. There are, however, some crucial dlfferences in procedure. A major
. difference between the two techniques lies in the mathematical procedures used to reach a final sOluti:m and the manner in which dimensions are extracted. Factor analysis derives dimensions (factors) based upon the total data set; cluster analYSis, on the other hand, derives dimensions (cLusters) based Upon a subset of variables that are mutually colinear.
'These mutually collnear subsets of variables are used to reproduce (maximize the variance in) the original correlation matrix rather than dimensions defined by the complete set of variables. Similarly as Bailey observes:
In cluster analysis we draw boundaries so that ~ach object Is In one (but only one) group. Thus we meet the typological requirements of exhaustiveness and mu.tual exclusiveness. In factor analysis we place a facto~ through a cluster of vectors; each object is represented by a vector and each vector represents a condensation of the vectors. The set of factors is not mutually exclusive and exhaustive, All object can belong to (load positively on) more than one factor pecause the object's variance is divided between factors (1975:62).
If the IndivIdual faotors are not mutually exclusive, then objects that are later typed (grouped) on the basis of thOSe factors may form overlapping types. Because it is desirable that both offense and offender types be as Independent as possible so that cross-classIfication will produce meaningful results, the clUster analytic solution would seem to be the more ap-propr~~_procedure, u
18
Although the general technique of clustering originated in the early thirties; computational difficulties coupled with the lack of digital computers hampered its development. Within the last 20 years" however, a fi1ultitude of clustering procedures have"-proliferated in such diverse .areas as psy,. chology, anthropology, and biology. At the present time, therefore, a researcher desiring to apply clustering techniques to data has a wide variety of methods from which to choose.
The general method of clustering utilized in this study was developed by Tryon and Bailey (1970) under the nam~:::bf "cumulative communality key cluster analysis." As Tyron and Bailey note: "Cluster analysis is the general logic, formulated as a procedure, by which we objectively group together entities on the basis of their similarities and differences" (1970:1). The method extracts clusters of variables (V -analysis) or objects (O-analysis) that are as general as possible and in which those entities making up a cluster are highly intercorrelated. The process defines clusters that are as independent of each other as possible. By this method, more of the information contained in the data can be used than could be used in prior crime-specific studies that relied almost exclusively on tabular analysis. Rather than considering only two or three variables at one time, all relevant data were explored and homogeneous groupings of attributes extracted.
Incident Data
Table 1 provides a listing of those burglary incident characteristic variables entered into the clustering routine. These data represent 1,196 incidents for which corresponding offender information was also available.4 In the first report in this series, the distributions of all burglary incident characteristics were examined and discussed. Here, only those incidents that were cleared by the arrest of an offender are of concern, thus allowing for the examiIi'ation of offense and offender patterns. Table 1 shows each characteristic dichotomized into mutually exclusive categoHes for those incidents cleared by arrest.
4These data comprise the matched set of 1,196 offense and offender cases derived py the procedure discussed In footnote 2. Because these data represent those Incidents cleared by the arrest of the offender, frequency distributions may differ from those noted for all the burglary Incident data (N=B,137) as discussed In the first report (Pope, 1977a). Because clustering was done with the former data set, It would seem appropriate to present the frequency distributions for those Incident cases cleared by arrest.

TABLE 1 Characteristics of burglary incidents cleared by arrest
[Percent]
Characlerlstlca- Case dlatrlbutfonb
'" Day of week:
Weekday 69 (777) Weekend 31 (355)
Time of day: Day 43 (437) Night 57 (570)
Type of structure: Residential 61 (729) Nonresidential 39 (467)
Point of entry: Door 61 (678) Window 39 (439)
Use of force to gain entry: No force 44 (506) Force 56 (651)
Outcome: Attempted 5 (62) Completed 95 (1,134)
Use of tool to gain entry: ( 47 (539) No tool :
Tool 53 (606)
Loss: No loss 37 (368) Loss 63 (622)
I~
Damage occurred: No damage 46 (538) Damaga 54 (626)
Type of property stolen: Money or hard salable items 65 (577) Other 35 (318)
Method of detection: Return of victim 51 (606) Other 49 (587)
Extent of street lighting: Street lights within 100 feet 68 (794) No street lights within 100 feet :32 (378)
'"'U
" .~,
~! ABLE 1 concluded
[percent]
CharactClrlatlca· Caae dia,ributlonb
Lighting with respect to point of entry; Point of entry lighted 35 (405) Point of entry not lighted ' 65 (751)
Visibility of point of entry: Point of entry visible 65 (757) Point of entry not visible 35 (400)
Extent of alarm systems: Premises without alarms 84 .(1,008) Premises with alarms 16 (188)
Functioning of alarm systems: Alarm operated 49 (91 ) Alarm did not operate 51 (94)
Security inspection conducted: Security inspection 14 (161) No security inspection 86 (1,013)
Target area: Northern California 37 (445) Southern California 63 (751)
Dog on premises: Dog present 8 (59) Dog not present 92 (678)
Serial numbers etched on property: • Identifying serial numbers 9 (50)
No identifying serial numbers 91 (672)
aThe first report in the series (Pope, 1977a) contains 8' detailed discussIon of these characteristics and the proceduresused to arrJve at each dichotomy. The more extended presentation, however, is not essential for understanding the analysis lIndertaken in thIs report.
bThe total number of cases for each variable lilay vary because of missing cases.
Overall, the distribution of cases among these variables is quite similar to those observed for the entire data set. (See pope, 1977a.) For example, attempted burglaries account for 5 percent of all burglaries and 5 percent of those cleared by arrest. Similarly, 44 percent of aU reported burglaries and 43 percent of those cleared by arrest occurred during the daylight hours.
19

However, the first report of this series showed that some of these variables were highly related to whether the offense was cleared, For example, burglaries resulting in no financial loss were substantially more likely to be cleared (whether by the arn:~st of an offel)der or other means) than were bUrglaries resulting in a financial loss, Eighteen percent of all reported burglary incidents evidenced no financial loss compared with 37 percent of those inci,gents cleared by arrest. Seventy percent of all
incidents cleared by arrest fall into the two lowermedian income categories and only 3.5 percent fall into the two higher c;~tegories. Similarly, for median education completeq, 7 percent of the incidents are included in the highest education category compared with 36 perit:ent in the lowest education category. However; overall, Table 2 reveals a greater percentage of cases distributed in the higher income and educatipnal categories when compared with the entire dataset (N =8,137) (Pope, 1977).
TABLE 2 Distribution of burglary incidents cleared by arrest, by census tract chcracteristlcs
[Percent]
Cenlul tract Case distribution characterlstlcI Low LC?w-medlum Medium-high High Totala
Median family 33.5 Income (396)
P~ii:::int of labor force 14.8 that Is female (175)
Median edUcational 35,5 level (403)
Percent of population 16.0 that Is black (189)
Percent of homes that are 27.3 owner-occupied '-{315)
aTotals may not add to 100,0 percent because of rounding.
reported burglaries involved residential structures, but only 61 percent of all burglaries cleared by the arrest involved residential structures. Other differences should be noted between those cases cleared by arrest and the larger data set. The former include a greater percentage of burglaries in which no force was used to gain entrance, no tools were utilized. and no property damage resulted.
Table 2 presents the distribution of burglary incidents by census tract characteristics for those cases cleared by arrest. Similar to the total data set, most of the cases fall into the lower education and incom~ categories, and into al'eas with a high percentage of black population. Approximately 65 percent of the
20
31,6 23.4 11.4 (374) (277) (135)
35.6 31.8 17.8 (421) (376) (210)
34.8 22.6 7,1 (395) (256) (80)
27.5 24,9 31.6 (325) (294) (373)
<~ 28.3 26.1 18.2 (326) (301) (210)
Results of the Cluster AnalysisS
99,9 (1,182)
100.0 (1,182)
100.0 (1,134)
100.0 (1,181 )
99.9 (1,152)
Analysis of these data resulted in three empirically and conceptually distinct offense dimensions consisting of the use and amount of force to enter a premise, the characteristics of the target area
5Because the logic and procedures for cluster analysis can be quite complex, the discussion focuses primarily upon concep'lual rather than empirical tasks. For a more detailed presElhtation the reader is referred to Cluster AnalysIs by Tryon and Bailey (1970).

(census tract), and the type of structure burglariied.6
Cluster analysis of the total 8,137 reported burglary incidents was also undertaken to compare the results with those obtained from the cases cleared by arrest. 7 The data were randomly divided into two groups for cluster analysis. The results of the cluster analysis for both halves indicated three dimensions conceptually similar to those found for incident cases cleared by arrest. Thus, dimensions of burglary incidents were found to be constant across all data, whether cleared by arrest or not. Thus, these results support the overall reliability of the cluster solution.
For each case a composite cluster scoreS was computed on each of the three offense dimensions, which were labeled Force, Area, and Structure (Table 3). Scores were then grouped into similar profile patterns thereby forming distinct types. This process-known as object cluster analysis (or 0-analysis)-resulted in seven distinct, mutually exclusive incident types (I-types) as indicated in Table 3. Tpus, I-type 1 includes those cases characterized
6The defining variables for each cluster dimension were as folioNs: first dimension-property damage occurring during tl'te burglary, force used to enter structure, tool used; second dimenslon-medi~.n family income, median years education completed, percentage of homes owner-occupied, percentage of the population that is black; third dl,nensionburglar alarm system, type of structure burglarized.
70ften, questions arise concerning the reliability of cluster solutions. That is, some argue that cluster analysis capitalizes on chance variation and, therefore, solutions are likely to differ when used on similar data collected In different areas or for different tim';l periods. If data are longitudinal in nature, one check on thb"reliability of cluster solutlons would simply be to repeat the analysis at different points In time. Results can then be compared across time periods. Another reliability testing technique often used in social science research Is that of split-half, that is. randomly dividing the data Into two groups and then comparing the results In both groups. In order to provide some overall measure of the reliability of the cluster solution, it was decided to apply a split-half technique because the total data set contained a sufficient number of burglary Incident cases (8,137) to support such a method.
8Although there are numerous ways to obtain cluster ., scores, the procedure decided upon was a simple sum scoring method. As Tryon and Bailey note:
The most meaningful weight matrix is the simple sum type ••. where the standard scores on a subset of variables form a composite score on that dimension: each variable participating In the composite does so with a weight of 1.00; the non defining remaining variables contribut(} a weight of .OO'rpn common sense grounds this form of wei~tililng makes dimensions easier. to interpret thanJhfJ case in which the variables show graded Weights (1970:175).
o
by no force used to gain entry, relatively disadvan~ taged social areas, and nonresidential targets. In contrast, I-type 6 includes those burglaries in which force was used to enter residential structures in socially advantaged areas. Incident-type 7 contained the highest percentage of cases (32 pet cent) and incident-type 2 the lowest (4 percent). Homogeneity estimates, which simply'measure how well the data "fit" the profiles of the objects in each Ootype, were generally quite high, indicating that the cases falling in each type exhibited very ,similar profile patterns. The closer the homogeneity estimate to value 1.000, the more alike the mem bers of the profile are. A zero value would indicate that those objects in each core Ootype are completely unalike in their score profiles. In other words, their score profiles would be randomly distributed.
Offender variables were next enter~d into the variable cluster routine. The dichotomized values of these variables were: I'
-,' 1. Northern California/southern California 2. 17 years or younger/I 8 years or older 3. White/black-other 4. Male/female 5. Reasonable cause/other type of arrest 6. Single offender/multiple offenders 7. Burglary less than 1 mile from offender's
residence/burglary 1 mile or more from of-fender's residence .
8. Released by the police (complaint not filed)/held for prosecution (complaint filed or suspect transferred.·.to the jurisdiction of another agency)
9. No prior record of any kind/prior arrest record
10. Not under supervision/under supervision 11. No prior drug arrests/prior drug arrests 12. No prior burglary arrest record/prior
burglary arrest record
Only one dimension of mutually colinear offender variables was derived. This dimension reflected the· overall previous criminal history of apprehended burglary offenders.9 In addition to this dimension, two conceplually important variables were also included as dimensions. On the basis of previous analysis, an arrestee's race and the number of offenders involved in the incident were selected as the two variables most likely to discriminate among cases in
h ,
9This dimension included the following variables: prior criminal record, prior burglary record, offender's age, criminal status at the time 01 arrest, and prior drug arrests.
21

TABLE 3 Cluster analysis solution. for burglary incident characteristics
Homogeneity Type of burglary Incident
,-- Number of Percent of acro •• Incident cluster dimensions burglary burglary attribute
Incident. Incident. dimensions Forcea Areab Structurec
I-Type 1 89 7.95 .9000 Low Low High
I-Type 2
I.Type 3
I-Type 4
I-Type 5
I-Type 6
I-Type 7
48 4.29 .7788 Low High Low
194 17.34 .8728 Low High High
77 6.88 .8373 High Low Low
277 24.75 .8529 High Low High
79 7.06 .8704 High High Low
355 31.72 .8572 High High High
aThls dimension Includes. property damage occurring during the burglary, force 'used to enter structure, and use of a tool.
bThis dimension Includes median family Income, median years education completed, percent of owner-occupied homes, and percent of population that Is black.
cThls dimension Includes burglar alarm systems and the type of structure burglarized. ,
the lattlr O-analysis. 1 0 The three offender dimensions thus cO\lsi!lted of the criminal history of burglary offenders, race (whether white or black/other), and the number of offenders involved in the incident (whether single or multiple offenders).
O-analysis of th,e data resulted in eight distinct criminal types (C~Types). C-Type 1, for example, included burglary offenders who had no prior record, were white, and worked alone; on the other hand, Ctype 8 included black/other offenders who had prior records and worked in groups. Table 4 shows the overall homogeneity coefficients were quite high, indicating that cases within each of the C-Types displayed quite similar patterns across the three offender dimensions.
By using the above cluster analytic methods, a large body of burglary data could be reduced to a more manageable form, thus simplifying the analytic task. Aside from the large number of variables, most of which were nominally scaled, it was quite difficult to determine dependent and independent variable relationships. That is, for the most of the incident
10The sscond and third dimensions each consisted of single defining variables. For the second variable race was utlil~ed because, overail, It was less substantially correlated with the defining variables of cluster one, and therefore, thOl;ght to be a good discriminator. The third dimension was defined by the number of offenders In the Incident, which was also correlated less with the definers of dimension one than were the other offender variables."
22
characteristics it was not theoretically meaningful to differentiate between whether the variables were dependent or independent. The temporal order for many of these variables, for example, would be quite difficult to determine. Cluster analysis made the reduction of the complexity of the data possible by creating sets of multi~dimensioned nominal variables and then determining how cases distributed themselves among the resulting categories or sets.
Because the resulting I (incident) and C (criminal) types were derived from a matched data set, it is possible to include each type as a new variable in the analysis. Using these respective types as variables, a bivariate cross-tabulation can be produced that, aside from being conceptually clear, includes many of the complex relationships found among variables in the original data set. By cross-tabulating types of offenses with types of offenders it is possible to determine the extent to which the characteristics
!
are interrelated.
Findings (Cluster Analysis) The analytic findings reported in this section
begin with an examination of the relationship between the offense and offender types that were derived earlier ,II Tabular results presented here
11The major findings are summarized and discussed on page 41.

,.....-------------------_._------------- --- --------~----------- -- -
, TABLE 4 Cluster analysis solution for burglary offender characteristics
11rfomogenelty Offender clulter dlmenllonl Number of Percent of IIcr011
Type' of burglary burglary .. attribute Criminal Crime offender offender. offander. .. dlmenllonl hlltOryll RBceb partnertC
O-Type 1 122 10.20 .9787 Low Low Low
O-Type 2 410 34.28 .9BB3 Low Low High
a-Type 3 58 4,85 .9727 Low High Low·
O-Type 4 190 15.89 .9819 Low High High
O-Type 5 116 9.70 ,9682 High Low Low
O-Type 6 147 12.29 .9651 High Low High
O-Type 7 63 5.27 .9620 High High Low
O-Type e -:- 90 7 .. 52 .9676 High High High
aThis dimenSion includes prior criminal record, prior burglary record, offender's age, criminal status at the time of arrest, and prior drug arrests.
bThis dimension includes white versus black/other offenders.
cThls dimension Includes single versus multiple offenders.
show empirically whether and to what extent composite offense characteristics are related to offender characteristics. The remainder of this section is devot~d to an analysis of the relationship between the cluster types and other incident characteristic variables such as the amount of financial loss and
,'/ type of property stolen, varIables that were excluded from the cluster analysis process. Singular attribute variables such as age, race, and sex are also examined with respect to the remaining incident and offender variables. Overall, these findings provide a comprehensive picture of those patterned relationships associa~ed with the crime of burglary.
Table 5 presents the joint relationship between the seven offense I-Types and the eight offender CTypes. Both row and column percentages are shown in order to assess the degree to which these types are interrelated. The overall results displayed in Table 5 are informative but not as substantial as might be expected. If row or column percents that exceed the marginal percent distribution by 10 percent points were accepted as a criterion for establishing a substantial relationship,12 only one relationship could then be considered substantial.
121n the previous two reports a 10 percent point difference was utilized to evaluate the magnitude of observed relationships. That Is, If a percent difference was 10 percent points or greater. then the relationship was considered substantial. If
Although some interesting patterns are suggested in Table 5 the cross-tabulation of offense and offender types evidenced no predictive utility from one set to the other. That is, on the basis of these findings it must be concluded that there is no overall interrelationship between the eight offender types and the seven offense types.
Type of Offender and Type of Property Stolen
In an effort to examine further the underlying nature of burglary, the offense and offender types were each cross-tabulated with the type of' property stolen and the amount of financial loss as a result of the burglary. Table 6 provides information about the joint relationship between the eight offender CTypes and the type of property stolen. These data show that among the various offender types currency is most likely to be stolen during burglaries committed by white offenders who work alone and have no previous criminal record (C-Type 1), followed by!' those white offenders who work alone and have a,) prior record (C-Type 5). The proportion of cases in the former group (41 percent) compared with the
the relationship showed less than Ii 10 percent point difference, \t was not considered sUbstantial. For' a more detailed discussion of this procedure see Pope (1977a).
23
TABLE 5 Type of burglary incident, by type of offender
[Percent)
C-Typ1J 1 C-Type2 C-Type 3 C-Type 4 No criminal record No criminal record No criminal record No criminal record
Type of White White Black/other Black/other burghiry illcidant Single offandel' Multiple offenoors Single offender Multiple offenders
I-TyPe 1 Low force ga 33 9 23 Low status area 7b 7 15 11 Nonresidential structures (8) (29) (8) (20)
I-Type 2 Low force 13 35 4 21 High status area 5 4 4 6 Residential structures (6) (17) (2) (10)
I-Type 3 L1JW force 9 41 3 20 High status area 16 21 9 22 Nonresidential structures (18) (80) (5) (39)
I-Type 4 High force 7 18 4 25 Low status area 4 4 6 11 Residential structures (5) (14) (3) (19)
I-Type 5 High force 12 28 7 20 Low status area 28 20 33 31 Nonresidential structures (32) (78) , (18) (54)
I-Type 6 High force 9 34 5 4 High status area 6 7 7 2 Residential structures (7) (27) (4) (3)
I-Type 7 High force 11 41 4 8 High status area 34 37 26 17 Nonresidential structures (39) (145) (14) (30)
Total 10 35 5 16 100 100 100 100
c:'
(115) (390) (54) (175)
aRow percent. bColumn percent.
total proportion of cases in which money was taken (20 percent) yields a difference of 21 percent points. Earlier, these two offender groups were found to be
randomly distributed across the seven offense types. (See Table 5.) If these offenders tend not to specialize in particular types of burglary but rather respond
o
24
C·Type6 C·Type 6 C·Type1 Crimlnal record Criminal record Criminal record White White Black/other Single offender Multiple offendllrs Single offender
5 10 8 4 7 12
(4) (9) (7)
2 10 4 1 4 4
(1) (5) (2)
9 10 4 17 14 12
(18) (20) (7)
10 16 8 8 9 11
(8) (12) (6)
10 9 6 27 19 28
(28) (26) (16)
10 22 6 8 12 9
(8) (17) (5)
10 14 4 36 36 25-
(37) (50) {14)
9 1 :~ 5 100 100 100
(104) ('139) (57)
as opportunities present themselves, it is logical that ,they would prefer currency because it is easy to remove from the premise 'and can be used im-
TABLE 5 concluded
C·Type8 Criminal record elack/other Total Multiple offenders,
5 100 5 8
(4) (89)
10 100 6 4
(5) (48)
4 100 8 17
i7) (194)
13 100 12 7
(10) (77)
9 100 29 25
(25) (277)
10 100 i/ 9 7
(8) (79)
8 100 31 ~2 (27) (aS6)
8 100 100 100 '(86) (1,120)
J~
mediately. Hard salable items such as televisions, stereos,
appliances, and similar commodities are shown to be
(I
25
--- --- ~--- -~~-~---------------------

TABLE 6 Type of offender, by type of property stolen
[Percentl Type of property stolen
Soft Hard Items Jewelryl salable salable " from ,.
Item,a Item.b (J
Type of offender Money fur. Drugs Firearms lafe Total
C·Type 1 I)
No criminal history 41 c 4 12 38 3 3 0 100 White 21d 6 12 7 17 4 0 10 Single offender (33) (3) (10) (31) (2) (2) (0) (81 )
C·Type 2 No criminal history 23 9 8 51 2 7 1 100 White 38 42 26 31 50 36 100 34 Multiple offenders (59) (23) (22) (132) (6) (17) (2) (261)
C·Type 3 No criminal history 16 11 16 51 0 5 0 100 Black/other 4 7 7 5 0 4 0 5 Single offender (6) (4) (6) (19) (0) (2) (0) (37)
C·Type 4 No criminal history 16 5 14 56 0 9 0 100 Black/other 13 11 21 17 0 23 0 16 Multiple offenders (20) ,:~(6) (18) (71) (0) (11 ) (0) (126)
C·Type 5 Criminal history 28 7 9 51 3 3 0 100 White 13 9 7 9 17 4 0 9 Single offender (20) (5) (6) (36) (2) (2) (0) (71)
C·'rype 6 Criminal history 8 8 9 64 2 9 0 100 White 5 15 11 15 17 19 0 13 Multiple offenders (8) (8) (9) (64) (2) (9) (0) (100)
C·Type 7 Criminal histo,ry 6 6 15 71 0 3 0 100 Black/other 1 4 6 6 0 2 0 4 Single offender (2) (2) (5) (24) (0) (1 ) (0) (34)
C·Type 8 Criminal history 12 6 12 66 0 5 0 100 Black/other 5 7 10 11 0 6 0 9 Multiple offenders (8) . (4) (8) (44) (0) (3) (3) (67)
rotal 20 7 11 54 2 6 0 100 100 100 100 100 100 100 100 100 (156) (55) (84) (421) (12) (47) (2) (777)
aFor example, clothing and furniture. ~or example, televisions and stereos .
. " CRow percent. dColumn percent.
26
~i /i

~.
\ \ \\ ,I V
targets of offender C-Types 6, 7, and 8. All of these types share some similar characteristics in that they include offenders who have previous criminal records. Other characteristics include white offenderswho work in groups (C-Type 6), black/other offenders who work alone (C-Type 7), and black/other offenders who work in groups (C-Type 8).
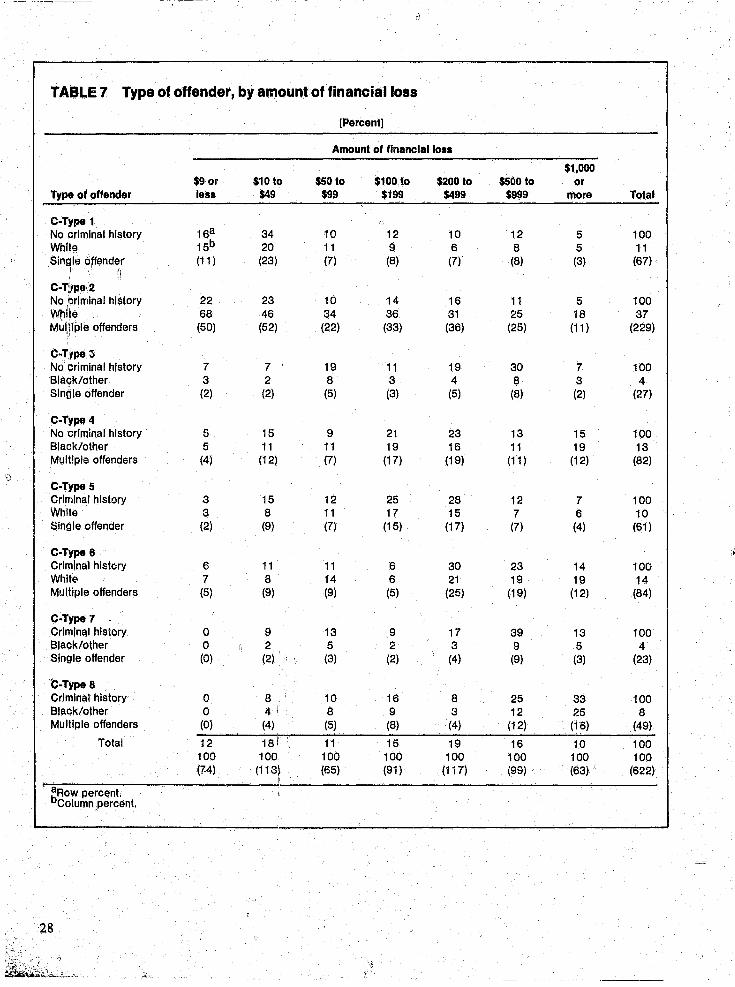
Type of Offender and Amount of Fi~ancial Loss
In an ear.1ier report, a relationship was observed between the amount of loss and probability of clearance: burglaries in which no financial loss occurred were substantially more likely to be cleared than those in which a financial loss resulted (Pope, 1977a). Furthermore, a substantial relationship was noted between the amount of financial loss and whether or not the crime was cleared: burglaries resulting in small losses were most likely to be cleared. An examination of the relationship between the eight offender types and whether or not a finan{;ial loss occurred revealed that this variable was substantially related to two of the C-Types (tables not presented). Burglaries resulting in' a financial loss included a disproportionate percentage of offenders in C-Type 2 (white offenders who work in grQups and have no prior record). Those in C-Typ-e 7, however (black/others who work alone and have~a prior record) were most likely to be involved in burglades in which no financial loss resulted (table not presented).
Table 7 provides a more detailed examination of the data for cases involving a financial loss of some type. There is a tendency for financial loss to increase as one moves from C-Type 1 to Co Type 8. The $110 to $149 category accolfnted for the greatest proportion of C-Type 1 cas~s (white offenders who work alone and have no previous record), The proportion of C-Type 1 cases in this group is 34 percent; the proportion of all cases cleared by arrest in this group is only 18 percent. Offehders found in C-Type 8 (black/others who work in groups and have previous records) are disproportionately clustered in burglaries with reported losses of $1,000 or more. Offender types associated with the most frequent loss category, $200 to $499, include white offenders who work either alone or in groups and have previous criminal histories.(C-Types 5 and 6). Although striking, this relationship is not surprising. Offenders involved in burglaries resulting, in larger amounts of financial losses all share one «;:ommon characteristic, a previous criminal histb'ry, It
,".----~----- --
could be argued. for example, that those with criminal experience (measured by previous arrests and/or convictions) are more likely to know which items are of mQ.st value and also to have established connections for the disposal of expensive goods. Those without criminal sophistication, which include~ those 17 years or younger, may be more likely to ste~l currency or inexpensive items that can be easily disposed of.
Type of Offense and Type of Property Stolen
Type of property stolen and amount of financial loss were also cross-tabul~,ted with the seven offense types to determine if similar relationships might exist for incident characteristics. Table 8 presents the joint relationship betwee:n the seven offense types and the type of property ~ltolen. Examination of this table reveals that those offenses included in I -Types 4, 5; and 7 accounted for a large proportion of the category involving theft <If currency. However, the proportion of cases for each incident type that involves the theft of currlrncy does not vary dramatically among the I-Types. The largest proportion of cases within each I -Type is accounted for by the theft of hard salable items. It is interesting to note that each I-Type contains a'pproximately the same proportion of the category "hard salable itemsll
(e.g., home entertainment equipment). The proportion of cases in each of the I-Types in the hard salable items category do not exceed the proportion expected (54 percent) by more than 3 percent points. Thus, the theft of such items is not characteristic of anyone type of burglary.
Type of Offense and Amount of Financial Loss
a In Table 9 the seven offense types are cross- .
tabulated with the amount of loss occurring during a burglary. Financial losses are relatively uncommon for the first three burglary~ offense types. In fact, offense Type.2 (nonforcible residential burglaries in high status ~reas) evidenced no reported financial \; losses. Separate examination of the seven offense types by financial loss versus no financial loss underscored this trend (table. not presen~ed). For those cases in which information about aCfinancialloss was reported, the first three offense ~ypes were substantially more likely to involve no financial losses. These were all cases in which little or no force was a used to gain entry. Overall; data in Table 9 show
27
~-~------~~~ -----~-----
8
TABLE 7 Type of offender, by amount of financial loss
[Percent]
Amount of financial 10 ••
$1,000 $9 or $10 to $50 to $100 to $200 to $500 to or
Type of offender lea. $49 $99 $199 $499 $999 more Total
C·Type 1 No criminal history 16a 34 10 12 10 12 5 100 White 15b 20 11 9 6 8 5 11 single offender (11 ) (23) (7) (8) (7) (8) (3) (67) .
I n c· Ti/fPIJ, 2 No !I~rlmlnal history 22 23 10 14 16 11 5 100 While 68 46 34 36 31 25 18 37 Mu(hple offenders (50) (52) (22) (33) (36) (25) (11 ) (229)
I
C·T~Vpe ~ No I:~rimlnal history 7 7 19 11 19 30 7 100 Blac)k/other 3 2 8 3 4 8 3 4 Sintlle offender (2) (2) (5) (3) (5) (8) (2) (27)
C·Type 4 No criminal history 5 15 9 21 23 13 15 100 Black/other 5 11 11 19 16 11 19 13 Multiple offenders (4) (12) (7) (17) (19) (11 ) (12) (82)
I) C·Type 5 Criminal history 3 15 12 25 28 12 7 100 White 3 8 11 17 15 7 6 10 Single offender (2) (9) (7) (15) (17) (7) (4) (61)
C.Type 6 Ir: Criminal hlstcry 6 11 11 6 30 23 14 100 White 7 8 14 6 21 19 19 14 Multiple offenders (5) (9) (9) (5) (25) (19) (12) (84)
C·Type 7 • Criminal history 0 9 13 9 17 39 13 100 Black/other 0 2 5 2 3 9 5 4 Single offender (0) (2) (3) (2) (4) (9) (3) (23)
"C.Type 8 Criminal history 0 8 10 16 8 25 33 100 Black/other 0 4! 8 9 3 12 ~5 8 Multiple offenders (0) (4) (5) (8) (4) (12) (16) (49)
Total 12 18 1 11 15 19 16 10 100 100 100 100 100 100 100 100 100 (74) (113) I (65) (91 ) (117) (99) (63) (622) , I
. aRow percent. bColumn percent.
28

TABLE 8 Type of burglary incident, by type of property stolen
Type of Jewelry! burglary incldeflt Money furs
I-T~1 13c Low force 8
Low status area 5d 7 Nonresidential structures (7) (4)
I-Type 2 Low force 17 14 High status area 4 9
, Residential structures (6) (5)
I-Type 3 Low force 11 9 High status area 7 15 Nonresidential structures (10) (8)
I-Type 4 High force 29 2 Low status area 12 2 Residential structures (18) (1 )
I-Type 5 High force 19 4 Low status area 24 15 Nonresidential structures (37) (8)
I-Type 6 High force 23 7 High status area 10 9 Residential structures (16) (5)
I.Type 7 High force 23 9 High status area 3a 44 Nonresidential structures (6"), (24)
Total 20 7 100 100
(115) (55) ,
aFor example, clothing and furniture. bFQr example, televisions and stereos. cRow percent. dColumn percent.
(PerC/l"tJ " -
Type of property stolen,
Soft Hard Iteml lalable lalable -" from Itemla l~emlb Drugs FIrearml I.f.
21 47 4 8 0 13 6 17 9 0
(11 ) (25) (2) (4) (0)
11 57 0 0 o • 5 5 0 0 0
(4) (20) (0) (0) ,,' (0)
26 49 3 1 Q
27 11 25 2 0 (23) (44) (3) (1 ) (0)
3 56 0 11 0 2 8 0 15 0
(2) (35) (0) (7) (0)
10 57 2 7 1 23 27 25 30 100 'c
(19) (11 ) (3) (14) (2)
7 54 0 10 0 6 9 0 15 0 (5) (38) (0) (7) (0)
; 8 54
, 2 5 0 24 34 33 30 0
(20) (143) (4) (14) (0)
11 54 2 6 0 100 100 100 100 100 (84) (416) (12) (47) (2)
~
Offftnse/Offender Types and Sex of Apprehended O~fenders
Tot.1
100 7
(53)
100 5
(35)
100 12 (89)
100 8
(63)
100 25
(194)
100 9
(71 )
100 35
(266)
100 100
(771) -
that the amount of reported financial loss is associated less with structural characteristics of burglary than with offender characteristics. That is, the telationships reported here: are less substantial and more evenly distributed than those reported in Table 7. ,
I.,·
The relatio~ship between both the offense and offender types and sex of the apprehended burglary
29

TABLE 9 Type of burglary incident, by amount of financial loss
[Percent]
Amount of financial loss
$1,000 Type of $9 or $1010 $50 to $100 to $20010 $500 to or burglary Incldenta les. $49 $99 $199 $499 $999 more Total
I-Type 1 Ob Low force 0 57 0 0 43 0 100
Low status area OC 0 6 0 0 3 0 1 Nonresidential structures (0) (0) (4) (0) (0) (3) (0) (7)
I-Type 3 Low force 0 0 0 0 33 33 33 100 High status area 0 0 0 0 1 1 2 1 Nonresidential structures (0) (0) (0) (0) (1 ) (1 ) (1 ) (3)
I-Type 4 High force 0 14 14 21 14 25 11 100 Low status area 0 7 12 14 7 15 10 9 Residential structures (0) (8) (8) (12) (8) (14) (61 (56)
I-Type 5 High force 9 23 14 15 17 13 10 100 Low status area 23 37 39 30 27 24 30 30 Nonresidential structures (17) (42) (25) (27) (31) (23) (19) (184)
I-Type 6 High force 4 4 13 21 24 24 10 100 High status area :/ 4 4 14 16 14 17 11 11 Residential structures (3) (3) (9) (14) (16) (16) (7) (68)
I-Type 7 High force 18 20 6 12 20 13 10 100 High status area 73 53 29 40 52 41 48 49 Nonresidential struct!lres (54) (60) (19) (36) (61) (39) (30) (299)
Total 12 18 11 14 19 16 10 100 100 100 100 100 100 100 100 100 (74) (113) (65) (89) (117) (96) (63) (617)
gl-Type 2 (l1onforclble residential burglaries in high status areas) eVidenced no reported financial loss. Row percent.
cColumn percent.
offenders was also examined. Separate tables are not presented because few differences were noted; rather the major findings are summarized in the text. Multiple offender groups containing both male and fe!llale offenders were likely to be white. Females exhibited no previous criminal histories and generally engaged in multiple offender burglaries. Males, on the other hand, frequently worked alone and were likely to have a previous criminal record of some type. The distribution of male and female of-
(I
30
fenders among the six remalOlOg offender types proved to be quite similar. An examination of the offense I-Types showed that females tended to commit nonresidential burglaries in socially advantaged areas and were as likely as not to use force to gain entrance. M~les, in comparison to females, were substantially more likely to commit burglaries of nonresidential structures using force in areas that were socially disadvantaged (table not presented).

Offense/Offender Types and Distance From Residence to Burglary Site
Certain types of offenders commit burglaries close to their residences (table not presented). Those who committed burglaries less than 1 mile frolll their residence included both white and black/other offenders who had no previous criminal histories and worked in groups. Similarly, those who burglarized targets 1 mile or more from their homes included three offender types all evid~ncing pre~ vious criminal records. Other distinguishing charac~ teristics included white offenders who worked singly or in groups and black/other offenders who worked in groups. Few relationships were found between distance from offender'S residence to burglary target and the seven offense types. A moderate relation~ ship, however, was apparent between this distance and both offender C~ Type 2 and C-Type 5. Offenders who commited burglaries characterized by minimum force to gain entry, high status target areas, and residential structures, traveled 1 mile or more. Those who traveled less than 1 mile tended to burglarize nonresidential structures in low status areas using substantial force to gain entry.
Offense/Offender Types and Temporal Characteristics
In a similar manner, day of the week and time of the day during which the burglary occurred were also examined in relation to the seven offense types and eight offender types. The data showed no relationship between either weekday or weekend and the seven offense types (table not presented). That is, each type of burglary was equally likely to occur on the weekend as during the week. Time of day, however, did show some relationship to'; the seven offense types. Those burglaries most likely to occur during the daytime hours included the following types: forcible entry burglaries of residential struc~ tures in low status areas (I-Type 4), and forcible entry burglaries of residential structures in high status areas (1 -Type 6). The following relationships were found between time of day and offender types: black/other offenders who worked in groups and had no prior record (C-Type 4) were more likely to com-
" mit burglaries during the weekend; and black/other offenders who worked singly and who had a prior r,ecord (C-Type 7) were more likely to commit
------- - ----- ---- -----------------
burglaries during the weekday. This latter group was also more likely to burglarize during the night.
Summary of Offense/Offender Typological Analysis
The findings presented here generally did not support a strong relationship between the· charac·~ teristics of burglary offenders and the types of burglary they commit. This lack of patterning was forcefully illustrated when the seven offense types were cross~tabulated with the eight offender types. Although some p;:i~terns were suggestive, they could not be considered-substantial.,
Because it was quite possible that the off~~~~e alld offender types might be related to other variables that had not been included as definers of the types, a more e~tensive analysis was undertaken. The eight offender C-Types were found to be substantially rela~ed to the amount of loss reported to the police. An offender's previous criminal history was the most important factor in determining financial lo~s; that is, those who had a previous criminal history were most likely to commit burglaries in which reported financial losses were quite high. Although certain offense and offender types were found to be associated with categories of specific variables, there were no substantial overall relationships.
Analysis of Demographic Characteristics
There are still relationships that have not beell explored (e.g., between sex of the burglary offender and temporal characteristics of reported burglary incidents). It may prove informative to examine some of the bivariate relationships between variables in order to refine earlier findings based on cross-tabulation of the offense and offender types. Hence, the following tabl~s examine the jo~nt relationship between the sex, race, and age of apprehended burglary offenders and various incident characteristics.
Sex
III Table 10, arrestee's sex is cross-tabulated with the temporal characteristics of those burglary
31

{~
,:;;
TABLE 10 Temporal characteristics of burglary incidents, by sex of apprehended offenders
[Percent]
Tempora' Sex characterlatlca Male Female Tola.a
Time: Day 42 58 43
(I (381) (56) (437)
Night 58 42 57 (529) (41) (570)
Total ,100 100 ~OO (910) (97) '(1,007)
Day: Weekday 67 80 69
(694) (83) (777)
Weekend 33 20 31 (334) (21 ) (355)
Total 100 100 100 (1,028) (104) (1,132)
Season: Winter 28 27 28
(305) (30) (335)
Spring/autumn 33 45 34 (359) (49) (408)
Summer 39 28 38 (422) (31) (453)
Total 100 100 100 (1,086) (110) (1,196)
aTotal number of cases for each variable may vary because of missing cases.
incidents that were cleared by arrest. Female offenders were substantially more likely than their male counterparts to commit burglaries dtiri~g the weekday as opposed to the weekend. Eighty percent of the female offenders burglarized during the weekday compared with 67 percent of the male offenders. Similarly, female offenders (58 percent) were also substantially more likely than males (42 percent) to burglarize structures during the daylight hours. With respect to the sea:;on of the year during which these burglary incidents were reported, Table 10 shows that those burglaries cleared by arrest were substantially more likely to be reported during the summer months than during the winter months (38
32
, percent versus 28 percent). For all burglary itlcidents 'that occurred during the project period, there was no difference with regard to the season of the year during which they were reported to the police. It may, however, be that fhe activity and interaction among people that occurs during the summer results in the discovery of burglaries that are in progress; therefore, burglaries are more likely to be reported to the police, which' possibly results in Inore apprehensions. The proportion of males apprehended for burglaries committed during the summer months wa~ greater than the proportion of females ap-
. prehended during these, months (39 percent and 28 percent, respectively).

Prior record was subsequently introduced as a control variable to determin'e whether these initial relationships would change when the prior records of each group were similar. The data revealed that for those who had no prior record, females were still substantially more likely than males to commit burglaries on the weekdays during daylight hours, but for those with a prior record, sex showed no relationship to the part of the week during which burglaries occurred. The relationship ob[~t~rved be-
I)
f tween sex and time of day was not altered when both groups had a prior record, and no changes occurred in the correlation between month of reporting and sex when prior record was introduced as a control variable (table not presented).
Table II provides data on the methods employed in burglary incidents and the sex of apprehended offenders. Findings reported here are quite striking. Female burglars were substantially more likely to enter structures through the door than
TABLE 11 Methods employed in burglary incidents, by sex of apprehended offenders
[Percent]
Sex Method M.'e Female Tot.,·
Door 59 77 61 (594) (84) (678)
Window 41 23 39 (414) (25) (439)
Total 100 100 100 (1,008) (109) (1,117)
No force 40 78 44 (420) (86) (506)
Force 60 22 56 (627) (24) (651)
Total 100 100 100 (1,047) (110) (1,157)
Tool 44 74 47 (458) (81) (539)
No tool 56 26 53 (578) (28) (606)
Total 100 \\ (1,036)
100 100 (109) (1,145)
No damage 43 79 46 (452) (B6) (538)
Damage 57 21 54 (603) (23) (626)
i\
Total 100 1 (1,055) \ ~,
100 100 (109) (1,164)
~,)~ aTotal number of cases lor each variable may vary because of missing cases,
"
;c:' ~ " \ \'y
&-
33
()

were male burglars, and were consistently associated with lesser amounts of force than were males. That is, females were substantially more likely than their
'male counterparts to commit burglaries characterized by no force, no tools, and no damage to property. For example, although 79 percent of the bUrglaries committed by females involved no
damage to the property of others, only 43 percent of those burglaries committed by males involved no damage. Introduction of prior record as a control variable did not alter these relationships.
As the data in Table 12 indicate, female offenders (59 percent) were more likely to burglarize nonresidential structures than were their male coun-
TABLE 12 Selected characteristics of burglary incidents, by sex of apprehended offenders
[Percent]
Sex Charaeterl,tlc, Male Female Tetala
Type of structure: Residential 63 41 61
(684) (45) (729)
Nonresidential 37 59 39 (402) (65) (467)
Total 100 100 1QO (1,086) (110) (1,196)
Loss: No loss 37 32 37
(330) (30) (360)
Loss 63 68 63 (558) (64) (622)
Total 100 100 100 (888) (94) (982)
Type of property stolen: Money or hard salable Items 69 32 64
(543) (34) (577)
'.-Other 31 68 36
(247) (71 ) (318)
Total 100 100 100 (790) (105) (895)
Outcome: Attempted 6 1 5
(61) (1 ) (62)
Completed 94 99 95 (1,025) (109) (1,134)
Total 100 100 100 (1,086) (110) (1,196)
aTotal number of cases for each variable may vary because of missing cases.
34
\~. \'

terparts (37 percent). Furthermore, females were somewhat more likely than males to commit burglaries in which a financial loss of some type resulted and were substantially more likely to steal commodities other than currency or hard salable items. These items were found to be those of the soft salable variety including furniture, bedding, and the like. Burglaries committed by male offenders were substantially more likely to result in attempts compared with those committed by female offenders. Again, the relationships in Table 12 continued when the prior records of each group were similar (table not presented).
Race
Table 13 compares the temporal characteristics oc r~ported burglaries with the race of apprehended offenders. Unlike earlier findings on the relationship between time and an arrestee's sex, the temporal aspects of burglary were. not associated with the racial characteristics of burglary offenders. Both white and black/other offenders were equally likely to commit burglaries on a weekday and during the daylight hours. Furthermore, no differences were noted among black/other and white offenders concerning the season of the year during which the
TABLE 13 Temporal characteristics of burglary incidents, by race of apprehended offenders
-..;:"'~ --:.:;::-".~"-. [Percent]
Temporal Race characteristics White Black/other Tatala
Time: Day 43 44 43
(280) (157) (437)
Night 57 56 57 (370) (200) (570)
'1\
Tolal 100 100 100/ (650) (359) (1.007)
Day: Weekday 71 65 69
(518) (259) (777)
Weekend 29 35 31 (215) (140) (355)
Total 100 100 100 (733) (399) (1,132)
Season: Winter 30 25 28
(235) (100) (335)
Spring/autumn 35 32 34 (278) (130) (408)
Summer 35 43 38 (282) (171 ) (453)
Total 100 100 100 (795) (401) (1,196)
aTotal number of cases for each variable may vary because of missing cases.
35

~
TABLE 14 Methods employed in burglary incidents, by race of apprehended offenders
[Percent}
Race Method White Blaclc/other Totala
Door 66 51 61 (483) (195) (678)
Window 34 49 39 (253) (186) (439)
Total 100 100 100 (736) (381 ) (1,117)
No force 49 33 44 (376) (130) (506)
Force (51 167 5(3 (393) (258) (651)
Total 100 100 100 (769) (388) (1.157)
-i
No tool 52 38 47 (396) (143) (539)
Tool 48 62 53 (370) (236) (606)
Total 100 100 100 (166) (379) (1,145)
No damage 51 37 46 (392) (146) (538)
Damage 49 63 54 (382) (244) (626)
Total 100 100 100 (774) (390) (1,164)
aTotal number of cases for each variable may vary because of missing cases.
bl\rgJaries were reported. Although white offenders were somewhat less likely than black/other offenders to commit burglariescthat were reported during the summer months, this relationship is not substantial according to the 1 0 perc,l~nt difference criterion. Only one relationship changed when prior record was utilized as a control variable. For those with no prior record, black/other offenders were more likely than white offenders to commit burglaries on the weekend\ but 00 differences were noted when both groups had a prior record of some type. "
36
Black/other offenders were substantially more likely than the white offenders to commit burglaries
. in which force was used to gain entry. a tool was utilized, and damage occurred to the property of the victim (Table 14). Sixty-seven percent of the black/other offenders compared with 51 percent of the white offenders committed burglaries in which force was employed. Black/other burglars (49 percent) were also substantially more likely than white burglars (34 Ifercent) to enter structures through the window rather than the door. For those who had a

TABLE 15 Selected characteristics of burglary incidents, by race of apprehended offenders
[Percent]
Race Characteristics White Black/other Totala
Type of structure: Residential 61 61 61
(484) (245) (729)
Nonresidential 39 39 39 (311 ) (401) (467)
Total 100 100 100
-,0' ~ (795) (646) (','96)
Loss: No loss 33 43 37
(221) (139) (360)
Loss 67 57 63 (441) (181 ) (622)
Total 100 100 100 (622) (320) (982)
Type of property stolen: Money or hard salable Items 63 67 64
(383) (194) (577)
Other 37 33 36 (223) (95) (318)
Total 100 100 100 (606) (289) (895)
Outcome: Attempted 4 7 5
(35) (27) (62) Sf
Completed 96 93 95 (760) (374) (1,134)
Tota! 100 100 100 (795) (401) (1,196)
aTotal number of cases for each variable may vary because afmissing cases,
prior record, black/other offenders were somewhat more likely than white offenders to use a tool and damage property in order to gain entrance, although these relationships were not substantial. For those with no prior record, howevrer, black/other offenders were substantially more likely than white offenders to commit burglaries characterized by tools and property damage (table not presented).
There was no difference between black/other and white offenders concerning the type of structure burglarized. As Table 15 indicates, 6) percent of both black/other and white offenders selected resi~ dential targets. This relationship continued regardless of prior criminal record, as did the relationship between race and financial loss. Forty-three percent OftJlOse burglaries perp~trated by black/other offen-
37

, 'f
TABLE 16 Temporal characteristics of burglary incidents, by age of apprehended offenders
[Percent]
Temporal Age characteristics 17 or younger 18 or older Totala
Time: Day 49 38 43
(247) (190) (437)
Night 51 62 57 (258) (312) (570)
Total 100 100 100 (505) (502) (1,007) ..
Day: Weekday 66 71 69
(378) '- (399) (777)
Weekend 34 29 31 (192) (163) (355)
Total 100 100 1QO (570) (562) (1,1~2)
Season: Winter 23 34 28
(138) (197) (335)
Spring/autumn 37 31 34 (225) (183) (408)
Summer 41 35 38 (247) (206) (453)
Total 100 100 100 (610) (586) (1,196)
I
aTotal number of cases for each variabi~.'!lay vary because of missing cases, r~'<'~'
ders resulted in no financiaL loss compared with 33 percent for white offenders. Black/other off~nders were slightly more likely than white offenders to steal money or hard salable items, but there was only a 4 pt}fcent point difference. Black/other offenders were also somewhat more likely than their white counterparts to engage in burglaries resulting in attempts only, a rela~ionship that became substantial when neither group had a prior record (table not presented).
Age
Data in Table 16 show that those 17 years of age or younger and those 18 years of age or older were
38
equally likely to commit burglaries on the weekends (66 percent and 71 percent, respectively). Juvenile offenders, however, were substantially less likely than adult offenders to burglarize during the night. Fifty-one percent of the juvenile offenders committed burglaries at night compared with 62 percent of the adult offenders. Although adult offenders (34 percent) were substantially more likely than juvenile offenders (23 percent) to commit burglaries that were reported. to the police during the winter months, juveniles were more likely to commit burglaries that were reported during the spring/autumn and summer months. The relationships observed here could reflect that those 17 years of age or you,nger are more likely to be attending school dur-

ing the week and thus less likely to be out during the evening hours on school days. They ,are, however, likely to have free time to engage in/burglary after school, on the weekends, and during (he summer and spring/autumn 'months.
than adults to commit burglaries in which no foret' was used to gain entry, no tool was used, and no property damage resulted. ~\
The data reported for the methods of entry show slight but not substantial relationships between juvenile and adult offenders. Fifty-seven percent of the burglars 17 years of age or younger entered structures through the door compared with 64 percent of the burglars 18 years or older (Table 17). Furthermore; juveniles were slightly !Ti0re likely
Although those 17 and younger were slightly more likely than their older counterparts to burglarize nonresidential structures, this relationship was not substantial (Table 18). Sixty-eight percent of the juvenile offenders committed burglaries that re~,ulted in financial losses compared with 59 percej'lt of the adult offenders. When only thosejuvenile offenders with no prior adult record were considered, however, this relationship did prove to be
TABLE 17 Methods employed in burglary ancidents, by age of apprehended offenders
[Percent]
Age Method 17 or younger
Door 57 (326)
Window 43 (242)
Total 100 (568)
No force 47 (273)
Force 53 (311)
Total 100 (584)
No tool 50 (294)
Tool 50 (291)
Total 1qQ (585)
No damage 50 (298)
Damage 50 (297)
Total 100 (595)
aTotal number of cases for each variable may vary because of missing cases. (\
18 or older
64 (352)
36 (197)
100
<'. (549)
41 (233)
59 (340)
100 (573)
44 (245)
56 (315)
100 (560)
42 (240)
58 (329)
100 (569)
(\
TO\818
61 (678)
39 (439)
100 (1) 117)
44 (506)
56 (651)
100 (1,157)
47 (539)
53 (606),
<:-:..~
100 (1,145)
46 (538)
54 (626)
100 (1,164)
39
c..c:::::.

}i
~~--------~--------~---------------------. <.\
TABLE 18 Selected characteristics of burglary incidents, by age of apprehended Q.ffenders
[Percent]
Age Characteriitic.
(:'
17 or younger
Type of structure: Residential 59
(358) ,.;
Nonresldentl31 41 (252)
Total '100 (729)
Loss: No loss 32
(157)
Loss 68 (334)
Total 100 (491)
Type of property stolen: Money or hard salable items 63
(294)
Other 37 (170)
Total 100 (464)
Outcome: Attempted 4
(25)
Completed 96 (585)
Total 100 (610)
aTotal number of cases for each variable may vary because of missing cases.
quite substantial. Sixty-nine percent of the Juveniles and 55 percent of the adults, respectivel~, engaged in burglaries in which a financial loss was reported (table not presented). Juvenile and adult offenders were about equally likely to steal money ot hard
18 or older
63 (~71)
37 (215)
100 (467)
41 (203)
59 (288)
100 (491)
66 (283)
34 (148)
100 (431)
6 (37)
94 (549)
100 (586)
Total!!
61 (729)
39 (467)
100 (1.196)
37 (360)
63 (622)
100 (982)
64 (577)
36 (318)
100 (895)
5 /: (62(~
95 (1.134)
100 (1.196)
IIsalable itelTis and to engage in burglaries that resulted in attempts only.
These data indicate that, although some relationships exist between offender and incident characteristics, most relationships are not strong and few could be .considered substantial by a 10 percent difference criterion. The strongest relationships between offense and incident characteristics were observed for sex; these were follGWed by race, and age.
40
1,,' ... __________ _

\
Summary and Discussion This report examined the extent to which the
characteristics of burglary incidents and the characteristics of persons apprehended for their commission were related. Previous reports specified the nature and interrelationships of characteristics within each set.
Other studies focusing on violent and personal crime have shown that offenders and victims often form an interactive pattern in which certain kinds of offenders are likely to prey on certain kinds of victims and to exhibit distinct methods of attack. In a study of rape, fpr example, Amir discovered that olper offenders preferred victims who were generally about 5 or 10 years younger (1971 :55). Wolfgang found that choice of weapons and methods used to inflict death differed according to the race and sex of the offender (1958:32), Such studies have demonstrated that the correlates or violent crimes like homicide, rape, and robbery are not randomly distributed but rather are highly structured events as evidenced by the relationship between both the offender and his victim.
Although burglary is gener.ally considered to be impersonal because the target is property rather than a human being, similal' patterns might be evident. That is, it was generally supposed or hypothesized that burglary offenders who differ in age, race, sex, and other characteristics would exhibit preferences in the structures they burglarize, the property they steal, the manner in which they commit the crime, and in other factors as well. This supposition, however, was not entirely or completely substantiated by the data.
When the sex, race, and age of offenders were examined with the various characteristics of the burglary incident, die most substantial differences were noted for sex of the offender. Females, for example, were substantially more likely than males to .burghuize nonresidential structures with no force or tool to gain entry' and no damage to property. Blackfother offenders were more likely to use a tool in forcible entries that resulted in property damage, but they were as likely. as white offende(s to select either residential or nonresidential targets. Few differences in burglary patterns were noted between those 17 years of age or younger and those 18 years of age or older. The latter group, however, was more likely to commit burglaries at night and during the wiJller months. Although there are some apparent dlfferences when offense and offender charac.-
teristics are compared, these differences are not strong.
Regardless of how the data are viewed, then, . there seems to be little overall relationship among offense and offender characteristics. With few exceptions, on the basis of the data used in this study, certain kinds of burglars do not commit certain kinds of burglaries. Unlike violent crimes in which there is an interactive pattern, burglary and other property crimes, as well, may reflect opportunity more than choice. Although this is not to say that burglaries are commonly committe.d without intent, it is probably true that burglary, more so than violent crimes, is randomly perpetrated. Homicide, rape, and assault are not generally stranger-tostrf:l,nger crimes in thl\:t the perpetrator is likely to know the victim, at least in a casual way. On the " other hand, the average burglar, although evidencing intent, is unlikely to be familiar with potential targets other than that they belong to a particul~r type such as residential or nonresidential structures.
Although it is possible that the results obtained here may be an artifact of the data rather than an underlying phenomenon of burglary, this does not seem to be the case. The characteristics of the burglary offenses in this study were found to be quite consistent with those found by other studies. Victim survey results and numerous studies based on police incident reports have consistently found the characteristics of burglary to be similar. '~':::tVtermore, in those few studies in which offender blJracteristics have been reported, the distribution of these characteristics did not differ greatly from those reported in this study.
There were, however, limitations in the types of variables available for analysis. If additional vadahIes such as educational level, occupation, or employment status had been available, these may have been associated with incident characteristics. Unfortunately, there is no way of knowing. The present study, employing more incident and offender data than have previously been used, failed to find substantial interrelated patterns in offense and offender characteristics.
Conclusions: The Nature of Burglary
In addition to the analysis of the link between offense and offender types, and between types and separate single variables of interest, ot~er substan-
41

.. ,--------------------------------------------~--------
tive areas, such as the interrelationships among offense characteristics only and among offender characteristics only, were examined. Because of the length and complexity of these analyses, three reports were necessary to appropriately present and discuss the findings. Yet, it is useful and instructive to synthesize all three, so the major findings and their implications are presented here.
Burglary is a broadly defined category of crime generally involving the theft of goods from the dwelling place of another. As with many other criminal offenses, the statutory definition ofburglary has evolved through the years to meet the demands of a growing', complex society. For example, few of the. original common law elements of burglary remain today. Thus, the crime of burglary may be committed during either the day or the night; it may involve
'.'the use of force to gain entry or it may not; it may result in an attempt only or it may be carried through to completion. Furthermore, the notion of a dwelling unit has been expanded in Federal and State statutes to include a wide variety of structures such as commerical units, garages, and tool sheds.
Although burglary frequently involves the use of force to gain entry, it is often popularized as a crime of stealth. As opposed to robbery and other violent crimes such as rape and assault, burglary is generally characterized by tittle, if any, confrontation between the perpetrator and intended victim (assuming the property owner as victim). Given the choice and an appropriate exit, the typical burglar wquld most often choose flight rather than a fight. The ballmark of the "professional" burglar, for \:Jxample, is the ability to leave the scene of the crime without being detected. Rarely do even unskilled burglars enter premises that they know in advance are occupied. Available data consistently show that residential burglaries are more likely to be committed during day, and commercial burglaries at night, when both types of structures are most likely to be unoccupied. In Reppetto's recent study of residential burglary in the greater Boston metropolitan area, over 90 percent of those incidents reported to the police involved the burglary of unoccupied premises (1974: 17) .. Sim i1arly, the incidence of residential roberies was found to be quite small, constituting less than 10 perc~ntofall reported robberies in Boston (Reppetto, 197'4'.r16). The President's Commission on LawEnforcemeillt and Administration of Justice estimated that less than 3 percent of all reported burglaries resulte~) in confrontation sufficient for them to be reclassified as robberies (1967a).
In light of such facts it is not surprising that burglary evokes less fear than violent crimes such as
42
homicide, rape, robb'cry, and the like. Nationwide public opinion polls ~;ave shown that the percentage of c;tizens expressing a fear of walking alone at night has increased from 34 percent in 1965 to 41 percent in 1972 (Hindelang et al., )973). Such expressed fear is understandable considering the inc:rease in the number of rapes and assaults reported in most major cities throughout the country during that period. Newspapers and other popular accounts daily contain stories reporting attacks upon citizens that happen to be upon the streets at night. Yet it is quite well substantiated that the average citizen is far more likely to be the victim of a burglary than of other more violent types of criminal offense.
Both victim survey results and Uniform Crime Reports figures show the incidence of burglary to be substantially higher than that of homicide, rape, robbery, and aggravated assault. Of the ~even major offenses reported to the police in 1972, burglary exhibited the highest rate per 100,000 inhabitants (Kelley, 1973:61). In that year, thc.burglary rate was 1126.1 per 100,000 compared with rates of 8.9 for murder, 22.3 for forcible rape, 179.9 for robbery, 186.6 for aggravated assault, 882.6 for larceny $50 and over, and 423.1 for auto theft. 13 The burglary rate reported for 1972 represented an absolute increase of 36 percent for the 5-year period beginning in 1967. It is quite apparent- from these and other figures that burglary is a Ubiquitous crime, affecting the lives of millions of Americans. Another aspect of the seriousness of the burglary problem can be seen in the amount of economic loss occurring as a reSult of this criminal offense. Such losses generally run into the hundreds of millions of dollars per year. In 1972 for example, the estimated economic loss resulting from burglary was $722 million (Kelley, 1973;21). These losses would be substantially higher if figures from those burglaries never reported to the police were included.
In light of the serious nature of burglary, it is surprising that relatively few research efforts have focused upon this crimirial offense. Far less is known about burglary offenders, for example, than is known about rapists, assaulters, and robbers. Only recently have attempts been made to examine the correlates, of burglary and establish relationships among incident characteristics, but such studies,
II 131972 UCR data are presented here because they are the
most comparable to the April 1972 to May 1973 reference' period of the burglary data used in this report. However, the most current UCR data at the time of publication were for 1975. Thase data i:lhow similar relationships.
o
,

( (
although ,growing in number, are not comprehensive.
This study contributes to the body of knowledge surrounding burglary and should be considered exploratory and descriptive. Accepting the premise that crime is a structured event, the crime of burglary was examined for patterned relationships. No attempt was made to construct a theory or to test a previously ex.isting one because so little research had been done on this offense. The first task was to describe the nature of burglary, thus laying the foundation for future research and endeavors. to construct a theory. The course of the investigation then followed three separate lines. First, an examination of the characteristics of burglary offenses was undertaken. This was followed by an examination of the characteristics of burglary offenders. Finally, the research focused upon interrelated patterns of offense and offender characteristics. The latter area was of primary import becaus(': so little research has been undertaken in this area.
Patterns of Burglary
A major finding of the research presented in this , third report was the lack of any significant pat~erned relationship between the characteristics of burglary incidents and those offenders apprehended for their commission. Although some offense and offender variables were found. to be related (for example, female'l were more likely than males to burglarize nonresidential structures), no overall pattern was evident. This was graphically illustrated when the offense and offender types were compared. Some patterns were suggestive, but the lack of any substantial relationship between offense types and offender types was quite apparent. Those individuals appreheJlded for burglary did not exhibit characteristics that differed substantially with regard to the ki~)ds of burglary they corhmitted. As mentioned eairHer, this could be an artifact of the data because certain importal,.1t offender variables such as education or income level were not available for analysis. Or it 'may well be that the offender characteristic~ arepnly randomly associated with offense charac~ teristicS.
The utility of creating and cross-classify~ng empirical typologies as an effiCient method o~ crime" specific research has been given some SuppOl.'t. The usefulness of any typology, of course; depelrd,~ UpOI1 ...
the purpose for which it is constructed/In the p~esent stUdy, the data were grouped into dist\nctpffender and offense types in order to aid in,~xaminirtz
•. .# n '
-- --- ----------------.
----~---- -- ----
joint relationships. That such relationships were not found suggests the disutility of creating typologies without a concomitant attempt at verification. If, for example, those who commit burglary offenses do not differ substantially with respect to the types of burglary that they commit, then theoretical explanations based upon supposed differences would not be fruitful. It is not argued that the findings presented here are definitive, but neither can they be ignored. The task at hand would seem to be toward addi. tional research, preferably with the inclusion of a greater range of offender information.
Temporal. Characteristics
Analysis of the burglary incident data served to substantiate the findings of previous studies on the temporal aspects of reported burglary incidents. Residential burglaries were generally found to occur during the weekday and during the daylight hours.
Nonresidential structures were most likely to be burglarized during Jhe weekdays at night. These relationships, however, were weaker when only the incidents that were cleared by arrest were considered. For cleared burglary incidents, there was less of a distinction between the part of the week during which burglaries were committed (weekday or weekend) ana"the type of structure burglarized (either residential or nonresidential). The relation.ship between time ofthe burglary and type of structure, however, was still quite substantial. That is, residential structures were substantially more likely to be burglarized during the daylight hours and nonresidential structures during the night. Attempted and completed burglaries were about equally likely to be committed during the daylight or evening hours and either on weekdays or weekends.
The type of structure burglarized was found to be unrelated to either the month or seaspn(winter, spring/autumn, summer) during which burglaries were reported. Both residential and 110nresidential burglaries were similarly distributed by season of the year. These data were compi.led in California, a State with a rather temperate year-round climate. As a result, burglaries would probably not be expeGted to vary by season because winter months are not generally harsh enough to limit oiltdoor activity.
A comparison of offenders' demographic characteristics and temporal characteristics of
'qffenses showed no differences between the day of the week d"iiring Which burglaries were committed ("md the ages of al'prehended offenders. Although offenders who were 18 years of age or older were
)0
somewhat more likely to burglarize during the week, this relationship was not substantial. Those I 7 years of age or younger, however, were substantially more likely than their older counterparts to burglarize during the daylight hours, This latter relationship is quite plausible because the activities of many juveniles are restricted by their parents during the evening hours, A prime time for many juvenile burglaries is the period from the end of school to dinnertime, approximately 3:00 p.m. to 6:00 p.m. Females were more likely than males to commit burglaries on a weekday and during daylight hours. No differences were found between the temporal characteristics of reported burglary incidents and Whether the apprehended offender was white or black/other.
As noted earlier, most burglars try to avoid confrontation with the victim and thus choose times ~hen residents or employees are. likely to be absent. The data tend to support this supposition. Residential structures, therefore, are most vulnerable to burglaries during the day on weekdays and nonresidential structures most vulnerable at night during weekends. It is logical, then, to assert that extra precautions should be taken during these critical hours. These precautions may be as simple as making certain that doors and windows are locked before leaving homes or apartments for the day. Entry to many res.\dences can be effected with little or no force, which may simply reflect the lack of foresight by citizens in taking such precautions. Thirty-eight percent of all reported burglaries, for example, involved nonforcibte entries. This figure was found to be substantially higher for tesldential (43 percent) as opposed to nonresidential burglaries (27 percent).
Methods
As with many .other types of criminal offenders, burglars frequently display distinct methods or ways of committing their crimes. Often, it is through these distinctive methods 01' modus operandi that known burglars are eventually apprehended. That is, unique methods may be traced to an ex-offender's criminal file, thus making him a prime suspect in a case if its patterns are similar to patterns found in
. past burglaries. Although the data upon which this stUdy is based do not reflect the refin~d modus operandi of individual offenders, it does; nonetheless, yield some gross estimates focusing on the manner in which burglaries were effected. These data include the amount of force used to enter the structure, whether or not tools were used in the commission of
44
the burglary, and whether or not damage occurred to property. It is quite possible that certain types of burglary incidents or certain types of offenders may have be.en associated with distinctive patterns of force, tools, and datpage.
These three characteristicS reflecting modus operandi were found to be highly intercorrelated. Those burglaries characterized by the use of substantial force to gain entry were also likely to have been entered by the use of tools with resulting property damage. Approximately 60 percent of those reported burglary incidents involved forcible entries, use of tools, and damage to property. This relationship is not surprising, for the use of tools would genenilly mean that the entry was forcible and property da.mage would thus be likely to occur.
The modus operandi va.riables were found to be substantially related to the type of structure burglarized. Nonresidential as opposed to residential burglaries were more likely to be forcible entries in which tools were used and in which damage occurred to property. Nonresidential structures were also more likely than residential structures to be associated with various characteristics such as lighted entrance ways and alarm systems. Furthermore, all burglaries that were reported as attempts were characterized by forcible entries. The use of tools and property damage were also found to be associated with attempted burglaries, although the relationship was not as substantial as for forcible entries. Generally speaking, most burglaries reported to the police are completions rather than attempts. Attempted burglaries are less likely to be reported to the police, possibly because they are less likely to be discovered by the intended victim .. The data reported here seem to substantiate this supposition. Al! attempted burglaries were forcible entries that were also characterized by the use of tools and damage to property. Hence, it is not unreasonable to assume that they were more likely to be discovered and subsequently reported to the appropriate authorities. P
Certain offenders characteristics were also related to methods of entry. Females, for example, were substantially more likely than males to commit burglaries characterized by nonfo,rcible entries, use of tools, and no property damage. Females were also more likely than their male counterparts to enter target structures through the door. Because these characteristics were found to be correlated with completed burglaries, one would expect burglaries committed by females to result in completion more often than those committed by males. The data sup-
I~
_________________________ ---- -----c.~
ported this supposition. An opposite picture was presented for black/other offenders. Black/others were substantially more likely than their white coun~ terparts to commit forcible burglaries in which tools were utilized with resulting property damage. Similarly, they were less likely than whites to be associated with completed burglaries. The data also showed that although those 17 years or younger were less likely than those 18 years or older to commit forcible burglaries, use tools, or have property damage occur, these relationships were not substan~ tial.
Attempted Versus Completed Burglaries
Of the total burglary incidents reported in this study, a substantial proportion resulted in successful completions in that the offense was effectively carried out. Only approximately 5 percent of aU reported cases were attempted, a figure that also held for burglaries cleared by the arrest of a suspect. Overatl, the data showed the lack of any substantial relationship between attempted and completed burglaries and most of the remaining incident characteristics. Both residential and nonresidential burglaries, for example, were equally likely to result in attempts or completions. Burglaries with resulting property damage were more likely to be attempts compared with those having no property damage. The presence of a working alarm system was also fQund to be associated with attempted burglaries. As observed above, forcible entries and attempted burglaries were highly related in that for all attempted burglaries there was a forcible entry. Similarly, attempts and financial loss evidenced a
.. logically necessitated relationship because all attempted burglaries involved no loss of property, although property may have been damaged.
Of most interest, however, was the absence of \ "
substantial relationships between attempted and completed burglaries and the various "target hardening" (deterrent) characteristics. One might expect that preventive techniques such as increased lighting, security inspections, or the presence of a dog would be likely to hamper burglars, thus resulting in more attempted than (:ompleted burglaries. The data, however, did not support this supposition. Few differences were observed between attempted and completed burglaries and the distribution of deterrent characteristics. Only two substantial relation- .. ships were noted: the presence of an alarm system and the presence of identifying serial numbers. First, premises that had alarm systems were substantially
more likely than thq,se without alarm systems to result in attempted burglaries; second, those premises in which distinctive serial numbers had been etched into persona}: property were more likely to result in completed burglaries.
It should be reemphasized that attempted burglaries were unlikely to be reported to the police, or even discovered, unless there was some physical evidence that an attempted burglary had taken place. There is no way of knowing how many attempted burglaries went unnoticed by victims or how many potential burglars were deterred from even attempting the crime. Conclusions, therefore, should be tempered by such considerations.
Approximately 65 percent of all reported burglaries involved structures with street lights within 100 feet of the premises. This is probably more a result of chance than any planned action on the part of the victim. Most major cities provide street lighting in residential neighborhoods, and nonresidential structures are likely to provide their own lighting or, if located in downtown sections, take advantage of municipal lighting. Those premises' with lighted entrance ways and those with unobstructed entrance ways accounted for approximately 30 percent of all reported burglaries. Alarm systems, security inspections, presence of dogs, and identifying serial numbers each accounted for approximately] a percent of all reported cases.
Burglary Clearances
The data base also contained information pertaining to whether or not the offense was cleared and
[; the means by which· a clearance was effected (whether by arrest of the suspect, by the case being proved unfounded, or by other means). The greatest proportion of all cleared cases were cleared through the arrest of a suspect. The data were aggregated across the six jurisdictions with Clearances dichotomized into those cases not cleared and those cleared by arrest. Financial loss was the variable most substantially associated with whether or not the offense was cleared. Thirty-four percent of those cases involving no financial loss were cleared, whereas only 15 percent of those cases in which a fi" nancial loss occur~ed were cleared. Furthermore, those burglaries in which reported financial losses were either in the low or high ranges were those most likely to be cleared by arrest. Although 34. percent of the cases reporting a financial loss of $9 or less were cleared, 12 percent of the cases in the most frequent loss category ($200 to $499) were CI~~~r~p by arrest.
_0 ,.~"::-lr
45
Furthermore, 25 percent of' the burg{3fY offenses that reported financial losses of ,$5,000 to $9,999 resulted ii) clearances. In interpreting this relationship obetwt~en ctearance and loss one caveat is in order. Cle;arances covered only the I-year time span of the study. Thus, although burglaries may have been clearel~ after the end of t)le project period, they would not be included within this data set.
Other variables' rather consistently associated with the burglaries that were cleared include the use of tools and property damage. Burglaries characterized by no tool used to gain entry and no property damage were rnr6Sfllkcly to be cleared. These rela-o tionships were stronger for nonresidential burglaries than for residential burglaries. Deterrent characteristic variables were not associated in a consistent manner with whether the case was cleared or not. An exception, however, occurred for premises that had alarm systems. Burglaries occurring on premises having alarm systems were more likely to be cleared than those occurring on premises with no alarm system. The lack of an overall pattern suggests that cleared burglaries differ little from burglaries that were not cleared with respect to incident characteristics, a major exception being whether or not a loss occurred.
A possible explanation focuses upon the place where the apprehension was effected. It may be, for example, that many offenders were apprehended at the scene of the crime, thus accounting for the relationship between no loss and clearance. Manner of arrest includes the categories of reasonable cause versus all other. Types of arrest included under "other" include arrests on premises, citizen arrests, and arrestli in which the offender was fleeing the scene of the crime. Table 19 presents the relationship between loss and manner of arrest (with the original nine categories). An examination of this table shows a substantial relationship between no financial loss and the first three categories of arrest. A .... ests on premises (75 percent), fleeing the scene arrests (74 percent), and citizen arrests (69 percent) were substantially more likely to involve no financialloss than were a~rests based on reasonable cause criteria (16 percent), warrants (17 percent), and all points bulletins (17 percent).
The data reported in Table 19 thus support the contention that no financial loss is associated with clearances simply because these were cases in which offenders were apprehended at the scene. Offenders 0
most likely to be involved in burglaries resulting in no financial loss included males, those 18 years of age and older, and black/other offenders. The only
46 ~-
.-'-:-~-~
substantial relationship, however, was the rclat.ionship for black/other offenders. Forty-three percent of the black/other offenders committed burglaries with no reported financial losses compared with 33 percent for white offenders.
Prior Criminal History
Apprehended burglary offenders included in this study were most likely to be male (91 percent), white (66 percent), and almost equally divided between those 17 years or younger (51 percent), and those 18 years or older (49 percent). Unfortunately the data that were used in this study did not show whether juvenile offenders had prior juvenile criminal history, and thu£ criminal history refers to adult criminal records only. Thirty-three juveniles, however, did evidence previous convictions as adult offenders. Considering only those offenders 18 years of age or older, 80 percent had a prior record, 58 percent had a prior burglary record, 47 percent had prior drug arrests, and 44 percent were under supervision at the time of their arrest. These data thus indicate substantial criminal experience on the part of this apprehended offender group. Males were substantially more likely than females to have a prior record and also more likely to have a burglary record, a drug record, or to be under supervision. Black/other offenders were more likely than white offenders to have a previous burglary record, but the percentage of each of these offender groups exhibiting a previous drug record was about equal. White offenders were substantially less likely than black/other offenders to have, a prior record; they were also less likely to be under commitment at the time of arrest.
Mobility
Another .area of analysis was the mobility patterns of apprehended burglary offenders. Included in the data set was a variable that measured the distance (in miles) between an offender's residence and the site of the offense. This distance was dichotomized to include those who burglarized targets less than 1 mile from their residences (52 percent) and those who burglarized targets) mile or more from their residences (48 percent). Male burglary offenders were less likely than female offenders" to commit an offense 1 mile or farther from their residences. Similarly,._those 17 years or
"-~
younger (34 percent) were substantially less likely than those) g years or older (62 percent) to commit


- -(! ,.'
o
TABLE 19 Whether or not loss resulted from burglary, by type of arrest of apprehended offenders
[Percent]
Type of arrest
All Arrested Institu- Reason-On Fleeing Citizen points on other tional able
premise scene atrest bulletin charge Warrant hold cause ~ ";
Other Total
No loss 75 74 69 17 0 17 0 16 0 37 (163) (S5) (20) (4) (0) (3~" (01 (85) (0) (360)
,-'
Loss 25 26 31 83 100 83 1.00 84 100 63 (55) (30) (9), (20) (27) (151 (5) (485) (1l (620)
Total 100 100 100 100 100 100 100 100 100 100 (218) (115) (29) (24) (27) (1S) (5) (543) (1) (980)
\\

i '~ "
I'
"burglaries ] mile or farther from their residences. Although white offenders were slightly more likely
"than black/otbers to commit burglaries 1 mile or more from their residences, this relationship was not substantial. Interestingly, tbose with a prior bur~ glary record were more likely than those without a prior burglary record to be represented in the 1 mile or more category. This relationship held for other criminal history variables as well, possibly indicat~ ing that those with prior records are more Hkely to u'avel to places where lucrative targets are thought likely.
Distance was also found to be associated with certain of the incident characteristic variables. That is, those who committed an offense 1 mile or more from their residence were most likely to burglarize nonresidential structures in which entries were nonforcible, no tool was utilized, and no damage resulted to property. These relationships are proba~ bly accounted for by the strong association between distance and sex. Female offenders were also found to exhibit characteristics similar to those listed above. Distance was also correlated with census tract characteristics. Those in the 1 mile or more category committed burglaries in areas with higher median family income, higher educational levels, and a lower percentage of black residents. Those who committed burglaries outside their own neighborhoods, therefore, seemed to choose relatively socially advantaged areas.
Single and Multiple Offender Burglaries
Thirty percent of tbe arrestees included in this study were offenders who committed burglaries alone as opposed to 70 percent who were involved in group burglaries. Offenders most likely to bur~ glarize in the company of ~thers included those 17 years of age or younger and female offenders. White and black/other offenders were equally likely to be involved in single or multiple offender burglaries. Those who worked in groups (younger offenders and females) were less likely to have previous criminal histories. Multiple offenders burglaries were also found to result in more financial loss than single offender burglaries. Earlier, it was noted that those burglaries that resulted in financial losses were less likely to be cleared than those that did not. Because number of crime partners is associated with financial loss, one would expect those who commit multipleoffcnder burglaries to be less often apprehended
48
l\
than single-offender burglaries, yet the multiple offender burglars constitute a substantial proportion of those included in the data set. Those 17 years of age or younger also constitute a substantial proportion of apprehended offenders and, as noted above, are most likely to commit burglaries in the company of others. Younger offenders who burglarize in groups, therefore, seem to face a high probability of apprehension.
Police Screening
Police control the initial flow of defendants into the criminal justice system by deciding under what circumstances an arrest is warranted and whether or not sufficient evidence exists to file a complaint against an arrested person. Data for police screening were dichotomized into those released without filing a complaint, and those for whom prosecution was initiated by filing a complaint or who were transferred to the jurisdiction of another agency. The data showed a strong relationship between dispositions and the age, race, and sex of apprehended offenders. Black/other offlmders, those 18 years or older, and 'males were the types of offenders most likely to be processed for prosecution. When prior record was introduced as a control variable, however, black/other offenders were substantially more likely to be held for prosecution than were white offenders only in the no prior record category. For those offenders who had a previous criminal record, white offenders were more likely than black offenders to be held for prosecution, but the relationship was not substantial.
Other legal status variables were also found .to be important in screening by the police. For exampie, offenders who were under some form of supervision at the time of arrest were more likely to be processed than those Who were not. Although age, race, and sex differences were of less importance than previous criminal history, they were not altogether insignificant. Males, for example, gentlrally fared worse than females, as did black/other offenders compared with white offenders in those group!) that exbibited similar characteristics. It is unfortunate that addition~l judicial processing data wt{re unavailable at the time of this study. Such d~ta would have allowed us to examine the relevance of both social and legal status variables at other stages where decisions are made in the processing of criminal defendants.

Methodological Observations
This study examined the correlates of burglary that occurred in six separate police jurisdictions over a ] -year period. Because the study relied on official police data, it was limited in some respects by the problems inherent in using such data sources. For example, correlates of unreported burglaries could not be examined, although revelant findings from recent victimization studies were reviewed. Also, as in any ex post facto design, test conditions could not be manipulated because they were limited to the parameters established in the original California project. That is, although baseline data or data collected somewhat beyond the project period might have been preferable, such preferences were beyond control. Research is never perfect and most designs are plagued by shortcomings of one type or another. Thus j it would be worthwhile to note the limitations or the present undertaking.
Inability t'U Generalize.
The data reported in this study were derived from selected target areas in six separate police ~gencies. Thus, it would not be appropriate to generalize these findings to other geographic areas. Similarly, rela J
tionships are specific to those census tracts for which incidents were reported and may not, in fact, be found in other parts of the respective jurisdictions. Nonetheless, one is struck by the consistency with which similar findings are reported in divergent research areas. That is, the characteristics of those burglary incidents reported in these reports and elsewhere are found to be quite similar regardless of the geographic area in which the research is undertaken;
Technique of Analysis
Although a number of different analytic techniques were used in these three reports to examine the correlates of burglary, there are some shortcomings associated with certain of these measures. Predictive Attribute Analysis (PAA) was used in the first two reports in this series. Turner points out the following about PAA: "PAA suffers from an over fitting bias, it capitalizes on chance variation" (1969:37). In such circumstances solutions are likely to be unreliable because observed relationships are influenced by random error. After having divided the data into two sets, norther!l B.nd southern
---------------------
California, the PAA analysis was rerun on both sets on the decision to hold or release the offender. Results were quite similar to those obtained when the entire data set was used. Although this split~half technique was not random, it should, nonetheless, increase the degree of confidence in the PAA results on the entire data set obtained for the police release decisions.
Burglary Prevention Techniques
Because of the problems associated with th~, original California burglary study (lack of baseline data, restrictive time frame, selected target areas, and the like), it was not possible to assess the overall effect of preventive techniques on the reduction of burglary. Had it been possible to do so, however J
results here may have suggested some implications about the utility of future abatement programs, for example, whether police saturation of high burglary areas is effective in reducing the incidence of burglary.
Burglary Target Areas
Although socioeconomic differences were noted across those census tracts included in the target areas, all were, in effect, high crime areas. It would have been advantageous to include more diversified areas in the study.
Having listed some or the limitations of the study, some of the improvements this study offered over previous research endeavors in this area should be noted.
Paucity of Burglary Research
As noted at the outset, empirical research examining the correlates of burglary is quite rare and has only recently emerged. All of the literature reviewed earlier, for example, contain studies conducted subsequent. to 1970. This study increases the substantive knowledge regarding the correlates of burglary and points to the need for additional research in this area.
Methodology
Previous research focusing on crime patterns has frequently followed a consistent methodological format. Generally, this format employs tabular analysis to the ,exclusion of other multivariate techniques. The limitations and advantages of tabular analysis
49
_ ...
~_--,--______________________ ""' ___ ic'

were stated earlier and need not be repeated at this point. The technique generally precludes the simultaneous consideration of many variables .. The mult.ivariate analysis undertaken in this study specified relationships among variables that may have been overlooked had tabular analysis alone been relied upon. Similarly, by employing cluster analysis, it was possible to reduce a multitude of variables to a more simple solution. Cluster analysis was also found to be an efficient technique for creating homogeneous groups of both offense and offender characteristics. Techniques of dimensional analysis (both cluster and factor solutions) would seem to be of great value in future crime-specific research of this nature.
Missing Data
For tbe most part the data used in this ~udy were relatively complete. That is, information on most variables was missing on a surprisingly low percentage of cases. Only two variables, type of property stolen and amount of financial loss, had data missing on over 15 percent of the cases.
Reliability of the Data
Because these data were collected as part of a large-scale crime-specific burglary program, more faith has been placed in their accuracy than might otherwise have been the case. The accuracy with which burglary data are recorded in day-to-day police operations is at best uncertain. However,
.. because this project was closely monitored by both the Bureau of Criminal Statistics and each respective police jurisdiction, there is less reason to doubt the accuracy with which burglary incident characteristics were recorded. Furthermore, the type of information recQrded was relatively complete compared to the irlformation about burglary characteristics reported in other studies. Although it would be possible to speculate on the type of additional variables that could have been included (e.g., victim characteristics), much more information was provided than has previously been available.
Because many of the relationships found in the data were" logically expected (for example, attempted burglaries had no financial losses), there is even less reason to doubt the accuracy of the data. If it had been discovered that casf;'S involving financial losses were found within the category of attempted burglaries, then recording errors would have been
50
suspected, Thus, there is some assurance that hurglary data collected by the police were accurately coded by personnel working at the Bureau of Criminal Statistics.
The similarity of burglary incidents, regardless of the geographic area in which they occur, is quite striking. This study has confirmed the findings of previous studies relying on police incident data for analysis. For example, residential burglaries are most apt to occur on weekdays during the daylight hours and nonresidential burglaries on weekends during the nighttime. Most burglaries are characterized by forcible entries and relatively few attempted burglaries are reported to the police. Findings such as these have been consistently reported by research projects conducted in quite divergent geographic areas. Furthermore, victim survey results have found similar characteristics. That is, characteristics of burglary incidents reported in victimization studies are generally similar to those found when official data are used.
Although there is no way of knowing the characteristics of burglary offenders who were not arrested, those offenders who were arrested and those who were not, seem to be committing the same types of burglaries. Furthermore, these burglaries do not seem to be the type likely to be committed by per-
. sons skilled at their trade. These data, then, lend some measure of support to Shover's (1971) observations about the type of burglary offeI.1der emerging today: an occasional, unskilled offender who evidences little sophistication, planning, or specialization .
The results obtained here are suggestive but not final. In order to examine burglary patterns over time, longitudinal data containing information on both offense and offender characteristics are needed. Unfortunately, however, even data to support research of the present type are not generally available. It was only because of the special nature of the California project that the analysis undertaken for these reports was made possible. In order to increase knowledge about the nature of crime and those who engage in it, adequate data collection systems must be instituted and maintained. If refined data, such as those used in this study, were generally to be maintained along with information on judicial and correctional outcome, researchers would be able to add even more to the present knowledge of burglary incident and offender characteristics and interrelationships.
//' If if
REFERENCES*
1970 "Survey Discloses Pattern in Crime." NeeD News, 49:14-32.
1922 A Burglar in the Clutch of Circumstance; MyOWn'St~~CNew York: D. Appleton and Company.
Amir, Menachem 1971 Patterns in Forcible Rape. Chicago:
The University of Chicago Press.
Anderberg, Michael R. 1973 Cluster Analysis for Applications.
New York: Academic Press.
Bailey, KennetltD. 1975 "Cluster Analysis," in David R. Heise
(ed.), Sodologicsl Methodology 1975. San Francisco; Jossey-Bass, ln~,
Black, Susan 1963 "A Reporter at Large: Burglary I."
New Yorker 39 (December 7).
1963a "A Reporter at Large: Burglary II." New Y.orker 39 (December 14).
Blalock, Hubert M., Jr. 1972 Social Statistics. New York:
McGraw-Hill Book Co ..
1964. Causal Inferences in Nonexperimental Research. Chapel Hill: The University of North Carolina Press.
Block, Herbert A. and Gilbert Geis 1962 Man, Crime, and Society. New York:
Random House.
Boggs, Sarah L. 1964 The Ecology of Crime Occurrence in
St. LouiS: A Reconceptualization of Crime Rates and Patterns. Ph.D. Dissertation. Washington University.
Bohrnstedt, George W. and T. Michael Carter 1972 "Robustness in Regression Analysis,"
in Herbert L. Costner (ed.), Sociological Methodology 1971. San Francisco: JoSsey-Bass, Inc.
·This bibliography provides a complete listing of all references used in this series of reports.
p California Department of Justice
1971 Crimes and"'"'A.i'~sts. Sacramento: Division of Law Enforcement, Bureau of Criminal Statistics.
1971 a Felony Defendants Disposed of in California Courts 1971. Sacramento: Division of Law Enforcement, Bureau of Criminal Statistics.
1970 Safe Burglars in California: An Analysis of Selected Offenses. Sacramento: Division of Law Enforcement, Bureau of Criminai- Statistics.
Cameron, Mary Owen 1964 The Booster and the Snitch: Depart.
ment Store Shoplifting. New York: The Free Press.
Chappe;ll, Duncan 1 !)65 The Development and Administra
tion of the English Criminal Law Relating to Offenses of Breaking and Entering. Ph.D. Dissertation. University of Cambridge.
Chimb(JIs, Peter D. 1973 "A Study of Breaking and Entering
Offenses in 'Northern City,' Ontario." Canadian Journal of Criminology and Corrections 15:316-.25.
Clarke, Steven H. 1972 Burglary and Larceny in Charlotte
Mecklenburg: A Description. Bas~d on Police Data. The Mecklenburg Criminal Justice Planning Council.
Clinard, Marshall B. 1963 Sociology of Deviant Behavior. New
York: Holt, Rinehart and Winston,' Inc.
Clinard, Mar.shall B. and Richard Quinney 1967 Criminal Behavior Systems-A
Typology. New York: Holt, Rinehart and Winston, Inc.
Cocke, Susan B. 1969 "Reformation of Burglary." William
and Mary Law. Rtlview 11 (FaU):21l-25. "
51

I ..
.....
Cohen, Lawrence E. 1974 Conferring the Delinquent Label: The
,; Relative Importance of. Social Characteristics and Legal Factors in the Processh:g of Juvenile Offenders. Ph.D. Dissertation. University of Washington.
Conklin, John E. 1972 Robbery and the Criminal Justice
Systen1. New York: J.B. Lippincott Company.
Conklin, John E., and Egon Bittner 1973 "Burglary in a Suburb." Criminology
l1(August): 206-32.
Cooley, William W. and Paul R. Lohnes 1971 Multinriate Data Analysis. New . '. York: John Wiley and Sons.
';r--' Davis; Kenneth C.
1971 Discretionary Justice. Chicago: University of Chicago Press.
Dunn, Christopher S. 1974 Tbe Analysis of Environmental At
tributes/Crime Incident Charad!teristic Interrelationships, Ph.D. Dissertation. State University of New York at Albany.
Ennis, Phillip H. 1967 Criminal Victimization in the United
States: A Report of a National Survey, Field Surveys II, A report of a research study submitted to the President's Commission on Law Enforcement and Administration of Justice.
Erikson, Maynard 1973 "Group Violations and Official Delin
quency: The Group. Hazard Hypothesis." Criminology 11 (August): 127-60.
Feyerherm, William H. _ 1974 Offensl1s Known in New York State.
Statistical Report L Crime Measurement Laboratory, School of Criminal Justice, State University of New York at Albany.
Gibbons, Don C. . 1973. Crime, Society and Criminal Careers.
Englewood Cliffs, N.J.: Prentice-Hall.
i\
~~,".c>4- ;t'_';,~~"---__ '_.'--'------'_:"-_=--'--------"-___ L
Gibbons, Don C. and Donald L. Garrity 1959 "Sorhe Suggestions for the Develop
ment of Etiological and Treatment Theory in Criminology." Social Forces 38(October):51-58.
Girard, Paul J. '. ': \1\
1960 "Burgh~J;y Trends and Protection." Journal of Criminal Law, Criminologyand Police Science 51 (January/FcQr.uary): 511-18.
Glaser, Barney G. and Anselm T. Strauss 1967 The Discovery of Grounded Theory.
Chicago: Aldine Publishing Company.
Gould, Leroy C. 1969 "The Changing Structure of Property
Crime in an Affluent Society." Social Forces 48(S~ptember):50-59.
Gray, Patrick L. 1972 Crime in the United States: Uniform
Crime Reports. Washington, D.C.: U.S. Government Printing Office.
Hagan, John 1974 "Extra Legal Attributes and Criminal
Sentencing: An Assessment of a Sociological Viewpoint." Law and Society Review8(Spring):357-83.
Hakeem, Michael 1945 "Parole Prediction Variables and the
Time Factor in Violations by Burglars." l'ournal of Criminal Law, Criminology and Police Science 35(3):157-65.
Hall, Jerome 1968 "Theft, Law and Society." American
Bar Association Journal 54 (October): 960-67.
1952 Theft, Law and Society. Indianapolis: Bobbs-Merrill.
Hindelang, Michael J. 1976 An Analysis of Victimization Survey
Results from the Eight Impact Cities. U.S. Department of Justice, Law Enforcement Assistance Administration, National Criminal Justice Information and Statistics Service. Washington, D.C.: U.S. Government Printing Office.

1976a "With a Little Help From Their Friends: Group Participation in Reported Delinquent Behavior." Brit~
jJ'~ ish Journal of Criminology \\ 1 6(April): 1 Q9~25.
1971 \\"The Social Versus the Solitary ~Nature of Delinquent Involvements," llritish Journal of Criminology i~(April):167~75.
Hindelang, Mich'ael J. and Carl E. Pope 1975 "Sources of Research Data in Crim~
inal Justice," in Emilio Viano (ed.), Role of Research in Criminal Justice. Boston: D.C. Heath and Company.
Hindelang, Michael J. and Joseph G. Weis 1972 "Personality and Self~Reported Delin
quency: An Application of Cluster Analysis." Criminology 1 O(Novem~ ber): 268-94.
Hindelang, Michael J., et aL 1973 Sourcebook of Criminal Justice
Statistics 1973. Washington, D.C .. : U.S. Government Printing Office.
Hirschi, Travis and Hanan C. Selvin 1967 Delinquency Research: An Appraisal
of Analytic Methods. New York: The Free Press.
Hopkins, Andrew 1974 "The Use of Clusteri~g Techniques in
the Construction of Crime Indexes." Journal of, Research in Crime and Delinquency (forthcoming).
Kelly, Clarence M, ,.' 1973 Crime in the Uniteti States: Uniform
Crime Reports. Washington, D.C.: U.S. Government Printing Office.
KerIinger, Fred N. and Elazar J. Pedhazur 1973 Multiple Regression in Behavioral
Researcb. New York: Holt, Rinehart and Winston, Inc.
Kittrie, Nicholas 1971 The Right to be Different: Deviance
and Enforced Therapy. Baltimore: The john Hopkins Press.
- - ----~-----
Klein, Malcolm, et at. 1974 "The Ambiguous Juvenile Arrest."
Paper presented at the annual meeting of the Society for the Study of Social Probleems, Montreal, Canada.
Korn, Richard R. and Lloyd W. McCorkle 1959 Criminology and Penology. New
York: Holt, Rinehart and Winston, Inc.
LaFave, Wayne R. 1965 Arrest: The Decision to Take a
Suspect Into Custody. Boston: Little, Brown and Company.
Loth, David 1972 Crime in the Suburbs. New York:
William Morrow and Company.
Lottier, Stuart 1938 "Distribution of Criminal Offenses in
Metropolitan Regions.*' Journal of Criminal Law, Criminology and Police Science 29(May-June):37-50.
1938a "Distribution of Criminal Offenses in Sectional Regions." Journal of Criminal Law, Criminology and Police Science29(3):329-44.
MacNaughton~Smith, P. 1965 Some Statistical and Other Numerical
Techniques for qassifying Individuals. London: Home Office.
McQuitty, Louis L. 1964 "Capabilities and Improvements of
Linkage Analysis as a Clustering Method." Educational and Psychologicat"Measurement 24 (Summer): 441-56.
1963 "Rank 'Order Typal Analysis." Educa~ tional "and Psychological Measure .. ment 23(Spring):55~61.
1957 "Elementary Linkage Analysis for Isolating Orthogonal and Oblique Types and Typal Relevancies. 1I
Educational and Psychological Measurement 17(Summer);207-29.
I
Normande,au, Andre 1968, Trends and Patterns" in Crimes of
Robbery. Ph.D. Dissertation, Univer~ sity of Pennsylvania,
53

~~. 1\\
.. III, \ .
r Pittman, David l. and William Handy
i: 1964 "Patterns in Criminal Aggravated Assault." Journal of Criminal Law, Criminology and Police Science 55(December):462-70.
Pope, Car1 E.
. 54
1977 Crime-Specific Analysis: The Characteristics of Burglary Incidents. Analytic Report SD-AR-I0. U.S. Department of Justice, Law EnforcemCQ!:JAssistance Administration, National Criminal Justice Information and Statistics Service. Washington, D.C.: U.S. Government Printing Office.
1977a
1975
1975a
Crime-Specific Analysis: An Empirical E:iamination of Burglary Offender Characteristics. Analytic Report SD-AR-ll. U.S. Department of Justice, Law Enforcement Assistance Administration, National Criminal Justice Information and Statistics Service. Washington, D.C.: U.S. Government Printing Office.
Offender-Based Transaction Statistics: New Directions in Data Collection and Reporting. Analytic Report SD-AR-5. U.S. Department of Justice, Law Enforcement Assistance Administration, National Criminal Justice Information and Statistics Service. Washington, D.C.: U.S. Government Printing Office.
Sentencing of California Felony Of· fenders. Analytic Report SD-AR-6. U.S. Department of Justice, Law Enforcement Assistance Administration, National Criminal Justice Information and Statistics Servke. Washington, D.C.: U.S. Government Printing Office.
1975b The Judicial Processing of Assault and Burglary Offenders in Selected California Counties. Analytic· Report SD-AR-7. U.S. Department of Justice, Law Enforcement Assistance Administration, National Criminal Justice Information and Statistics Service. Washington, D.C.: U.S. Government Printing Office .
President's Commission on Law Enforcement and Administration of Justice
1967 Task Force Report: Crime and Its Impact-An Assessment. Washington, D.C.: U.S. Government Printing Office.
1967a The Challenge of Crime in a Free Society. Washi~gton, D.C.: U.S. Government Printing Office.
Reckless, Walter C. 1973 The Problem of Crime. New York:
Appleton-Century-Crofts.
Reiss, Albert J., Jr. 1969 "Field Survey" Appendix A of U.S.
Congress, Senate Select Committee on Small Business. Crime Against Small Business. Washington, D.C.: U.S. Government Printing Office.
1966 "Offenses of Burglary, Robbery and Shoplifting Against Businesses or Organizations in Eight Police Precincts of Three Cities." Report to the President's Commission on Law Enforcement and the Administration of Justice. Washington, D.C.: U.S. Government Printing Office.
1966a "Place of Residence of Arrested Persons Compared with Place Where the Offense. Charged in Arrest Occurred for Part I and Part II Offenses." Report submitted to the President's Commission on Law Enforcement and Administration of Justice. Ann Arbor, Michigan: University of Michigan.
Reppetto, Thomas A. 1974 Residential Crime. Cambridge, Mass.:
Ballinger Publishing Co.
Rockwell, l.W. 1972 "Crime Specific-An Answer." Police
Chief 39(September):38-43.
Roebuck, Julian B. 1~~7 Criminal Typology_ Springfield, Ill.:
'i'\ Charles C. Thomas.
Roebuck, Julian B. and Mervyn L. Cadwallader 1961 "The Negro Armed Robber as a Crim
inai Type: The Construction and Application ofa T,ypology." Pacitic Sociological Review 4(Spring):21-6.

Rosenberg, Morris 1962 "Test Factor Standardization as a
Method of Interpretation." Social Forces 41(October):53-61.
Rummell, R.J. 1972 The Dimensions of Nations. London:
Sage Publications.
1970 Applied Factor Analysis. Evanston, Ill.: Northwestern University Press.
Santa Clara Criminal Justice Pilot Program 1972 Burglary in San Jose. Springfield,
Va.: U.S. Department of Comm/'r~e.
Scarr, Harry A. 1973 Patterns of Burglary (2nd EunlOn).
Washington, D.C.: U.S. Government Printing Office.
1973a "The Nature and Patterning of Residential and Nonresidential Burglaries," Criminal Justice Monograph: Deterrence of Crime in and Around Residences. Washington, D.C.: U.S. Government Printing Office, pp. 78-112.
1972 Patterns of Burglary. Washington, D.C.: U.S. Government Printing Office.
Schmid, Calvin F. 1960 "Urban Crime Areas, Patt II."
American Sociological Review 25(October):655-78.
1\ Schrag, Clarence
1961 "A Preliminary Criminal Typology." The Pacific Sociological Review 4(Spring):11-16.
Schultz, Thomas A. 1970 "Criminal Law-Burglary-A Sum
mer Home is an Uninhabited Dwelling During the Time When It's Unoccupied." University of Cincinnati Law Review 39(Spring):421-26.
Schur, Edwin M. 1965 Crimes Without Victims. Englewood
Cliffs, New Jersey: Prentice-Hall.
Sellin, Thorsten and Mar:vin E. Wolfgang 1964 The Measurement of Delinquency.
New York: John Wiley and Sons.
Shover, Neal 1973 "The Social Organization of Burglary. "
Social Problems 20(Spring):499-513.
1971 Burglary as an Occupation. Ph.D. D issertadon. University of Illinois at Urbana-Champaign.
Siegal, Sidney 1956 N(;nparametric Statistics. New York: '
McGraw-Hill Book Co.
Silverman, Robert Allan 1971 Victims of Delinquency. Ph.D. Dis
sertation. University of Pennsylvania.
Simon, Frances H. 1971 Prediction Methods in Criminology.
London: Home Office.
Skolnick, Jerome H. 1966 Justice Without Trial. New York:
John Wiley and Sons.
Small Business Administration 1969 Crime Against Small Business.
Report submitted to the U.S. Senate Select Committee on Small Business. Washington, D.C.: U.S. Government Printing Office.
Sneath, Peter H. and Robert R. Sokal 1973 Numerical Taxonomy. San Francisco:
W.H. Freeman.
Sutherland, Edwin H. 1937 The Professional Thief. Chicago:
University of Chicago ,Press.
Sutherland, Edwin H. and Donald R. Cressey 1970 Criminology. New York: J.B. Lippin
cott Company.
System Development Corporation 1974 Crime.Specific Burglary Prevention
Handbook. State of California, Office of Criminill Justice Planning.
Tryon, Robert C. 1958 "Cumulative Comm unality Cluster
Analysis." Educational and Psy. chological Measurement 18 (Spring): 1-35.
1958a "General Dimensions of Individual Differences: Cluster Analysis vs. Multiple Factor Analysis." Education and Psychological Measurement 18(Autumn):477-95.
55
II
/Ii

1957 "Communality of a Variable: Formulation by Cluster Analysis." Psychometrika 22{September):241-60.
Tryon, Robert C. and Daniel E. Bailey 1970 Cluster Analysis. New York:
McGraw-Hill Book Co.
Turner, Stanley 1969 "The Ecology of Delinquency," in
Thorsten Sellin and Marvin E. Wolfgang (ed.) Delinquency: Selected Studies. New York: John Wiley and Sons.
U.S. Department of Justice 1972 San Jose Methods Test of Known
Crime Victims. Statistics Technical Report No. 1. Law Enforcement Assistance Administration, National Institute of Law Enforcement and Criminal Justice, Statistics Division. Washington, D.C.: U.S. Government Printing Office.
Von Hentig, Hans 1948 The Criminal and His Victim. New
Haven: Yale University Press.
Warren, Marguerite Q.
56
1971 "Classification of Offenders as an Aid to Efficient Management and Effective Treatment." Journal of Criminal Law, Criminology and Police Science 62(1une):239-58.
West's Annotated California Codes 1970 Penal Code §§ 459 to 680. St. Paul,
Minn.: West Publishing Co.
Wickersham, George W. 1968 Report on Criminal Statistics.
Montclair, N.J.: Patterson Smith. Originally published by the U.S. Government Printing Office, 1931.
Wilbanks, William L. 1972 The Predictive Efficiency of Alterna
tive Methods of Construction of Parole Tables. Master's Thesis. State University of N~ York at Albany.
Wilkins, Leslie T. and P. MacNaughton-Smith 1964 "New Prediction and Classification
Methods in Criminology." Journal of Research in Crime and Delinquency 1 (January): 19-32.
Wormeli, P.K. and S.B. Kolodney 1972 ~ "The Crime-Specific Model: A' New
/ Criminal Justice Perspective." Journal of Research in Crime and Delinquency 9(January):54-65.
Wolfgang, Marvin E. 1958 Patterns in Criminal Homicide. New
York: John Wiley and Sons.
Zeisel, Hans 1968 Say It With Figures. New York:
Harper and Row.
~ u. S. GOVEMMENT PlUJl!TING OPPles;: '1678 260-992/2122
i)

I I I I I I
Dear Reader:
U.S. DEPARTMENT OF JUSTICE LAW ENFORCEMENT ASSISTANCE ADMINISTRATION
USER EVALUATION QUESTIONNAIRE Crime-Specific Anaiysis: An Empirical Examination
of BurghuyOffense and Offender Characteristics Analytic Report No. 12
The Criminal Justice Research Center and the Law Enforcement Assistance Administration are interested in your comments and suggestions about this report, produced under the Utiliz",L _0' of Criminal Justice Statistics project. We have provided this form for whatever opinions \you wish to express about this report. Please cut out both of the~e pag~:'-t:;t=p!~ th~m tG· gether on one corner, and fold so that the Law Enforcement Assistance Administration address appears on the Clutside. After folding, use tape to seal closed. No postage stamp is necessary.
Thank you for your help.
1. For what purpose did y,ou use this report?
~ 2. For that pu~pose, the report- 0 Met most of myneedsDMet some of my needsDMet none of my needs ..l 0lIl
~ a ! ..l ~ ... B I J J I I I I 1 I I I I I I J I I I I I 1 1 I 1 I I I J I J 1 I I 1 I J I I I J I 1
,I I I I I I 1
3. How will this report be useful to you?
o Data ."urce o Other (please specify) __________ _
o Teaching material
o Reference for article or report o Will not be useful '0 me (please explain) ____ _
o General information
o Criminal justice program planning
4. Are there any otfu.r data sources you could suggest to address the topic of this report?
5. Would you like to see gny other ,analyses of the data contained in this report?
Pag. 1

6. Which ports of the r.port, if any, went difficult to understand or use? How could they be improved?
7. Can you point out specific parts of the text or table notes that are not clear or terms that need to be defined?
8. Can you point out any specific statistical techniques or terminology used In this report that you feel should be more adequately explained? How could these .be better explained?
9. Are there ways this report could b. improved that you have n~t mentioned?
10. Please suggest other topi!:s you would like to see addreued in future analytic.reports.
11. Please suggellt any speciHc criminal justice data bases or sources of criminal justice data that could be explored in future analytic reports. (Please give as full a citation as possible.)
,Page 2
--~~-~ ------.----

, L
I I I I I. I I I I I I I I I I I I J I I I J I I I J J I I I I I I I I 1 I I I I I I I I I
~ oJ
~ ~ oJ ..: .... a I J 1 I I I I I I I I I I I J I J I I I I I I I I I I I I I I I I I I I I I I I I I I I I I I I I
12.
13.
14.
15.
16.
In what capacity did you use this report?
o Researcher
o Educator
o Student
o Criminal justice agency employe!!
o Governmont employee ather than criminal justice - Specify
o Other· Specify
If you used this report as a governmental employee, please indicate the level of government.
o Federal o City
o State o Other· Specify
o County
If you used this report as a criminal justice agency employee, please indicate the sector in which you work.
0 Law enforcement (police) o Corrections 0 Legal services and prosecution o Parole
0 Public or private defense services o Criminal justice planning agency
0 Courts or court odministratioll o Other criminal justice agency· Specify type
0 Probation
If you used !his report as a criminal justice employee, please indicate the type of position you hold. Mark all that apply
o Agency or institution administrator o Program or project manager
o General program planner/evaluator/analyst o Statistician
o Budget planner/evaluator/analyst o Other - Specify
o Operations or management planner/evaluator/analyst
Additional comments
,,,,Page 3

NCJRS REGISTRA '[ION SD.AR.12
The National Criminal Justice Reference Service (NCJRS) abstrads documents published in the criminal justice field. Persons who are regist.redwith the Reference Service receive announcements of documents in th.ir !{,ated fi.lds of interest and order forms far free copies of LE,AA and NCJISS publications. If you are not registered with the Reference Service, and wish to be, please provide your name and mailing address below and check the appropriate box.
rName
o Plea.e .. nd me a NCJRS Number and .treet registration form.
City State ZIP Code o Pleo ... end me the report.
lI.ted below.
(Fold here)
~---.. -------------... -------------------------------.. -U.S. DEPARTMENT OF JUSTICE Law Enforcement Aulstance Administration Waahlngtan, D.C. 20531
Director, Statistics Division
POSTAGE AND FEES PAID U.S. DEPARTMENT OF JUSTICE
JUS-436
National Criminal Justice Information and Statistics Service Law Enforcement Assistance Administration U.S. Department of J",stice Washington, D.C. 20531
------------------------------------~.~~~----------. (Fold he,e)
If you wish to receive copies of any of the National Criminal Justice Information and Statistics Service ,,,ports listed inside the front cover, please list them below and include your name and address in the space provided above.