An assessment of the Sr/Ca ratio in shallow water ...mgg.rsmas.miami.edu/groups/bio/Marshall...
18
PII S0016-7037(02)00926-2 An assessment of the Sr/Ca ratio in shallow water hermatypic corals as a proxy for sea surface temperature JOHN F. MARSHALL* and MALCOLM T. MCCULLOCH Research School of Earth Sciences, Australian National University, Canberra, ACT 0200, Australia (Received March 20, 2001; accepted in revised form April 8, 2002) Abstract—The high precision measurement of the Sr/Ca ratio in corals has the potential for measuring past sea surface temperatures at very high accuracy. However, the veracity of the technique has been questioned on the basis that there is both a spatial and temporal variation in the Sr/Ca ratio of seawater, and that kinetic effects, such as the calcification rate, can affect the Sr/Ca ratio of corals, and produce inaccuracies of the order of 2– 4 °C. In the present study, a number of cores of the massive hermatypic scleractinian coral Porites, from the central Great Barrier Reef, have been analyzed for Sr/Ca at weekly to monthly resolution. Results from a 24 year record from Myrmidon Reef show an overall variation from 22.7 °C to 30.4 °C. The record shows a warming/cooling trend with maximum warming centred on the 1986 –1987 summer. While some bleaching was reported to have occurred at Myrmidon Reef in 1982, the Sr/Ca record indicates that subsequent summer temperatures were much higher. The 4.5 year record from Stanley Reef shows a maximum SST of 30 °C during the 1997–1998 El Nin ˜o event. The calibrations from Myrmidon and Stanley Reefs are in excellent agreement with previously published calibrations from nearby reefs. While corals do not calcify in equilibrium with seawater due to physiological control on the uptake of Sr and Ca into the lattice of coralline aragonite, it can be argued that, provided only a single genus such as Porites sp. is used, and that the coral is sampled along a major vertical growth axis, then the Sr/Ca ratio should vary uniformly with temperature. Similarly, objections based on the spatial and temporal variability of the Sr/Ca activity ratio of seawater can be countered on the basis that in most areas where coral reefs grow there is a uniformity in the Sr/Ca activity ratio, and there does not appear to be a change in this ratio over the growth period of the coral. Evidence from several corals in this study suggest that stress can be a major cause of the breakdown in the Sr/Ca–SST relationship. Thermal stress, resulting from either extremely warm or cool temperatures, can produce anomalously low Sr/Ca derived SSTs as a result of the breakdown of the biological control on Sr/Ca fractionation. It is considered that other stresses, such as increased nutrients and changes in light intensity, can also lead to a breakdown in the Sr/Ca–SST relationship. Two of the main issues affecting the reliability of the Sr/Ca method are the calibration of the Sr/Ca ratio with measured SST and the estimation of tropical last glacial maximum (LGM) palaeo- temperatures. Instead of producing a constant calibration, just about every one published so far is different from the others. What is obvious is that for most calibrations while the slope of the calibration equation is similar, the intercepts are not. While the cause for this variation is still unknown, it would appear that corals from different localities around the world are responding to their own particular environment or that certain types of environments exert a control on the corals’ physiology. Sr/Ca derived SST estimates for the LGM and deglaciation of 5 °C– 6 °C cooler than present are at odds with estimates of 2 °C–3 °C cooling by other climate proxies. The apparent lack of reef growth during the LGM suggests that SSTs were too cold in many parts of the tropics for reefs to develop. This would lend support to the idea that tropical SSTs were much cooler than what the CLIMAP data suggests. Copyright © 2002 Elsevier Science Ltd 1. INTRODUCTION Stoichiometric trace element ratios within the aragonite skel- eton of hermatypic corals are known to have temperature dependent seawater/coral partition coefficients that can provide a proxy for sea surface temperature (SST). Elemental ratios that have some temperature dependent correlation are known to include B/Ca (Sinclair et al., 1998; Fallon et al., 1999), Mg/Ca (Mitsuguchi et al., 1996), Sr/Ca (Smith et al., 1979; Beck et al., 1992), and U/Ca (Min et al., 1995; Shen and Dunbar, 1995). One of the most promising SST proxies has been the high precision measurement of the Sr/Ca ratio in coral skeletons using a combination of isotope dilution (ID) and thermal ion- ization mass spectrometry (TIMS) (Beck et al., 1992), and more recently inductively coupled plasma—atomic emission spectroscopy (ICP–AES) (Schrag, 1999). Sea surface temperature is a crucial parameter because of its linkage with climate phenomena such as El Nin ˜o. Only in the past two decades has a sufficient volume of instrumental data been acquired to observe the onset and development of El Nin ˜o, but even now our understanding of what initiates it and how it propagates is rudimentary because of the variability inherent in this phenomenon (Cane et al., 1995). In order to create better prediction models it is necessary to extend the El Nin ˜o record back by several centuries so as to assess the frequency and magnitude of key variables, such as SST. While the instrumen- tal record is very sketchy at this time scale, massive corals, such as Porites sp., have the ability to live for up to 300 –500 years or more, and, because their growth rate is commonly of the order of 1–2 cm yr 1 , it is possible to retrieve high reso- lution (weekly to monthly) SST records by measuring their * Author to whom correspondence should be addressed (john.marshall@ anu.edu.au). Pergamon Geochimica et Cosmochimica Acta, Vol. 66, No. 18, pp. 3263–3280, 2002 Copyright © 2002 Elsevier Science Ltd Printed in the USA. All rights reserved 0016-7037/02 $22.00 .00 3263
-
Upload
trinhnguyet -
Category
Documents
-
view
212 -
download
0
Transcript of An assessment of the Sr/Ca ratio in shallow water ...mgg.rsmas.miami.edu/groups/bio/Marshall...
PII S0016-7037(02)00926-2
An assessment of the Sr/Ca ratio in shallow water hermatypic corals as a proxy for seasurface temperature
JOHN F. MARSHALL* and MALCOLM T. MCCULLOCH
Research School of Earth Sciences, Australian National University, Canberra, ACT 0200, Australia
(Received March 20, 2001;accepted in revised form April 8, 2002)
Abstract—The high precision measurement of the Sr/Ca ratio in corals has the potential for measuring pastsea surface temperatures at very high accuracy. However, the veracity of the technique has been questionedon the basis that there is both a spatial and temporal variation in the Sr/Ca ratio of seawater, and that kineticeffects, such as the calcification rate, can affect the Sr/Ca ratio of corals, and produce inaccuracies of the orderof 2–4 °C. In the present study, a number of cores of the massive hermatypic scleractinian coralPorites, fromthe central Great Barrier Reef, have been analyzed for Sr/Ca at weekly to monthly resolution. Results froma 24 year record from Myrmidon Reef show an overall variation from 22.7 °C to 30.4 °C. The record showsa warming/cooling trend with maximum warming centred on the 1986–1987 summer. While some bleachingwas reported to have occurred at Myrmidon Reef in 1982, the Sr/Ca record indicates that subsequent summertemperatures were much higher. The 4.5 year record from Stanley Reef shows a maximum SST of 30 °Cduring the 1997–1998 El Nin˜o event. The calibrations from Myrmidon and Stanley Reefs are in excellentagreement with previously published calibrations from nearby reefs. While corals do not calcify in equilibriumwith seawater due to physiological control on the uptake of Sr and Ca into the lattice of coralline aragonite,it can be argued that, provided only a single genus such asPorites sp. is used, and that the coral is sampledalong a major vertical growth axis, then the Sr/Ca ratio should vary uniformly with temperature. Similarly,objections based on the spatial and temporal variability of the Sr/Ca activity ratio of seawater can be counteredon the basis that in most areas where coral reefs grow there is a uniformity in the Sr/Ca activity ratio, and theredoes not appear to be a change in this ratio over the growth period of the coral. Evidence from several coralsin this study suggest that stress can be a major cause of the breakdown in the Sr/Ca–SST relationship. Thermalstress, resulting from either extremely warm or cool temperatures, can produce anomalously low Sr/Ca derivedSSTs as a result of the breakdown of the biological control on Sr/Ca fractionation. It is considered that otherstresses, such as increased nutrients and changes in light intensity, can also lead to a breakdown in theSr/Ca–SST relationship. Two of the main issues affecting the reliability of the Sr/Ca method are the calibrationof the Sr/Ca ratio with measured SST and the estimation of tropical last glacial maximum (LGM) palaeo-temperatures. Instead of producing a constant calibration, just about every one published so far is differentfrom the others. What is obvious is that for most calibrations while the slope of the calibration equation issimilar, the intercepts are not. While the cause for this variation is still unknown, it would appear that coralsfrom different localities around the world are responding to their own particular environment or that certaintypes of environments exert a control on the corals’ physiology. Sr/Ca derived SST estimates for the LGM anddeglaciation of 5 °C–6 °C cooler than present are at odds with estimates of 2 °C–3 °C cooling by other climateproxies. The apparent lack of reef growth during the LGM suggests that SSTs were too cold in many parts ofthe tropics for reefs to develop. This would lend support to the idea that tropical SSTs were much cooler thanwhat the CLIMAP data suggests.Copyright © 2002 Elsevier Science Ltd
1. INTRODUCTION
Stoichiometric trace element ratios within the aragonite skel-eton of hermatypic corals are known to have temperaturedependent seawater/coral partition coefficients that can providea proxy for sea surface temperature (SST). Elemental ratios thathave some temperature dependent correlation are known toinclude B/Ca (Sinclair et al., 1998; Fallon et al., 1999), Mg/Ca(Mitsuguchi et al., 1996), Sr/Ca (Smith et al., 1979; Beck et al.,1992), and U/Ca (Min et al., 1995; Shen and Dunbar, 1995).One of the most promising SST proxies has been the highprecision measurement of the Sr/Ca ratio in coral skeletonsusing a combination of isotope dilution (ID) and thermal ion-ization mass spectrometry (TIMS) (Beck et al., 1992), and
more recently inductively coupled plasma—atomic emissionspectroscopy (ICP–AES) (Schrag, 1999).
Sea surface temperature is a crucial parameter because of itslinkage with climate phenomena such as El Nin˜o. Only in thepast two decades has a sufficient volume of instrumental databeen acquired to observe the onset and development of El Nin˜o,but even now our understanding of what initiates it and how itpropagates is rudimentary because of the variability inherent inthis phenomenon (Cane et al., 1995). In order to create betterprediction models it is necessary to extend the El Nin˜o recordback by several centuries so as to assess the frequency andmagnitude of key variables, such as SST. While the instrumen-tal record is very sketchy at this time scale, massive corals,such asPorites sp., have the ability to live for up to 300–500years or more, and, because their growth rate is commonly ofthe order of 1–2 cm yr�1, it is possible to retrieve high reso-lution (weekly to monthly) SST records by measuring their
* Author to whom correspondence should be addressed ([email protected]).
Pergamon
Geochimica et Cosmochimica Acta, Vol. 66, No. 18, pp. 3263–3280, 2002Copyright © 2002 Elsevier Science LtdPrinted in the USA. All rights reserved
0016-7037/02 $22.00� .00
3263
Sr/Ca ratio. Modern scleractinian corals not only have thecapability of providing continuous climate data, but, by meansof radiocarbon and U-series dating, their fossil counterparts canprovide snapshots of climatic conditions for the last few hun-dred thousand years or so, and possibly longer.
Hermatypic scleractinian corals contain about 7500 � 500ppm Sr, although because of vital effects there can be distinctdifferences between genera (Weber, 1973). Apart from thesevital effects, the ratio of Sr to Ca in the coral is believed to becontrolled predominantly by two factors: (i) the Sr/Ca activityratio of seawater; (ii) the Sr/Ca distribution coefficient betweenaragonite and seawater (Smith et al., 1979; Beck et al., 1992).
1.1. The Sr/Ca Activity Ratio of Seawater
Because of the long residence times of Sr and Ca in theoceans [5.1 � 106 yr for Sr and 1.1 � 106 yr for Ca (Broeckerand Peng, 1982)], it has generally been assumed that the Sr/Caactivity ratio has remained essentially constant over the past100 000 years or so. This assumption has been brought intoquestion recently as a result of model studies of Sr release fromshelf carbonates during low sea level (glacial) events (Stoll andSchrag, 1998), and variations in foraminiferal Sr/Ca during lateQuaternary glacial/interglacial cycles (Martin et al., 1999; Stollet al., 1999). When Sr-rich aragonitic shallow marine sedi-ments, such as corals and the green alga Halimeda, are exposedon the shelf during eustatic sea level lowering subaerial diagen-esis of aragonite to low-Mg calcite by meteoric water occurs,resulting in the release of strontium. It has been proposed byStoll and Schrag (1998) that this may raise Sr/Caseawater by 1 to2 percent. While this increase is small, it has the ability toproduce a shift of 2 °C–3 °C in palaeotemperatures derivedfrom coral Sr/Ca ratios. Measurements of the Sr/Ca ratio inplanktonic and benthic foraminifera show variations of up to12% over glacial/interglacial cycles (Stoll et al., 1999). Whilethis variation is much greater than the model results of Stoll andSchrag (1998), a large part of it can be explained by selectivedissolution of foraminiferal tests and other environmental ef-fects such as temperature and pH (Martin et al., 1999). How-ever, both Stoll et al. (1999) and Martin et al. (1999) maintainthat up to 3–5% can be attributed directly to Sr/Caseawater
variations.From direct measurements of the Sr/Ca composition of sea-
water, it had earlier been noted that depletions of both elementsof the order of 1–3% can occur in surface waters (e.g., Brassand Turekian, 1974). Much of this has been attributed toremoval of Ca and Sr by surface dwelling organisms duringskeletogenesis. Traditionally, the Sr/Ca value representative ofthe marine environment has been reported as 8.6 � 0.4 mmolmol�1 (Kinsman, 1969). Analyses of seawater samples by deVilliers et al. (1994) using ID–TIMS show significant variationin their Sr/Ca ratio (8.5–8.7 mmol mol�1). Additional Sr/Caanalysis of surface waters from the Atlantic and Pacific Oceansby de Villiers (1999) averaged 8.539 � 0.0045 mmol mol�1,and it was suggested that surface waters are depleted by 2–3%relative to the deep ocean as a result of skeletal formation ofcelestite (SrSO4) by acantharians (e.g., Bernstein et al., 1987).
1.2. Temperature Dependence of the Sr/CaDistribution Coefficient
The aragonitic skeletons of corals have a preference for Sr(0.65–1.1% by weight) rather than Mg (0.06–0.43% byweight), whereas skeletons made of Mg calcite (such as coral-line algae) typically have much higher Mg contents (3.4–4.8%by weight). In general, aragonite will accommodate more Srthan calcite. The higher uptake of Sr into aragonite rather thancalcite is a function of the higher distribution coefficient for theformer (Bathurst, 1976). The distribution coefficient, DSr
A �(Sr/Ca)aragonite/(Sr/Ca)seawater, for corals is considered to beclose to unity (Weber, 1973), whereas for inorganically precip-itated aragonite it is about 1.15 (Kinsman and Holland, 1969).While DSr
A for inorganically precipitated aragonite is stronglytemperature dependent (Kinsman and Holland, 1969), earlierexperiments regarding temperature dependence in corals wereequivocal. Some workers (e.g., Thompson and Livingston,1970; Thompson and Chow, 1955) found no correlation be-tween temperature and Sr/Ca, whereas others (e.g., Houck etal., 1977; Kinsman, 1969; Smith et al., 1979) found that theSr/Ca ratio varied as a simple function of temperature. In hiscomprehensive study of the incorporation of Sr into corals,Weber (1973) found an inverse relationship between tempera-ture and DSr
A , but considered growth rate and other “specieseffects” to be more important. Both field and laboratory studiescarried out by Houck et al. (1977) and Smith et al. (1979)further strengthened the case for temperature dependence. Theymaintained that there is a distinct linear relationship betweenthe Sr/Ca ratio and the ambient water temperature at which theprecipitation of skeletal aragonite occurs, which is basicallyindependent of growth rate. They were also able to show thatDSr
A for corals is significantly different from inorganically pre-cipitated aragonite, and that DSr
A varies between different coralgenera. This was attributed to some form of biological control,whereby the Sr/Ca ratio in the tissue of the coral is slightlymodified from the seawater Sr/Ca ratio.
It was acknowledged by Smith et al. (1979) that Sr/Ca ratiosmeasured by such techniques as atomic absorption spectropho-tometry (AAS) were hampered by a lack of precision. Theerrors associated with this method, when converted to temper-ature, were of the order of �2 °C. As pointed out by Beck et al.(1992), this is the same as the typical SST range observed in thetropics. It was not until the introduction of ID–TIMS (Beck etal., 1992) that it was possible to measure SSTs with an accu-racy of better than �0.5 °C.
1.3. Previous Work
In their original experiments Beck et al. (1992) measured theSr/Ca ratio for the coral species Porites lobata from Noumeaand Tahiti. The corals were sampled along the growth axis atroughly monthly intervals. Rather than calibrate the Sr/Cadirectly against the in situ instrumental SST record, Beck et al.(1992) calibrated it against � 18O-derived SSTs from the samesamples. Their relationship between Sr/Ca and SST of
Sr/Ca � 103 � 10.72 � 0.0624 � SST (1)
is similar to the Smith et al. (1979) calibration for Porites, butwith greater precision. However, Beck (1994) later revised
3264 J.F. Marshall and M.T. McCulloch

their original calibration [the revised calibration of Sr/Ca � 103
� 10.479 � 0.06245 � SST is used hereafter for all referencesto Beck et al. (1992)], with the result that there was now a 4 °Cdifference between the two. In their paper, Beck et al. (1992)show a good correlation between the instrumental SST recordsfrom Noumea and Papeete and the Sr/Ca-derived SSTs, with anaverage difference of 0.34 °C between the two.
While Beck et al. (1992) were able to show a good correla-tion between the Sr/Ca ratio and SST, a note of caution wasintroduced by de Villiers et al. (1994). They suggested thatinterspecific differences, variable calcification, and extensionrates, and variability in the Sr/Ca composition of seawatercould introduce significant errors (1–2 °C) in the use of thismethod. In a subsequent paper (de Villiers et al., 1995), theSr/Ca-based proxy was further called into question on the basisof biological control of Sr/Ca uptake. They measured threespecimens of Porites lobata from Hawaii; two of which wereonly 20 m apart and the Sr/Caseawater showed no measurabledifference. All three grew at the same rate of 12 mm yr�1 andSST records from both areas are substantially the same. Theirresults show three different trends in Sr/Ca, and consequentlythree distinctly different calibrations, with differences from thesame reef as much as 2 °C–3 °C.
Evidence of biological control on the uptake of Sr/Ca hasbeen refuted subsequently by several studies. In southern Tai-wan, Sr/Ca measurements on Porites lobata and P. lutea byShen et al. (1996) showed that species differences and growthrate variations did not appear to affect the Sr/Ca–SST relation-ship. Similar conclusions were reached by Alibert and McCul-loch (1997) for the central Great Barrier Reef, where theyfound that the relationship holds true for a large range of annualextension and calcification rates, but provided that samplingwas conducted along the major growth axis. They found thatsampling off axis introduced errors of 1 °C–2 °C becausecorallites from different growth periods were being sampledsimultaneously, whereas this effect was negated by samplingalong the major axis of growth. Such off axis sampling couldaccount for the variable results of de Villiers et al. (1995).
Another problem has been the lack of consistent calibrationof the Sr/Ca ratio with SST. Ideally, the comparison betweenthe coral Sr/Ca ratio and an in situ instrumental SST record forthe same time period from the same reef is the best method, but,with a few exceptions, this has not proved feasible. The mainreason is that few reefs in the world have recorded continuousSST measurements for any length of time. In only a fewexamples have the corals been calibrated against the in situ SSTrecord (e.g., Alibert and McCulloch, 1997; Crowley et al.,1999). However, even in this situation the calibrations can benonuniform. Alibert and McCulloch (1997) derived separatecalibrations for five Porites sp. from Davies Reef in the centralGreat Barrier Reef. While three corals (Davies 2, 8, 11) pro-duced calibrations with an accuracy of �0.5 °C, two others(Davies 3 & A) showed errors of up to �1.5 °C. This anomalyis further examined in the Discussion (see Sect. 5.5).
A major reason for testing the Sr/Ca thermometer on moderncorals is to be able to accurately measure palaeotemperatures inancient corals. The results of Sr/Ca-based palaeotemperatureestimates of corals indicate that tropical SSTs during the LGMwere some 5 °C cooler than today (Guilderson et al., 1994),with SSTs rising 5 °C–6 °C during the deglaciation phase
between 8–14 kyr (Beck et al., 1997; Guilderson et al., 1994).However, other proxy records, such as alkenones (Bard et al.,1997) and stable isotope analysis of foraminifera from deep seasediments (Curry and Oppo, 1997), have produced palaeotem-peratures for the LGM more in line with CLIMAP results, withmaximum cooling of only 2 °C–3 °C (Crowley, 2000).
While the veracity of the Sr/Ca ratio method has beenconfirmed from several sites, more work is still required toconfirm it as a reliable proxy. In particular, Sr/Ca records fromnearby reefs, the same reef, and even from the same coral headneed to be examined in detail to demonstrate their reliabilityand accuracy. In order to produce an accurate SST record, thereis a requirement for the coral record to be calibrated against along term instrumental SST record. To date, very few studieshave been able to measure Sr/Ca derived SSTs with in situinstrumental SST from the same reef. Many studies must relyon data from SST stations that are remote to the coral site (e.g.,de Villiers et al., 1994), and this is considered to be a significantuncertainty in deriving accurate Sr/Ca–SST relationships. Thepresent study is designed to partly address some of the aboverequirements. A coral from Myrmidon Reef on the shelf edgeof the central Great Barrier Reef (Fig. 1) has been analyzed forSr/Ca in order to compare it to a 9 year instrumental recordfrom the same reef. This is one of the longest instrumentaldatasets on any reef so far that has also been analyzed forSr/Ca. In addition, a three year Sr/Ca derived SST record fromStanley Reef, a mid-shelf reef about 130 km southeast ofMyrmidon Reef (Fig. 1), has been produced. These two Sr/Ca-derived SST records are compared to others in the area, such asDavies Reef (Alibert and McCulloch, 1997), Pandora Reef(McCulloch et al., 1994), and Orpheus Island (Gagan et al.,1998) so as to determine if the Sr/Ca–SST calibrations from asingle region are consistent. Using these results, and studiesfrom elsewhere, we discuss the problems, both real and appar-ent, that have been raised regarding the reliability of themethod.
2. SAMPLES
Myrmidon Reef lies close to the edge of the continentalshelf, approximately 150 km from the coast, and it is theoutermost reef in this region (Fig. 1). Because of its distancefrom the coast, it is not affected by mainland runoff, but it issubjected to periodic upwelling (Andrews and Gentian, 1982).The reef has been the focus on ongoing research by the Aus-tralian Institute of Marine Science (AIMS), and as part of thismonitoring of reef processes an automatic weather station hasbeen installed on the reef flat since late 1987. Sea surfacetemperature, measured at hourly intervals, has been one of theparameters measured almost continuously at this site. Thelargest break in recording up until July 1996 had been 31 daysin February 1992, and only three breaks had occurred previ-ously that were longer than 10 days.
Two modern corals were cored with an underwater drill atMyrmidon Reef in July 1996. The drill unit uses compressed airfrom a scuba tank to drive a pneumatic drill attached to a 50 cmlong barrel. With the use of extension rods, it is possible torecover a 48 mm diameter core of up to 1.5 m in length. Thesecores were all taken from large (�1 m) Porites sp. heads froma site near the entrance of a prominent gutter at the northeastern
3265Sr/Ca in corals as a proxy for sea surface temperature

end of the reef. Core Myr-2 from a Porites lutea colonygrowing at a depth of 8 m was selected for detailed Sr/Caanalysis in this study.
Stanley Reef lies some 150 km south east of Myrmidon Reefand 70 km south east of Davies Reef, on the inner edge of thereef tract (Fig. 1). The reef is one of the larger ones in theregion, being some 15 km long and 10 km wide. It has a welldeveloped reef front and windward reef flat, a large lagoon withnumerous patch reefs, and a narrow leeward reef flat. Beyondthe leeward margin there is a shallow submerged platform, withnumerous patch reefs. Two large (�1.5 m), living Porites sp.heads from the shallow platform behind Stanley Reef, andanother large head at Old Reef, directly to the south of StanleyReef (Fig. 1), were drilled in January 1999. The top part of coreSt-1 drilled at a depth of 2.7 m was analyzed for Sr/Ca in thisstudy.
3. EXPERIMENT
3.1. Coral Preparation
Prior to cutting the core in half, the tissue zone at the top ofeach core is immersed in 50% v/v H2O2 for 24–36 hours tooxidize any organic material. The cores are cut either by hand,using a conventional rock saw or bandsaw or, more commonly,a purpose-built cutting device consisting of a diamond blademounted on a precision lathe. In the latter case, the coral coreis mounted onto the bed of the lathe, and the center of the coreis aligned with the blade. The lathe-mounted coral is automat-ically moved at slow speed into the blade to give an even,
smooth cut. Each coral core is cut in half lengthwise, and oneor several 8 mm thick slices are cut from one half. After theslice(s) is cut, it is cleaned in 18 M� water in an ultrasonic bathfor 30 minutes to remove any fine coral powder producedduring cutting. The slice is then either air dried or dried in anoven at 25 °C for 24 hours.
Each slice is examined under ultraviolet (UV) light to deter-mine if there is any fluorescence. Either prior to or after UVlight examination, the slice is x-rayed to produce an image ofthe density variation in the coral (Fig. 2). X-radiography wascarried out at public hospitals or private imaging clinics inCanberra. The coral slice is simply placed horizontally on asingle sided emulsion film and exposed for 0.1 seconds at 40mA and 42 kV. The positive print of the x-ray is used to countdensity bands to give some idea of the age and growth rate, andto determine the direction of the major growth axis. The majorgrowth axis is often at an angle to the core, and sometimesseveral growth axes must be selected, with overlapping growthbands, in order to effectively sample down the core. The coreis then cut along this axis (or axes) with a bandsaw.
For sampling, the 8 mm thick coral slice is mounted on aperspex holder attached to the base of a computer-controlledmoveable table such that the growth axis edge extends out fromthe holder by about 1 cm, with a clearance of about 5 mmbeneath. Using a 20 mm diameter drill bit, a ledge is cut bythinning the exposed edge from 8 mm to about 2 mm. This isdone automatically by moving the table at a speed of 0.5 mms�1 beneath the rotating bit and sequentially shaving a series of5 mm wide cuts on both sides, until the 8 mm thick slice has
Fig. 1. Map of the central GBR off Townsville showing the location of Myrmidon and Stanley Reefs, plus other reefsin the region where Sr/Ca results have been published.
3266 J.F. Marshall and M.T. McCulloch

been reduced to 2 mm along the growth axis. The slice iscleaned thoroughly in an ultrasonic bath partly filled with 18M� water, changing the water frequently, until no cuttingsfrom the mill are discernable. Particular attention is paid tothoroughly cleaning the ledge.
After drying, the coral slice is once more mounted on thecomputer-controlled milling table. The table can be pro-grammed to mill sequential samples at either 0.25 or 0.50 mmintervals, using a 2 mm diameter drill bit rotating at slow speed(100 rpm). At each sample interval the table is moved auto-matically so that the ledge comes into contact with the bit andmills into the ledge for a distance of 2.5 mm. The powderedsample is allowed to fall onto a small square of weighing paperplaced beneath the ledge. The sample is placed into a 1.5 mlpolypropylene microcentrifuge tube and capped. The drill thenmakes a clearing cut of another 1 mm, before moving the set
sampling interval distance to the next sample. This process iscontinued ad infinitum, until the length of coral desired hasbeen fully sampled. The sampling interval is varied, dependingon the growth rate of the coral, but a coral growing at 1.2 cmyr�1, and sampled every 0.25 mm will produce 48 samples peryear of coral growth or nearly weekly resolution.
3.2. Analytical Methods
For each Sr/Ca analysis, 80–150 �g of the milled powderedcoral is weighed and transferred to an acid-cleaned 1.5 mlpolypropylene microcentrifuge tube for wet chemical prepara-tion. The sample is dissolved in 0.775 ml of 0.5N HCl, and avolume equivalent to 4 �g Ca is pipetted into a clean 1 mlTeflon beaker containing 4–5 drops of mixed Ca–Sr isotopespike and 1–2 drops of dilute phosphoric acid. After evapora-tion of the solution to a small phosphoric acid “bead,” thesample is loaded without any further chemical separation ontoan outgassed Ta filament, oxidized at dull red heat in air, andloaded into the mass spectrometer. The isotope dilution analy-sis is conducted automatically in static mode on a FinniganMAT 261 mass spectrometer with 7 faraday cups, allowing Srand Ca to be analyzed sequentially, without needing to adjustthe cup settings.
Several spikes were used throughout the course of this study.The first 50 mm of the modern Myrmidon Reef coral (Myr-2)was analyzed with a 42Ca–43Ca–84Sr mixed spike preparedfrom standard inventory items from the Oak Ridge NationalLaboratory, Tennessee after removal of 86Sr from the 43Causing Sr spec.TM, a Sr-specific ion exchange EIChrom resin.Instrumental mass fractionation in the Ca analysis is correctedwith reference to the 42Ca–43Ca double spike, and mass frac-tionation in the Sr analysis with reference to the natural 86Sr/88Sr of 0.1194, both using a power law. This is the same spikeused by McCulloch et al. (1994); Alibert and McCulloch(1997); and Gagan et al. (1998). The remainder of Myr-2 andall of St-1 were analyzed using a 43Ca–84Sr mixed spike. Thisdiffers from the original in that 42Ca is omitted and the massfractionation correction is made relative to natural 42Ca/44Ca �0.31221 (Russell et al., 1978) using an exponential law. Mea-surements by Nelson and McCulloch (1989) on the RSES MAT261 yielded a very similar Ca isotope composition to Russell etal. (1978). Analytical precision is 2–3 times better with the43Ca–84Sr spike, mainly because the mass fractionation correc-tion is applied over two mass units, compared to a single massunit for the original spike.
Before routine analysis began, each spike is calibrated for itsisotope composition and concentration with respect to gravi-metric standard solutions. The primary laboratory standard isMIX-3, prepared from Johnson & Matthey Specpure CaCO3
and NBS-987 SrCO3 assay standard. The Sr/Ca ratio in MIX-3is 0.01827, similar to that in a typical coral. An independentlyprepared standard MIX-4, similar to MIX-3, confirms calibra-tions using MIX-3 to within 0.1%. The spikes are directlyloaded into the MAT 261 and their isotope compositions mea-sured. Instrumental mass fractionation in these direct measure-ments is assessed by also measuring mixtures of the spikes andthe MIX-3 gravimetric standard and back-calculating the end-member isotope compositions.
The spike concentrations are monitored at regular intervals
Fig. 2. A positive print of an X-radiograph of the Porites lutea coralMyr-2. The coral was sampled along the major growth axis, shown asA–B in the figure.
3267Sr/Ca in corals as a proxy for sea surface temperature

by measuring the gravimetric standard solution and other lab-oratory standards prepared from certain corals. Dilutions ofthese into 30 or 60 ml polypropylene bottles are available in thelaboratory for routine use. Throughout the present study astandard was usually measured during each mass spectrometeranalytical session.
4. RESULTS
4.1. Core Myr-2
The top 175 mm of core Myr-2 was analyzed for Sr/Ca usingID–TIMS. X-radiography of this coral shows well-defined an-nual growth bands with a prominent major growth axis at aslight angle to the core (Fig. 2). The X-radiography indicatesthat this particular head of Porites lutea has a growth rate of7.5–10.5 mm yr�1, although most of the coral has an averagerate of around 8.0 mm yr�1. A ledge was cut along theprominent growth axis shown in Figure 2, and the coral wasmilled at 0.25 mm intervals. At the rate of growth indicatedfrom the x-ray, it was considered that the resolution at thissampling interval would be better than fortnightly.
The results from some 300 individual Sr/Ca measurementsare shown in Figure 3. The Sr/Ca values for the top 2.5 mm ofthe coral (roughly equivalent to the thickness of the tissuelayer) show a lack of variation over that growth interval. It hasbeen noted previously that Sr/Ca ratios in the vicinity of thetissue layer can produce anomalous results. In several coralsfrom Davies Reef, Alibert and McCulloch (1997) report anom-alous Sr/Ca ratios in the tissue layer, which they attributed toremnants of organic material within this zone. However, whilethey recorded high Sr/Ca ratios at the top, the Sr/Ca ratios fromMyr-2 are uniformly low. The cores from both sites weresampled during the austral winter/spring, July at Myrmidon
Reef and October at Davies Reef. At this time of year, it wouldbe expected that the Sr/Ca ratio would be relatively high, so thelow Sr/Ca ratios in the top 2.5 mm at Myrmidon Reef aresomewhat difficult to explain. It could be that the Sr/Ca ratio ofthe organic material is highly variable, and capable of maskingskeletal Sr/Ca.
Elsewhere, the Sr/Ca results display an extremely good andfairly regular cyclical pattern, that has been shown previouslyto be an annual SST signal (e.g., Alibert and McCulloch, 1997).From the number of analyses per cycle, it is obvious that theresolution of the sampling is of the order of monthly, althoughmost data points are centered around the peaks and troughs ofthe curve, where the resolution is as high as fortnightly. Whileonly two samples were repeated, the reproducibility is consid-ered to be better than 0.25% (� 0.15 °C). From the distancebetween Sr/Ca maxima, the annual extension rate is shown tovary between 5–11 mm yr�1 over a period of 21 years, with anaverage extension rate of 7.7 mm yr�1. The highest annualextension rate occurs for the 3 years, between 75 and 105 mm(Fig. 3).
4.1.1. Calibration
In order to calibrate the Sr/Ca record against the instrumentalSST, the maxima and minima of the measured SST wereoverlain and matched with the Sr/Ca ratio. The resulting plot isshown in Figure 4. Here, the Sr/Ca record for the first 60 mmis matched against the weekly instrumental SST for MyrmidonReef for the period 1988–1997. The fit is particularly good,with general matching of both the amplitude and wavelength ofboth data sets. The Sr/Ca plot shows a lower temperatureresponse in the summer of 1994, which amounts to a variationof about 1 °C. We can find no obvious reason for this discrep-
Fig. 3. Plot of Sr/Ca vs distance for the top of the Porites lutea core Myr-2.
3268 J.F. Marshall and M.T. McCulloch

ancy; several repeat analyses of the Sr/Ca ratios on this part ofthe coral produced similar results, and comparison of the in situinstrumental SSTs with satellite SSTs did not show any differ-ence.
To derive the calibration equation, a Williamson regression,identical to that used by Alibert and McCulloch (1997), wascarried out for the time equivalent Sr/Ca ratio and instrumentalSST. A total of 112 out of 122 data points were analyzed; thosedata points omitted were from the mismatch in 1994. For theregression analysis, the Sr/Ca error was set at 0.000005 (2�)which is equivalent to �0.2 °C, while the error on the instru-mental SST is considered to be 0.1 °C. From the total numberof data points analyzed, a calibration equation of
Sr/Ca � 103 � 10.40 (�0.016) � 0.0575 (�0.0005) � T (2)
was derived. This is very close to the calibration calculated forDavies Reef (Alibert and McCulloch, 1997) of
Sr/Ca � 103 � 10.48 (�0.01) � 0.0615 (�0.0004) � T. (3)
4.1.2. Myrmidon Reef climatology
Using Eqn. 2 to convert the Sr/Ca ratio to SST and tying itto a common chronology with the instrumental SST, we can seea distinct temperature pattern for the past 24 years at MyrmidonReef (Fig. 5). The total SST variation from 1973 to 1996 isfrom 22.7 °C (winter of 1982) to 30.4 °C (summer of 1986–1987). The average summer SST maximum is 29.0 °C, whilethe average winter minimum is 23.8 °C (Fig. 5). The SSTpattern shown in Fig. 5 indicates a warming trend from 1973 to1987, followed by a cooling trend from 1987 to 1994, and a
possible warming trend in 1995–1996. Although the latterwarming trend is not that apparent in Figure 5, the instrumentaldata shows that this warming trend continued into 1998. Theearlier warming trend is reversed slightly in 1983–1984, withthe cool El Nino winter of 1982 being repeated in 1983 and1984, while the 1983–1984 summer is 1.2 °C cooler than thoseimmediately before and after (Fig. 5). Between 1973 and 1987the summer maximum SST increased by 1.7 °C, while thecorresponding winter minimum SST increased by 1.8 °C. Thisis somewhat greater than the 1.3 °C warming recorded atDavies Reef for the same period (Alibert and McCulloch,1997). Conversely, between 1987 and 1994 there is a 1.8 °Cand 2.4 °C cooling in summer and winter, respectively (Fig. 5).
One of the major consequences of this warming/coolingcycle is that between 1982 and 1991 the maximum summerSST exceeded the average value on 9 out of 10 occasions (Fig.5). During this period, the maximum SST reached or exceeded30 °C on four occasions. According to Lough (1999) thistemperature represents the threshold for coral bleaching in thisregion. In Fig. 5 the 30 °C threshold is 1 °C higher than theaverage summer maximum, a figure that is often used as aminimum condition for the onset of bleaching (Hoegh-Guld-berg, 1999). On the basis of temperature alone, one would haveexpected bleaching of the more susceptible Acropora and Po-cillopora species to have occurred definitely during the summerof 1986–1987, probably in 1982–1983 and 1984–1985, andpossibly in 1987–1988, but not in 1981–1982. This is exactlythe opposite of what happened, with no signs of bleaching atMyrmidon Reef during the 1986–1987 summer (Berkelmans,private communication, 2000), and no reports of bleaching in
Fig. 4. Best fit of Sr/Ca ratio for Myr-2 (black) with the instrumental SST (grey) for Myrmidon Reef.
3269Sr/Ca in corals as a proxy for sea surface temperature

the other years except for 1981–1982 (Berkelmans and Oliver,1999).
One of the major factors that can affect SST in the GBR isthe onset of an El Nino event. While the largest effect of the ElNino cycle is the variability in rainfall along the coastal regionof Queensland, there does tend to be a typical SST signalassociated with that phenomenon. According to Lough (1994),there are two components to the SST signal associated with ElNino. One is the cooler than average SST for the winter priorto the onset of El Nino, and the other is the warmer thanaverage SST during the following summer when the El Nino isfully active. It is considered that SSTs during La Nina yearsstay relatively warm during winter.
The major El Nino events during the period of growth ofMyr-2 occurred in 1976–1977, 1982–1983, 1986–1987, andthere was a prolonged El Nino event between 1991 and 1994.As with other corals analyzed by the Sr/Ca TIMS method in thecentral Great Barrier Reef [e.g., Pandora Reef (McCulloch etal., 1994) and Davies Reef (Alibert and McCulloch, 1997)],there is a distinct cooling in the winter of 1982 at MyrmidonReef associated with the intense El Nino event of 1982–1983(Fig. 5). At Myrmidon Reef the Sr/Ca derived SSTs show adrop of around 7 °C at the end of summer in 1982, comparedto the average summer–winter SST range of 5.5 °C, followedby an even larger rise from the winter of 1982 to the latesummer in 1983 (Fig. 5). However, apart from this extremeevent there does not appear to be the precise SST signal, asoutlined by Lough (1994), for the other El Nino events. The1976–1977 event shows neither unusual cooling nor warming;in fact, it shows the coolest summer for the whole period of thecoral record (Fig. 5). The 1986–1987 event is almost the exactopposite to the 1976–1977 event, with the warmest winter ofthe period followed by the warmest summer. The 1991–1992event shows winter cooling, but only moderate summer warm-ing (Fig. 5).
4.2. Core St-1
The top 75 mm of this Porites sp. was analyzed for Sr/Causing ID-TIMS to derive a calibration for a modern StanleyReef coral in order to calculate SST values for a mid-Holocenecoral from the same reef. X-radiographs of the coral showreasonably good annual banding, with the low density bandaccounting for about two-thirds of the annual width. The widthof the density banding suggests that the growth rate of this coralis of the order of 15–18 mm yr�1. Under fluorescent light, thecoral shows only one thin bright band for the entire core.Judging from the position of the band and the growth rate of thecoral, this appears to be the equivalent of the 1974 flood, whichis the largest on record for the Queensland coast.
A ledge was cut along the most prominent growth axis, andthe coral was milled at 0.25 mm intervals. At the rate of growthindicated from the x-ray, it was considered that the resolutionat this sampling interval would be better than weekly. A total of115 individual Sr/Ca measurements were carried out on thiscoral, producing a 4.5 year annual cycle, with estimated growthrates of 16.2 to 17.0 mm yr�1. The frequency of Sr/Ca analysesis better than fortnightly. While every second sample, in gen-eral, was analyzed, consecutive samples were analyzed for thepeaks and troughs.
4.2.1. Calibration
The Sr/Ca record was matched against the instrumental SSTfrom Davies Reef; the closest site with in situ temperaturerecording (Fig. 1). The instrumental data was reduced fromdaily to weekly to better match the Sr/Ca data. Because thestation at Davies Reef did not record SST data between 3October 1994 to 21 May 1996, it was only possible to match thetwo records from June 1996 to February 1999, with two smallbreaks of about one month during this period. This is about the
Fig. 5. Plot of the Myrmidon Reef Sr/Ca derived SST (°C) against time for the period 1973–1996.
3270 J.F. Marshall and M.T. McCulloch

same length of time against which the Davies 2 coral wascalibrated (Alibert and McCulloch, 1997). The resulting fit(Fig. 6) is very good, and both large-scale and fine-scale detailcan be seen to match in many parts of the curves.
A least squares regression analysis was carried out for thetime equivalent Sr/Ca ratio and instrumental SST, similar tothat used for Myr-2, with a total of 66 data points beinganalyzed. The error limits used were the same as for theMyrmidon Reef calibration. From the total number of datapoints, a calibration equation of
Sr/Ca � 103 � 10.40 (�0.018) � 0.0587 (�0.0005) � T (4)
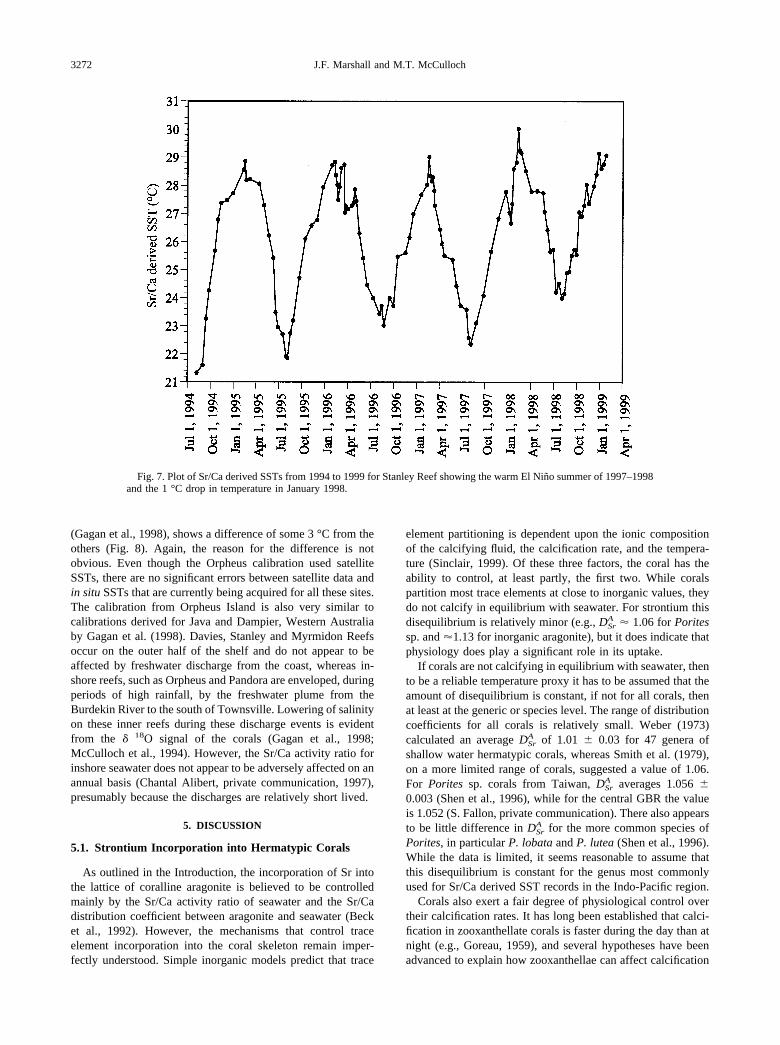
was derived.The calibrated SST plot is shown in Figure 7. While summer
SSTs reach 29 °C in the previous 3 years, during the summerof the 1997–1998 El Nino, temperatures reach 30 °C. It isnoteworthy that during the 1997 winter, SSTs were only mod-erately low, and the typical El Nino signal of cool winterfollowed by warm summer as outlined by Lough (1994) is notas apparent as during the 1982–1983 event. Of some note is the1 °C drop in temperature at the beginning of 1998 (Fig. 7). Asimilar drop over much of the GBR is present in the instru-mental data in early January of the same year, which Lough(1999) attributed to short-term cooling following the passage ofa tropical low that produced extensive flooding on the centralQueensland coast. This 1998 cooling event also appears in theSr/Ca record of a coral from Pandora Reef.
4.3. Comparison of Calibrations from the Central GBR
Including the results presented here for Myrmidon and Stan-ley Reefs, to date, six reefs in the central GBR off Townsvillehave provided Sr/Ca–SST records measured on cored Porites
sp. at one or several sites on each reef. These include PandoraReef (McCulloch et al., 1994) and Orpheus Island (Gagan etal., 1998) on the inner shelf (Fig. 1), and Davies and WheelerReefs on the mid-shelf (Alibert and McCulloch, 1997). It is theintention here to compare the TIMS-derived Sr/Ca–SST cali-brations for all these reefs; the SSTs for Wheeler Reef werederived using the Davies Reef calibration, and are not discussedfurther.
While the calibration for Davies Reef is that derived byAlibert and McCulloch (1997) from in situ instrumental data,the original paper on the Pandora Reef Sr/Ca record (i.e.,McCulloch et al., 1994) used the revised calibration of Beck etal. (1992) from New Caledonia and the Porites lobata calibra-tion of de Villiers et al. (1994) from Hawaii. Although thesummer SST values from these two calibrations are similar,they can diverge by more than 2 °C in the winter. Recently,Alibert et al. (1999) calibrated a modern Porites sp. headcollected at Pandora Reef in October 1998 against in situ SSTsmeasured at nearby Orpheus Reef. Their calibration of
Sr/Ca � 103 � 10.3 (�0.01) � 0.0542 (�0.0005) � T (5)
is similar to the revised calibration of Beck et al. (1992), butvery different from that of de Villiers et al. (1994). It is alsowithin the error limits of the Davies Reef (Alibert and McCul-loch, 1997) and the Myrmidon and Stanley Reef calibrations.
Five separate Sr/Ca–SST calibrations have now been derivedfor the central GBR (Fig. 8). Two of these (Davies and Myr-midon Reefs) are based on in situ SST measurements, two(Pandora and Stanley Reefs) are based on in situ SST measure-ments from nearby reefs, and one (Orpheus Island) is based onsatellite SST data. Four of the calibrations are within the errorlimits of each other, whereas one, that from Orpheus Island
Fig. 6. Comparison between Sr/Ca data from Stanley Reef (black) and the instrumental data from nearby Davies Reef(grey).
3271Sr/Ca in corals as a proxy for sea surface temperature
(Gagan et al., 1998), shows a difference of some 3 °C from theothers (Fig. 8). Again, the reason for the difference is notobvious. Even though the Orpheus calibration used satelliteSSTs, there are no significant errors between satellite data andin situ SSTs that are currently being acquired for all these sites.The calibration from Orpheus Island is also very similar tocalibrations derived for Java and Dampier, Western Australiaby Gagan et al. (1998). Davies, Stanley and Myrmidon Reefsoccur on the outer half of the shelf and do not appear to beaffected by freshwater discharge from the coast, whereas in-shore reefs, such as Orpheus and Pandora are enveloped, duringperiods of high rainfall, by the freshwater plume from theBurdekin River to the south of Townsville. Lowering of salinityon these inner reefs during these discharge events is evidentfrom the � 18O signal of the corals (Gagan et al., 1998;McCulloch et al., 1994). However, the Sr/Ca activity ratio forinshore seawater does not appear to be adversely affected on anannual basis (Chantal Alibert, private communication, 1997),presumably because the discharges are relatively short lived.
5. DISCUSSION
5.1. Strontium Incorporation into Hermatypic Corals
As outlined in the Introduction, the incorporation of Sr intothe lattice of coralline aragonite is believed to be controlledmainly by the Sr/Ca activity ratio of seawater and the Sr/Cadistribution coefficient between aragonite and seawater (Becket al., 1992). However, the mechanisms that control traceelement incorporation into the coral skeleton remain imper-fectly understood. Simple inorganic models predict that trace
element partitioning is dependent upon the ionic compositionof the calcifying fluid, the calcification rate, and the tempera-ture (Sinclair, 1999). Of these three factors, the coral has theability to control, at least partly, the first two. While coralspartition most trace elements at close to inorganic values, theydo not calcify in equilibrium with seawater. For strontium thisdisequilibrium is relatively minor (e.g., DSr
A 1.06 for Poritessp. and 1.13 for inorganic aragonite), but it does indicate thatphysiology does play a significant role in its uptake.
If corals are not calcifying in equilibrium with seawater, thento be a reliable temperature proxy it has to be assumed that theamount of disequilibrium is constant, if not for all corals, thenat least at the generic or species level. The range of distributioncoefficients for all corals is relatively small. Weber (1973)calculated an average DSr
A of 1.01 � 0.03 for 47 genera ofshallow water hermatypic corals, whereas Smith et al. (1979),on a more limited range of corals, suggested a value of 1.06.For Porites sp. corals from Taiwan, DSr
A averages 1.056 �0.003 (Shen et al., 1996), while for the central GBR the valueis 1.052 (S. Fallon, private communication). There also appearsto be little difference in DSr
A for the more common species ofPorites, in particular P. lobata and P. lutea (Shen et al., 1996).While the data is limited, it seems reasonable to assume thatthis disequilibrium is constant for the genus most commonlyused for Sr/Ca derived SST records in the Indo-Pacific region.
Corals also exert a fair degree of physiological control overtheir calcification rates. It has long been established that calci-fication in zooxanthellate corals is faster during the day than atnight (e.g., Goreau, 1959), and several hypotheses have beenadvanced to explain how zooxanthellae can affect calcification
Fig. 7. Plot of Sr/Ca derived SSTs from 1994 to 1999 for Stanley Reef showing the warm El Nino summer of 1997–1998and the 1 °C drop in temperature in January 1998.
3272 J.F. Marshall and M.T. McCulloch

(Johnston, 1980; Krishnaveni et al., 1989). It is thought that aspart of their symbiosis the zooxanthellae produce low molec-ular weight organic molecules that are readily metabolized bythe coral to generate energy and enhance calcification. Thezooxanthellae may also help the coral by removing wasteproducts, such as PO4
3�, SO42�, and NO3
� (Goreau, 1959), all ofwhich can have an inhibiting effect on calcification. It has alsobeen proposed that removal of CO2 by photosynthesis may alsoaid the calcification process (McConnaughey and Whelen,1997) by maintaining a neutral pH in the calcifying fluid. Onthe other hand, Marshall (1996) has suggested that, rather thanenhance day time calcification, zooxanthellae actually suppressnight time calcification.
The most serious objections to date regarding the reliabilityof the Sr/Ca method with regard to calcification rate have beenraised by de Villiers et al. (1994, 1995). Their results from aPavona clavus coral from the Galapagos Islands indicated thata change of annual extension rate from 6 to 12 mm yr�1
produced an apparent offset in SST of 1 °C–2 °C, with higherSr/Ca values associated with the slower extension rate. Theconclusion from this experiment was that variable extensionrates do affect the amount of Sr uptake by the coral. Similarly,Alibert and McCulloch (1997) conducted experiments wherethey measured Sr/Ca ratios along both the growth axis and offaxis. They found that off axis, the lack of space and lessoptimal conditions for growth result in small corallites andlower skeletal density, which shifted the Sr/Ca ratios by a
variable amount toward high values, corresponding to a tem-perature shift of �1 °C to �3 °C. Whether the apparenttemperature offset is caused by a real change in the Sr/Ca ratioin these off axis situations or by an overlap of corallites thathave grown at different times of the year is hard to discern.However, it seems that the only way to overcome this disparityis to sample exclusively along the major growth axis. Becausethey did not do so, as indicated in Figure 11 of de Villiers et al.(1994), appears to invalidate the de Villiers et al. (1994, 1995)argument regarding calcification rate. As pointed out earlier,subsequent work by Shen et al. (1996) and Alibert and McCul-loch (1997) has shown a lack of change in Sr/Ca as a result ofchanges in calcification rate.
While there does appear to be an obvious physiologicalcontrol on the uptake of Sr into the lattice of coralline arago-nite, and that corals are not calcifying in equilibrium withseawater, the above arguments would suggest that, providedonly a single genus such as Porites sp. is used and that the coralis sampled along a major vertical growth axis, the Sr/Ca ratioshould vary uniformly with the remaining variable—tempera-ture.
5.2. The Constancy of the Sr/Ca Activity Ratio ofSeawater
Both the spatial and temporal constancy of the Sr/Ca contentof seawater is seen as a necessary requisite to the reliability of
Fig. 8. Sr/Ca vs SST calibrations derived from the central GBR.
3273Sr/Ca in corals as a proxy for sea surface temperature

the Sr/Ca technique as a proxy for both modern and palaeoSSTs. It has been pointed out previously that there is a spatialdifference in Sr/Ca in modern seawater of 2–3% globally, withthe deep ocean more enriched relative to the surface (de Villi-ers, 1999). Although this variability is very small, it doesequate to an uncertainty of 2 °C–3 °C for Sr/Ca derived SSTmeasurements. However, the Sr/Ca proxy in corals necessitatesthat records can only be obtained in the tropics, in seawater thatis normally oligotrophic and is not usually susceptible to con-stant or intense upwelling. In such waters the average Sr/Caseawater value is considered to be 8.5 � 0.1 mmol mol�1 (deVilliers et al., 1994), and reported Sr/Caseawater measurementsin coral reef areas only vary between 8.464 and 8.551 mmolmol�1 (Alibert and McCulloch, 1997; Beck et al., 1992; Shenet al., 1996). If the somewhat higher values of Shen et al.(1996) are ignored (this is a coastal site where the corals aregrowing in the water intake pond to a nuclear power plant), thisconverts to a temperature difference of 0.8 °C. On a regionalbasis, the difference between Sr/Caseawater for Davies and Myr-midon Reefs in the central GBR (Alibert and McCulloch, 1997)equates to a temperature difference of 0.42 °C. So while thereare variations in Sr/Caseawater that produce a temperature dif-ference of 2 °C–3 °C on a global basis, in most coral reef areasthe difference is much smaller, and is within the error limits ofthe ID–TIMS method.
Of greater consequence for the use of the Sr/Ca thermometerin palaeoceanographic research is the apparent 1–2% change inSr/Caseawater as a result of Sr release from shelf carbonatesduring low sea level events (Stoll and Schrag, 1998). Thisincrease has the ability to produce a negative shift of 2 °C–3 °C, which would account for the extremely low tropical SSTsreported by the Sr/Ca method during the LGM and ensuingtransgression (Beck et al., 1997; Guilderson et al., 1994),compared to other methods (e.g., Bard et al., 1997; Crowley,2000; Curry and Oppo, 1997) which indicate a relatively mildertropical cooling during the LGM.
While the Stoll and Schrag (1998) model accounts for theloss of Sr from shelf carbonates during low sea levels, it failsto predict the long term cumulative effects of adding additionalSr to the ocean during repeated glacial cycles. In relation to theshelf carbonates, the amount of Sr that is added to the oceanduring each glacial event is not matched by an equivalent inputof Ca; the latter is immobilized as the stable polymorph ofCaCO3, low-Mg calcite. Consequently, the removal of Ca fromseawater during the ensuing interglacial, in the form of shelfaragonite deposits, will leave an excess of Sr in the oceanbecause the distribution coefficient (DSr
A ) for corals and Hal-imeda will maintain the removal of Sr and Ca at a constant rate,meaning that the excess Sr that was added to the ocean duringthe glacial will not be removed. Over successive glacial/inter-glacial events this would result in an incremental increase in theSr/Ca activity ratio of seawater. This does not appear to be thesituation, however, because reported Sr/Ca ratios for the lastinterglacial corals from areas such as the Huon Peninsula andWestern Australia are similar to modern values (McCullochand Esat, 2000; McCulloch et al., 1999). This suggests thatthere is some other mechanism for removing the excess Srduring the deglaciation. One possibility is an increase in dis-solution of deep-sea carbonate sediments at this time, addingexcess Ca and lowering Sr/Caseawater (Hodell et al., 2001).
However, both the model results of Stoll and Schrag (1998) andthe foraminiferal Sr/Ca ratios (Martin et al., 1999; Stoll et al.,1999) do indicate that Sr/Caseawater can change by severalpercent during glacial/interglacial events. On this basis it can beargued that Sr/Ca derived SSTs for the LGM may be overes-timated.
5.3. Corals Under Stress—Do they Obey the Rules?
Radiochemical studies (Ip and Krishnaveni, 1991) havefound that the incorporation of 90Sr into the coral skeleton islinearly dependent on the Sr concentration and is not affectedby inhibitors such as potassium cyanide (KCN), darkness or thephotosynthetic inhibitor 3-(3,4-dichlorophenyl)-1,1-dimethyl-urea (DCMU), whereas the Ca concentration becomes quicklysaturated and is inhibited by all of the above. This suggests thatsome or all Ca ions are transported through the coral tissue tothe calcifying site by a different pathway than Sr ions (Ip andKrishnaveni, 1991; Ip and Lim, 1991). Under normal condi-tions this would mean that the Sr/Ca ratio in the calcifying fluidwould be lower than inorganic aragonite. However, Sinclair(1999) has proposed that if temperature conditions becomemore extreme, the enzymes that transport Ca ions would be-come less efficient, resulting in a lowering of the active Ca2�
transport and a decreasing calcification rate. Because Sr is notaffected to the same degree, it would be possible for the Sr/Caratio to shift upwards towards inorganic values.
Sr/Ca derived SSTs for a coral from Pandora Reef in thecentral GBR (McCulloch et al., 1994) show an extreme coolingof about 3.5 °C during the El Nino winter of 1982 compared toother minimum temperatures during previous and subsequentyears. However, in comparison to the Sr/Ca derived SSTs, shipand satellite data recorded a negative SST anomaly of only2 °C. At the time it was considered by McCulloch et al. (1994)that the exceptionally cold temperatures of the 1982 winter ledto a breakdown of the biological control on Sr/Ca fractionation,and the coral system moved more towards inorganic fraction-ation. While this conclusion has remained largely unsupported,new and more convincing evidence is provided for a shift in theSr/Ca ratio, this time at high temperatures, from another coralfrom Pandora Reef (Fig. 9). This Porites sp. was sampled soonafter the 1998 bleaching event when 87% of the inshore reefsof the GBR were affected (Berkelmans and Oliver, 1999). Thisparticular coral shows that during 1997, Sr/Ca ratios declinedsteadily into the summer of 1997–1998 as the El Nino tookeffect. This trend was slightly reversed in early January 1998when a tropical low entered the area, and depressed tempera-tures momentarily. Subsequently, the Sr/Ca ratio fell to a lowof 8.62 mmol mol�1 as the SST rose to 30.5 °C by earlyFebruary, but had risen rapidly to 9.13 mmol mol�1 (equivalentto 21.6 °C) by the beginning of March, after which no growthwas recorded (Fig. 9).
The Sr/Ca-temperature record indicates that this particularcoral was subjected to temperatures of nearly 32 °C, some 2 °Chigher than the normal bleaching threshold, and warm enoughto affect even a more resistant coral such as Porites. Theimplication here is that once the coral becomes thermallystressed there is inhibition of the Ca transport enzyme (Ca2�
ATPase) to some extent, whereas Sr continues to be transportedinto the calcifying fluid at the normal concentration. The Sr/Ca
3274 J.F. Marshall and M.T. McCulloch

ratio does not appear to be affected until a particular tempera-ture threshold is reached. However, once bleaching is under-way, the coral rapidly records an increase in the Sr/Ca ratio asrelatively less Ca is made available to the calcifying fluid.Within a month the system has completely broken down andthe coral stops calcifying.
The control that physiology and/or environment may haveover the differences in transport behavior of Ca and Sr men-tioned above may also be affected by variables other thanextreme temperatures. According to Sinclair (1999), “ if Ca2�
transport is energy dependent, but Sr2� transport is not, thenanything that influences the energy budget of the coral willresult in a change in the relative rates at which the two ions aretransported to the calcifying fluid.” This could include varia-tions in such parameters as light intensity and nutrients. In astudy of a coral from Christmas Island in the eastern IndianOcean (Marshall, 2000), it was considered that either a de-crease in light intensity (as a result of increased macroalgalproduction) and/or an increase in nutrients might have affectedthe Sr/Ca ratio because the coral was growing in the samelocation as a phosphate loading terminal. The stress generatedby either could have been enough to affect the transport be-havior of Sr and Ca, resulting in an upward shift in the Sr/Caratio and hence lower apparent SSTs. In contrast, several coralsfrom nearby Cocos (Keeling) Atoll appear to have experiencedstress that resulted in only partial breakdown in the transportbehavior of Sr and Ca, although it is obvious that periodicallythe situation has been serious enough to bring about a completehalt to calcification (Marshall, 2000). The reports of fish killsand coral mortality, seen from time to time in the lagoon,appear to be a result of algal blooms (Woodroffe and Berry,1994). The corals sampled at Cocos are all exposed to open
water, so the stresses so evident in the lagoon might only bepartially affecting them. However, it is quite clear that coralsunder stress do not obey the rules.
5.4. Differences in Sr/Ca–SST Calibrations and PotentialCauses
One of the most contentious issues of using the Sr/Ca ratio incorals as a proxy for SST has been the calibration of the Sr/Caratio with measured SST. If the Sr/Ca ratio of seawater and theSr/Ca distribution coefficient between aragonite and seawaterare sufficiently constant to be within the error limits of theTIMS method, then it could reasonably be expected that onecalibration would suffice for all Porites sp. Unfortunately, justabout every study of the Sr/Ca proxy for modern corals pub-lished so far using TIMS has produced a different calibration(Fig. 10). The spread in the calibrations equates to temperaturedifferences of up to 4 °C to 6 °C for the normal range of Sr/Caratios.
What is apparent in Figure 10, and the list of calibrationsshown in Table 1, is that, with several exceptions, the slope ofthe calibration equation is similar, whereas the intercepts arenot. This not only applies to TIMS-derived calibrations, but toothers that have used techniques such as ICP–MS, ICP–AES,and HR–ICP–MS by solution, and LA–ICP–MS [e.g., Crowleyet al. (1999); Fallon et al. (1999); Schrag, (1999); Correge et al.(2000)]. On this basis, it can be argued that calibrations by deVilliers et al. (1994) and Shen et al. (1996) are incorrectbecause their slope is either higher or lower than the rest (Fig.10).
Some of the calibrations shown in Table 1 can be dismissedas not being precise enough, either with respect to the Sr/Ca
Fig. 9. Plot of Pandora Reef Sr/Ca ratio (black) against instrumental SST record from nearby Orpheus Island (grey) forthe period July 1996 to November 1998 showing the effects of bleaching on the Sr/Ca ratio in February/March 1998.
3275Sr/Ca in corals as a proxy for sea surface temperature
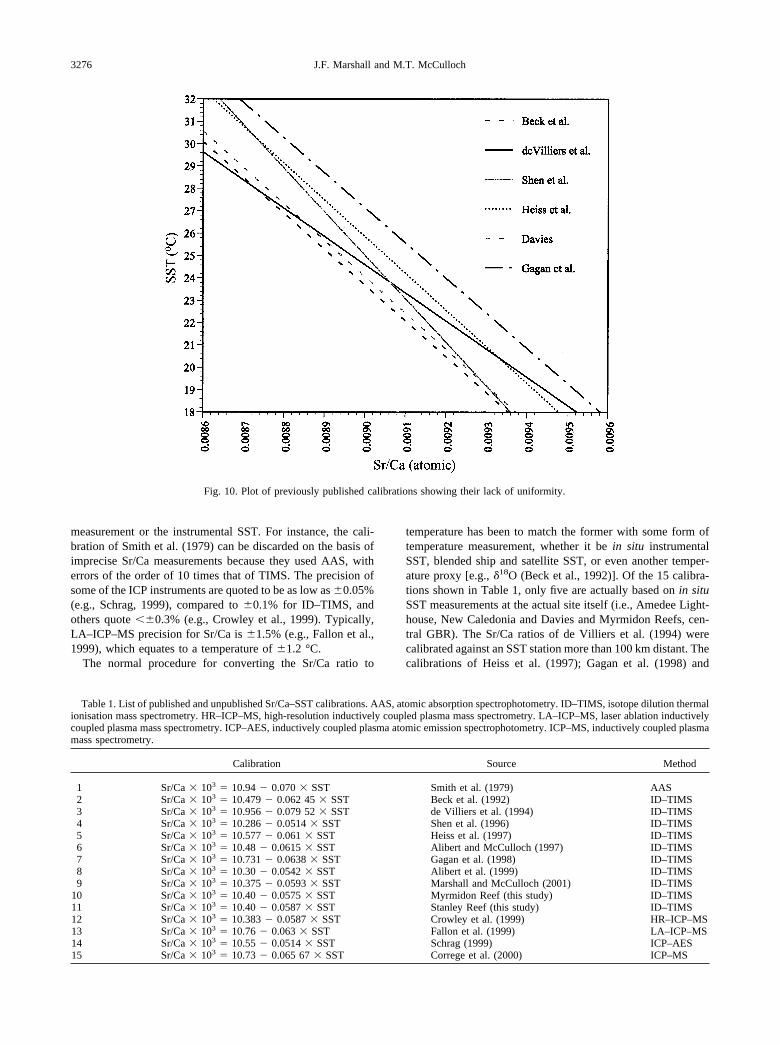
measurement or the instrumental SST. For instance, the cali-bration of Smith et al. (1979) can be discarded on the basis ofimprecise Sr/Ca measurements because they used AAS, witherrors of the order of 10 times that of TIMS. The precision ofsome of the ICP instruments are quoted to be as low as �0.05%(e.g., Schrag, 1999), compared to �0.1% for ID–TIMS, andothers quote ��0.3% (e.g., Crowley et al., 1999). Typically,LA–ICP–MS precision for Sr/Ca is �1.5% (e.g., Fallon et al.,1999), which equates to a temperature of �1.2 °C.
The normal procedure for converting the Sr/Ca ratio to
temperature has been to match the former with some form oftemperature measurement, whether it be in situ instrumentalSST, blended ship and satellite SST, or even another temper-ature proxy [e.g., �18O (Beck et al., 1992)]. Of the 15 calibra-tions shown in Table 1, only five are actually based on in situSST measurements at the actual site itself (i.e., Amedee Light-house, New Caledonia and Davies and Myrmidon Reefs, cen-tral GBR). The Sr/Ca ratios of de Villiers et al. (1994) werecalibrated against an SST station more than 100 km distant. Thecalibrations of Heiss et al. (1997); Gagan et al. (1998) and
Fig. 10. Plot of previously published calibrations showing their lack of uniformity.
Table 1. List of published and unpublished Sr/Ca–SST calibrations. AAS, atomic absorption spectrophotometry. ID–TIMS, isotope dilution thermalionisation mass spectrometry. HR–ICP–MS, high-resolution inductively coupled plasma mass spectrometry. LA–ICP–MS, laser ablation inductivelycoupled plasma mass spectrometry. ICP–AES, inductively coupled plasma atomic emission spectrophotometry. ICP–MS, inductively coupled plasmamass spectrometry.
Calibration Source Method
1 Sr/Ca � 103 � 10.94 � 0.070 � SST Smith et al. (1979) AAS2 Sr/Ca � 103 � 10.479 � 0.062 45 � SST Beck et al. (1992) ID–TIMS3 Sr/Ca � 103 � 10.956 � 0.079 52 � SST de Villiers et al. (1994) ID–TIMS4 Sr/Ca � 103 � 10.286 � 0.0514 � SST Shen et al. (1996) ID–TIMS5 Sr/Ca � 103 � 10.577 � 0.061 � SST Heiss et al. (1997) ID–TIMS6 Sr/Ca � 103 � 10.48 � 0.0615 � SST Alibert and McCulloch (1997) ID–TIMS7 Sr/Ca � 103 � 10.731 � 0.0638 � SST Gagan et al. (1998) ID–TIMS8 Sr/Ca � 103 � 10.30 � 0.0542 � SST Alibert et al. (1999) ID–TIMS9 Sr/Ca � 103 � 10.375 � 0.0593 � SST Marshall and McCulloch (2001) ID–TIMS
10 Sr/Ca � 103 � 10.40 � 0.0575 � SST Myrmidon Reef (this study) ID–TIMS11 Sr/Ca � 103 � 10.40 � 0.0587 � SST Stanley Reef (this study) ID–TIMS12 Sr/Ca � 103 � 10.383 � 0.0587 � SST Crowley et al. (1999) HR–ICP–MS13 Sr/Ca � 103 � 10.76 � 0.063 � SST Fallon et al. (1999) LA–ICP–MS14 Sr/Ca � 103 � 10.55 � 0.0514 � SST Schrag (1999) ICP–AES15 Sr/Ca � 103 � 10.73 � 0.065 67 � SST Correge et al. (2000) ICP–MS
3276 J.F. Marshall and M.T. McCulloch

Christmas Island (Marshall and McCulloch, 2001) were de-rived from blended ship and satellite data. While this may notbe as accurate as in situ measurements on the reefs, it doesseem to have some veracity. However, the 1° � 1° spatialsmoothing does mean that relatively small scale, but significantanomalies, such as related to upwelling as seen at ChristmasIsland or narrow boundary currents as at Myrmidon Reef, areseldom measured with sufficient accuracy. Notwithstandingthese problems, Gagan et al. (1998) were able to derive cali-brations from three widely spaced sites that were in very goodagreement with each other.
One potential method of checking a calibration is to plot theslope of the calibration equation against the intercept. (Thisidea, communicated to us by both Dan Schrag and Tom Guil-derson, is attributed to Harry Elderfield). Figure 11 shows aplot of the 15 calibrations listed in Table 1 together with theseawater value. A linear best fit of the data shows most cali-brations lying along the line or within the error limits of thecalibration, with only two of the calibrations, that of de Villierset al. (1994) and Schrag (1999), offset. The reason for thislinear spread in the calibrations, and its tie-in with the seawatervalue is not immediately clear. The implication is that coralsfrom different localities around the world are responding totheir own particular environment or that certain types of envi-ronment exert a control on the corals’ physiology.
5.5. Does Coral Size (Age) Matter?
It was mentioned previously that separate calibrations werederived for five Porites sp. from Davies Reef (Alibert andMcCulloch, 1997), and that within the error limits three corals
(Davies 2, 8, 11) produced similar calibrations (�0.5 °C),whereas two others (Davies 3 and Davies A) showed errors ofup to �1.5 °C. In fact, there is a greater spread in the calibra-tions for the five Davies Reef corals than there is for thecombined calibrations for Davies, Pandora, Stanley, and Myr-midon Reefs (Fig. 8). At Davies Reef both Davies 3 and DaviesA are small heads. A similar situation is apparent for Holocenecorals from Myrmidon and Stanley Reefs (Marshall et al., 2002submitted). These produce results that are not in agreementwith each other, indicating that the calibration derived from themodern coral is not appropriate to some (or all?) of them. Fromthe core logs it is obvious that these are small heads, probablyno longer than 20 cm. The suggestion here is that youngercorals produce calibrations that are less reliable than larger,older heads, but why?
At this stage there is no obvious reason, but some insightmight be derived from stable isotopes. In a study by Gagan etal. (1996) on supposed enrichment of 13C during spawning events,the small, 15 year old head of Porites lobata from Ningaloo Reefshows no annual � 13C variation for some 6 years, and, when itdoes so, it is out of phase with the � 18O signal. This contrastswith the top of the larger, 300 year old colony from PandoraReef, where both the � 13C and � 18O produce an in phaseannual signal. The inference here is that immature or juvenilecoral heads are somehow physiologically different from theirmore mature counterparts, and this is reflected in their intake oftrace elements and isotopes. While this is highly conjectural atthis stage, it needs to be confirmed by measuring both stableisotopes and Sr/Ca ratios on a suite of small and large headswhich have grown preferably side by side.
Fig. 11. Plot of calibration slope against intercept for all calibrations listed in Table 1 (SW � seawater value).
3277Sr/Ca in corals as a proxy for sea surface temperature

The reason for suspecting the size (age) of the Porites sp. isthat, while in many papers the size of the coral is not men-tioned, there is a distinct suspicion that the heads are small andwere collected by hand rather than by drilling. In most casesonly 1 to 6 years of growth is analyzed. It is significant that ofthe most seminal and/or critical papers on the Sr/Ca method(i.e., Beck et al., 1992; de Villiers et al., 1994, 1995; McCul-loch et al., 1994; Shen et al., 1996), only one (Alibert andMcCulloch, 1997) refers to the size of the coral heads, althoughthe coral from Pandora Reef measured by McCulloch et al.(1994) is the same 300 year old head measured by Gagan et al.(1996). From this it can be surmized that the lack of agreementfor some calibrations (Fig. 10), compared say to the excellentagreement for the central GBR (Fig. 8), where only large heads(�25 years) were cored, is due to the size of the coral. Again,this concept awaits to be tested.
5.6. The Sr/Ca Ratio in Corals as an AccuratePalaeothermometer
While the calibration issue can be seen as a major drawbackto the use of the Sr/Ca ratio in corals as a proxy for SST, it hasbeen the estimation of palaeotemperatures using the Sr/Camethod that has perhaps engendered most discussion frompalaeoceanographers. In particular, it has been the estimation ofpalaeo SSTs for the LGM and deglaciation that has raised themost controversy. As discussed earlier, Sr/Ca-based palaeotem-perature estimates of corals indicate that tropical SSTs in theAtlantic Ocean during the LGM were some 5 °C–6 °C coolerthan today (Guilderson et al., 1994), and that SSTs rose some6 °C during the deglaciation phase between 8–14 kyr in thesouth western Pacific Ocean (Beck et al., 1997; Gagan et al.,2000). These results are at odds with a variety of palaeoceano-graphic techniques.
In a recent paper, Crowley (2000) argues that a decrease inSST in the tropics of �5 °C during the LGM would indicatethat climate sensitivity is relatively high; in which case adoubling of CO2 in the atmosphere by the next century wouldlead to a temperature increase of the order of 4.5 °C. WhileCrowley (2000) takes to task other cool SST estimates for theLGM, such as those based on tropical snowlines and ground-water estimates, he refutes coral palaeotemperature-based esti-mates on the grounds that the calibrations should be derivedfrom a regional gridded field, and must be validated againstearly 20th century instrumental records. While these may beseen as relatively minor issues compared to those mentionedabove, it only applies to � 18O/SST calibrations and not nec-essarily to Sr/Ca-based SST estimates (Crowley et al., 1999).With regard to trace element incorporation into corals, Crowley(2000) maintains that if the SST was some 5 °C cooler, thencorals during the LGM would be living under stressed condi-tions. As seen in the earlier part of the discussion, stress,particularly in the form of high and low SSTs, does result in anincrease in the Sr/Ca ratio that can produce anomalously coolertemperatures.
On the other hand, if SSTs were cooler by 5 °C, all but a fewof the present-day coral reefs of the world would not survive.Crowley (2000; Fig. 5) attempted to show this, suggesting thatfor 95% of present-day coral reef sites it would be too cold.While he was trying to show that corals could not exist at
�5 °C lower than present, but could at �2.5 °C, there is,indeed, very little evidence to suggest that coral reefs diddevelop during the LGM. The only site documented in anydetail is Barbados (Fairbanks, 1989). One has to take intoaccount that sea level was some 120 m lower than present,meaning that many LGM coral reefs would have had to estab-lish themselves on the steep slopes of atolls or on the uppercontinental slope. While other factors, such as lack of substrate,increased sedimentation, etc., may have been deleterious to reefgrowth, it would be expected that LGM reefs would havegrown in most parts of the tropics if SSTs dropped only by 2°C–3 °C. This does not appear to be the case. Other areas wherelate Pleistocene/early Holocene (ca. 10 000 year old) reefs havebeen drilled, such as New Guinea and Vanuatu, would also beable to support reef growth at �5 °C, according to Crowley’s(2000; Fig. 5) estimation. It is ironic that here too the Sr/CaSST estimate is also �5 °C cooler than present.
So while there are pertinent arguments to suggest that Sr/Caderived SSTs for LGM corals are overestimated because ofchanges to the Sr/Ca ratio of seawater or as a result of thermalstress, the almost total lack of coral reefs, except for a few areasin the tropics, indicates that it was too cold for them to developduring the LGM. In other words, by turning Crowley’s (2000)argument around, if SSTs in the tropics were �5 °C relative topresent, then only 5% of coral reefs would survive. This doesappear to have been the situation during the LGM.
6. CONCLUSIONS
Although the precise determination of the Sr/Ca ratio incorals provides a potent tool for measuring SSTs in bothmodern and fossil corals, serious doubts have been raised as toits reliability. Much of this stems from the fact that corals arenot calcifying in equilibrium with seawater. While corals do notcalcify exactly in equilibrium with seawater, their distributioncoefficient is sufficiently close, and this disequilibrium appearsto be constant at the generic level. It has also been establishedthat corals, through their symbiotic zooxanthellae, can exert afair degree of physiological control over their calcification rate.While some objection has been raised regarding the reliabilityof the Sr/Ca method with regard to calcification rate (e.g., deVilliers et al., 1994, 1995), much of this can be discarded dueto poor sampling techniques. Notwithstanding the obviousphysiological control on the uptake of Sr into the lattice ofcoralline aragonite, it is suggested that, provided only a singlegenus or species is used, and that sampling occurs along amajor vertical growth axis, then the Sr/Ca ratio should varyuniformly with temperature. The fact that most of the world’scoral reefs occur in low productivity areas would appear toreduce the variability of Sr/Caseawater to less than �0.4 °C; wellwithin the error limits of ID–TIMS or ICP–AES. At the tem-poral level, the modelled loss of Sr from shelf carbonatesduring low sea levels fails to predict the long term effects ofadding additional Sr to the ocean during every glacial event.This would lead to an increase in Sr/Caseawater over successiveglacial periods, but last interglacial corals show no such in-crease, suggesting that other mechanisms, such as carbonatedissolution during each deglaciation, may be important inmaintaining relatively constant Sr/Ca ratios.
Evidence from several corals in this study suggests that
3278 J.F. Marshall and M.T. McCulloch

stress may be a major cause in the breakdown in the Sr/Ca–SSTrelationship. Thermal stress, resulting from either extremelywarm or cool temperatures, is considered to lead to a reductionin Ca2� transport to the calcifying fluid, whereas Sr does notappear to be similarly affected, and an upward shift in the Sr/Caratio occurs. Evidence from Pandora Reef in the central GBRshows that both excess (bleaching) and extremely cool(�18 °C) temperatures produce anomalously low Sr/Ca de-rived SSTs as a result of this breakdown of the biologicalcontrol on Sr/Ca fractionation. It is considered that otherstresses, such as increased nutrients and changes in light inten-sity, can also lead to a breakdown in the Sr/Ca–SST relation-ship.
This study suggests that while some of the previously pub-lished calibrations can be dismissed on the basis of inaccuraciesin the Sr/Ca and SST measurements, there still appears to besufficient evidence to suggest that the Sr/Ca–SST calibration isnot constant. While many calibrations appear to be based onmeasurements from small (young) coral heads, the central GBRcalibrations are based on cores of large (old) heads, and theseseem to give the most reliable results. The fact that tropicalLGM palaeotemperature estimates using the Sr/Ca method are2 °C–3 °C cooler than other climate proxies is a cause forserious concern. However, it is argued here that the overall lackof evidence for reef growth during the LGM suggests that SSTswere too cold in most parts of the tropics for reefs to develop.This would lend support to the idea that tropical SSTs weremuch cooler than that proposed by CLIMAP data. Those ar-guments which suggests that Sr/Ca derived SSTs for LGMcorals are overestimated because of changes to the Sr/Ca ratioof seawater or as a result of thermal stress need to be evaluatedin more detail.
Acknowledgments—We thank Daryl Burrows and Stewart Fallon fortheir assistance with the coral coring. Graham Mortimer gave advice onmany aspects of the chemistry and mass spectrometry. Chantal Alibertprovided unpublished results on Sr/Ca measurements of seawater fromthe GBR and performed the Sr/Ca analyses from Pandora Reef. DarylBurrows carried out the original Sr/Ca analyses from the top part of theMyrmidon Reef coral. We thank Dan Schrag, associate editor RobertByrne and two anonymous referees for their constructive criticism ofthe paper.
Associate editor: R. H. Byrne
REFERENCES
Alibert C., Fallon S. J., McCulloch M. T., Kinsley L., and BerkelmansR. (1999) Fine-scale chronology of major flood plumes from theBurdekin River as deduced from coupled Sr/Ca (TIMS) and Ba(LA–ICP–MS) measurements in a coral from the inner shelf of GBR.Research School of Earth Science Annual Report. pp. 127–129.Australian National University.
Alibert C. and McCulloch M. T. (1997) Strontium/calcium ratios inmodern Porites corals from the Great Barrier Reef as a proxy for seasurface temperature: Calibration of the thermometer and monitoringof ENSO. Paleoceanography 12, 345–363.
Andrews J. C. and Gentian P. (1982) Upwelling as a source of nutrientsfor the Great Barrier Reef ecosystem: a solution to Darwin’s ques-tion? Mar. Ecol. Prog. Ser. 8, 257–269.
Bard E., Rostek F., and Sonzogni C. (1997) Interhemispheric syn-chrony of the last deglaciation inferred from alkenone palaeother-mometry. Nature 385, 707–710.
Bathurst R. G. C. (1976) Carbonate Sediments and their Diagenesis.Elsevier.
Beck J. W. (1994) Science 264, 891.Beck J. W., Edwards R. L., Emi I., Taylor F. W., Recy J., Rougerie F.,
Joannot P., and Henin C. (1992) Sea-surface temperature from coralskeletal strontium/calcium ratios. Science 257, 644–647.
Beck J. W., Recy J., Taylor F., Edwards R. L., and Cabioch G. (1997)Abrupt changes in early Holocene tropical sea surface temperaturederived from coral records. Nature 385, 705–707.
Berkelmans R. and Oliver J. K. (1999) Large-scale bleaching of coralson the Great Barrier Reef. Coral Reefs 18, 55–60.
Bernstein R. E., Betzer P. R., Feely R. A., Byrne R. H., Lamb M. F.,and Michaels A. F. (1987) Acantharian fluxes and strontium tochlorinity ratios in the North Pacific Ocean. Science 237, 1490–1494.
Brass G. W. and Turekian K. K. (1974) Strontium distribution inGEOSECS oceanic profiles. Earth Planet. Sci. Lett. 23, 141–148.
Broecker W. S. Peng T. H. (1982) Tracers in the Sea. Lamont-DohertyGeological Observatory.
Cane M. A. Zebiak S. E. Xue Y. (1995) Model studies of the long-termbehavior of ENSO. In Natural Climate Variability on Decade-to-Century Time Scales (ed. D. G. Martinson, K. Bryan, M. Ghil, M. M.Hall, T. R. Karl, E. S. Sarachik, S. Sorooshian, and L. D. Talley), pp.442–457. National Academy Press.
Correge T., Delcroix T., Recy J., Beck W., Cabioch G., and CornecF. L. (2000) Evidence of stronger El Nino-Southern Oscillation(ENSO) events in a mid-Holocene massive coral. Paleoceanography15, 465–470.
Crowley T. J. (2000) CLIMAP SSTs re-visited. Climate Dynamics 16,241–255.
Crowley T. J., Quinn T. M., and Hyde W. T. (1999) Validation of coraltemperature calibrations. Paleoceanography 14, 605–615.
Curry W. B. and Oppo D. W. (1997) Synchronous, high-frequencyoscillations in tropical sea surface temperatures and North AtlanticDeep Water production during the last glacial cycle. Paleoceanog-raphy 12, 1–14.
de Villiers S. (1999) Seawater strontium and Sr/Ca variability in theAtlantic and Pacific oceans. Earth Planet. Sci. Lett. 171, 623–634.
de Villiers S., Nelson B. K., and Chivas A. R. (1995) Biologicalcontrols on coral Sr/Ca and �18O reconstructions of sea surfacetemperatures. Science 269, 1247–1249.
de Villiers S., Shen G. T., and Nelson B. K. (1994) The Sr/Ca-temperature relationship in coralline aragonite: Influence of variabil-ity in (Sr/Ca)seawater and skeletal growth parameters. Geochim. Cos-mochim. Acta 58, 197–208.
Fairbanks R. (1989) A 17,000-year glacio-eustatic sea level record:influence of glacial melting rates on the Younger Dryas event anddeep-ocean circulation. Nature 342, 637–642.
Fallon S. J., McCulloch M. T., van Woesik R., and Sinclair D. J. (1999)Corals at their latitudinal limits: laser ablation trace element system-atics in Porites from Shirigai Bay, Japan. Earth Planet. Sci. Lett.172, 221–238.
Gagan M. K., Ayliffe L. K., Beck J. W., Cole J. E., Druffel E. R. M.,Dunbar R. B., and Schrag D. P. (2000) New views of tropicalpaleoclimates from corals. Quart. Sci. Rev. 19, 45–64.
Gagan M. K., Ayliffe L. K., Hopley D., Cali J. A., Mortimer G. E.,Chappell J., McCulloch M. T., and Head M. J. (1998) Temperatureand surface-ocean water balance of the mid-Holocene tropical west-ern Pacific. Science 279, 1014–1018.
Gagan M. K., Chivas A. R., and Isdale P. J. (1996) Timing coral-basedclimatic histories using 13C enrichments driven by synchronizedspawning. Geology 24, 1009–1012.
Goreau T. F. (1959) The physiology of skeleton formation in corals. I.A method for measuring the rate of calcium deposition by coralsunder different conditions. Biol. Bull. 116, 59–75.
Guilderson T. P., Fairbanks R. G., and Rubenstone J. L. (1994) Trop-ical temperature variations since 20,000 years ago; Modulating in-terhemispheric climate change. Science 263, 663–665.
Heiss G. A., Camoin G. F., Eisenhauer A., Dullo W.-C., Hansen B.(1997) Stable isotope and Sr/Ca-signals in corals from the IndianOcean. Proceedings of the 8th International Coral Reef Symposium.Panama, Vol. 12, pp. 1713–1718.
Hodell D. A., Charles C. D., and Sierro F. J. (2001) Late Pleistoceneevolution of the ocean’s carbonate system. Earth Planet. Sci. Lett.192, 109–124.
3279Sr/Ca in corals as a proxy for sea surface temperature

Hoegh-Guldberg O. (1999) Climate change, coral bleaching and thefuture of the world’s coral reefs. Mar. Freshwater Res. 50, 839–866.
Houck J. E., Smith S. V., Jokiel P. L. (1977) The response of coralgrowth rate and strontium content to light intensity and water tem-perature. Proceedings of the 3rd International Coral Reef Sympo-sium. Miami, Vol. 2, p. 425.
Ip Y. K. and Krishnaveni P. (1991) Incorporation of strontium (90Sr2�)into the skeleton of the hermatypic coral Galaxea fascicularis. J.Exp. Zool. 258, 273–276.
Ip Y. K. and Lim A. L. L. (1991) Are calcium and strontium trans-ported by the same mechanism in the hermatypic coral Galaxeafascicularis? J. Exp. Biol. 159, 501–513.
Johnston I. S. (1980) The ultrastructure of skeletogenesis in hermatypiccorals. Int. Rev. Cytol. 67, 171–214.
Kinsman D. J. J. (1969) Interpretation of Sr2� concentrations in car-bonate minerals and rocks. J. Sedim. Petrol. 39, 486–508.
Kinsman D. J. J. and Holland H. D. (1969) The coprecipitation ofcations with CaCO3. IV. The coprecipitation of Sr2� with aragonitebetween 16° and 96 °C. Geochim. Cosmochim. Acta 33, 1–17.
Krishnaveni P., Chou L. M., and Ip Y. K. (1989) Deposition of calcium(45Ca2�) in the coral Galaxea fascicularis. Compar. Biochem.Physiol. 94A, 509–513.
Lough J. M. (1994) Climate variation and E1 Nino-Southern Oscilla-tion events on the Great Barrier Reef: 1958 to 1987. Coral Reefs 13,181–195.
Lough J. M. (1999) Sea surface temperatures on the Great Barrier Reef:a contribution to the study of coral bleaching. GBRMPA Res. Publ.57, 31 pp.
Marshall A. T. (1996) Calcification in hermatypic and ahermatypiccorals. Science 271, 637–639.
Marshall J. F. (2000) Decadal-scale, high resolution records of seasurface temperature in the eastern Indian and south western PacificOceans from proxy records of the Sr/Ca ratio of massive Poritescorals. Ph.D. thesis, Australian National University.
Marshall J. F., McCulloch M. T., Burrows D. B. (submitted, 2002)Evidence of mid-Holocene cooling of the tropical western PacificOcean from Sr/Ca-derived sea surface temperatures for Porites sp.corals from the central Great Barrier Reef. Paleoceanography.
Marshall J. F. and McCulloch M. T. (2001) Evidence of El Nino andthe Indian Ocean Dipole from Sr/Ca derived SSTs for modern coralsat Christmas Island, eastern Indian Ocean. Geophys. Res. Lett. 28,3453–3456.
Martin P. A., Lea D. W., Mashiotta T. A., Papenfuss T., and SarntheinM. (1999) Variation of foraminiferal Sr/Ca over Quaternary glacial-interglacial cycles: Evidence for changes in mean ocean Sr/Ca.Geochem. Geophys. Geosyst. 1, .
McConnaughey T. A. and Whelen J. F. (1997) Calcification generatesprotons for nutrient and bicarbonate uptake. Earth Sci. Rev. 42,95–117.
McCulloch M. T. and Esat T. (2000) The coral record of last intergla-cial sea levels and sea surface temperatures. Chem. Geol. 169,107–129.
McCulloch M. T., Gagan M. K., Mortimer G. E., Chivas A. R., andIsdale P. J. (1994) A high-resolution Sr/Ca and � 18O coral recordfrom the Great Barrier Reef, Australia, and the 1982–1983 El Nino.Geochim. Cosmochim. Acta 58, 2747–2754.
McCulloch M. T., Tudhope A. W., Esat T. M., Mortimer G. E.,Chappell J., Pillans B., Chivas A. R., and Omura A. (1999) Coralrecord of equatorial sea-surface temperatures during the penultimatedeglaciation at Huon Peninsula. Science 283, 202–204.
Min G. R., Edwards R. L., Taylor F. W., Recy J., Gallup C., and BeckJ. W. (1995) Annual cycles of U/Ca in coral skeletons and U/Cathermometry. Geochim. Cosmochim. Acta 59, 2025–2042.
Mitsuguchi T., Matsumato E., Abe O., Uchida T., and Isdale P. J.(1996) Mg/Ca thermometry in coral skeletons. Science 274, 961–963.
Nelson D. R. and McCulloch M. T. (1989) Petrogenic applications ofthe 40K–40Ca radiogenic decay scheme—A reconnaissance study.Chem. Geol. 79, 275–293.
Russell W. A., Papanastassiou D. A., and Tombrello T. A. (1978) Caisotope fractionation on the Earth and other solar system materials.Geochim. Cosmochim. Acta 42, 1075–1090.
Shen C.-C., Lee T., Chen C.-Y., Wang C.-H., Dai C.-F., and Li L.-A.(1996) The calibration of D [Sr/Ca] versus sea surface temperaturerelationship for Porites corals. Geochim. Cosmochim. Acta 60,3849–3858.
Shen G. T. and Dunbar R. B. (1995) Environmental controls onuranium in reef corals. Geochim. Cosmochim. Acta 59, 2009–2024.
Schrag D. P. (1999) Rapid analysis of high-precision Sr/Ca ratios incorals and other marine carbonates. Paleoceanography 14, 97–102.
Sinclair D. J. (1999) High spatial-resolution analysis of trace elementsin corals using laser ablation ICP–MS. PhD thesis. Australian Na-tional University.
Sinclair D. J., Kinsley L. P., and McCulloch M. T. (1998) Highresolution analysis of trace elements in corals by laser ablationICP–MS. Geochim. Cosmochim. Acta 62, 1899–1901.
Smith S. V., Buddemeier R. W., Redalje R. C., and Houck J. E. (1979)Strontium–calcium thermometry in coral skeletons. Science 204,404–407.
Stoll H. M. and Schrag D. P. (1998) Effects of Quaternary sea levelcycles on strontium in seawater. Geochim. Cosmochim. Acta 62,1107–1118.
Stoll H. M., Schrag D. P., and Clemens S. C. (1999) Are seawaterSr/Ca variations preserved in Quaternary foraminifera? Geochim.Cosmochim. Acta 63, 3535–3547.
Thompson G. and Livingston H. D. (1970) Strontium and uraniumconcentrations in aragonite precipitated by some modern corals.Earth Planet. Sci. Lett. 8, 439–442.
Thompson T. G. and Chow T. J. (1955) The strontium-calcium atomratio in carbonate-secreting marine organisms. Deep Sea Res.(Suppl.) 3, 20–39.
Weber J. N. (1973) Incorporation of strontium into reef coral skeletalcarbonate. Geochim. Cosmochim. Acta 37, 2173–2190.
Woodroffe C. D. and Berry P. F. (1994) Scientific studies in the Cocos(Keeling) Islands: an introduction. Atoll Res. Bull. 399, 1–16.
3280 J.F. Marshall and M.T. McCulloch