Smarter Balanced Assessment Consortium: Usability, Accessibility, and Accommodations Training
AN ASSESSMENT OF SAFETYAND ACCESSIBILITY OF
ROADS IN INDIAN CITIESA Centre for Science and Environment briefing paper
Writers: Anumita Roychowdhury, Priyanka Chandola, Vivek Chattopadhyay and Ruchita Bansal
Editors: Papia Samajdar and Souparno Banerjee
Advisor: Ashok Bhattacharjee
Safety audit and road design drawings: Ruchita Bansal and Aditi Sharma
Design: Ajit Bajaj
Production: Rakesh Shrivastava, Gundhar Das
We are grateful to Shakti Energy Foundation (www.shaktifoundation.in) for its support to the programme onclean air and sustainable mobility. However, the views expressed and analysis done in this document do not nec-essarily reflect the views of the Foundation. The Foundation also does not guarantee the accuracy of any dataincluded in this publication, nor does it accept any responsibility for the consequences of its use.
We are grateful to the Swedish International Development Agency for institutional support.
We would like to especially thank the volunteers who had participated in the safety audit.
© 2014 Centre for Science and Environment
Material from this publication can be used, but withacknowledgement.
Maps in this report are indicative and not to scale.
Published byCentre for Science and Environment41, Tughlakabad Institutional AreaNew Delhi 110 062Phones: 91-11-29955124, 29955125, 29953394Fax: 91-11-29955879E-mail: [email protected] Website: www.cseindia.org
Printed at Multi Colour Services
2

3
AN ASSESSMENT OF SAFETYAND ACCESSIBILITY OF
ROADS IN INDIAN CITIESA Centre for Science and Environment briefing paper

4
Map 1: Unsafe landThe Delhi Traffic Police has identified 128accident-prone zones in the city. Delhi rankshighest among Indian cities in terms of fatalaccidents; two pedestrians and two two-wheeler riders die daily (on an average) onDelhi’s roads. In 2012, the city’s share offatalities numbered 61 cyclists and 423pedestrians (NCRB data)
Note: NCRB= National Crime Records BureauSource: http://delhitrafficpolice.nic.in/be-road-smart/accident-prone-area/
Central Delhi: 1. ITO/IP Flyover 2. Rajghat 3. Faiz Road Crossing/Idgah
East & North-east Delhi: 1. Geeta Colony Flyover 2. Shakarpur Chungi 3. Shamshan Ghat Geeta Colony 4. Akshardham Mandir 5. East Vinod Nagar/Mv Ii Red Light 6. Khel Gaon 7. Mayur Vihar Extension 8. Murga Mandi Flyover 9. Nizamuddin Yamuna Bridge 10. Underpass Ghazipur Red Light 11. Underpass Patparganj 12. Anand Vihar ISBT 13. Khajoori Chowk 14. Dilshad Garden 15. DharampuraRed Light 16. MS Park Metro Station 17. Pusta New Usmanpur 18. Seelampur T-point 19. Shahdara Flyover 20. Shyam Lal College
New Delhi & North-west Delhi: 1. Burari Chowk 2. Gandhi Vihar Bus Stand 3. ISBT K Gate 4. Majnu Ka Tila 5. Monastry Ring Road 6. Mukand Pur Chowk 7. Nigam Bodh Ghat 8. Wazirabad 9. Wazirabad Pull 10. Kabootar Market 11. Vijay Ghat 12. DCM Chowk 13. Britannia Chowk 14. Deepali Chowk 15. Madhuban Chowk 16. Shakurpur Red Light 17. Wazirpur Depot 18. Azadpur Bus Terminal 19. Azadpur Chowk 20. Azadpur Sabzi Mandi 21. Bhalswa Chowk 22. Jahangirpuri Bus Stand 23. Mukharba Chowk 24. Bakoli Bus Stand 25. Budhpur Ganda Nala/Hanuman Mandir Budhpur 26. CNG Pump Sanjay Gandhi T-point 27. Khampur Village 28. Lala HarishchanderHospital 29. Libaspur Bus Stand 30. Nangli Budhpur Village/Mohan Vilas Farmhouse 31. Sai Baba Mandir 32. SGT Nagar 33. Shani Mandir34. Singhu Border 35. Swaroop Nagar 36. Tikri Khurd Bus Stand 37. Haider Pur 38. Mongol Puri Flyover 39. Rama Vihar 40. Sec 23 PetrolPump 41. West Enclave Red Light
South & South-east Delhi: 1. Shamshan Ghat Barapulla 2. Dhaula Kuan 3. Sanjay T-point 4. Hyatt Hotel 5. Moti Bagh Flyover 6.Ambience Mall 7. Mahipalpur Flyover 8. Malai Mandir 9. Munirka 10. Radisson Hotel 11. Shiv Murti 12. Chirag Delhi Flyover 13. Khanpur T-point 14. AIIMS 15. DC Office 16. Moolchand 17. Panchsheel Flyover 18. ESI Hospital, Anand Mai Marg 19. Hamdard Ngr Red Light 20. KayaMaya Hospital 21. Modi Mill Flyover 22. Okhla More 23. Roundabout Okhla Estate 24. Ashram Chowk 25. Barapulla Ring Road 26. DNDFlyover 27. Lajpat Nagar 28. Sarai Kale Khan 29. Ali Village 30. Harkesh Nagar 31. Jaitpur More 32. Sarita Vihar Flyover
West & South-west Delhi: 1. Dada Dev Hospital 2. Power House Mahavir Enclave 3. Rajokri Flyover 4. Dabri Flyover 5. Janakpuri East 6. Kakrola Dwarka More 7. Nawada Village 8. Uttam Nagar Metro Station 9. Kapoor Hospital 10. Loha Mandi 11. Maya Puri Chowk 12. Naraina 13. Pusa Gate Inder Puri 14. Moti Nagar Flyover 15. Roundabout Pusa 16. Zakhira Flyover 17. Ghewra More 18. Karan VatikaNihal Vihar 19. Kirari More 20. Krishna Garden 21. Madi Pur Metro Station 22. Paschim Vihar Metro Station 23. Mundka Metro Station 24. Nangloi DTC Depot 25. Pani Ki Tanki 26. Peera Garhi Chowk 27. Punjabi Bagh Chowk 28. Rajdhani Park 29. Surajmal Metro Station 30. Gate No 3 Tihar Jail 31. Gurudwara Raja Garden 32. Tikri Village

5
alk, cycle, and public transport will not work if people are not safe,are injured or die while accessing jobs, educational services, markets, recreation and a range of daily chores. Road injuries anddeaths have recorded an unacceptable increase in Indian cities. Anastounding number of walkers, cyclists, public transport users and
poor people meet a similar harsh fate on roads. This has spurred Centre for Science and Environment (CSE) to assess the
accident risk in Indian cities, investigate accident hotspots in Delhi and carry out a safety audit of selected streets of Delhi to identify the factors contributing to unsafe roads. This has helped assess policy gaps to understandthe solutions and the way forward. This assessment has become necessary at atime when Delhi and other cities face the daunting challenge of increasing theshare of public transport along with walking and cycling for clean air andpublic health, and reduce fuel guzzling and climate impacts.
This analysis has exposed how fatal road accidents have increased phenomenally because Indian cities are prioritising high speed roads for vehicles instead of safe access for all road users. This needs to be reversed tocreate well designed space for walkers and cyclists, allow safe crossing atgrade, reduce friction with high speed vehicles, calm and slow down traffic,give priority to walkers and cyclists and public transport users in the roaddesign, and make penalty and deterrent more stringent for a zero tolerancepolicy for accidents.
WRIGHT OF WAY: AN ASSESSMENT OF SAFETY AND ACCESSIBILITY OF ROADS IN INDIAN CITIES
DEATH TOLL 2012In some other Indian cities
KOLKATA
34 cyclists 276 walkers
MUMBAI
28 cyclists264 walkers
VIJAYWADA
23 cyclists207 walkers
NAGPUR
30 cyclists123 walkers
CHENNAI
58 cyclists103 walkers

A. Road injury andpublic healthThe World Health Organization (WHO) now classifies disability, unproductivelife years, and premature deaths related to road injuries as a significant healthimpact of motorisation.The recent estimates of Global Burden of Disease(GBD), a report brought out jointly by a group of international organisationsincluding the WHO, has changed the way health impacts of motorisation areconventionally understood, by including deaths and illnesses from road acci-dents as well as air pollution within its ambit. Both are the impacts of rapidmotorisation (see Graph 1: Disease burden, motorisation and road accidents).The GBD report ranks road injuries as the world’s eighth leading cause of deathand the number one killer of young people aged 15 to 24. If deaths due to roadinjuries and air pollution from vehicles are combined, then they exceed the tallyfrom HIV, tuberculosis or malaria.
Globally, there has been significant increase in healthy years lost due to roadinjures and outdoor air pollution between 1990 and 2010. When the rate ofhealthy years lost due to injuries and air pollution from motorised roadtransport in 2010 is added, the damage is overwhelming (see Graph 2: Changein burden of disease from air pollution and road injuries).
6
JUHI JHA / CSE

7
RIGHT OF WAY: AN ASSESSMENT OF SAFETY AND ACCESSIBILITY OF ROADS IN INDIAN CITIES
0
50,0
00,0
00
100,
000,
000
150,
000,
000
Ischemic heart disease
Stroke
COPD
Lower respiratory infections
Lung cancer
HIV/AIDS
Diarrheal diseases
Road injury
Diabetes mellitus
Tuberculosis
0
20,0
00,0
00
40,0
00,0
00
60,0
00,0
00
80,0
00,0
00
Ischemic heart disease
Stroke
COPD
Lower respiratory infections
Lung cancer
HIV/AIDS
Diarrheal diseases
Road injury
Diabetes mellitus
Tuberculosis
0
2,00
0,00
0
4,00
0,00
0
6,00
0,00
0
8,00
0,00
0
Ischemic heart disease
Stroke
COPD
Lower respiratory infections
Lung cancer
HIV/AIDS
Diarrheal diseases
Road injury
Diabetes mellitus
Tuberculosis
0
500,
000
1,00
0,00
0
1,50
0,00
0
Ischemic heart disease
Stroke
COPD
Lower respiratory infections
Lung cancer
HIV/AIDS
Diarrheal diseases
Road injury
Diabetes mellitus
Tuberculosis
Graph 1: Disease burden, motorisation and road accidentsThe death and DALY burden of motorised road transport rides way above other causes
GBD deaths Death burden attributable to motorised road transport
GBD DALY DALY burden attributable to motorised road transport
Graph 2: Change in burden of disease from air pollution and road injuries
Global shift in healthy years lost due to road injuriesand outdoor air pollution, 1990-2010
50
0
–50
2,000
1,500
1,000
500
0
Perc
enta
ge
DA
LYs
per
100
,000
peo
p[l
e
Road injuries Attributable to ambient air pollution Road injuries Air pollution
Age in years
Rate of health years lost to injuries and air pollutionfrom motorised road transport, 2010
Notes: GBD= Global Burden of Disease, COPD= Chronic Obstructive Pulmonary Disease, DALY= Disability Adjusted Life Years, IHD= Ischemic Heart Disease, LRI= Lower Respiratory Infections.Sources for graphs 1 & 2: Global Road Safety Facility, The World Bank; University of Washington, Transport for Health: The Global Burden of Disease from MotorisedRoad Transport, Seattle, WA, Washington DC, 2014
IHD
LRI
Stro
ke
CO
PD
Ro
ad in
juri
es
Lun
g
<1
1-4
5-9
10-1
4
15-1
9
20-2
4
25-2
9
30-3
4
35-3
9
40-4
4
45-4
9
50-5
4
55-5
9
60-6
4
65-6
9
70-7
4
75-7
9
80+

B. Chilling statisticsExplosive trend in Indian cities: According to the Union ministry of road trans-port and highways, close to 500,000 road accidents were reported in the year2012. As much as 11 per cent of the global road injury deaths occur annually inIndia alone. These numbers are equal to wiping out close to 40 per cent equiv-alent population of a nation like Maldives. India also displays a very disturbingtrend — over the last two decades, while the total number of accidents andinjury shows only a small downward dip, fatalities have increased very sharply,from 18 per cent in 2003 to 25 per cent in 2012. More people are dying now ascities allow vehicles to have more speed on roads, while depriving people of safeaccess to these same roads (see Graph 3: Road accidents and consequences).
Accident rates rising in smaller cities: Highly motorised cities like Mumbai,Chennai, Delhi and Bengaluru top the list with the highest numbers of injuriesand deaths as recorded by the Union ministry of road transport and highways.Mumbai has the highest number of all types of accidents, while Delhi recordslargest number of fatal accidents among all cities. Studies now indicate thatsmaller cities that have newly built highways, show increasing vehicle conflictand accident risks — Lucknow, Vadodara and Agra are some examples (seeGraph 4: Cities on killer roads and Table 1: Fatal tally).
Delhi tops: Delhi ranks the highest in terms of fatal accidents and in number ofpedestrians and cyclists falling victim to road crashes. The total number of acci-
dents in 2013 was 9 per cent higher than the 2012 level.The ministry’s report titled Road Accidents in India2012, shows that on an average, about five road accidentdeaths occur every day, which includes two pedestriansand two two-wheeler riders. Every week, two cyclists andone car rider dies in Delhi (see Graph 5: A dubious trendin Delhi). In 2014 (till the month of May), road acci-dents had claimed 325 lives during the night and 332lives in the day time. Violation of rules is rampant —with 329,000 cases of signal jumps, over 14,000 cases ofdrunken driving and 45,158 cases of overspeeding beingreported. Chennai, which follows Delhi in road accidentdeaths, reports 25 per cent less fatalities.
Young and productive people at maximum risk:Nationally, the young population (till 24 years) consti-tutes 40 per cent of the victims, other than motor vehicledrivers (see Graph 6: How old?). In 2012, about 5,879children in the age group 0-14 years and about 26,709young adults in the age group 15-24 years were victimsof road accidents. The most affected victims other than
8
No of persons killed
(approximation)
Delhi 1800s
Chennai 1400s
Bengaluru 700s
Kanpur, Patna 500s
Kolkata, Lucknow, Mumbai, Hyderabad, 400s
Indore, Meerut, Agra, Allahabad, Pune
Jaipur, Vizag, Ghaziabad, Vijaywada, 300s
Raipur, Mallapuram, Jodhpur, Bhopal
Nagpur, Jabalpur, Coimbatore, Ludhiana, 200s
Ahmedabad, Faridabad, Gwalior, Surat,
Asansol, Durgapur, Varanasi, Kollam
Aurangabad, Jamshedpur, Khozikode, 100s
Vadodara, Thiruvananthapuram, Nasik,
Rajkot, Kochi, Thiruchirapalli, Chandigarh,
Madurai, Thricchur, Kota
Amritsar, Kannur, Srinagar, Dhanbad 50-90
Source: Road Accidents in India 2012, ministry of road transport and highways(MORTH), Government of India, New Delhi
Table 1: Fatal tallyCities and their dead; Delhi tops the list of fatalities
Fatalities go up
200318%201225%

0
100,000
200,000
300,000
Num
bers
400,000
500,000
600,000
20
02
20
03
20
04
20
05
20
06
20
07
20
08
20
09
20
10
20
11
20
12
Number of persons injured
Number of persons killed
Number of fatal accidents
Number of road accidents
0
1
2
3
4
5
6
Number of accidents
Number of fatalities
Number of persons injured
CA
GR
in %
1992-2002 2002-2012
0
5,000
10,000
15,000
20,000
25,000
30,000
Mum
bai
Chen
nai
Del
hi
Beng
alur
u
Indo
re
Kol
kata
Bhop
al
Jaba
lpur
Mal
lapu
ram
Hyd
erab
ad
0
200
400
600
800
1000
1200
1400
1600
1800
2000
Del
hi
Ch
enn
ai
Ben
gal
uru
Kan
pu
r
Patn
a
Ko
lkat
a
Luck
no
w
Mu
mb
ai
Hyd
erab
ad
Ind
ore
Graph 4: Cities on killer roads
Source: Road Accidents in India 2012, MORTH, Government of India, New Delhi
A. Total number of accidents B. Total number of persons killed
A. Trends — India B. Decadal growth rates
RIGHT OF WAY: AN ASSESSMENT OF SAFETY AND ACCESSIBILITY OF ROADS IN INDIAN CITIES
0
1000
2000
3000
4000
5000
6000
7000
8000
9000
2008 2009 2010 2011 2012 2013
Total number of accidents
Persons injured (number)
Persons killed (number)
Graph 5: A dubious trend in DelhiNine per cent hike in total number of accidents in 2013compared to 2012
Source: http://delhitrafficpolice.nic.in/about-us/statistics/
15-24 years 32%
25-65 years 53%
65 and above 8% 0-14 years
Graph 6: How old?Age profile of road accident victims (other than drivers)in India
Source: Road Accidents in India 2012, MORTH, Government of India,New Delhi.
Graph 3: Road accidents and consequences
9
Source: Road Accidents in India 2012, MORTH, Government of India, New Delhi Note: CAGR= Compound Annual Growth Rate
drivers were those in their most productive phase of life — 25-65 years. Asmuch as 53 per cent of the victims fell in this bracket. The economic, societaland emotional cost of this is enormous.
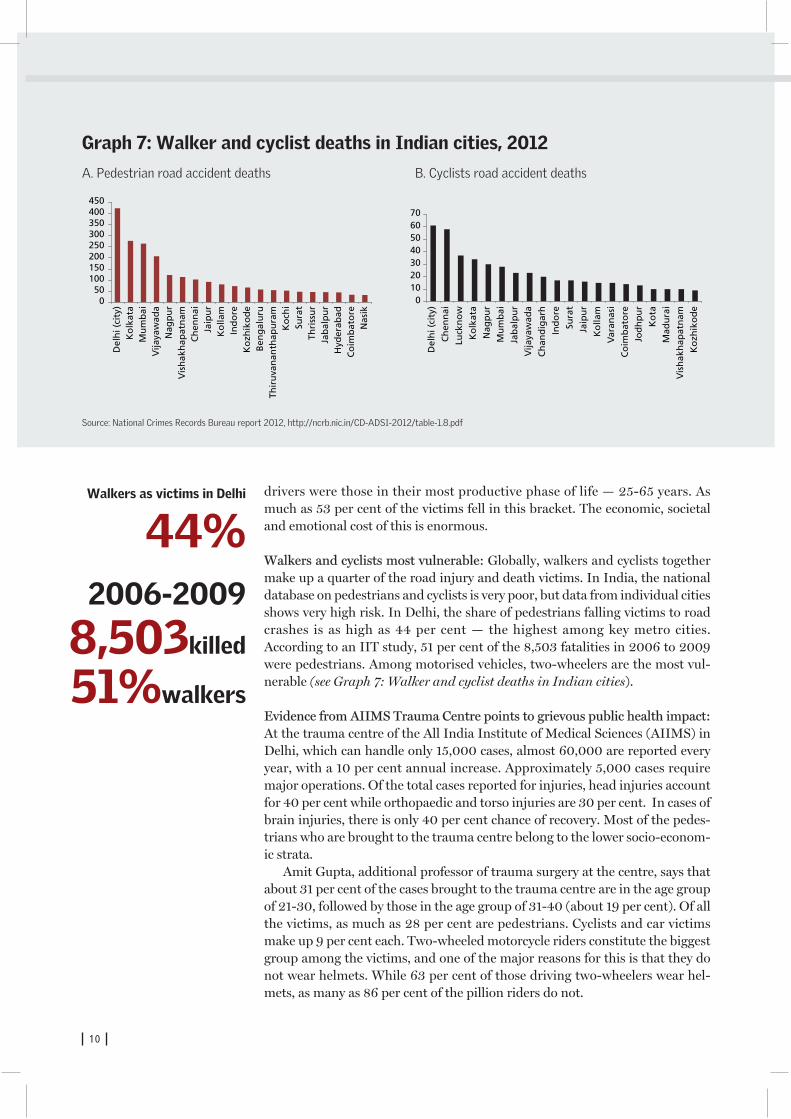
Walkers and cyclists most vulnerable: Globally, walkers and cyclists togethermake up a quarter of the road injury and death victims. In India, the nationaldatabase on pedestrians and cyclists is very poor, but data from individual citiesshows very high risk. In Delhi, the share of pedestrians falling victims to roadcrashes is as high as 44 per cent — the highest among key metro cities.According to an IIT study, 51 per cent of the 8,503 fatalities in 2006 to 2009were pedestrians. Among motorised vehicles, two-wheelers are the most vul-nerable (see Graph 7: Walker and cyclist deaths in Indian cities).
Evidence from AIIMS Trauma Centre points to grievous public health impact:At the trauma centre of the All India Institute of Medical Sciences (AIIMS) inDelhi, which can handle only 15,000 cases, almost 60,000 are reported everyyear, with a 10 per cent annual increase. Approximately 5,000 cases requiremajor operations. Of the total cases reported for injuries, head injuries accountfor 40 per cent while orthopaedic and torso injuries are 30 per cent. In cases ofbrain injuries, there is only 40 per cent chance of recovery. Most of the pedes-trians who are brought to the trauma centre belong to the lower socio-econom-ic strata.
Amit Gupta, additional professor of trauma surgery at the centre, says thatabout 31 per cent of the cases brought to the trauma centre are in the age groupof 21-30, followed by those in the age group of 31-40 (about 19 per cent). Of allthe victims, as much as 28 per cent are pedestrians. Cyclists and car victimsmake up 9 per cent each. Two-wheeled motorcycle riders constitute the biggestgroup among the victims, and one of the major reasons for this is that they donot wear helmets. While 63 per cent of those driving two-wheelers wear hel-mets, as many as 86 per cent of the pillion riders do not.
10
050
100150200250300350400450
Del
hi (
city
)K
olk
ata
Mu
mb
aiV
ijaya
wad
aN
agp
ur
Vis
hak
hap
atn
amC
hen
nai
Jaip
ur
Ko
llam
Ind
ore
Ko
zhik
od
eB
eng
alu
ruTh
iru
van
anth
apu
ram
Ko
chi
Sura
tTh
riss
ur
Jab
alp
ur
Hyd
erab
adC
oim
bat
ore
Nas
ik
010203040506070
Del
hi (
city
)
Ch
enn
ai
Luck
no
w
Ko
lkat
a
Nag
pu
r
Mu
mb
ai
Jab
alp
ur
Vija
yaw
ada
Ch
and
igar
h
Ind
ore
Sura
t
Jaip
ur
Ko
llam
Var
anas
i
Co
imb
ato
re
Jod
hp
ur
Ko
ta
Mad
ura
i
Vis
hak
hap
atn
am
Ko
zhik
od
e
Graph 7: Walker and cyclist deaths in Indian cities, 2012
Source: National Crimes Records Bureau report 2012, http://ncrb.nic.in/CD-ADSI-2012/table-1.8.pdf
A. Pedestrian road accident deaths B. Cyclists road accident deaths
Walkers as victims in Delhi
44%2006-2009
8,503killed
51%walkers
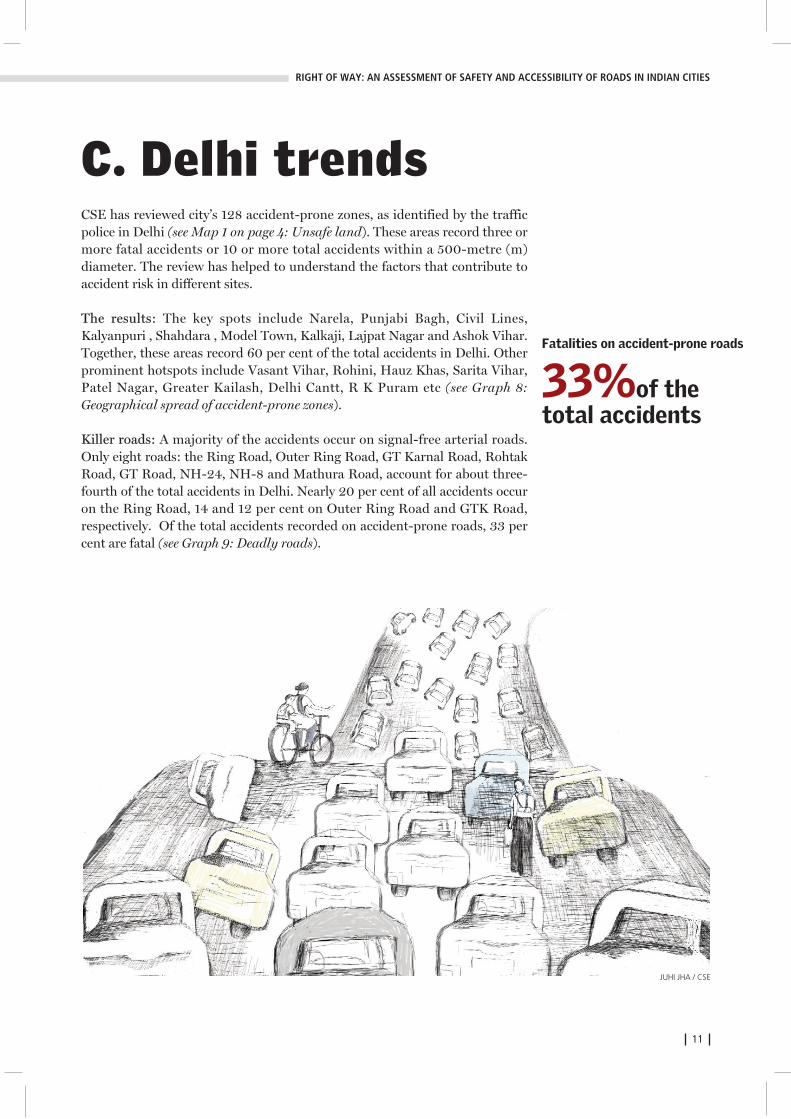
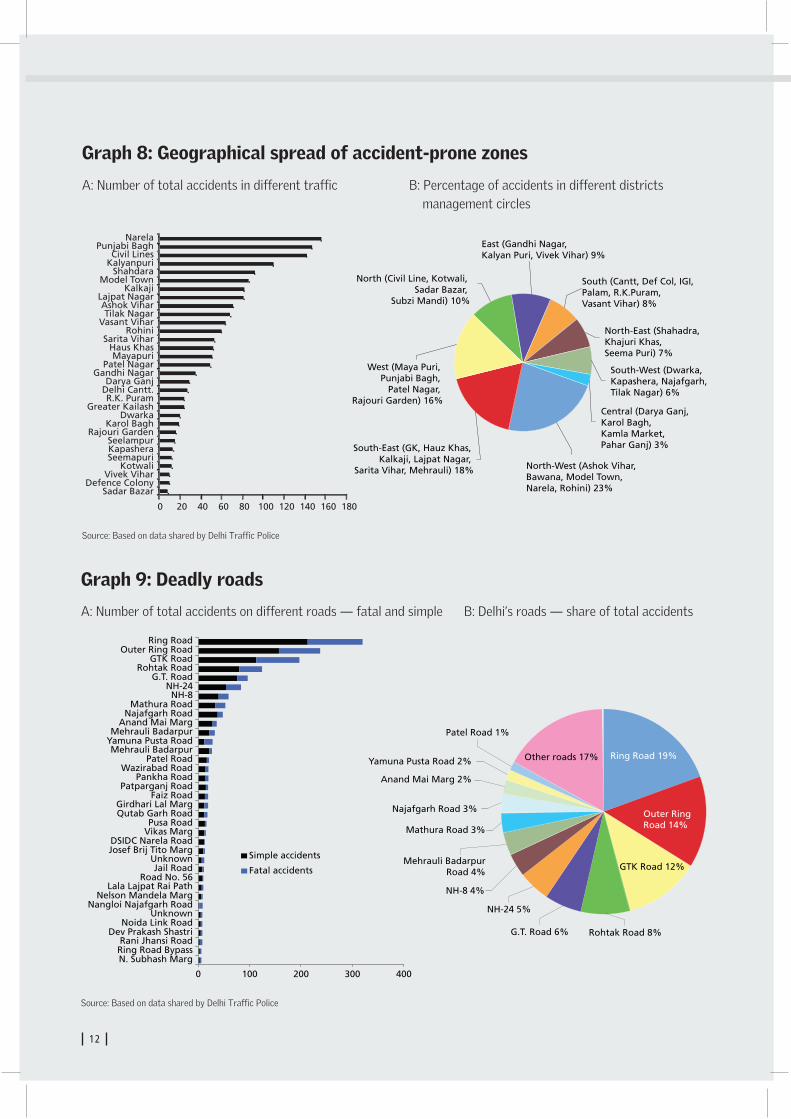
C. Delhi trendsCSE has reviewed city’s 128 accident-prone zones, as identified by the trafficpolice in Delhi (see Map 1 on page 4: Unsafe land). These areas record three ormore fatal accidents or 10 or more total accidents within a 500-metre (m)diameter. The review has helped to understand the factors that contribute toaccident risk in different sites.
The results: The key spots include Narela, Punjabi Bagh, Civil Lines,Kalyanpuri , Shahdara , Model Town, Kalkaji, Lajpat Nagar and Ashok Vihar.Together, these areas record 60 per cent of the total accidents in Delhi. Otherprominent hotspots include Vasant Vihar, Rohini, Hauz Khas, Sarita Vihar,Patel Nagar, Greater Kailash, Delhi Cantt, R K Puram etc (see Graph 8:Geographical spread of accident-prone zones).
Killer roads: A majority of the accidents occur on signal-free arterial roads.Only eight roads: the Ring Road, Outer Ring Road, GT Karnal Road, RohtakRoad, GT Road, NH-24, NH-8 and Mathura Road, account for about three-fourth of the total accidents in Delhi. Nearly 20 per cent of all accidents occuron the Ring Road, 14 and 12 per cent on Outer Ring Road and GTK Road,respectively. Of the total accidents recorded on accident-prone roads, 33 percent are fatal (see Graph 9: Deadly roads).
11
RIGHT OF WAY: AN ASSESSMENT OF SAFETY AND ACCESSIBILITY OF ROADS IN INDIAN CITIES
Fatalities on accident-prone roads
33%of the total accidents
JUHI JHA / CSE
0 20 40 60 80 100 120 140 160 180
Sadar Bazar Defence Colony
Vivek Vihar Kotwali
Seemapuri Kapashera Seelampur
Rajouri Garden Karol Bagh
Dwarka Greater Kailash
R.K. Puram Delhi Cantt. Darya Ganj
Gandhi Nagar Patel Nagar
Mayapuri Haus Khas
Sarita Vihar Rohini
Vasant Vihar Tilak Nagar
Ashok Vihar Lajpat Nagar
Kalkaji Model Town
Shahdara Kalyanpuri Civil Lines
Punjabi Bagh Narela
Central (Darya Ganj, Karol Bagh, Kamla Market, Pahar Ganj) 3%
South-West (Dwarka, Kapashera, Najafgarh, Tilak Nagar) 6%
North-East (Shahadra, Khajuri Khas, Seema Puri) 7%
North (Civil Line, Kotwali, Sadar Bazar,
Subzi Mandi) 10%
West (Maya Puri, Punjabi Bagh,
Patel Nagar, Rajouri Garden) 16%
South-East (GK, Hauz Khas, Kalkaji, Lajpat Nagar,
Sarita Vihar, Mehrauli) 18% North-West (Ashok Vihar, Bawana, Model Town, Narela, Rohini) 23%
South (Cantt, Def Col, IGI, Palam, R.K.Puram, Vasant Vihar) 8%
East (Gandhi Nagar, Kalyan Puri, Vivek Vihar) 9%
Graph 8: Geographical spread of accident-prone zones
Source: Based on data shared by Delhi Traffic Police
A: Number of total accidents in different traffic B: Percentage of accidents in different districts management circles
Other roads 17%
NH-24 5%
G.T. Road 6%
Ring Road 19%
Outer Ring Road 14%
GTK Road 12%
Rohtak Road 8%
NH-8 4%
Mehrauli Badarpur Road 4%
Mathura Road 3%
Najafgarh Road 3%
Anand Mai Marg 2%
Yamuna Pusta Road 2%
Patel Road 1%
0 100 200 300 400
N. Subhash MargRing Road BypassRani Jhansi Road
Dev Prakash ShastriNoida Link Road
UnknownNangloi Najafgarh Road
Nelson Mandela MargLala Lajpat Rai Path
Road No. 56Jail Road
UnknownJosef Brij Tito MargDSIDC Narela Road
Vikas MargPusa Road
Qutab Garh RoadGirdhari Lal Marg
Faiz RoadPatparganj Road
Pankha RoadWazirabad Road
Patel RoadMehrauli Badarpur
Yamuna Pusta RoadMehrauli Badarpur
Anand Mai MargNajafgarh Road
Mathura RoadNH-8
NH-24G.T. Road
Rohtak RoadGTK Road
Outer Ring RoadRing Road
Simple accidents
Fatal accidents
Graph 9: Deadly roads
Source: Based on data shared by Delhi Traffic Police
A: Number of total accidents on different roads — fatal and simple B: Delhi’s roads — share of total accidents
12
D. The most vulnerable The review of 128 accident-prone spots in Delhi shows that most accidentsoccur near flyovers and intersections; more than 40 per cent happen close toflyovers and 30 per cent at unsafe crossings and junctions (see Graph 10:Designed to damage). Substantial numbers of accident hotspots also occur nearpublic transport hubs. This shows that the nature of road design has significantbearing on accident risk, with built environment enhancing the risk.
Of the total hotspots identified near flyovers, about 27 per cent are on theRing Road, 17 on GT Karnal Road, 13 on Outer Ring Road and 6 per cent onMathura Road. It is important to note that the eight key arterial roads thatrecord nearly 75 per cent of all deaths, have been designed as high speed corri-dors. These roads have received the maximum attention and resources from thegovernment — including widening for six-eight lanes, flyovers to allow seam-less travel for vehicles, subway crossings and foot overbridges to prevent peoplefrom crossing on the surface and obstructing traffic flow, and closing of medi-ans to allow vehicles to move uninterrupted. These features have turned thesearterial roads into death traps. Especially deadly are the places where the fly-overs begin, where traffic merges at full speed. These include the flyovers atDhaula Kuan, AIIMS, Sarita Vihar, Mahipalpur, Rajokri, Akshardham, Dabri,ITO/IP and Moti Bagh (see Graph 11 : Flyovers are high risk zones).
The Transport Research and Injury Prevention Programme (TRIPP) of theIndian Institute of Technology, Delhi has studied the AIIMS flyover. It hasfound that after the construction of the flyover, the speed of vehicles increasedby 21.5 per cent, 22.6 per cent, 15 per cent and 31.6 per cent respectively forheavy vehicles, cars, three-wheelers and two-wheelers. Increased speed short-ened the time gap at every stage of crossing. The probability of pedestrian fatal-ity with a specific vehicle group increased 67 per cent, 100 per cent, 100 percent, and 200 per cent, respectively. Nearly 22 per cent of pedestrians contin-ued to choose high risk crossing at grade, despite the presence of a pedestrianunderpass (see Graph 12: Faster and deadlier).
No accident hotspots in Lutyens’ Delhi: Central Delhi — built around rotary,largely four-lane roads and with nearly no flyovers — shows the least numberof accidents. Even though the design of the rotaries are older and can beimproved to reduce vehicle friction and encourage safer passage for cyclists,this has proved to be more preventive than the high speed corridors.
Maximum accidents occur at night and early morning: As much as 50 per centof accidents occur at night, and 33 per cent between 6 PM and 12 AM. Thisonly reinforces the fact that any road condition that allows the vehicles toincrease speed enhances accident risk.
Many hotspots near bus and Metro stations — these compromise safe access topublic transport: It is very disturbing that the access paths to public transport
13
RIGHT OF WAY: AN ASSESSMENT OF SAFETY AND ACCESSIBILITY OF ROADS IN INDIAN CITIES
8key arterialroads
All designed ashigh speed corridors
75%of alldeaths on theseroads

14
0
5
10
15
20
25
30
Accidents due to crossing design
Accidents closer to transit hubs
Accidents closer to flyovers
% o
f to
tal a
ccid
ents
in a
ll ac
cid
ent-
pro
ne
road
s
Rin
g R
oad
Ou
ter
Rin
g R
oad
MB
Ro
ad
Ro
hta
k R
oad
NH
24
NH
8
Naj
afg
arh
Ro
ad
GT
Ro
ad
GTK
Ro
ad
Mat
hu
ra R
oad
Graph 10: Designed to damageAccidents occurring due to road design
0 5 10 15 20 25
Moti Nagar Flyover
Dabri Flyover
DND Flyover
ITO/IP Flyover
Sarita Vihar Flyover
Mahipalpur Flyover
Geeta Colony Flyover
Moti Bagh Flyover
Chirag Delhi Flyover
Rajokri Flyover
Panchsheel Flyover
Zakhira Flyover
Mongolpuri Flyover
Murga Mandi Flyover
Shahdara Flyover
Modi Mill FlyoverSimple accidents
Fatal accidents
Graph 11: Flyovers are high risk zonesFlyovers increase speed and high accident risk
0
5
10
15
20
25
30
35
40
Bus/truck Car Three-wheelers Two wheelers
Before construction (Mean speed km/h)
After construction (Mean speed km/h)
Graph 12: Faster and deadlierChange in speed of vehicles after the construction of the AIIMS flyover
Source: G Tiwari, Transport Research and Injury Prevention Programme, IIT Delhi, 2013
Source: Delhi Traffic PoliceSource: CSE analysis of accident data provided by Delhi Traffic Police

15
RIGHT OF WAY: AN ASSESSMENT OF SAFETY AND ACCESSIBILITY OF ROADS IN INDIAN CITIES
0
4
8
12
Num
ber o
f acc
iden
ts in
201
3
16
20
WajirpurDepot
ISBT K.Gate
JahangirpuriBus Stand
Bakoli BusStand
NangloiDTC Depot
Tikri KhurdBus Stand
AzadpurBus
Terminal
AnandVihar ISBT
GandhiVihay Bus
Stand
Libarpur Bus
Stand
MS ParkMetro
Station
UttamNagarMetroStation
MadipurMetroStation
PaschimViharMetroStation
MundkaMetroStation
Graph 13: Accidents near public transport nodesAccess to bus and Metro stations are also unsafe
Source: Based on data provided by Delhi Traffic Police
0
1
2
3
4
5
6
7
8
9
0
2
4
6
8
10
12
Ka
rka
ri M
ore
Nig
am
Bo
dh
Gh
at
Bri
tan
nia
Ch
ow
kFa
iz R
oa
d C
ross
ing
/ID
GA
HS
ee
lam
Pu
r T-
Po
int
Kh
azo
ori
Ch
ow
kA
zap
ur
Ch
ow
kK
ha
joo
ri C
ho
wk
Ma
jnu
Ka
Tila
N
an
glo
i DTC
De
po
tS
ha
ka
rpu
r C
hu
ng
iD
ab
ri F
lyo
ver
Jait
pu
r M
ore
Sa
rai K
ale
Kh
an
Un
de
rpa
ss P
atp
arg
an
jH
aid
erp
ur
Ra
jdh
an
i Pa
rkR
ou
nd
ab
ou
t O
kh
la E
sta
teB
ara
pu
lla R
ing
Ro
ad
E
SI H
osp
ita
lH
aid
er
Pu
r Ja
ha
ng
irp
uri
Bu
s S
tan
d
Jan
ak
pu
ri E
ast
Mo
ti N
ag
ar
Flyo
ver
An
an
d V
iha
r IS
BT
Aza
dp
ur
Sa
bzi
Ma
nd
i
Dh
arm
ap
ur
Re
d L
igh
t
Bh
als
wa
Ch
ow
k
De
ep
ali
Ch
ow
k
Ro
un
da
bo
ut
Ok
hla
Est
ate
Sa
i Ba
ba
Ma
nd
ir
Ma
hip
alp
ur
Flyo
ver
Ka
rka
ri M
ore
AIIM
S
Ba
koli
Bu
s S
tan
d
Bu
rari
Ch
ow
k
Ha
md
ard
Ng
r R
ed
Lig
ht
Jait
pu
r M
ore
Kir
ari
Mo
re
Lala
Ha
rish
cha
nd
ra H
osp
ita
l
Na
gli
Bu
dh
pu
r V
illa
ge
/Mo
ha
n V
ilas
Farm
ho
use
Naw
ad
a V
illa
ge
Niz
am
ud
din
Ya
mu
na
Bri
dg
e
SG
T N
ag
ar
Sh
yam
La
l Co
lleg
e
Tik
ri K
hu
rd B
us
Sta
nd
Num
ber o
f acc
iden
ts in
201
3
Num
ber o
f acc
iden
ts in
201
3
Graph 14: Dare to walk and cycle on Delhi’s roads?
Source: Based on data provided by Delhi Traffic Police
A. Key pedestrian accident spots B. Key cyclist accident spots

nodes including bus depots, bus stations, bus terminals and Metro stationsshow high incidence of accidents. Some of the notorious stretches are nearISBT gate, Anand Vihar ISBT, Pashchim Vihar Metro Station, Uttam NagarMetro Station, Jahangirpuri bus stand, etc. Ten bus stops listed as accidentspots account for 8 per cent of the total accidents, and include the KashmereGate and Wazirpur stops. Among the Metro stations, those at MansarovarPark, Uttam Nagar and Madipur are the major accident spots. This is a seriousmatter in view of the fact that lack of safety in accessing public transport cancompromise public transport usage (see Graph 13: Accidents near public trans-port nodes).
High pedestrian accidents: In 2013, 56 zones for pedestrian accidents wereidentified by the traffic police; 21 such hotspots have been identified for cyclistaccidents. Areas near public transport nodes, major markets and low incomelocations are where there has been an increase in pedestrian accidents. In somelocations, the numbers have increased by 1.3 to four times during 2012 and2013 (see Graph 14: Dare to walk and cycle on Delhi’s roads?). Some key acci-dent spots, especially vulnerable for pedestrians, include Karkari More, NigamBodh Ghat, Britannia Chowk and Faiz Road Crossing; for cyclists, the stretch-es include Azadpur Subzi Mandi, Dharampura Red Light, Bhalswa Chowk andDeepali Chowk. According to the Street Design Guideline document of theUTTIPEC (Unified Traffic and Transportation Infrastructure (Planning andEngineering) Centre of the Delhi Development Authority), 40 per cent of the
16
Pedestrians 44.5%
Cyclists 6.1%
Two-wheeler riders 30.9%
Autos 2.1%
Cars 3.6%
Trucks 1.7% Others 10.8%
Buses 0.4%
Graph 15: Who is vulnerable in Delhi?Pedestrians and cyclists make up 50 per cent of the total victims
Source: Road Accidents in India 2012, MORTH, Government of India, New Delhi
1.3-4times hike in
pedestrianaccidents in
areas near public
transportnodes,
markets etc
total road length of Delhi has no sidewalks. Not surprising then, that 44 percent of Delhi’s accident victims are pedestrians (see Graph 15: Who is vulnera-ble in Delhi?).
Increase in bicycle accidents: Twelve accident-prone zones were identified bythe traffic police for cyclist victims in 2012; in 2013, newer locations have comeup. The zones especially vulnerable for cyclists include Azadpur Sabzi Mandi,Shyamlal College, Nizamuddin Yamuna Bridge, Mahipalpur Flyover andBhalsawa Chowk. This is a very serious concern as Delhi has the highest num-ber of cyclists in the country and the second largest number of walkers. Instretches like Uttam Nagar and Subhash Nagar on Shivaji Marg, and JyotiNagar East on Loni Road, cycles and cycle rickshaws outnumber cars.According to the Street Design Guideline document, cycle lanes in Delhi arealmost negligible.
Notorious crossings: About 24 per cent of the total accidents happen at cross-ings/junctions. Accidents happen on roads without properly designed junc-tions, or where provisions for crossing are missing. According to traffic policedata, 26 junctions are listed as accident hotspots. A CSE re-analysis of all theaccident spots showed that crossing and junction-related problems could becontributing to 30 per cent of the total accidents. Some key hotspots are BurariChowk, Seelampur T-point and Ashram Chowk which recorded 25, 25 and 22accidents, respectively. Other hotspots are Faiz Road Crossing, Punjabi BaghChowk, Azadpur Chowk, Britannia Chowk, Okhla Estate Roundabout andMukandpur Chowk.
Urban villages do not generate motorised traffic but suffer the most: Poorinfrastructure near low income neighbourhoods increases modal conflict andfriction considerably. Some of the notorious accident hotspots are near AliVillage, Shakarpur Chungi etc, with a total share of 10 per cent. These areasthat are close to high speed arterial roads have very high footfalls but very lowlevel of protection.
Foot overbridges and subways do not work: There is a growing tendency toremove people from the road while making signal-free corridors: by buildingfoot overbridges and subways for crossing. But the traffic police’s own review ofoverbridges indicates that this has actually increased the safety risk, as peopleprefer to cross on roads, where it is convenient to cross. This forced eviction ofpeople from the surface may help lower accident rates (as has been the casenear Anand Vihar Bus Station), but such an approach will also limit sustain-able modes like walking, cycling and public transport usage. In Anand Vihar,wide roads (nearly eight-lane) have been built. This is very difficult to crossamidst high speed traffic in one signal phase and therefore, increases the acci-dent risk. Road design will have to give primacy to pedestrians and publictransport users. Otherwise, a large number of zero pollution walk and cyclingtrips within a short radius will convert to motorised trips.
17
RIGHT OF WAY: AN ASSESSMENT OF SAFETY AND ACCESSIBILITY OF ROADS IN INDIAN CITIES
40%Delhi roadlength with nosidewalks

E. Best practices According to the WHO, the middle-income countries have the highest annualroad traffic fatality rate at 20.1 per lakh of population; the rate is 18.3 per lakhof population in low-income countries. The lowest fatality rate is in high-income countries at 8.7 per lakh of population (see Graph 16: World road traf-fic deaths).
Developed and developing countries are not directly comparable as theyhave different levels of motorisation, travel practices, land use patterns andurban design of sprawls. The WHO database indicates that if more motoristsare dying in developed countries, there are more pedestrians dying in develop-ing countries: the logic is that developing countries have more walking andcycling trips. A 2013 study carried out by D Mohan of TRIPPS, of the IndianInstitute of Technology, Delhi shows that the difference in income levelsbetween countries cannot explain fully why rich nations have lower accidentrates. Even in the Western world, road transport injury rates vary among citieswith similar incomes and populations by a factor of three-five because of urbanand road design. Cities with higher proportion of wide streets and low densityroad network have much higher fatality rates compared to more compact cities.This is an important lesson for Indian cities.
Globally, countries are movingtowards a zero tolerance policy on acci-dents and transforming urban and roaddesign for safety. Many WesternEuropean and high-income countries inthe Asia-Pacific region have reduced theirburdens dramatically. Japan reduced itsdisease burden from road injuries by 42per cent between 1990 and 2010, andSweden lowered its burden by 30 percent. Case studies of interventions, poli-cies, regulations and institutional capaci-ties to deliver them in these high-achiev-ing countries could help elucidate keylessons that other nations can follow.
Sweden has a Vision Zero road safety pol-icy that prioritises safety over speed. Thepolicy promotes low urban speed limits,pedestrian zones and barriers to separatecars from bikes. It has proposed a speedlimit of 30 km/hour. Some engineeringinterventions have been made like build-ing 1,500 km of ‘2+1’ roads where eachlane of traffic takes turns to use a middlelane for overtaking. This has helped save145 lives and created 12,600 safer cross-ings. Coupled with strict policing, these
18
100
90
80
70
60
50
40
30
20
10
0
Perc
enta
ge
road
tra
ffic
dea
ths
Low-income Middle-income High-income
Car occupants Motorised 2-3 wheelers
Cyclists Pedestrians Other/unspecified
Graph 16: World road traffic deathsA quarter of these occur among pedestrians and cyclists
Source: WHO 2013, Global status report on road safety 2013, World Health Organization

measures have halved the number of pedestrian deaths over the past five years.Sweden has also integrated the guidelines for traffic safety and crime preven-tion under the Traffic for an Attractive City (TRAST). Swedish police guide-lines include safety audit guidelines as well.
The Netherlands has a Sustainable Safety Vision policy that has led to imple-mentation of effective road safety measures. Infrastructure measures alonehave reduced the number of fatalities by 30 per cent.
In several Europe Union countries, the focus is on slowing down traffic, sepa-ration of vulnerable people from motorised traffic, awareness campaigns, moresafe pedestrian crossings, and effective fines for violation of pedestrian spaces.In the EU, fines are prescribed by law, either as a part of a Road Traffic Act, oras subject of a special legislative provision. Some countries allow police officersto decide the actual amount of the fine according to the specificity of the trafficsituation. In Finland, Sweden, Norway and Switzerland, the amount of the fineis a function of the net income of the offender.
In Paris (France), the city mayor has announced a maximum speed limit of 30km/hour on all streets of the city.
United Kingdom: Careless driving can be fined up to UK £100 and points areadded on to the license. There is a proposal from the department of transportto restrict motorists to a speed of 15 mph, a fine of UK £100, and three penal-ty points for overtaking cyclists. This is for a few cities where cycle flows arehigh.
Germany: A computerised point system for traffic violations is in place. Onecan incur up to three points if the offence endangers traffic safety. Once thereare eight demerit points, the licence is revoked. To get it back, the motoristneeds to pass a physical and mental status examination.
USA: In California, a new traffic law will be implemented from September2014. It aims to reduce high rates of bicycle accidents, injuries and fatalitiesacross the state. Motorists will be required to keep at least a three-feet distancefrom bicycle riders as they pass them on the road. In New York, from October2014, the default speed limit is being lowered to 25 mile per hour (mph) from30 mph. This is part of mayor Bill de Blasio’s ‘Vision Zero’ traffic safety plan toreduce pedestrian fatalities, and includes speed bumps, improved road design,and new cameras to catch rule-breakers and penalise them.
Other cities: In London, the Road Traffic Reduction Act allows authorities toreduce traffic levels or their rate of growth in targeted areas for lowering con-gestion and improving air quality. San Francisco has enforced a Better StreetPolicy. New York City is promoting pedestrian infrastructure. In Auckland, theLand Transport (Road Users) Rule stops motorists from stopping or parkingon a footpath and pedestrians have to be given right of the way.
These instances are only indicative of the way other governments have takenaccident risk reduction seriously to implement measures to protect people.
19
RIGHT OF WAY: AN ASSESSMENT OF SAFETY AND ACCESSIBILITY OF ROADS IN INDIAN CITIES
20.1per lakh of population: theannual roadtraffic fatalityrate in middle-income countries

F. The CSE auditFrom the accident hotspot data shared by the Delhi Traffic Police, CSE select-ed stretches from six arterial roads (see list: Selected roads and stretches) thatare considered the most dangerous for pedestrians and cyclists. A safety auditwas carried out in these segments to understand the existing problems. Out ofthese six arterial roads, one road segments was studied in detail to suggestdesign solutions to improve safety, convenience, aesthetics and overall attrac-tiveness and well-being.
Together, the stretches selected by CSE cover approximately 27 km. CSEreviewed various methods that are available globally for street audits and rank-ing and derived an appropriate method for a rapid assessment. The techniquefor assessing the walking environment included reviewing, auditing and ratingthe existing infrastructure and accessibility features on selected corridors. Thisassessment was based on quantitative and qualitative indictors that alsoallowed a room for discretion of the assessor and users.
The audit was carried out in accordance with a checklist of parametres pre-pared by CSE; this checklist was based on the street design guidelines ofUTTIPEC. These guidelines are expected to be followed by the city authorities,but are not mandatory. The audit identified deficiencies and maintenance con-cerns, and proposed solutions.
20
0 Very poor 2 Poor 4 Average 6 Good 8 Best 10
Footpath
Cycle track
Crossing-intersection
Crossing-mid block
Aesthetics
Transit stops
Amenities
Conflicts
Universally accessible
Noida Link Road
Vikas Marg
Outer Ring road
Ring Road
Mathura Road
Mehrauli-Badarpur Road
Graph 17: Ranking of road segments based on the safety auditNone of the roads scored ‘good’ under any of the parametres
Source: CSE

To carry out the safety audit, eight criteria were considered:● Engineering and design features of footpaths and cycle tracks (height,
width, material, continuity, segregation from carriageway, obstructions,and lighting)
● Crossing-intersection and mid-section (signal time, signage, markings,continuity/barrier-free access and traffic calming measures)
● Encroachments/impediments on footpaths (permanent or temporarystructures and parking)
● Design features for transit/bus stop/shelter (height, boarding/alightingtime, clear width and crossing facility)
● Amenities (toilets, vendor spaces, trees, lighting and seating)● Conflicts (between buses, motor vehicles, non-motorised transport (NMT),
pedestrians etc) ● Safety features (lighting, dead width and public spaces)● Aesthetics (design qualities of street furnitures/features)
The process: The CSE team did the surveys with the help of volunteers.Detailed maps and checklists were used for scoring. Field surveyors rated theselected road stretches on a scale of 1 to 10 for each indicator in every section.Each road/corridor was divided into segments for scoring. The scoring for eachsegment was done on the basis of the infrastructure available and its compari-son with the existing standards. The scoring for each ‘assessment parameter’was done in two parts — design according to the standards, and the existing sit-uation in a given segment.
The score: The final score of each segment in each component was multipliedwith the segment length. The score of the component was derived by addingthe scores of all the segments and then dividing it with the total length. Thisprocess gave the scores for each corridor for each component, and where theystood with respect to safety and accessibility of cyclists and pedestrians. Thescores were assigned to quantify the problems and indicate the variability on ascale. The review of the corridors was based on the auditing.
This was supplemented by a perception survey to assess how pedestrians,cyclists and public transport users feel about the walking conditions and over-all environmental conditions. CSE also took into account user perceptions onpersonal safety and availability and quality of infrastructure to evaluate rank-ing of each component and rating of the corridors.
The ugliest of all: The ranking of all the road segments show that for all para-meters, all roads scored from ‘very poor’ to ‘poor’. None of the corridors fea-tured in the ‘average’, ‘good’, or ‘best’ classes (see Graph 17: Ranking of road seg-ments). For the criteria on footpaths, some roads hit the second lowest rank of‘poor’. This brings out how dismal the state of affairs is.
21
RIGHT OF WAY: AN ASSESSMENT OF SAFETY AND ACCESSIBILITY OF ROADS IN INDIAN CITIES
SELECTED ROADSAND STRETCHES■ Mehrauli-Badarpur
Road (Khanpur T-point to HamdardNagar T-point)
■ Mathura Road(Harkesh Nagar toBadarpur Extension)
■ Ring Road(Maharani Bagh toMoolchandCrossing)
■ Outer Ring road(Mukarba ChowkFlyover toWazirabad Intersection)
■ Vikas Marg(Indraprastha MargCrossing toShakarpur More)
■ Noida Link road(Laxmi Nagar MetroStation to GurjarSamrat Mir Bhoj Marg Intersection)
The findings
Footpaths and cycle paths ● Footpaths are available in around 55 per cent of the total length surveyed,
while only 10 per cent have cycle tracks.● The width of a footpath (according to the Street Design Guidelines) should
be a minimum of 1.8 m: only 10-15 per cent of the total road stretch sur-veyed meet this norm.
● The kerb height (norm is 150 millimetre or mm) is unacceptable along allthe roads, except at some locations along Vikas Marg. Only five per cent ofthe total length has a kerb height that meets the standard.
● None of the corridors have a continuous footpath.● Most footpaths are found to be not even 1 m wide (the required width is a
minimum of 2 m).● Only the Noida Link Road and Vikas Marg have reasonable lengths of cycle
tracks, while Mathura Road and Mehrauli-Badarpur (MB) Road have cycletracks only for 300-400 m.
● Most of the cycle tracks are not even accessible, and most of the sidewalksare severely obstructed both temporarily and permanently. Spaces havebeen taken up by illegal and unplanned markets, hawkers, and for parking.
22
FOOTPATH: MEHRAULI-BADARPUR AND MATHURA ROADThe pedestrian count is more than 10-15 per cent of the total vehicles on these roads. The footpaths arediscontinuous and in poor condition. The width of the sidewalks varies between 1-3 m. The kerb heightalong the MB Road differs every 200 m. Near Khanpur T-point, the kerb height is 150 mm over a distance ofabout 150 m, before rising further to 250 mm. From Khanpur to the Jal Board office, the kerb height variesbetween 250 to 400 mm, while the kerb height near Batra Hospital on the same road goes up to 800 mm,making it almost inaccessible and unusable for pedestrians (see photo A).
CYCLETRACK: THE NOIDA LINK ROADThe longest stretch of this cycle path is about 2 km. The width of the cycle track varies from 1.5 to 3.5 m, andit gives a clear view of the road to the cyclist. The cycle track near the Akshardham Temple runs along theflyover, hence the slope is steep. Cyclists tend to use the flyover and not the track. For most part, there is noactivity along the road and the tracks are secluded, making them unsafe (see photo B).
A B
Access to public transport● Accessibility to public transport nodes is poor in almost all the corridors. ● Bus stops are located on footpaths, as there is no clear multi-function zone. ● The height of the base of the bus stop does not match with the base of the
bus, so people tend to wait on the road; buses stop in the middle of the road,or at the foot of flyovers making it unsafe for bus users.
● Roads with more public transport users have less bus stops. Low incomeneighbourhoods have high usage of public transport, but the transit stopsalong the roads that border these neighbourhoods have limited infrastruc-ture to accommodate all the people at the bus stops. This is the case atSangam Vihar and Khanpur (MB Road), Aali village (Mathura Road),Jahangirpuri (Outer Ring Road) and Shakarpur More (Vikas Marg).
● According to the UTTIPEC guidelines, the bus stops should be equippedwith amenities such as public toilets, seating areas, kiosks, route maps andhave adequate lighting, but all the transit stops in the six locations scorevery poor in these aspects. The amenities are negligible; even the size of thebus box is inadequate to accommodate the people using bus services. On theMB Road, there are a few bus stops which have toilets close to them, butthese facilities are unclean and ill-maintained.
● None of the bus stops are equipped with ramps, making it difficult for thedisabled to access them.
● There are many locations with no bus shelters and the passengers have tostand in the middle of the road to board the bus. On the other hand, thereare a few locations with well-designed public transport infrastructure, butthere is no one to use it!
23
RIGHT OF WAY: AN ASSESSMENT OF SAFETY AND ACCESSIBILITY OF ROADS IN INDIAN CITIES
BUS STOP: THE RING ROAD (NEAR NEHRU NAGAR AND LAJPAT NAGAR)The bus stops are located close to the foot of the flyover. Buses tend to drop passengers at the foot, exposing
them to high friction with vehicles.
People try to cross amidst high speed traffic on the surface. The footpaths are quite high, making it
impossible for passengers to access them. To board buses, people do not stand at the bus stop but in the
middle of the road. The facilities are not at all disabled-friendly (see photos C and D).
C D
Crossing facilities● None of the intersections is designed with raised table-top crossings or pel-
ican signals for convenient crossings. None of the corridors have mid-sec-tion crossings.
● Crossings are given either in the form of foot overbridges or subways; medi-ans are usually blocked with high railings. Only 15 per cent of the total cor-ridors studied has visible zebra crossings.
● An opinion survey shows 90 per cent of walkers and cyclists prefer crossingon the ground as foot overbridges and subways increase the travel distanceand are inconvenient.
● On the other hand, foot overbridges and subways with ramps attractmotorised vehicles for crossing.
24
CROSSING FACILITIES: THE OUTER RING, RING AND MB ROADSFoot overbridges and subways have been provided for crossing on these roads. But this has not helped as mostpeople, the differently abled and elderly in particular, prefer to cross at grade as climbing these facilities isdifficult for them. Also, using the foot overbridges increases walk time by three-four times than that in normalsurface crossings. Pedestrians avoid subways as they are not well-lit and increase the distance.
Subways and foot overbridges with ramps are easy targets for motorised vehicles. Motorised two-wheelersenter them illegally and negotiate them, endangering lives.
The crossings are equally dangerous. In most parts of these roads, at-grade surface crossing is barred. Thereis no limit on vehicular speeds at the places from where people can cross. Zebra crossings are barely visible atjunctions, especially on the Ring Roads. Intersections along Mathura Road, MB Road and Vikas Marg havezebra crossings available only at 10-15 per cent of the total stretch (see photos E-H).
E F
HG

Environmental conditions● All the corridors score poor on this count. ● There are a few public toilets along the MB Road, Noida Link Road and
Vikas Marg, but these remain locked or are unusable. As for the rest, thereare no amenities provided along their bus stops and footpaths — no placesto rest, public toilets, or designated spots for hawkers.
● There are no facilities for women. ● Walking and cycling infrastructure and bus stops are ill-maintained,
unclean and badly lit (making them unsafe in the night). ● There is no provision for shaded footpaths in this city which faces seven
months of harsh summer. About 90 per cent of the footpaths along allcorridors surveyed have no concentrated lighting or shade.
● Footpaths all along the segments are along the boundary walls with set-backs, making them unsafe and vulnerable to crime.
● Parking on footpaths is a menace, especially along Mathura Road, MBRoad and Vikas Marg. Around 50 per cent of each of these roads’ footpathsare encroached by parking.
● Aesthetics are unappealing. Footpaths along Mathura Road, MB Road andVikas Marg are broken and in insanitary conditions. Construction debrisoccupy footpaths. At Khanpur, along the MB Road, a garbage dump spillsover the footpaths (see photos I-L).
25
RIGHT OF WAY: AN ASSESSMENT OF SAFETY AND ACCESSIBILITY OF ROADS IN INDIAN CITIES
I J
LK

Universal accessibility● The infrastructure in all the corridors is not designed keeping the disabled
in mind: in fact, all the corridors score ‘0’ in this aspect. ● None of the road stretches in the given corridors have footpaths with ade-
quate height and there is no provision of ramps● There are no auditory signals at any of the intersections ● The tactile paving provided on the footpaths have no relevance as they begin
in the middle of the footpath and end abruptly anywhere● No provision of ramps has been provided on bus stops for physically chal-
lenged and visually impaired
26
UNIVERSAL ACCESSIBILITY: BLIND TO THE PLIGHT OF THE DISABLEDIt is important to note the definition of ‘disabled’ here: in the urban commuting context, ‘being disabled’ goesbeyond just being physically challenged. In this context, disabled-friendly design is a universal need, as factorssuch as health conditions, ageing, the need to carry heavy weights or infants etc can lead to obstruction inmobility.
Disabled people cannot access footpaths that are higher than 300 mm and without ramps. As there are noraised table-top crossings and the medians are blocked, this makes them vulnerable to accidents while cross-ing. Most bus stops do not have ramps or tactile paving. Tactile paving that exists along some portions of theRing Road, Mathura Road and Vikas Marg do not lead the user anywhere as they are put in a haphazardlymanner. There is no provision of auditory signals on any corridor.
Anjlee Aggarwal of Samarthyam, a Delhi-based NGO working on disabled-friendly infrastructure, says afew initiatives have been taken in Delhi to make pavements disabled-friendly, but there is no continuity in thenetwork for disabled people to feel safe (see photos M-N).
M N

Change is possible: CSE redesignsCentre for Science and Environment has demonstrated how bychanging design and reorganising street activities, roads can betransformed for zero accidents.
CSE has done a detailed design of one segment of the MB Roadto provide an alternative street design for optimum use of roadspace. For this purpose, two stretches have been considered: fromHamdard crossing to Vayusenabad and from Vayusenabad toKhanpur crossing.
CSE has based its redesign on the UTTIPEC street designguidelines as these guidelines are expected to become the law forapproval of any road project. It is expected that these guidelineswill notified under the Delhi Development Act and mandated inthe Delhi Master Plan to make their compliance a legal requirement.
These guidelines have been used for the conceptual design ofthe proposed street changes. This includes all street componentsto ensure safety of pedestrians and cyclists, smooth movement oftraffic, ease of alighting/boarding buses and intermediate trans-port along with amenities for all road users. Fundamentally, thishas segregated space for road users, reorganised street activities,provided more safe crossing facilities at grade, removed encroachments, provided space for key services of para-transit,and provided spaces for legal parking, vendors, bus stops, etc.
The design demonstrates that the reorganisation of activitiesand better design can actually free up substantial spaces that areotherwise not available for any use. In fact, the proposal envisagesfreeing up as much as 7,000 sq m that can be improved forstreetscaping and creating pedestrian plazas, food courts and vending areas, with overall improvement in environmentalconditions (see Chapter G: Change is possible).
27
RIGHT OF WAY: AN ASSESSMENT OF SAFETY AND ACCESSIBILITY OF ROADS IN INDIAN CITIES
G: Change is possibleRedesign of pilot corridor on MB RoadIn its proposal (see diagrams in the pages that follow), Centre for Science andEnvironment (CSE) has demonstrated that by changing the design and reor-ganising street activities, roads can be transformed into zero accident zones.CSE has done a detailed redesign of one segment of Mehrauli-Badarpur (MB)Road to provide an alternate street design for optimum use of road space. Forthis purpose, two stretches have been considered: (a) from Hamdard crossingto Vayusenabad and (b) from Vayusenabad to Khanpur crossing.
Barriers to accessibility on these stretches: some snapshotsThe stretch between Khanpur and Hamdard T-junctions is about 2.5 km inlength, and it hosts multiple activities. It is flanked by institutional and educa-tional centres on one side, and the low income neighbourhood of SangamVihar, the Air Force campus, and Khanpur on the other side. This generatesenormous pedestrian and cycling traffic as well as high footfalls at bus stops. Asafety audit of this stretch has highlighted the following problems, which havebeen kept in view while redesigning the selected stretch:
Footpaths: Only 40-50 per cent of this stretch has footpaths. These are of nar-row width ranging from 1-2 m and heights ranging from 150-800 mm. Thesefootpaths have no continuity. In most places, they are broken and too high forpeople to climb. They do not have ramps for the convenience of people with dis-abilities. The height of the footpaths near Batra Hospital and HamdardUniversity is as high as 900 mm, making it very difficult for people to access it.
Cycletracks: The cycletrack is only 200 m long near Hamdard University. It ismostly encroached by motorcycles. The stretch after the Jamia Hamdard junc-tion is not used at all, as the surroundings are not safe enough for walkers andcyclists. The stretch does not have public amenities like toilets or sitting bench-es for road users. There is no designated space for cycle parking. Tracks are notmaintained and cleaned and are full of garbage dumps.
Transit stops: Bus stops are not adequately designed to meet the needs of com-muters, who are numerous here. Most of the road space is occupied by parkedcars. Hawkers have not been given adequate legal space. Near Batra Hospital,the bus stops are located on footpaths at a height of 900 mm, making thempractically inaccessible. People stand in the middle of the road to board thebuses. This increases friction with other modes and therefore, the accident risk.Legal parking spaces have not been created for cars, cycles or auto-rickshaws.The service road between Batra Hospital and Hamdard Nagar is choked withillegal parking. The stretch from Khanpur T-point to Vayusenabad is in a sim-ilar condition, with bus stops located on high footpaths and people waiting forbuses on the carriageway.
28
29
RIGHT OF WAY: AN ASSESSMENT OF SAFETY AND ACCESSIBILITY OF ROADS IN INDIAN CITIES
Crossings: The junctions and crossings are poorly designed. There are no traf-fic calming measures at junctions. The slip roads allow free turns to vehiclesmaking them unfavorable for cyclists and walkers. There is no provision of safecrossing for cycle users.
There are two foot overbridges near Sangam Vihar and the Hamdard campus.These overbridges force people to climb and walk much more than they wouldif they crossed the road at grade. High railings bar people from crossing wherethey need to cross. This leads to lot of unprotected crossing and increases theaccident risk.
CSE’s design solutionCentre for Science and Environment has piloted a design for the targeted stretch-es on this road to demonstrate that change is possible. The new conceptual designtakes into account the key elements of UTTIPEC Street Design Guidelines whichis the guiding legal document for road infrastructure in the city (see Box:Highlights from the Street Design Guidelines considered for the study).
Conceptual redesignThe new conceptual design has followed some fundamental principles. It hassegregated space for road users as much as possible, reorganised street activi-ties, provided more safe crossing facilities at grade; removed encroachments,provided space for key services of para-transit, provided legal parking, vendors,bus stops, etc; and freed up spaces to improve streetscaping and to createplazas and improved overall environmental conditions.
In doing so, the width of the carriageway has been kept the same and rest ofthe space has been reorganised to accommodate the maximum features. Thewidth of the footpaths has been kept at 2 m with a height 150 mm along thecorridor from Hamdard Nagar T-junction to Vayusenabad; for the rest of thecorridor till Khanput T-junction, the width is up to 2.5 m. The 2.5 m-widecycletrack can be provided only till Vayusenabad. In the rest of the corridor,there is space available. Traffic calming and slow speed are needed to keepcyclists safe in mixed traffic.
In the new scheme of things, proper signages and lighting have been pro-vided for the cycletrack and footpaths. The height has been maintained at150 mm to make it safe and convenient for people. Special consideration hasbeen given to safe crossings for pedestrians, by providing a mid-block table top and crossings after every 250 m. The intersections have been designed keeping walkers and cyclists in mind, and refuge islands have been provided. The provision of crossings every 250 m makes footoverbridges redundant.
It is proposed that the crossing near the Indo-Tibetan Border Police base beshifted behind Sangam Vihar to allow vehicles to turn easily and avoid conges-tion. But the bus stops have been retained, though they can be better equippedwith more seating spaces and public utilities for both men and women.
One of the key benefits of this conceptual rethink and reorganisation ofstreet activities is freeing up of about 7,000 sq m of space between HamdardNagar T-junction and Vayusenabad. This offers the opportunity to createpedestrian plazas, organise hawking and vending etc while improving overallaccessibility, safety and aesthetics.

30
HIGHLIGHTS FROM THE STREET DESIGN GUIDELINES CONSIDERED FOR THE STUDY While creating the new conceptual design of the stretch from Hamdard T-junction to Khanpur on Mehrauli-
Badarpur Road, CSE has kept in view the following parameters from the UTTIPEC guidelines:
• Complete segregation of pedestrian and cycle paths on all arterial and sub-arterial streets for safe move-
ment on road and across the intersection.
• Surface-level safe crossing (preferably every 200-250 m) at mid-block section with appropriate signals (pel-
ican/blinkers etc).
• All standard signages (informative/cautionary/warning etc) for all road users in and around intersections
with clear view for pedestrian/cycle/motor vehicle to be installed by removing all other non-traffic sign-
boards/ad boards etc.
• All other components/physical features for regulating the traffic like signals, streetlight poles etc to be
removed (accommodating/relocating trees to the extent possible) for a clear obstruction-free
walkway/footpath; all these can be relocated to the multi-function zone.
• All standard road markings (zebra/cycle crossing strip along the zebra at all the legs of an intersection, stop
lines, weaving section-changing lane, directionals etc).
• All standard signals with clear visibility and timer for motorists and pedestrians/cyclists for safe crossing of
pedestrians/cyclists and also to facilitate motorists to switch off their engines and save fuel.
• Traffic calming strips at all approaching signal points on intersections/mid-sections and major
merging/diverging points and entry/exit points of flyovers, with visible precautionary/warning signs for
lowering of speeds at 20 kmph (if the speed limit is > 50 kmph).
• All standard street lights at intersections, mid-sections, pedestrian/cycle corridors and bus stops: lux level
for the carriageway and walk/cycleways.
• All existing parked vehicles either occupying footpaths and/or carriageway to be removed for reclaiming
streets for movement of all vehicles and road users, including the elderly, disabled and children.
• On-street and off-street parking sites to be demarcated for providing short- and long-term provisions for
parking as part of the street design along with appropriate pricing, management and enforcement, but
only after ensuring provision of footpaths, cycletracks and multi-function zone as per standards and also
clear/smooth movement space on carriageway with clear lane markings all along the road.
• Heights of all footpaths along both sides of the road to be a maximum of 150 mm as per the guidelines,
including the bus stop height, to maintain continuity of smooth pedestrian movement. However, ramps
with standard disabled-friendly slope should be provided in all existing bus stops that are higher.
• Bus stops/bus boxes to be clearly marked with a bus lane at least 50 m on both sides of bus stops for buses
to dock on the defined bus box to facilitate easy boarding/alighting and to allow general traffic to move
on the carriageway.
• Multi-function zone to be provided as per the guidelines to accommodate all essential physical features on
the road including bus stops, on-street parking, cycle parking, toilets etc. At least 0.5 m strip and/or bollards
must be there between footpaths, cycle tracks and carriageways to prevent misuse by car parking.
• Boundary walls to be removed or made transparent all along the street or active street edges by provid-
ing/allowing vending stalls/zones all along the walls in the immediate vicinity of bus stops/stations etc to
ensure ‘eyes on the street‘ for women’s safety.
• Synchronisation of signals along corridors for safe mid-section surface crossings for pedestrians/cyclists.
• More direct pedestrian/cycle access: colony to colony and colony to bus stops.
• Network and parking plan: area-level integrated plan for organised parking spaces and more cycling/
pedestrian spaces.
H. Whither policy?A rapid review of existing policies and legislations in India indicates that thelegal framework to address the problem of road safety and vulnerability ofpedestrians and cyclists is very weak. The legal mandate is fragmented acrossdepartments, ministries and between Central and state governments.However, there are provisions in existing laws and policies which, if harmonised and effectively implemented, can help protect the vulnerable.
Yet safety mitigation is a much larger issue that requires interventions rang-ing from safety regulations for vehicles and users, protection of public andpedestrian spaces to protect other road users, and road and urban designguidelines to make infrastructure safe for people to use. But there is no singleumbrella legislation that addresses all these requirements comprehensively.The provisions are splintered and partial and do not make up the whole solu-tion. It is, therefore, important to look at the jigsaw of policies and legislationspiece by piece to understand the current status and the way forward.
National policies At the national level, policies of the Union ministry of road transport and high-ways and Union ministry of urban development have a bearing on road safety.In addition to this, the Indian Penal Code addresses the penalty and punish-ment for road accidents. All of them have their limitations and challenges thatneed immediate remedy.
The National Urban Transport PolicyNeeds teeth: The National Urban Transport Policy (NUTP), administered bythe Union ministry for urban development, addresses the requirements andsafety of walkers and cyclists. But it does not have strong legal teeth for com-pliance. The ministry must ensure that all transport infrastructure projectsthat are funded and planned under its aegis have explicit provisions for reduc-ing dangers in built environment. This can be done through design features,enforcement mechanisms, stringent policies for penalty and deterrence, andmandatory safety audits.
Under its Jawaharlal Nehru National Urban Renewal Mission (JNNURM)programme, the ministry is expected to give priority to the construction ofcycletracks and pedestrian paths in all cities and also support the constructionof safe pedestrian crossings at busy intersections and high traffic corridors.1
But this has seen very limited application. This scheme is now under review.But it is important that the future central funding mechanism for transportprojects is linked with road safety, safe infrastructure, road users’ rights, andwith action plans and timelines.
The National Urban Transport Policy will have to be strengthened tointergrate safety requirements for transport infrastructure from thepersepective of road users, and safety audits in its guidance for the state gov-ernments and ensure that these requirements are enforced. The policy has toexplcitly recognise the bearing of road engineering and urban design on thesafety of all road users and provide for solutions. But the ministry has notfocused on this.
31
RIGHT OF WAY: AN ASSESSMENT OF SAFETY AND ACCESSIBILITY OF ROADS IN INDIAN CITIES
NUTPmust realisethat roaddesign is thekey to roadsafety

The Motor Vehicles Act 1988 and Rules (1989)Needs effective enforcement, stringency and strong deterrence: This is the keynational legislation that makes rules for safety of motor vehicles and its use,safety enforcement and deterrence for accidents. It is administered by theUnion ministry of road transport and highways. However, this Act and theRules are largely oriented towards motorists’ safety, and cover issues such asvehicle safety guidelines, use of protective gears, seat belt provision, helmetsetc. They also focus on strategies for sane and controlled driving by limitingspeed and putting deterrents on dangerous driving, drunken driving, etc. Buteven this is not well enforced.
All state governments are guided by the procedures laid down in the CentralMotor Vehicles Act 1988 and Rules 1989 and the State Motor Vehicle Rules.Various sections of the Act deal with speed limits, driving at excessive speedand dangerously, safety measures for drivers and pillion riders and protectiveheadgear. The Central government can make rules for motor vehicles and trail-ers and include speed governors; safety belts, handle bars or motorcycles, auto-dippers and other equipment’s essential for safety of drivers, passengers andother road users; and standards of the components used in the vehicle asinbuilt safety devices. This can set speed limit and bar a person from leaving thevehicle in dangerous position. This Act essentially deals with the power of thelicensing authority that can disqualify a person from holding a driving licenseor revoke such license.
Rules for pedestrian protection not enforced: It is important to note that thoughthis legislation is oriented more towards motorists’ safety and is not explicitlydesigned to protect all road users, there are still some provisions in the Act thataccord passive protection to pedestrians. For instance, this Act bars motoristsfrom entering pedestrian space (footpaths or pavements). It states that no per-son in charge of a motor vehicle will park vehicle in such a position that itobstructs public place and cause danger and casue undue inconvenience. Thisis a powerful provision that can be immediately leveraged to protect pedestrianspace. But unfortunately, this is rarely enforced.
Weak penalty: Increasingly, the discussion is veering towards the need foreffective penalty and deterrent to move towards a zero tolerance policy. Mostprovisions of the MV Act provide powers to fix penalties, but most of themrelate to compoundable offences; this means the offending vehicle can be freedafter the payment of a fine. Only provisions like ‘Punishment relating to acci-dents’ under section 187 of the Act relate to non-compoundable offences andthe offenders are taken to court. Moreover, the fine under the current provi-sion, fixed way back in 1988, can be as low as Rs 100.
There is a range of penal action. The mechanism of enforcement also differs.Under Section 183 on speeding, an offender cannot be convicted solely on theevidence of one witness unless validated and recorded by a mechanical device.In Delhi, over-speeding has a compoundable penalty of Rs 360 and a subse-quent compounding amount of Rs 900. This needs to be made five times high-er. Racing is a compoundable offence with a penalty of only Rs 450.
Section 184 on dangerous driving attracts penalty and imprisonment, but itis ineffective without cameras and speed detectors. In Delhi, driving danger-ously is also a compoundable offence with a penalty of Rs 900 in the first
32
MVAhas the normsand rules, butthese are not
enforced

offence; the subsequent amount is Rs 1,800. Violation of stop line and trafficsignal is a compoundable offence with a fine of Rs 90, with a subsequent com-pounding amount of Rs 270.
Clause 187 provides for punishments relating to accidents: these could beimprisonment or fine or both. These may be extended to three months, or withfine which may extend to Rs 500, or with both. If the person has been previ-ously convicted of an offence under this section, the punishment is imprison-ment for a term which may extend to six months, or a fine which may extend toRs 1,000, or both. In Delhi, this is a non-compoundable offence and the perpe-trator is taken to court.
Anil Shukla, additional commissioner, Delhi Traffic Police, says onlyenforcement in terms of challans will not help as the system will get overbur-dened with an enormous number of non-compliances. For example, a camera-based drive to stop overspeeding for a month in only one junction near PragatiMaidan in Delhi had led to booking of more than a lakh of violators. Thesenumbers are beyond the capacity of the existing legal system for prosecution.The challenge, therefore, is not only about enforcement; it is also about havingstrong deterrent and collective will in the society, which demands muchstronger preventive action.
More specific strategies are being looked into to address overspeeding onhighways. Harman Sidhu, of the Chandigarh-based Arrive Safe Foundation,has moved the Punjab and Haryana High Court to take action against 185liquor shops on a stretch of 295 km along national highway-1 (NH-1) to pre-vent drunken driving. The High Court has ordered that these shops should notbe accessible or visible from the highways.
The Motor Vehicles (Amendment) Bill to amend the Act enhances penaltiesfor offences, and provides different penalties for first and subsequent viola-tions. Overall, an attempt has been made to propose revision of the penalty inthe MVA (see Table 2: Proposed changes to MVA to make penalties more strin-gent). But this has not been passed.
The Bill changes the method of awarding compensation for motor accidentclaims. If the fault of the driver is to be established, the claim is decided by thecivil court or the Motor Accident Claims Tribunal. If the claimant does not seekto establish the fault of the driver, compensation shall be based on the victim’sincome and age.
This is now being redrafted. The key focus areas include re-drafting of lawand amendments; stricter enforcement of laws and rules; improved safetymechanism in cars; cutting down on human intervention and more reliance onIT-based systems; installation of CCTV cameras at all traffic signals; repeatedoffender licenses to be suspended/cancelled; redesigning of heavy vehicles; andcentralising data to check misuse of driving licenses. Public transport vehiclesplying in all the cities with over 10-lakh population will be fitted with advancedGPS tracking system.
The Central Motor Vehicle Act also requires serious overhaul for moreeffective enforcement of safety rules and also protection of other road users.
National Road Safety Policy 2010Make it legally enforceable: To address road safety concerns, the government hasintroduced the National Road Safety Policy. The Union cabinet approved the pol-icy based on the recommendations of the S Sundar committee report on March 1,
33
RIGHT OF WAY: AN ASSESSMENT OF SAFETY AND ACCESSIBILITY OF ROADS IN INDIAN CITIES
Billamending MVAproposes different penalties andcompensationmethods, butit’s not been passed yet
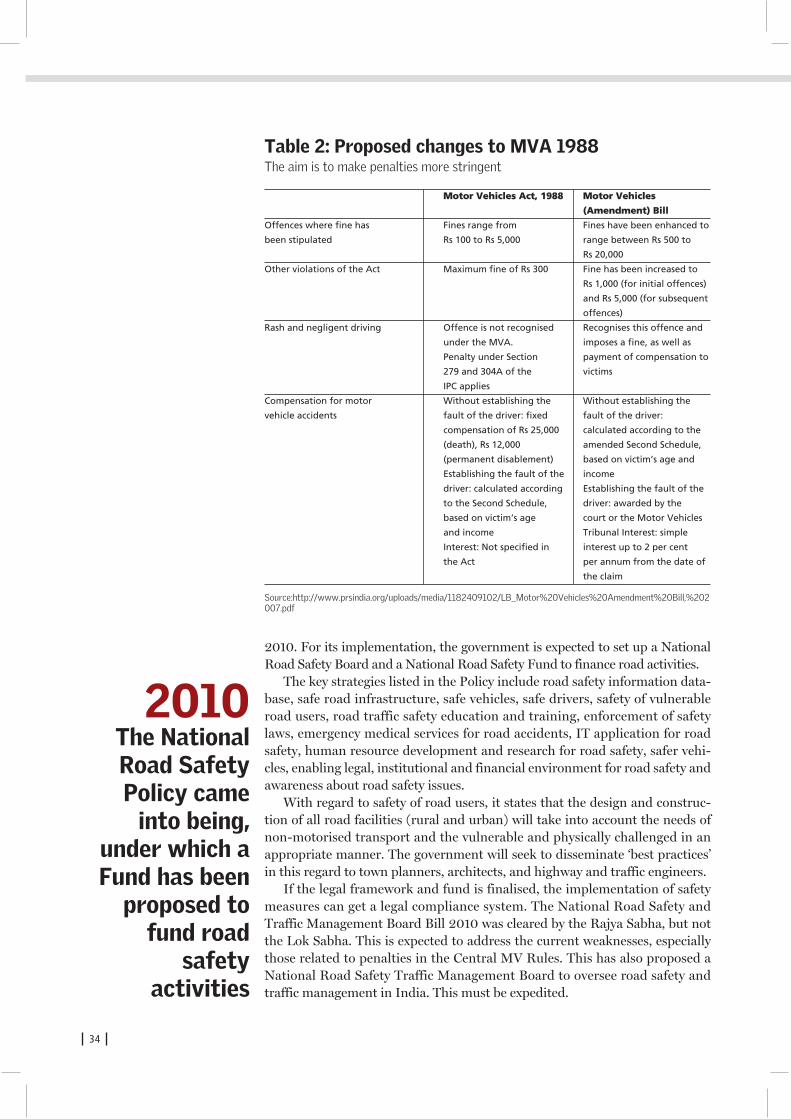
34
2010. For its implementation, the government is expected to set up a NationalRoad Safety Board and a National Road Safety Fund to finance road activities.
The key strategies listed in the Policy include road safety information data-base, safe road infrastructure, safe vehicles, safe drivers, safety of vulnerableroad users, road traffic safety education and training, enforcement of safetylaws, emergency medical services for road accidents, IT application for roadsafety, human resource development and research for road safety, safer vehi-cles, enabling legal, institutional and financial environment for road safety andawareness about road safety issues.
With regard to safety of road users, it states that the design and construc-tion of all road facilities (rural and urban) will take into account the needs ofnon-motorised transport and the vulnerable and physically challenged in anappropriate manner. The government will seek to disseminate ‘best practices’in this regard to town planners, architects, and highway and traffic engineers.
If the legal framework and fund is finalised, the implementation of safetymeasures can get a legal compliance system. The National Road Safety andTraffic Management Board Bill 2010 was cleared by the Rajya Sabha, but notthe Lok Sabha. This is expected to address the current weaknesses, especiallythose related to penalties in the Central MV Rules. This has also proposed aNational Road Safety Traffic Management Board to oversee road safety andtraffic management in India. This must be expedited.
Table 2: Proposed changes to MVA 1988The aim is to make penalties more stringent
Motor Vehicles Act, 1988 Motor Vehicles
(Amendment) Bill
Offences where fine has Fines range from Fines have been enhanced to
been stipulated Rs 100 to Rs 5,000 range between Rs 500 to
Rs 20,000
Other violations of the Act Maximum fine of Rs 300 Fine has been increased to
Rs 1,000 (for initial offences)
and Rs 5,000 (for subsequent
offences)
Rash and negligent driving Offence is not recognised Recognises this offence and
under the MVA. imposes a fine, as well as
Penalty under Section payment of compensation to
279 and 304A of the victims
IPC applies
Compensation for motor Without establishing the Without establishing the
vehicle accidents fault of the driver: fixed fault of the driver:
compensation of Rs 25,000 calculated according to the
(death), Rs 12,000 amended Second Schedule,
(permanent disablement) based on victim’s age and
Establishing the fault of the income
driver: calculated according Establishing the fault of the
to the Second Schedule, driver: awarded by the
based on victim’s age court or the Motor Vehicles
and income Tribunal Interest: simple
Interest: Not specified in interest up to 2 per cent
the Act per annum from the date of
the claim
Source:http://www.prsindia.org/uploads/media/1182409102/LB_Motor%20Vehicles%20Amendment%20Bill,%202007.pdf
2010The NationalRoad SafetyPolicy came
into being,under which aFund has been
proposed tofund road
safety activities

India Penal Code (IPC), 1860Road accident is a crime and attracts police action under the Indian Penal Code(IPC), 1860. The police in the states are responsible for enforcing the IPC. The sec-tions of the IPC that deal with road accident cases are 279, 304A, 336, 337 and338. These sections impose penalties or imprisonment as the case may be for caus-ing death by negligence, endangering life or personal safety of others, and causinghurt and grievous hurt. Most of the offences are bailable. Section 283 of the IPCdeals with danger or obstruction in public way and imposes a Rs 200 fine.
There is a strong demand now to make the punishment and penalty relatedto accident offences stringent. For instance, rash and negligent driving on apublic way should be made punishable with imprisonment for a term whichmay extend to six months, or with a fine which may extend to Rs 1,000, or withboth. For causing death by negligence or causing grievous hurt by endangeringlife, the offender should be punished with imprisonment for a term which mayextend to two years, or with a fine, or with both. The degree of stringency ofpenal action needs to be reviewed to ensure effectiveness.
Maneesh Chaudhary, senior superintendent of police of the ChandigarhTraffic Police, points out that the section which is evoked for motor vehiclesaccidents is Section 304 A, which makes it a bailable offence. The person isgiven bail on the spot if s/he has one surety available with her/him. The fine isa mere Rs 500. Thus, killing someone entitles the offender to a bail within aday or on the spot.
Even though the technology for surveillance and internet-based complianceis expected to gain ground in future, there is still a strong view the current sys-tem of challans and catching violators on roads with mechanical aids must con-tinue as this puts psychological and social pressure on violators. However, thereis also an opinion that internet-based surveillance and improvement of vehicledatabase can enable more effective action on violators. But its usefulness is stilllimited as often, addresses and contact details of drivers are not available withthe officials. There is also a view, as Dinesh Mohan of IIT Delhi propounds,that only increasing the fiscal penalty will not work as a majority of drivers inbuses, two-wheelers and cars are from low income classes. Therefore, linkingpenal action with cancellation of drivers’ license, barring them from driving etccan work better. At the same time, there has to be a strong focus on rigoroustraining coupled with incentives for safe driving.
However, the nature and severity of penal action and its enforcement underthe IPC needs a review and reform.
Implement existing laws effectivelySeveral laws and policies thus govern road safety requirements today. Thoughthey are not fully adequate, there are several provisions in existing laws thatprovide enough leeway to take effective action and to protect the infrastructurefor walkers and cyclists. But these are not implemented in the right spirit andwith effective deterrents.
The MV Act 1988 (Section 138) provides power to state governments tomake rules including “…prohibiting the use of footpaths or pavements bymotor vehicles; …prevention of danger, injury or annoyance to the public orany person, or of danger or injury to property or of obstruction to traffic…”,among others. It is left to the discretion of the state government to make ruleson prohibition.
35
RIGHT OF WAY: AN ASSESSMENT OF SAFETY AND ACCESSIBILITY OF ROADS IN INDIAN CITIES
IPCtreats roadaccidents as acrime andattracts punishmentand penalties,but these needto be mademore stringent
Section 122 of the same Act says that one cannot leave a vehicle in a positionthat can cause danger, obstruction or undue convenience. It says: “No person incharge of a motor vehicle shall cause or allow the vehicle or any trailer to beabandoned or to remain at rest on any public place in such a position or in sucha condition or in such circumstances as to cause or likely to cause danger,obstruction or undue inconvenience to other users of the public place or to thepassengers.” While the Act empowers in spirit, it is unclear which authority willenforce this provision.
The Central Motor Vehicle Rules (CMVR) 1989, in its Rule 15, saysmotorists must act correctly at pedestrian crossings which are not regulated bytraffic lights or traffic police, by giving preference to persons crossing the road.It also lays down that they must regulate speed to suit varying road and trafficconditions; anticipate the actions of pedestrians, drivers of other vehicles andcyclists; and show courtesy and consideration for the safety and convenience ofother road users.
Similarly, the IPC 1860 provides for danger or obstruction in public way orline of navigation (Section 283). Accordingly, ‘whoever, by doing any act, or byomitting to take order with any property in his possession or under his charge,causes danger, obstruction or injury to any person in any public way or publicline of navigation, shall be punished with fine which may extend to Rs 200’.The penalty is very low, but this provision can be effectively used to protectpedestrians and cyclists.
The Rules of the Road Regulations, 1989 include right of way for pedestri-ans at uncontrolled pedestrian crossings; motorists are not allowed to drive onor park on footpaths or tracks. While approaching a road junction or pedestri-an crossing, a motorist must slow down and stop at stop lines. But these provi-sions are not used effectively to remove encroachments and protect road users.It prevents parking on pedestrian pathways.
Clearly, effective implementation of current legal provisions can make a lotof difference.
Street design standards and guidelines need legalback-up for mandatory implementation The weakest link in the current laws is the lack of stringent legal framework toenable mandatory implementation of pedestrian- and cycle-friendly roaddesign. All road construction agencies follow the Indian Roads Congress (IRC)guidelines. These guidelines have been revised in 2011 to make them moreappropriate and sensitive towards vulnerable road users like walkers andcyclists. But these guidelines are mostly voluntary and can be bypassed orimplemented partially unless codified in the specific agreement with the con-struction agency.
If the Road Safety Policy, Safety Board and Fund come into force at theCentral level, then these design guidelines can be legally mandated. The Unionministry of road transport and highways needs to look into this immediately.
The IRC guidelines have now recommended that pedestrian facilities should be planned in an integrated manner so as to ensure a continuous pedestrian flow and reduce pedestrian conflicts with vehicular traffic to the minimum. A number of engineering solutions to improve thequality of the pedestrian network have been included. These take into accountthe needs of children, families with young children, elderly persons, persons
36
MVAallows state
governments to make
rules to stop motor vehicles
from using pedestrianpathways

with disabilities and people carrying heavy luggage for continuity, comfort and safety.
The revised guidelines have improved the specific design standards forpedestrian facilities that include guidelines for footpaths, kerbs, continuity andconsistency, tactile pavers, level changes, pedestrian crossings, ramps andsteps, elevators/lifts, multi-functional zones, street furniture, bollards, wash-rooms and toilets, school zone improvements, pedestrian facilities at parkingspots, pedestrian facilities at transit areas etc.
For instance, the guidelines have set improved norms for footpath surfacesto make them stable, firm, and slippage-resistant. They say footpath widthsshould be wide enough to accommodate pedestrian flow; obstructions shouldbe removed to give a clear walkway to the pedestrian; informal commercialactivities of informal sector must be integrated in the overall design of the foot-path facility by providing space for them. The footpaths must to be segregatedfrom roads, where fast moving vehicles ply. They have focused on safety andsecurity to provide for adequate street lighting and police patrolling during thenight time and sufficient activities in the surrounding areas to ensure safety.They have asked for climate-friendly features, pedestrian-friendly street furni-ture and improved walk environment.
The guidelines stress on road safety audit and pedestrian facility audits.These can help in reducing the number and severity of clashes by identifyingsafety issues and correcting them before projects are implemented.
Even though road building agencies are expected to follow these guidelines these are never implemented in totality and a great part of thedesign standards related to complete street design for improved accessibilityfor walkers and cyclists and universal access are ignored. It has, therefore,become necessary to mandate complete street design according to theimproved guidelines.
At the city level, Delhi has taken the lead to adopt street design guidelines.In 2009, the governing body of the UTTIPEC had approved the Street DesignGuidelines. This focuses on mobility and accessibility, safety and comfort, andecology. This requires design to create ‘eyes on the street’ by removing setbacksand boundary walls and building to the edge of the street, to allow people frominside to look out on to the pavement, thus discouraging misbehavior, shadycorners, etc.
Even though extensive and comprehensive guidelines have been created forDelhi, most of these are not implemented. It has therefore become necessary tomake its holistic implementation mandatory by notifying the guidelines underthe Delhi Development Act and make them a part of the Master Plan.
This will also require a lot of awareness raising and capacity building amongthe road building agencies. Sarvagaya Srivastava, chief executive engineerPublic Works Department, Delhi says: “The PWD is an implementing agencyand responsible for all engineering aspects. There has been a paradigm shiftnow as earlier the requirement of the footpaths was all need-based. But nowdesign has to be done by taking a holistic view and looking at every requirementand users; things are changing.” The PWD is trying to implement changes, buta multiplicity of agencies delays the projects.
Thus, immediate intervention is needed to create a holistic and integratedframework to take into all aspects of road safety to eliminate ‘danger’ fromroads for all road users.
37
RIGHT OF WAY: AN ASSESSMENT OF SAFETY AND ACCESSIBILITY OF ROADS IN INDIAN CITIES
Allroad constructionagencies followthe IndianRoads Congressguidelines
38
I. The way forwardThe only way Indian cities can avert a serious mobility and pollution crisis isby scaling up public transport along with walking and cycling. The DelhiMaster Plan, for instance, has set the target of increasing the share of publictransport to 80 per cent by 2020 (from the current share of 40 per cent).Several other cities have set similar targets. This would be possible only ifwalking and cycling are also scaled up to improve safe access to buses, Metrostations and other destination points. Almost every public transport tripbegins and ends as a walk trip. Even a 50 per cent increase in public transportridership will increase the demand for walking and will need significantexpansion of walking infrastructure. Moreover, safe infrastructure for walkingand cycling can help to convert large number of short-distance motorisedtrips into walking and cycling trips and reduce air pollution and carbon foot-prints enormously.
Unfortunately, the obsession with high speed, seamless, signal-free travelfor motorised vehicles through flyovers, expressways and elevated roads isincreasing safety risk and disrupting the direct shortest routes of walkers andcyclists. This is increasing distances and travel time for people and exposingthem to very high traffic friction and accidents.
Car parking and other encroachments are taking away space from people,exposing them to unsafe conditions. This can adversely affect public transportusage. It is a matter of concern that road engineering interventions once made cannot be changed easily — but it can permanently decide thedesign of the network and influence travel choices and safety of people. Thetime to act is now.
It is clear, that policies now need to focus not only on injury reduction, but also on reducing the danger that is being built into road infrastructure by design.
Reform the Motor Vehicles Act (MVA) and Rules for stringent penalty, reducespeed limit in cities to 30-40 km/hour and make penalties more stringent toachieve zero fatalities. The Motor Vehicles Act and Rules focus on vehicle safe-ty, seatbelt and helmet requirements, and speeding and drunk-driving laws.This can work effectively only with strong deterrence and stringent penalties.Align with global best practices, reduce the average traffic speed to 30-40km/hour to reduce speed differential between different modes and the severityof the friction, and make penalties more stringent.
Strictly enforce the existing provisions of the Central MVA that bar parkingand obstruction on pavements: The Act already has a provision that bars vehi-cles from being parked in public spaces. Enforce these clauses to protect walkspace and crossings. Make all forms of encroachment on footpaths (includingparking, extension of private gardens etc) punishable by law. This can beimplemented immediately by invoking the provisions of the MVA.
39
RIGHT OF WAY: AN ASSESSMENT OF SAFETY AND ACCESSIBILITY OF ROADS IN INDIAN CITIES
Notify the improved guidelines of the Indian Road Congress under a nationalact to make it mandatory across the country: This is needed urgently to legallymandate improved guidelines for street and road network development in aholistic manner. This should be backed by a comprehensive road safety actaddressing the safety of all road users, including the vulnerable ones such aspedestrians and cyclists. Similarly, notify the UTTIPEC street design guide-lines under the Delhi Development Act to make them mandatory. This shouldbe included in the Delhi Master Plan and be made the basis of approval of allroad network projects.
Introduce comprehensive road safety act to protect all road users: This actshould holistically address the issues of enforcement of safe road design, pro-tection of space of vulnerable groups, safe driving and penal action.
Pre- and post-construction road safety audits of roads must be made mandato-ry for all city-based road projects. This practice is currently in vogue for high-way projects, especially those that are funded by multilateral banks. This provi-sion should be developed and mandated for city roads as well.
Public transport plans must include pedestrian plans for multimodal integration.All cities are poised to scale up public transport plans and systems. This is anopportunity to integrate public transport with safe walking and cycling access.
Improve traffic surveillance and technology aids. Massive investments havebeen planned in Delhi as well as in several other countries in this area. These willhave to be effectively deployed to integrate with surveillance of traffic violations.
Enhance the capacity of enforcement agencies. Enforcement and implementa-tion agencies do not have adequate professional skills related to risk preventionand road design (to derisk cities). This will require training and awareness forskill building.
Implement measures to reduce automobile dependence. The ultimate solutionlies not only in designing roads and cities for making roads safe and reducingvehicle miles traveled, but also for taking additional measures to reduce automobile dependence.
References● Anon 2013, Global Status Report on Road Safety 2013: Supporting a decade of action , World Health Organization,
Luxembourg
● Anon 2013, Road Accidents in India 2012 , Ministry of Road Transport and Highways, Government of India, New Delhi
● Anon 2013, Accidental Deaths and Suicides in India 2012 , National Crime Records Bureau, Ministry of Home Affairs,
Government of India, New Delhi
● M. C. Mishra 2014, Director, All India Institute of Medical Sciences, New Delhi, May 26, personal communication
● Geetam Tiwari 2014, Planning and Designing Transport Systems to Ensure Safe Travel for Women , International Transport
Forum, Organisation for Economic Co-operation and Development
● Anon 2006, National Urban Transport Policy , Ministry of Urban Development, Government of India
● The Central Motor Vehicles Act, 1988 and Rules 1989, Ministry of Road Transport and Highways, Government of India
● The Motor Vehicles (Amendment) Bill 2012, Ministry of Road Transport and Highways, Government of India
● The India Penal Code, 1860
● The Rules of the Road Regulations, 1989
● National Road Safety Policy 2010, Ministry of Road Transport and Highways, Government of India
● Street Design guidelines, UTTIPEC, Delhi Development Authority
● Dinesh Mohan edited, 2013, Safety, Sustainability, and Future Urban Transport, IIT Delhi, Eicher
● New York Times, 2014, Matthew Chayes, NYC re-engineers traffic to prepare for 25 mph limit. July 20

Centre for Science and Environment41, Tughlakabad Institutional Area, New Delhi 110 062Phones: 91-11-29955124, 29955125, 29953394Fax: 91-11-29955879 E-mail: [email protected] Website: www.cseindia.org