AN ASSESSMENT OF PROGRESS IN SELECTED COUNTRIES … · · 2017-12-19An Assessment of Progress in...
231
IMPLEMENTING RESULTS-BASED BUDGET MANAGEMENT FRAMEWORKS AN ASSESSMENT OF PROGRESS IN SELECTED COUNTRIES ASIAN DEVELOPMENT BANK
Transcript of AN ASSESSMENT OF PROGRESS IN SELECTED COUNTRIES … · · 2017-12-19An Assessment of Progress in...

IMPLEMENTING RESULTS-BASED BUDGET MANAGEMENT FRAMEWORKSAN ASSESSMENT OF PROGRESS IN SELECTED COUNTRIES
ASIAN DEVELOPMENT BANK
ASIAN DEVELOPMENT BANK6 ADB Avenue, Mandaluyong City1550 Metro Manila, Philippineswww.adb.org
Implementing Results-Based Budget Management Frameworks An Assessment of Progress in Selected Countries
The use by governments of a results-based budgeting expenditure framework is well established around the world as a concept. However, its implementation as an analytical tool and policy driver is highly dependent on relationships that must be modelled with statistics. In this regard, there would appear to be significant gaps between concept and implementation. In order for governments to obtain clarity with respect to policy effectiveness and the assessment of bureaucratic effectiveness, a robust statistical framework must be developed to define outputs and outcome indicators. This publication examines a select group of countries that have led the foray into results-based budgeting and identifies weaknesses in their implementation from a statistical analysis perspective. It suggests some guidelines for the development of output descriptions, output indicators and outcome indicators, and provides a potential system for classifying output linkages to outcome groups and outcome indicators that might be easily identified through the classification of the functions of government (COFOG) expenditure classification system used today by most countries around the world.
About the Asian Development Bank
ADB’s vision is an Asia and Pacific region free of poverty. Its mission is to help its developing member countries reduce poverty and improve the quality of life of their people. Despite the region’s many successes, it remains home to a large share of the world’s poor. ADB is committed to reducing poverty through inclusive economic growth, environmentally sustainable growth, and regional integration.
Based in Manila, ADB is owned by 67 members, including 48 from the region. Its main instruments for helping its developing member countries are policy dialogue, loans, equity investments, guarantees, grants, and technical assistance.

ASIAN DEVELOPMENT BANK
IMPLEMENTING RESULTS-BASED BUDGET MANAGEMENT FRAMEWORKSAN ASSESSMENT OF PROGRESS IN SELECTED COUNTRIES
DECEMBER 2017

Creative Commons Attribution 3.0 IGO license (CC BY 3.0 IGO)
© 2017 Asian Development Bank6 ADB Avenue, Mandaluyong City, 1550 Metro Manila, PhilippinesTel +63 2 632 4444; Fax +63 2 636 2444www.adb.org
Some rights reserved. Published in 2017.
Publication Stock Number: TCS179179-2ISBN 978-92-9261-044-9 (print), 978-92-9261-045-6 (electronic)DOI: http://dx.doi.org/10.22617/TCS179179-2
The views expressed in this publication are those of the authors and do not necessarily reflect the views and policies of the Asian Development Bank (ADB) or its Board of Governors or the governments they represent.
ADB does not guarantee the accuracy of the data included in this publication and accepts no responsibility for any consequence of their use. The mention of specific companies or products of manufacturers does not imply that they are endorsed or recommended by ADB in preference to others of a similar nature that are not mentioned.
By making any designation of or reference to a particular territory or geographic area, or by using the term “country” in this document, ADB does not intend to make any judgments as to the legal or other status of any territory or area.
This work is available under the Creative Commons Attribution 3.0 IGO license (CC BY 3.0 IGO) https://creativecommons.org/licenses/by/3.0/igo/. By using the content of this publication, you agree to be bound by the terms of this license. For attribution, translations, adaptations, and permissions, please read the provisions and terms of use at https://www.adb.org/terms-use#openaccess
This CC license does not apply to non-ADB copyright materials in this publication. If the material is attributed to another source, please contact the copyright owner or publisher of that source for permission to reproduce it. ADB cannot be held liable for any claims that arise as a result of your use of the material.
Please contact [email protected] if you have questions or comments with respect to content, or if you wish to obtain copyright permission for your intended use that does not fall within these terms, or for permission to use the ADB logo.
Notes: In this publication, “$” refers to US dollars. Corrigenda to ADB publications may be found at http://www.adb.org/publications/corrigenda
Printed on recycled paper
Contents
Figures and Tables v
Acknowledgments vi
Abbreviations vii
Executive Summary viii
1 Background of Results-Based Budget Management 1
Introduction 1Goals of Public Financial Management Reform 4Brief History of Budget Reforms 5Sequencing Reforms 7
2 Results-Based Budget Management 9
Results-Based Budget Management Logic Model 9Analyzing Data 10Results-Based Budget Management Business Model 13Output versus Outcome Budgeting 15Technical Efficiency versus Allocative Efficiency 17
3 Transparent Reporting of Results 19
Introduction 19Data Management 23Steps to Implementing Reform 32
4 Case Studies on the Current Status of Results-Based Budget Management 33
Introduction 33Australia 34Canada 38Indonesia 39Malaysia 41New Zealand 43Philippines 45Singapore 47United Kingdom 49Summary 50

iv Contents
5. Government Bureaucracies: Their Nature and Impact on Results-Based Budget Management Reforms 52
Introduction 52The Principal−Agent Problem 54 Impacts of Dispersion of Responsibility for Organizational and Human Resources Development 56Disparate Interpretations and Understanding of the Logical Framework 57
6. Summary and Recommendations 60
Appendixes
A1 Program Budgeting 62A2 Medium-Term Expenditure Frameworks 75A3 Aligning the Classification of Government Functions to an Outcome Classification
Structure 78A4 Common Outputs and their Performance Indicators 92A5 Templates for Capital Budget Proposals 96A6 An Outcome Classification System with Outcome Indicators 111A7 Criteria for Assessing Results-Based Budgeting Management Proposals 197A8 Documents Consulted for Country Cases 201
References 211

Tables and Figures
Tables
1 Reporting Performance Data in Budget Documents 212 Presenting Outputs According to Outcomes 213 Possible Appropriations Layout 224 Implementing Reform—Some Practical Steps 325 Department of Finance Annual Report 2013/2014, Extract from Table 1, p. 35 386 Sector Leadership and Support 45A1.1 Hierarchy of Objectives 67A1.2 Reformulating Program Objective Descriptions 68A1.3 Option 1—Crosscutting Program Allocated across Programs 73A1.4 Option 2—Crosscutting Programs Retain their Individual Identities 73A3 Translating Functions of Government into an Outcome Structure 79A4.1 Output Type Classifications (Example) 92A4.2 Determining the Performance Indicator Description of a Common Output (Example) 94A4.3 Provision of Technical Advisory Services Standard Description and Performance Indicators 94A4.4 Provision of Legal Advisory Services Standard Description and Performance Indicators 95A4.5 Provision of Management and Administrative Support Services Standard Description
and Performance Indicators 95A4.6 Provision of Internal Audit Services Standard Description and Performance Indicators 95
Figures
1 Fitting Performance-Based Budgeting Reforms to the Annual Budget Cycle 72 The Ex Ante Output−Outcome Relationship 93 Estimating Ex Post the Beta Correlation Coefficient 124 Results-Based Budget Management Business Model 145 Canadian Whole-of-Government Outcomes Framework 306 Characteristics of Australia’s Results-Based Budget Management Implementation 377 Characteristics of the Canada’s Results-Based Budget Management Implementation 398 Characteristics of Indonesia’s Results-Based Budget Management Implementation 409 Characteristics of Malaysia’s Results-Based Budget Management Implementation 4210 Characteristics of New Zealand’s Results-Based Budget Management
Implementation 4411 Characteristics of Philippines’ Results-Based Budget Management Implementation 4612 Singapore’s Outcome Classification Structure 4813 Characteristics of Singapore’s Results-Based Budget Management Implementation 4814 Characteristics of the United Kingdom’s Results-Based Budget Management
Implementation 50A1.1 Program Budgeting Levels 64A1.2 Three-Layered Program Structure 65
Acknowledgments
Peter Fane, consultant, wrote this report under the supervision of Claudia Buentjen, principal public management specialist at the Thematic Advisory Service Cluster, Sustainable Development and Climate Change Department. Warren Turner, senior public management specialist, peer-reviewed the document. The project team greatly appreciates the strong support and inputs provided by the Governance Thematic Group Committee and Network. Thanks are also due to Jill Gale de Villa, editorial consultant; and Josephine Jacinto-Aquino, Ethyl Bulao-Lorena, and the staff of the Department of External Relations for their support in producing this report.

Abbreviations
ADB Asian Development Bank
ANAO Australian National Audit Office
COFOG classification of functions of government
DOF Department of Finance
IMF International Monetary Fund
IT information technology
MTEF medium-term expenditure framework
NPM New Public Management
OBB outcome-based budgeting
OECD Organisation for Economic Co-operation and Development
PBB performance-based budgeting
PBPB performance-based program budgeting
PFM public financial management
RBBM results-based budget management
UK United Kingdom
US United States
Executive Summary
Results-based budget management (RBBM), or new public management (NPM), has been the flavor of the month for at least the last 2 decades with many Organisation for Economic Co-operation and Development (OECD) member countries and development partners. However, there seems to be a significant gap between the rhetoric surrounding the potential benefits of RBBM and the effort and rigor with which principles have been adopted and applied. Responsibility for a significant part of the failure to implement appropriate RBBM structures may be due to the assumption that RBBM is more or less similar to corporate planning, which is far from the truth.
RBBM is intended to hold managers to account for their role in organizing the supply of goods and services to the public, and to enforce a regular review of the purported effectiveness of government expenditure programs in delivering desired outcomes for the community. RBBM is intended to introduce evidence-based evaluation of government interventions through the association of financial expenditures with the delivery of physical outputs, which themselves are purported to deliver intended changes in society that can be measured through changes in outcome indicators. The changes in outcome indicators attributable to government interventions (i.e., the outputs of government) can be termed “impacts” of government interventions.
However, to measure the efficiency of output delivery and the effectiveness of government interventions (outputs) in effecting outcomes, as measured by outcome indicators, requires the specification of comprehensive sets of output performance indicators, which must then be linked to outcome indicators.
RBBM or NPM should exist within a highly structured data classification framework, designed to support the collation and correlation of relevant statistics. The two critical components of an RBBM system are outputs and outcomes and their associated statistical indicators, and yet no country seems to have developed a standardized nomenclature system for either outputs or outcomes, or implemented a system to classify outcomes or outputs and their statistics—which must span all government expenditures.
This is in contrast with classification systems previously developed as part of government financial statistics detailing aspects of financial expenditure such as economic types, functions of government, and line item accounts. The proponents of RBBM and NPM either did not appreciate the necessity of the statistical framework or were not sufficiently supported in their efforts to establish one. In any case, many of the consultants who proceeded to disseminate the good word of RBBM failed to appreciate the need to invest time, firstly, in defining the statistical framework and supporting information technology (IT) systems before proceeding to implementation across government agencies. Even the approach to identifying outputs and outcomes across agencies has, in almost all cases, proceeded in a haphazard and unstructured manner. Only in recent years have some countries realized the importance of developing a structured classification framework but, even then, the frameworks developed lacked rigor. The outcome classification frameworks that Canada and Singapore developed, as presented in this paper, do not properly span all government expenditures and are potentially unstable over time. An alternative outcomes classification framework in Appendix 3 is based on the classification of functions of government (COFOG) standard developed by the United Nations, OECD, and the International

Executive Summary ix
Monetary Fund (IMF), among others. Shown in Appendix 6 is an indicative classification of outcome indicators that has used the COFOG structure as a general starting point for building an outcome indicators classification system.
This report discusses the implementation of RBBM frameworks in the context of national budgeting, but does not examine the extent to which countries have used their frameworks to make meaningful decisions. Unless implementation has been appropriate, fit, and proper, the RBBM framework cannot hope to deliver data that can be used to support and guide decision makers to the appropriate policy choice.
This report examines the extent to which the fundamental structural elements of frameworks put in place in selected countries conform with certain desirable traits, because this is a significant determinant of the probability that the framework can be put to good use in a practical sense. In this context then, this report is simply an assessment of the RBBM frameworks put in place to assist in the national budgeting decision-making processes, where the assessment is conducted against certain business principles upon which the introduction of RBBM and the NPM models are based.
The quality of the implementation of the framework elements also significantly determines the usefulness and appropriateness of the analysis and conclusions derived from using the implemented framework. Therefore, the quality of the framework structure and elements are the fundamental determinants of the successful use of the RBBM framework in a national budgeting context.
As recognized in the presentation by S. P. Lim to the National University of Singapore−World Bank Institute East Asia Urban and City Management Course in May 2000: “…the basic concepts and principles [of promoting operational efficiency, and accountability for good governance] are quite universal.”1
While accrual accounting is, in the medium to longer term, a fundamental element of a fully functioning RBBM framework, this report does not assess accrual accounting as part of the implementation of the RBBM frameworks of the selected countries, primarily because the performance measurement of government interventions may be initially introduced at a meaningful level without the concurrent introduction of accrual accounting, and few countries have introduced full accrual accounting in government.
Nor does the report discuss performance-based remuneration of staff, except to note that both literature and practice indicate conflation of corporate planning and organizational management concepts with national RBBM concepts. While a cascading linkage of the national RBBM concepts to corporate planning and remuneration concepts is desirable, it is beyond the scope of this report to discuss how this should be done to ensure the practical use and application of the RBBM performance concepts.
For this report, the term “RBBM” refers to the general approach to budgeting that uses performance indicators to assist in defining the delivery of outputs produced by an agency, and outcome indicators to measure the progress toward achieving outcome goals, which encompasses performance-based budgeting or any other term devised to describe a form of budgeting that uses performance indicator concepts to measure the delivery of government outputs and the extent to which the objectives of government interventions are achieved.
1 S. P. Lim. 2000. Towards Good Governance: Promoting Operational Efficiency and Accountability. Presentation at National University of Singapore−World Bank Institute East Asia Urban and City Management Course. 1−14 May.
x Executive Summary
A swathe of papers has been written about the use of performance information in both the development and analysis of government budgets. The papers seek to enlighten their audiences on using performance information in a government budget context. However, misconceptions of the conceptual foundations underpinning RBBM and its practical implementation across government organizations remain widespread.
Terminology varies from one author to another and authors often fail to distinguish corporate planning and internal management concepts from national budgeting and planning, which should be treated as quite distinct, albeit complementary, subjects.
The conflation of internal management issues (in particular personnel performance measurement, and short-term corporate planning concepts, such as “key result areas” or “strategic result areas”) with the longer-term concepts required for national budgeting and public reporting purposes has created confusion and consequent ambivalence toward performance budgeting among bureaucrats, for good reason. Corporate planning for internal management purposes has a very different audience, function, and analytical requirement from RBBM for government and should never be discussed as a single topic. Corporate planning must integrate with RBBM concepts, particularly for delivery of outputs in terms of service delivery standards of quantity, quality, timeliness, and cost. However, corporate planning and RBBM have their own complexities and are complementary, not unitary.
Currently, there are many poorly conceived interpretations of not only RBBM but even program budgeting and the concept of a medium-term expenditure framework (MTEF). Many discussion papers and guidelines published with the authoritative support of supranational institutions have lent credibility to those misconceptions.
This report finds that most if not all countries have often failed to realize the intended benefits of RBBM, primarily due to compromised implementation of the RBBM business model. Progressive implementation of RBBM has been impeded by factors, including
(i) inappropriate output descriptions, perceived to be largely caused by failure of some public servants to comprehend, or value, the outputs that they produce, instead focusing on concepts of tasks or projects to be completed within a fixed time frame;
(ii) inappropriate specification of service delivery standards, or output performance indicators, partly as a consequence of (i) above, but also because of inexperience in understanding the importance and consequences of defining appropriate performance indicators;
(iii) inappropriate and inadequate specification of outcome indicator descriptions and targets, again most likely because of inexperience and a lack of understanding of the importance and consequences of applying rigorous standards to descriptions and definitions;
(iv) a lack of appreciation at the executive management level of the importance to strategic management decisions of having a relatively highly structured performance indicator and outcome indicator linked framework and a supporting data management system; and
(v) partly as a consequence of (iv) above, a failure by central agencies to impose a strict data management and quality control protocol to the definition of outputs, outcomes, and their associated performance indicators and outcome indicators.
Most, if not all, countries that led the introduction of RBBM are still struggling to realize anticipated benefits, and some have fallen behind in both transparency and efficacy.

Executive Summary xi
The introduction of output and/or outcome budgeting was supposed to address the inefficiencies that are found in government organizations due to the absence of an explicit equity owner. The lack of an equity owner may also be why a destructive element has permeated the intellectual foundations proposed as part of the original concept underpinning output budgeting. Instead, the leading developed countries’ RBBM systems have mostly deteriorated, becoming second-rate governance structures.
As K. MacKay notes in his assessment of the Australian monitoring and evaluation system:
“The system took considerable effort and time to build—as did [the Department of Finance’s] budget estimates and policy advising expertise. But it took much less time to degrade these functions. Current efforts to renovate government evaluation can also be expected to require significant effort and to be time-consuming.”2
A review of some of the OECD member countries that have pursued budget frameworks more heavily dependent on performance indicators suggests that few, if any, practiced a logically rigorous implementation of RBBM, including Australia, Canada, New Zealand, the United Kingdom (UK), and the United States (US).
Sequencing Reform Initiatives in Planning and Budgeting
Reform initiatives generally follow a process that includes the introduction of program budgeting, then either performance-based program budgeting (PBPB) followed by a forward estimates process, or vice-versa, then an MTEF and, lastly, output budgeting and outcome budgeting, referred to here as RBBM.
The introduction of forward estimates and MTEF processes do not require a significant cultural shift within civil service bureaucracies, although if processes are to be embedded in the annual budgeting cycle in a sustainable way, they require an investment in computerized systems and significant training of staff. If implemented as intended, forward estimates and MTEF provide significant gains in analysis and integrity of budget processes, and significant efficiency gains for the budget process.
Each of these reforms brings a different quality to the budgeting process. Program budgeting provides a useful budgeting system that facilitates activity-based costing and alignment of organizational responsibilities with accountability for delivery of budgeted programs. PBPB provides a useful bridge between program budgeting and RBBM.
The introduction of forward estimates assists in the budget planning process and streamlines budget preparation. The introduction of an MTEF provides an enhanced fiscal discipline element to the budget process, which also assists in planning with respect to allocation of available fiscal space across government’s policy priority areas. Forward estimates and MTEF are not RBBM-focused reforms, nevertheless, they facilitate a superior planning environment and thereby assist to provide a foundation for effective RBBM implementation.
2 K. MacKay. 2011. The Australian Government’s Performance Framework. Evaluation Capacity Development Working Paper No. 25. Washington, D.C.: World Bank. p. 29.

xii Executive Summary
The Results-Based Budget Management Business Model
Output budgeting introduces a business model to budgeting intended to strengthen organizational accountability and improve efficiency. It is not intended to enhance performance-based remuneration of staff, although the service delivery standards associated with outputs must be integrated into the process for determining the strategies embedded in the annual corporate plan to improve organizational performance, and may provide data to support the performance-based remuneration of staff.
The achievement of government’s socioeconomic goals, or outcome objectives, is the aim of all government interventions. Government interventions take the form of outputs, delivered by government ministries and agencies to the general public (although some outputs are considered to be delivered to the political or parliamentary arm of government, or the president, as the case may be, depending on the notional relationship between an agency and the political entity to which they provide services). The key attribute of a ministerial or agency output is that it is delivered to a client that is external to the ministry or agency.
Linking the delivery of outputs to the achievement of outcomes is analogous to the private sector’s production of outputs with the goal of a maximum return on equity (profitability). A representation of the RBBM business model is in Figure 4 of the main text. In the case of government, the notion of maximizing private profit is replaced by the notion of maximizing public welfare, as represented by outcome indicator targets.
RBBM demands from bureaucrats and politicians at central agencies and line agencies a major lateral shift in attitudes and mindset. Data management systems and budget preparation and monitoring systems and procedures must be revised significantly, and the critical importance of centralized data management and quality control cannot be overemphasized. The importance of this aspect of RBBM is overlooked or underestimated in every jurisdiction. As noted by Dormer and Gill:
“Whilst public sector organisations have developed increasingly sophisticated performance measurement systems, concern exists that the espoused theories of public management embodied in these systems do not reflect the systems actually used in organisations.”3
Central Agency Staff and Experience
The private sector is perfectly capable of providing each good or service provided by public sector bureaucracies, including regulatory and policy advice related to market failures, externalities, and tax collection. The desire to establish a government bureaucracy is not brought about by the private sector’s inability to provide these services, as some bureaucracies seem to believe, but by the need for government to receive “frank and fearless” advice that is, as far as possible, independent of vested commercial interests and impartial to political viewpoints.
The RBBM framework and the NPM were devised as a way of introducing the management disciplines of the private sector into the public sector environment, and treating government outputs in the same way as if they were produced by the private sector—an entirely reasonable proposition. Unfortunately, the lack of appropriate or relevant experience in operating in a business environment among key
3 R. Dormer and D. Gill. 2009. Managing for Performance in New Zealand’s Public Service—A Loosely Coupled Framework? Wellington: Victoria University. p. 2.

Executive Summary xiii
bureaucratic and political actors as stakeholders has undermined implementation of the business model in many countries.
Many key central agency staff lack experience and appreciation of the business model and issues surrounding the collection of nonfinancial data and reporting of performance indicators.. Thus, central agencies lack appreciation and understanding of the day-to-day issues involved in output delivery, data collection, data classification, data storage, data retrieval, and database management protocols with respect to nonfinancial data. Central agency staff must change their attitudes for two important reasons:
• First, central agency staff are rarely involved in commercial transactions on behalf of government, whereas both procurement and supply of goods and services is more widespread in spending agencies and involves day-to-day interaction with suppliers and clients from the private sector. This necessitates the development of skills in negotiating performance clauses in supply contracts that deal with quantity, quality, timeliness, and cost performance indicators. The principles applied to commercial transactions are fundamental to understanding the basics of RBBM. Unless central agency staff can acquire a skill set similar to those in line agencies, they will be at a significant disadvantage when negotiating service delivery standards for the outputs they fund through the line agencies.
• Second, central agencies do not have significant experience in reporting socioeconomic indicators for their outputs, at least not in the same way as, for example, the health or education agencies, which have a long history of measuring their performance using socioeconomic statistics and operational data.
Therefore, central agency staff are less familiar with the practical issues that must be addressed when institutionalizing RBBM, which is based on statistical measurement of both financial and nonfinancial aspects of public policy.
In the case of Australia, for example, staff turnover in the Department of Finance (in the name of budget savings and efficiency gains) resulted in a significant loss of corporate knowledge in data management and relevant database management protocols. Contrast this with Canada, which appears to have understood the importance of information technology in the management of performance data and, at least at face value, invested significantly in developing data management standards and protocols related to performance data and indexing information to enhance accessibility.
Based on a review of budget documents from the various jurisdictions and discussions with practitioners, the most important change is attitudinal, even more so among central agency staff than sector agency staff.
Importance of Quality Assurance and Database Management
The major problems all countries face when introducing RBBM are traced to fundamental issues related to the introduction of systems heavily dependent on statistics and, therefore, requiring rigorous data classification, management, and storage standards, as well as a rigorous quality assurance function for data aggregation and accumulation.
The logic models and associated guidance issued by jurisdictions examined here are reasonably sound and well constructed, although inconsistencies and confused terminologies remain, in varying degrees. However, most, if not all, jurisdictions have failed to introduce sufficiently rigorous or appropriate

xiv Executive Summary
quality assurance processes during the implementation period of RBBM systems. The business model was not embedded in the resulting systems. Many jurisdictions failed to recognize the importance of building a centralized database within which data can be accessed according to stable coding and data classification standards consistent with the theoretical model.
The results are
(i) output and outcome descriptions or definitions can be inappropriate, resulting in poorly defined performance indicators at both the output and outcome levels and, therefore, poor reporting information that is verbose and obfuscatory; and
(ii) output and outcome definitions and their associated performance indicators can be unstable from one period to the next, preventing trend analysis and correlation analysis.
The failure to appreciate the critical importance to nonfinancial data of data classification and storage standards might be due to the central agency staff’s lack of experience in dealing with nonfinancial statistics, particularly where those performance indicators should reflect a business-operating environment consistent with the RBBM business model in Figure 4 of the main text. The business model requires a significant mindshift away from the administrative-focused control of the traditional central agency bureaucrat toward the use of performance parameters to enhance transparency and create control boundaries in line agencies.
Leadership and the “Challenge” Function of Central Agencies
The other area where public service has failed the business model implied by output and outcome budgeting is the lack of rigorous and dynamic leadership from the center. It is anathema to common sense that line agencies, given the funding they receive, should be solely, or even mostly, responsible for defining the outputs they produce, along with the outcomes they pursue and the service delivery standards performance indicators by which outputs should be measured.
Only rarely in public financial management would line agencies be allowed to obtain funding for a particular program of expenditures without challenge from one or more of the central coordinating agencies as to the merits of the proposal and the results, or outcomes, it is expected to deliver. In our private lives, we would never allow a retailer to dictate to us the product they are selling to us for a given price, or the quantity, quality, or timeliness with which it is to be delivered.
Unfortunately, this “hands-off” approach to specifying critical elements of the RBBM business model is widespread among the countries examined. Central agencies allowed line agencies much freedom to define their outputs, outcomes, and associated performance indicators. An examination of the central agencies’ own outcomes and outputs suggests that in some countries the central agencies themselves do not fully understand the RBBM business model (the alternative to which is that they deliberately obfuscated their own accountability).
This resulted in unstable output and outcome definitions and undermined the integrity of the RBBM business model. As noted by Dormer and Gill:
“The ‘new paradigm for the administration of public affairs’ …was developed largely by practitioners… from a theoretical framework drawn from new institutional economics including agency theory and transactional cost economics. It was also heavily influenced by private sector, practitioner based models generically referred to as ‘managerialism.’ This ... has resulted in an increased emphasis in the public sector

Executive Summary xv
on performance and results….However,…these private sector practices are premised on a set of clear and mutually compatible objectives that are first defined and then translated into a limited set of agreed performance targets. In a public sector context, in the absence of a singular performance metric such as profit…and clear and stable priorities and objectives…defining, monitoring, and managing such targets has proved problematic.”4
Clearly, the central agencies have a critical role in implementing the RBBM business model and in determining
• how an output is described; • the standards by which output service delivery would be measured; and • agreeing on the extent to which the funding provided should achieve some change in one or
more socioeconomic statistics (outcome indicators), based on the assumed cause–effect relationship between the output and the outcome(s) sought.
These questions are fundamental to the role of every central agency in both the planning and funding of government interventions. To suggest that the central agencies should not be closely involved in determining the descriptions, definitions, and performance indicators would be to abrogate the historical primary role of central financing agencies to challenge the integrity of all revenue and expenditure policy proposals.
Corporate Management versus Results-Based Budget Management
Within any service delivery organization, once the central financing (“procuring”) agency has agreed to the targets for the outcomes and outputs with the supplying organization, there must be a system of management by performance measurement that cascades down to the process and input levels.
Unfortunately, there is confusion at the national RBBM level between organizational corporate planning concepts, which should focus on the lower level strategies; work unit process performance indicators and organizational outcomes; and the higher-level national planning concepts, which should encompass a stable set of organizational outputs and a stable set of associated national-level outcomes and outcome indicators.
Conclusions
Most countries that led RBBM reform have a long way to go before they have efficiently functioning RBBM systems. This conclusion is supported by the findings of the Supreme Audit Institutions (also known as the International Organization of Supreme Audit Institutions) in a number of countries, which expressed disappointment with current results. Canada may be an exception, but it too has some way to go before its RBBM system can be described as a comprehensive working framework.
While many shortfalls in implementing such a significant (some might even say radical) reform initiative as RBBM are likely in the short to medium term at least, the shortfalls could be expected to be overcome after 20 or more years of implementation with continuous improvement processes. That is not the case for the countries examined here. On the contrary, some countries’ RBBM systems appear to have seriously regressed.
4 Footnote 3, p. xii.

xvi Executive Summary
The main point of this comparative analysis is that developing countries are not far behind the pioneers in their RBBM frameworks, primarily because the pioneers have not successfully implemented their RBBM and have regressed in many cases because they fail to realize the intended benefits of a properly implemented, rigorous performance management framework.
Some reforms that could minimize the risk of having a sound RBBM business model founder during or after implementation include the following:
• establishing an overarching outcomes classification framework that can be used to correlate outcome indicators across organizations and across multiple unique outcome descriptions;
• establishing an outputs classification system that facilitates benchmarking and comparative analysis across agencies;
• establishing standardized output service delivery performance indicator classes (quantity, quality, timeliness, and cost) for all outputs;
• establishing simple reporting structures that inform the public on performance trends in both output delivery and outcome achievement;
• establishing centralized quality control mechanisms to ensure consistent implementation of concepts across a diverse range of organizations and people;
• establishing supporting IT infrastructure along with data management protocols; and• firm leadership within central agencies, not only from the top but also cascading to middle
management.
Countries with an outputs and outcomes structure could consider a top-down review by a team of external consultants capable of objectively assessing the government agencies, and developing a clear set of output descriptions and appropriate service delivery performance indicators. The targets for revised performance indicators would be determined by agreement between the output-producing agency and the central financing agency based on a given level of funding.
Once a set of outputs and performance indicators are agreed between stakeholders, an appropriate outcomes structure can be developed for the entire government, which can facilitate analysis of cross-agency participation in achieving common outcome goals as reflected by changes in outcome indicators.
The sections that follow first discuss some of the key public financial management reform initiatives introduced in the last 60−70 years leading to the introduction of RBBM. This report then focuses on the implementation of RBBM and some of the issues when introducing a business model into the typical public service bureaucracy. The report defines some of the characteristics that a well-structured RBBM framework demands, which is then followed by a review of RBBM implementation in Australia, Canada, Indonesia, Malaysia, New Zealand, the Philippines, Singapore, and the UK, measured against those standards.

1
Introduction1
The most important sequencing of reform actions needed to introduce results-based budget management (RBBM) across government organizations is
(i) first, identify appropriate output descriptions for each organization, based on their existing programs of expenditure;2
(ii) second, identify appropriate service delivery performance indicator descriptions for each output description, covering quantity, quality, timeliness, and cost (which must be tailored to specific circumstances whether cash or accrual accounting is used);
(iii) third, identify a stable set of outcome descriptions, preferably aligned, to a greater or lesser extent, with the division and group levels of the classification of functions of government (COFOG);
(iv) fourth, identify a limited number of outcome indicators under a COFOG-aligned outcome classification to which each of the organizational outputs will be correlated;
(v) fifth, associate each organizational output with one or more of the outcome indicators; and
(vi) last, create the accounting associations from the base budget3 to the organizational outputs (i.e., using cost accounting methods).
RBBM should not be confused with the so-called New Public Management (NPM), which focuses on the New Zealand form of RBBM.4 The NPM incorporates aspects of public financial management (PFM) not necessary for all forms of RBBM.
For example, formal contracts or agreements, such as the Purchase Agreement Contract in New Zealand between a minister and the chief executive officer of their agency, is not a necessary part of any
1 The terms “ministry,” “department,” or “agency” are used throughout this document, which equally refer to, say, “the Department of Finance,” “the Office of Budget and Management,” or any other budget-dependent agency by whatever nomenclature they might be referenced. “Ministry,” “department,” or “agency” should be taken to mean a government agency, however named, that carries responsibility for delivering outputs funded by a government.
2 This is not to say that a program budget is required. Even line-item budgeting has its informal “programs” of expenditures. Cost accounting experts, in consultation with stakeholders, are needed to identify what outputs are being funded through the line items.
3 Be that a program budget, a line-item budget, an organizational unit budget, or any other arrangement based on a cash or accrual accounting system.
4 The NPM implemented in New Zealand takes a step toward linking RBBM to performance-based remuneration of organizations by requiring the chief executive or head of agency to sign a performance contract with the government of the day, which sets out the performance indicator targets for delivery of organizational outputs. It does not, however, translate directly to a system for performance-based remuneration of staff, nor does it provide any starting point for quantifying a performance payment to the organization, which requires a far more complex arrangement and/or specification.
Background of Results-Based Budget Management

2 Implementing Results-Based Budget Management Frameworks
RBBM system. Likewise, accrual accounting is not an essential part of an RBBM system.5 Further, the extent of devolution of authority, and deregulation of rules and procedures, is a matter of preference in each jurisdiction (and also capacity of both information technology systems and personnel).
Hence, some critics of the NPM overstate their case against the New Zealand model because they focus on only one aspect of a particular approach in claiming that the whole approach is flawed.6 Furthermore, many critical analyses of the NPM fail to differentiate between failure of the model itself and poor implementation of the business model. This report’s author contends that failure of RBBM to realize its full potential resulted from poor implementation of the model, and perhaps a lack of capacity within civil service bureaucracies to adapt to the business model, rather than failure of the model itself. One of the major problems with the introduction of RBBM in both developed and developing countries is the conflation of organizational corporate planning concepts with national RBBM. This resulted in unstable outcome and output definitions.
There are many misconceptions about what RBBM and performance-based budgeting (PBB) are capable of delivering, or what they should achieve and how they should be used. In general, RBBM is a statistics-based, logical specification of output deliverables supporting the achievement of outcome indicator targets, which should be developed and defined in a manner that facilitates medium- to long-term correlation analysis to support policy development and resource allocation decisions.
Many authors have extended PBB and RBBM to encompass performance-based remuneration. While data related to output delivery to end-customers is fundamental to payment of performance-based remuneration to organizations, achievement of output delivery service standards does not translate directly into performance-based remuneration for individual staff members.
Performance-based remuneration of staff should be treated quite distinctly, as a separate topic, which would require developing and implementing a logical interface between remuneration of an organization based on output delivery, and the allocation of performance-based remuneration to individual staff members based on responsibilities for performing specific tasks (which might be identified in corporate or business planning documentation and individual duty statements).
In the context of various governments’ PFM budgeting agenda, reform encompasses a range of techniques that may be used to improve the efficiency and effectiveness of governance and allocation of public resources. Many aspects of today’s initiatives in PFM budget reform have been under active consideration or use in various parts of the world for perhaps the last 100 years, although some were popularized only in the last 30 years or so, including
• program budgeting (Appendix 1);• forward estimates of revenues and expenditures;• medium-term expenditure frameworks (Appendix 2);7 and
5 Although it will• enhance PFM and improve comparability of financial indicators across organizations, both within the public sector and
across alternative suppliers in the private sector; and• increase the probability that capital assets will be managed soundly.
6 See for example, A. Schick. 1998. Why Most Developing Countries Should Not Try New Zealand Reforms. World Bank Research Observer. 13 (1). pp. 123–31. The paper’s main criticism (which may be valid) is that the use of performance contracts is time- and resource-consuming with little benefit, if any.
7 Which in some jurisdictions has become divided into two documents, one being the medium-term expenditure framework focused on expenditure, and another being the medium-term fiscal framework, which sets out the macroeconomic assumptions that proscribe government tax and nontax revenue estimates, including debt financing, and determines the resource envelope to be used when determining budgets within which expenditure is constrained.

Background of Results-Based Budget Management 3
• PBB, which includes using either program budgeting, output budgeting, outcome budgeting, or any combination or permutation of the three.
Important budget reform is often driven by the vision and personalities of a small number of key people within the bureaucracies of central agencies, and some champions scattered among line agencies, with crucial support from a few key political actors. The particular form that RBBM takes in any jurisdiction will depend on the choices made by the reform managers in each jurisdiction.
The main challenge to implementing reform is to bring to life the vision of reform in a manner that is true to the underlying philosophy of that reform. Often, a beautiful vision turns into an ugly duckling because of one or more of the following
• deliberate sabotage by vested interests, • a poorly designed and/or executed change management plan, and/or• a lack of a consistent and shared understanding of the vision for reform among strategic
players charged with implementing various aspects of the reform.
Central agencies have a critical role in addressing impediments to reform efforts. Some of the quintessential elements to building a foundation for successful implementation include
• ensuring understanding of the reform philosophy across the whole of government; • ensuring the use of change-management techniques with respect to processes, procedures,
and attitudes within the central agencies; • strong leadership not only at the political level but even more so at the bureaucratic levels
within the ministry of finance8 and other agencies, at both the executive and middle management levels; and
• strategic use of information technology, which in today’s environment is fundamental to creating rigorous structures that support implementation of new systems and maintaining the integrity of data subject to revised classification criteria and systems.
An unpublished survey of 13 countries undertaken by the author between November 2014 and February 2015, which aimed to investigate the extent to which PBB was introduced in each country, showed that within each responding country there were widely disparate views of the way their national budgeting systems operated in practice. Of even more concern was that this disparate understanding was not only between organizations but also within them, including the central budgeting and planning agencies of each jurisdiction.9 This survey indicated that even if the business model on which the budgeting system is based is well understood and broadly disseminated, many important stakeholders may not fully understand or be aware of how it operates in practice.
The following sections identify some of the significant PFM budget reforms introduced in the last 50−60 years, and suggest some appropriate characteristics of program budgeting and RBBM.
8 The term “ministry” is used throughout this document for ease of reference, and equally refers to the “department of finance,” or the “office of budget and management.” “Ministry” should be taken to mean the central agency, however named, that carries primary responsibility for introducing PFM budget reforms.
9 The Organization for Economic Co-operation and Development (OECD) also undertakes a survey with similar objectives, except that it does not appear to have surveyed either a cross-section of organizations within each jurisdiction or a cross-section of personnel within the responding institution(s). The “survey” approach would appear to be not so much a survey but a questionnaire provided to each central financing agency, which is completed in accordance with a formal protocol of consensus within the management structure of the responding agency. As a result, the OECD “survey” appears to show relatively well structured and uniform understanding of the budgeting system within each country. Hence, the OECD survey results are likely to present a far more certain or uniform understanding of the underlying budgeting principles in those countries than may be the case.

4 Implementing Results-Based Budget Management Frameworks
Goals of Public Financial Management Reform
Generally, PFM reforms have two basic goals, namely,
(i) increased transparency in the use of public resources, and
(ii) increased efficiency in the use of public resources.
The first goal has two aims—combating corruption, and improving public understanding (and perceptions) and, thereby, widespread acceptance of the purpose of government interventions.
To be achieved, these goals require the following, at a minimum
• clear and unambiguously described purposes and means of government interventions,• full and clear presentation of financial data for expenditure on inputs related to the means of
achieving government goals,• presentation of both financial and nonfinancial performance data that demonstrate the
standards to which government interventions were delivered to the community, and• the use of consistent terminology and provision of consistent comparative analysis reports
from one time period to the next.
The data descriptions should be presented in relation to each agency of government in annual budget documentation and in annual reports.
The second goal, increased efficiency in the use of public resources, achieves socioeconomic objectives, or targeted outcomes, as efficiently as possible by
(i) reducing opportunities for corruption,
(ii) improving the availability and quality of information used as the basis for resource allocation decisions,
(iii) increasing bureaucratic operational efficiency, and
(iv) increasing transparency in the use of public resources.
From the preceding, we can conclude that no matter what new processes or procedures one might wish to introduce as part of reform, these should contribute to, and not detract from
• transparency in the use of public resources, and • the clarity of reports that intend to show the performance in using public resources by both
the bureaucracy and the government.
Increased transparency in the use of public resources is critical to combatting corruption and ensuring the most efficient and effective application of government resources to achieve government goals.

Background of Results-Based Budget Management 5
Brief History of Budget Reforms
Historically, government budgeting had been cash-based and relied on incremental “line-item” budgeting, constructed under organizational units. Budgets were identified according to organizational units that had mandates to provide particular services, and the specification of the organizations’ outputs was taken to be inherent in the mandate. Because organizational units were aligned with distinct functions, and therefore outputs, budgets were defined for each organization only by input components (such as “salaries and remuneration,” “transport and communication,” “consultants,” “conference and membership fees,” “periodicals and newspapers,” and “vehicles and equipment”). Budgets were usually increased or decreased for each line item at the margin, according to the inflation rate, an assumed natural growth rate, or particular policy decisions that impacted on the organization’s role and responsibilities.
During the mid-20th century, the use of program budgeting by governments became more widespread, particularly in the United States (US), mainly in response to a need for increased transparency about the purposes for which funds were provided as part of the US war effort (World War II) so that resource allocation decisions could be made with an increased level of information related to the physical resources required to produce particular outputs.10 The functional classification system was also developing as a useful tool during this period and, consequently, program budgeting structures in many cases developed along the lines of a functional purpose approach.11 Program budgeting was critical within the US Department of Defense during World War II, and was gradually adopted during the next 40 years by an increasing number of agencies and governments in the US and internationally.12
Program budgeting requires that an organization identify each distinct “purpose” or function for which it receives a budget and to then construct a list of all the discrete activities and projects that it undertakes to achieve, or realize, the stated purpose(s). The budget is effectively constructed for all the objects of expenditure (line items) under each of the activities and projects and then aggregated as the budget for the purpose, or program. In effect, each purpose identified results in the creation of a “program” budget. (A “purpose budget” does not sound nearly as businesslike as a “program budget,” and so, presumably, the term “program budgeting” has stuck.)
Over the years that followed, program budgeting in the US was supplemented by different concepts, including the planning–programming–budgeting system, which focused on short- and long-range planning and the cost-effectiveness of different alternatives. That system was followed by a “management by objectives” approach, which tracked the achievement of objectives (common with outcome budgeting), but focused on productivity rather than results.13 Zero-based budgeting was
10 There is also evidence that a form of program budgeting was in use before the 1940s in some large US corporations, see D. Novick. 1996. Origin and History of Program Budgeting. Santa Monica, California: Rand Corporation. p. 1; John Hagen says that an early form of program budgeting was introduced in New York City’s Bureau of Municipal Research in 1907, see J. Hagen. 1968. Program Budgeting CSE Report Number 7, 1968. Los Angeles: Centre for the Study of Evaluation, UCLA Graduate School of Management. p. 2.
11 It was also natural for program budgeting structures to closely align with organizational structures, although the purists did in many cases attempt to define programs across organizational structures, which creates its own management and accountability issues.
12 For example, in Australia program budgeting was introduced in federal government agencies in the mid-1980s, replaced by a mix of output- and outcome-based budgeting from 1999, and reintroduced at around 2010 as a supporting framework for outcome-based budgeting.
13 Office of Program Policy Analysis and Government Accountability. 1997. A Report on Performance-Based Budgeting in Context: History and Comparison. Tallahassee: Florida State Legislature. p. 4.

6 Implementing Results-Based Budget Management Frameworks
introduced in a number of jurisdictions in the 1970s as an annual budgeting exercise, focused on management and efficiency. Zero-based budgeting was gradually abandoned, primarily due to the perception that there was little reward from the effort required and little reallocation of resources from 1 year to the next.14
In 1997, the Florida State Legislature’s Office of Program Policy Analysis and Government Accountability found that
While these reform efforts have had some effect on the government budgeting process, all failed to be sustained for several reasons. First, the information requirements of these systems were extensive but were not supported by adequate historical record-keeping, sufficient staff expertise, or sufficient computer support for the type of analysis required. Typically, these systems collapsed under paperwork. Second, requiring all programs to justify their existence under a system like zero-based budgeting was a laborious exercise that was not feasible on a regular basis and did not appear to produce substantial resource reallocation. Third, by stressing “rational” analysis, these systems did not acknowledge the political choices inherent in budgeting and so tended to have little impact on funding decisions. Finally, prior reform efforts have often not had the strong and consistent backing from both the executive and legislative branches needed to succeed.15
More recently, program budgeting evolved into performance-based program budgeting (PBPB, or PB2). PBPB required that the outputs of a program be explicitly defined in terms of physical goods or services and that “key result areas,” or performance indicators, be defined for aspects such as the production process and/or the delivery of goods and services.
Later, outcome and output budgeting were developed and implemented firstly by New Zealand and then followed by other countries such as Australia, Canada, and the United Kingdom (UK). Outcome and output budgeting emphasize using performance indicators to measure the efficiency of delivery of outputs (through quantity, quality, timeliness, and cost indicators) and the effectiveness of outputs on the achievement of time-bound government objectives, as specified in outcomes desired from government expenditure (such as, “a 5% increase in life expectancy by 2020,” “a 10% decrease in infant mortality by 2025,” or “a 95% literacy rate by 2030”).
Both output and outcome budgeting present little new in concepts relative to PBPB, except in presentational format and the (intended) rigorous application of the concept of an output, which may take account of input costs that program budgeting took for granted (such as depreciation of long-lived assets).
Outcomes were always the primary objective of a program and always a justification for expenditure when new proposals were put forward for funding, even though a formalized impact analysis methodology might not have to be developed when expenditure programs were postulated for funding.
14 That is not to say that zero-based budgeting is not a useful periodic exercise, and a periodic zero-based budgeting exercise applied to programs is a practice that some countries have introduced (e.g., Philippines). However, the cost–benefit ratio for zero-based budgeting as an annual process across all programs is, in all likelihood, much less than one (where the estimated benefits are the numerator).
15 Office of Program Policy Analysis and Government Accountability. 1997. A Report on Performance-Based Budgeting in Context: History and Comparison. Tallahassee: Florida State Legislature. p. 5.

Background of Results-Based Budget Management 7
Similarly, outputs were always inherent in program budgeting, although performance indicators were not usually considered strictly as service delivery standards but were often a mixture of process, output, and outcome indicators. Furthermore, costing of program budgeting outputs was not considered as rigorously as is intended with output budgeting. As such, output descriptions under output budgeting can be very different from the type of outputs defined under program budgeting.
Many program budgeting outputs for which performance indicators were specified would be internal or intermediate outputs, which would/should not appear as an output of an agency under output budgeting. Only outputs delivered to clients external to the agency are intended to be defined under output budgeting, and this is then the focus of performance measurement, along with explicit linkages to outcome indicators upon which outputs are expected to impact.
Chapter 3 discusses how the failure of output and outcome budgeting to deliver their expected benefits can be attributed to a lack of government officers’ appreciation of the critical nature of a centralized database management system, the lack of a coherent data classification framework, and minimal or no centralized quality assurance activities. This failure is due to a lack of management expertise, or an inappropriate management structure within government, and a poor understanding of the basic business principles that underlie the RBBM framework of output and outcome budgeting.16
Sequencing Reforms
The implementation of program budgeting is usually a precursor to the implementation of PBPB, and the implementation of PBPB is a precursor to the implementation of output budgeting. Output budgeting is often implemented as an overlay to a program budget, with program expenditures and revenues distributed across one or more organizational level outputs to which their funded outputs contribute. The usual, but neither necessary nor necessarily desirable, long-term goal is to remove the program budget structure and to allocate resources according to the delivery of outputs or outcomes.17
The quality of budget documents and the performance reports produced by budget-dependent agencies is often compromised by the quality of their RBBM frameworks. In
16 The basic business model of RBBM/PBB is in Chapter 2.17 Although this is neither necessary nor desirable in many cases.
Figure 1: Fitting Performance-Based Budgeting Reforms to the Annual Budget Cycle
MTFF/FE
MTEF
PBB targets
Budget
PBB actuals
RBB analysis
MTEF = medium-term expenditure framework, MTFF/FE = medium-term fiscal framework/forward estimate, PBB = performance-based budgeting, RBB = results-based budget.Source: Author.

8 Implementing Results-Based Budget Management Frameworks
other words, if their budget structure, their output definitions, their output performance indicators, their outcome definitions, or their outcome indicators are not clear or relevant, then the performance reports will reflect this. Unfortunately, in too many examples, this is where we find ourselves today. Without clarity in the elements of the budget structure, the transparency of the budget is reduced, sometimes to the point of incomprehensibility.
We cannot say with certainty that there has not been deliberate obfuscation of the reform objective, but we can say with certainty that poorly executed reforms have in some cases resulted in RBBM frameworks that have diminished rather than enhanced transparency.

Results-Based Budget Management
Results-Based Budget Management Logic Model
The term results-based budget management (RBBM) has become synonymous with output budgeting and outcome budgeting. RBBM refers to budgeting systems where funding decisions (i.e., which outputs get how much of the available resources) are based on the results expected to be achieved toward the government’s socioeconomic goals. Budget funds are allocated according to the outputs that government decides should be produced and in accordance with the quantity, quality, and timeliness targets it sets for the outputs.
The general relationship between the outputs produced by the bureaucracy (as measured by the service delivery statistics) and the socioeconomic outcome statistics that government seeks to achieve are in Figure 2.
2
Figure 2: The Ex Ante Output–Outcome Relationship
The operating environment, business conditions, and planned process improvements for delivering outputs
Socioeconomic Outcomes (From the functional framework of government)
Government-specified change desired in societal and sector characteristics expressed in terms of achievement of change
in national statistical measures
OutputsOutput production or delivery PIs specified for output
groups (ministry/department outputs), with PI targets based on resourcing
(A change in a program output’s PIs can be statistically correlated with the change in a sector or societal goal state-of-being PI)
∆⋅Ι Output => β∆OI Outcome
∆ΡΙ CP => ∆⋅Ι Output(The PIs used in the corporate plan and business plan should drive performance at the program output level)
Operational planning focus
Outcome planning focus
Where:∆ A change in one or more of the PIs OIOutcome The outcome indicator(s) related to a
particular socioeconomic outcome or goalb The estimated correlation between the agency
output and the outcome indicator (or social goal indicator) to which the output is directed; a measurement of the extent that the agency output impacts on the desired outcome
PIOutput The agency output indicator(s) related to a particular output
=> Implies impact: the relationship between the PIs at the related planning levels
PICP PIs used in corporate plans or unit work plans to promote performance at the organizational level
OI = outcome indicator, PI = performance indicator.Source: ADB. 2013. Results-Based Management Framework in the Philippines: A Guidebook, 2013. Manila.

10 Implementing Results-Based Budget Management Frameworks
The model assumes that if a logical relationship exists between an output and an outcome, then by funding the output at an appropriate level, the government can achieve the outcome(s) it seeks within the time frame it desires. Some commentators miss this point. For example, A. Schick (1998) says of the New Zealand output budgeting approach:
The success, pervasiveness and demands of New Zealand’s operations-oriented management regime leave inadequate opportunity for the government to use the budget to promote better allocation or to pursue its strategic visions.18
This misses the point that the New Zealand model requires that ministers determine the outputs they wish to procure to achieve strategic outcomes. Which strategic outcome and which output to produce, and in what quantities, are not questions that can be divorced from each other in the New Zealand model or any other model based on the logic inherent in Figure 2.19
In somewhat of a contradiction, Schick (1998) later goes on to say that “…reallocation is inherently difficult. Politicians fight reallocation, even when they profess to want to do the job. Reallocation means taking from in order to give to.”20
Outcome budgeting differs from output budgeting in that the government is assumed not to seek to determine the output mix that it wishes to fund but instead allocates funding to the public service bureaucracy (“the bureaucracy”) to achieve outcomes according to the government’s priorities, which must be reflected in the setting of outcome indicator targets for the funding period. It is then the bureaucracy that determines the outputs it produces to achieve outcomes as cost-effectively as possible.
The justification for focusing budget papers on whether outcomes are being achieved at an acceptable rate, given the resources that have been spent in pursuit of the outcome goals, is fundamental to the definition of “outcome budgeting.” Outcome budgeting, in reality, differs from output budgeting only in that the public reporting of performance is focused on the achievement of outcomes, and the publicity surrounding performance of the bureaucracy in delivering outputs is, consequently, opaque.
Analyzing Data
Being an evidence-based system of management, RBBM is highly dependent on statistics. For its full and proper implementation, output budgeting generally requires the public sector to implement full-cost accrual accounting for cost performance indicators to be comparable across organizations and between the public and private sector (in most jurisdictions this is a significant barrier to the full output
18 A. Schick. 1998. Why Most Developing Countries Should Not Try New Zealand Reforms. World Bank Research Observer. 13:1. p. 5.
19 Schick (1998, p 12).20 Footnote 17, p. 12.
The rigorous measurement of outputs is an integral part of outcome budgeting and cannot be ignored

Results-Based Budget Management 11
budgeting model being implemented).21 Output budgeting that is fully implemented according to basic principles should enable benchmarking both within a single jurisdiction, across multiple jurisdictions and between the public and private sectors.
Output budgeting focuses on determining the outputs to which funds should be allocated to most efficiently achieve given outcome indicator targets, and it will use both output service delivery targets and outcome indicator targets to reflect changes to funding allocations.
At the level of national government budgets, outcome descriptions and their associated outcome indicators should be classified in alignment with the classification of functions of government (COFOG) system and, thereby, remain stable over time. Changes in government priorities should be reflected in changes to outcome indicator targets, not by changes to the outcome classification descriptions.
Furthermore, the output descriptions of organizations should be stable over time, as should their associated service delivery performance indicator definitions/descriptions (performance indicators.). Changes in government priorities should be reflected by changes in outcome indicator targets and subsequently to resource allocations to outputs, with those outputs related to government’s priority outcomes receiving additional funding while lower priorities may be required to give up funding. Changes in allocation of resources to outputs should be reflected by proportional changes in output performance indicator targets.
Under output budgeting, the allocation of budget funding to outputs is determined through the political process, with policy and operational advice provided by the bureaucracy. However, this is not the whole story, since to calculate ex post, the value for the correlation coefficient, b, one must solve a generalized system of equations similar to those in Figure 3.22 Analysis of a model such as this is necessary to differentiate the impact of government-delivered outputs from each other on the various outcome indicators, and also to differentiate the impacts of nongovernment influences, such as exogenous (and endogenous) private sector investment.
For example, many government-run programs are designed to increase school attendance rates, or to lower the rate of poverty. Prima facie, one may argue that because school attendance rates increased, then the outputs that targeted increased school attendance were (highly) successful. However, further analysis might show that those outputs were largely ineffectual, and the primary reason that attendance rates increased was due to an increase in wages of the lowest paid in society, which was due to economic growth stimulated by a significant increase in foreign investment and, to a lesser extent, by government poverty reduction programs. Unless the type of analysis in Figure 3 is done, one may overestimate the effectiveness of the specialized school attendance program expenditures and, in doing so, perpetuate or even increase expenditure on a largely ineffectual program.
As outlined in Figure 2, the choice of outputs determines the outcomes that will be, or are intended to be, delivered and conversely, the choice of outcomes desired should determine the range of outputs that should be examined for funding.
21 It can be argued that the most significant and enduring contribution that both New Zealand and Australian bureaucracies made to their outputs−outcomes frameworks, and PFM reforms, was the introduction of accrual-based budgeting and accounting. In both jurisdictions, their descriptions and definitions of outputs, outcomes, and performance indicators have been, and remain, far from satisfactory.
22 This is not a simple exercise, and requires the use of sophisticated econometric techniques, none of which appear to be in general use across any of the bureaucracies examined as part of this report.
12 Implementing Results-Based Budget Management Frameworks
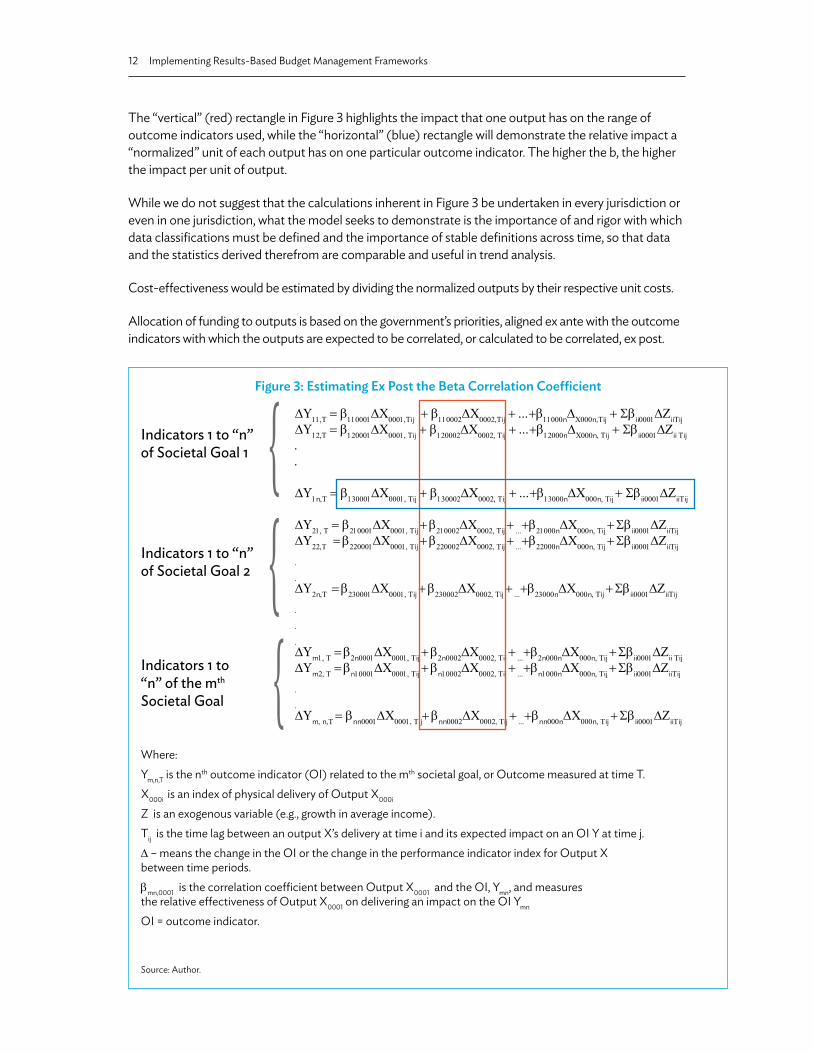
The “vertical” (red) rectangle in Figure 3 highlights the impact that one output has on the range of outcome indicators used, while the “horizontal” (blue) rectangle will demonstrate the relative impact a “normalized” unit of each output has on one particular outcome indicator. The higher the b, the higher the impact per unit of output.
While we do not suggest that the calculations inherent in Figure 3 be undertaken in every jurisdiction or even in one jurisdiction, what the model seeks to demonstrate is the importance of and rigor with which data classifications must be defined and the importance of stable definitions across time, so that data and the statistics derived therefrom are comparable and useful in trend analysis.
Cost-effectiveness would be estimated by dividing the normalized outputs by their respective unit costs.
Allocation of funding to outputs is based on the government’s priorities, aligned ex ante with the outcome indicators with which the outputs are expected to be correlated, or calculated to be correlated, ex post.
Figure 3: Estimating Ex Post the Beta Correlation Coefficient
∆Υ11,T = b110001∆Χ0001,Tij + b110002∆Χ0002,Tij + ...+b11000n∆Χ000n,Tij + Sbii0001∆ΖiiTij ∆Υ12,T = b120001∆Χ0001, Tij + b120002∆Χ0002, Tij + ...+b12000n∆Χ000n, Tij + Sbii0001∆Ζii Tij..
∆Υ1n,T = b130001∆Χ0001, Tij + b130002∆Χ0002, Tij + ...+b13000n∆Χ000n, Tij + Sbii0001∆ΖiiTij ∆Υ21, T = b210001∆Χ0001, Tij + b210002∆Χ0002, Tij + ...+b21000n∆Χ000n, Tij + Sbii0001∆ΖiiTij ∆Υ22,T = b220001∆Χ0001, Tij + b220002∆Χ0002, Tij + ...+b22000n∆Χ000n, Tij + Sbii0001∆ΖiiTij
.
.∆Υ2n,T = b230001∆Χ0001, Tij + b230002∆Χ0002, Tij + ...+b23000n∆Χ000n, Tij + Sbii0001∆ΖiiTij
.
.
.∆Υm1, T = b2n0001∆Χ0001, Tij + b2n0002∆Χ0002, Tij + ...+b2n000n∆Χ000n, Tij + Sbii0001∆Ζii Tij∆Υm2, T = bn10001∆Χ0001, Tij + bn10002∆Χ0002, Tij + ...+bn1000n∆Χ000n, Tij + Sbii0001∆ΖiiTij
.
.∆Υm, n,T = bnn0001∆Χ0001, Tij+ bnn0002∆Χ0002, Tij + ...+bnn000n∆Χ000n, Tij + Sbii0001∆ΖiiTij
Indicators 1 to “n” of Societal Goal 1
Indicators 1 to “n” of Societal Goal 2
Indicators 1 to “n” of the mth Societal Goal
Where:Ym,n,T is the nth outcome indicator (OI) related to the mth societal goal, or Outcome measured at time T.X000i is an index of physical delivery of Output X000i
Z is an exogenous variable (e.g., growth in average income).Tij is the time lag between an output X’s delivery at time i and its expected impact on an OI Y at time j.∆ – means the change in the OI or the change in the performance indicator index for Output X between time periods.bmn,0001 is the correlation coefficient between Output X0001 and the OI, Ymn, and measures the relative effectiveness of Output X0001 on delivering an impact on the OI Ymn
OI = outcome indicator.
Source: Author.

Results-Based Budget Management 13
Results-Based Budget Management Business Model
The private sector is perfectly capable of providing each good or service provided by public sector bureaucracies, including regulatory and policy advice related to market failures, externalities and tax collection. The desire to establish a government bureaucracy is not brought about by failure of the private sector to advise on, implement, or carry out government policy; it is brought about by the need for government to receive “frank and fearless” advice that is, as far as possible, independent of vested interests and impartial to political viewpoints. While this principle has been eroded over the last century in many democratic countries, the principal foundation for the maintenance of a significant public service remains the same—independence and neutrality in service of the political entity.
The RBBM framework and the NPM were devised as a way of introducing the management disciplines of the private sector into a public sector environment.
The RBBM business model is shown in Figure 4. The roles of the actors in the public service bureaucracy can be likened to the actors in any private sector business structure. The central financing and planning agencies are in a principal–agent position more generally with respect to the Parliament and the public. As noted by Jones and Kettl (2003):
Over the past three decades, criticisms about government performance have surfaced across the world from all points of the political spectrum. Critics have alleged that governments are inefficient, ineffective, too large, too costly, overly bureaucratic, overburdened by unnecessary rules, unresponsive to public wants and needs, secretive, undemocratic, invasive into the private rights of citizens, self-serving, and failing in the provision of either the quantity or quality of services deserved by the taxpaying public…Application of market-driven solutions and business techniques to the public sector has undoubtedly been encouraged by the growing ranks of public sector managers and analysts educated in business schools and public management programs.23
In the absence of a profit motive and without vested “ownership” of the equity that is used within government agencies, the RBBM business model intends to provide a proxy governance structure and analytical framework with which to objectively measure efficiency and effectiveness of government resource usage. The RBBM business model is thus a relatively straightforward reflection of a market-oriented governance structure applied to the use and consumption of public resources.
Capital investment, shown in the left column of Figure 4, is intended to increase the capacity of line agencies to produce outputs within estimated future service delivery parameters, it is not an output consumed by end-customers. This is critical to understanding how the bureaucracy should be reporting and justifying expenditure on capital versus outputs. In this business model, the key players charged with safeguarding the public interest with respect to expenditure of public monies are the central agencies, while the spending agencies are charged with delivering outputs that will, it is hoped, deliver the socioeconomic outcomes that society seeks.
23 L. Jones, L. and D. Kettl. 2003. Assessing Public Management Reform in an International Context. International Public Management Review Journal. International Public Management Network. p. 1.

14 Implementing Results-Based Budget Management Frameworks
The key players in this business model are all faced with one or more potential conflicts of interest within the principal–agent context, and only through the rigorous application of the elements of the RBBM model can a relatively transparent governance structure be established.
Line agencies may be compared to any publicly listed company envisaged to act in the interest of its shareholders. However, the shareholders in line agencies do not have the opportunity to vote out senior management if it fails to perform. The best they can do is vote out the government, which is difficult because it requires that the majority of “firms” fail to perform for the “managing directors” of all companies to be tossed out at the same time. Unfortunately, this is not necessarily efficient nor desirable, and it may not be the “managing directors” who are failing to perform but the managers beneath them.
Output delivery standards should be established that reflect an efficient production function, which would be analogous to ensuring competitive pricing in the private sector. The central agencies should ensure that the right outputs are produced, relevant to public “demand,” which would be analogous in the private sector to ensuring the goods or services provided are those that most closely meet consumers’ needs and wants (i.e., demand and supply operating in a free/price flexible market). It is the politicians’ prerogative to determine what outcomes society most values at any point in time which will, through a perceived cause–effect relationship, define the outputs that should be produced—if one can determine those outputs that have the most cost-effective impact on outcomes.
Figure 4: Results-Based Budget Management Business Model
Investment in productive capacity of ministries and their agents
Analysis by the government of demand for outputs by the electorate (central planning/ financing agencies and sector agencies)
Investment by equity holder (government) in capacity of the business (ministries and state-owned enterprises) to produce outputs
Public policy priorities
determine investment
priorities
Funding through borrowings,
taxes, and other revenues
Equity investment
through budget
(projects and capital)
HR policies drive shareholder value
through performance
incentive system (if one is
implemented)
External audit of reported
performance
Outputs supplied by civil service and its
agents to the public
Funding through borrowing, taxes,
and other revenues
Funds provided for purchase of
outputs through the budget
Ministries and their agencies
produce outputs
MTEF analysis determines limit on budget capacity to buy outputs and invest in equity.
Production of outputs Consumption of outputs by public
Outputs deliver socioeconomic goals
Outputs consumption
Contract management by central agency (ies) for monitoring delivery of outputs from ministries on behalf of the public in accordance with
market-based standards
HR = human resources, MTEF = medium-term expenditure framework.Source: Based on a version in ADB. 2013. Results-Based Management Framework in the Philippines: A Guidebook, 2013. Manila.

Results-Based Budget Management 15
Output versus Outcome Budgeting
A number of Organization for Economic Co-operation and Development (OECD) countries24 shifted the emphasis of their budgeting systems toward “outcome budgeting,” that is, they moved, or attempted to move, the focus of their public reporting to outcomes rather than outputs. The argument goes that government interventions are, ultimately, directed at achieving outcomes, and the public is most interested in outcomes. In this scenario, determining outcome priorities is the prerogative of the politicians, not the bureaucrats. Outputs are a means to an end, but not an end in themselves. Bureaucrats, on the other hand, are best placed to determine what outputs are most cost-effective at achieving outcome objectives, and so they may reallocate funds to whatever means they believe will most efficiently achieve the end outcomes.
The achievement of outcomes is the central focus of budget documents and performance reports. The question of whether those outcomes given the highest priority and funding during the resource allocation (budgeting) process are the outcomes the community most values is clearly the politicians’ prerogative. This is not a question of accountability for the budgeting process but, in a democratic system, will be resolved politically through the election process.
Given the predisposition of politicians to be “hands on” when determining the activities of the bureaucracy and the outputs to be delivered to the community, some people may find this unrealistic. The New Zealand model of RBBM recognizes this reality, as noted by Kibblewhite and Ussher (2002): An explicit part of the reforms, which relates to the output/outcome distinction, was to outline the separate responsibilities of ministers and chief executives.25
Scott, Bushnell, and Sallee (1990) state:
The approach taken in the New Zealand financial management reforms is to require chief executives to be directly responsible for delivering the outputs produced by the departments in accordance with service delivery standards, while the ministers choose which outputs should be produced and should, therefore, have to answer directly themselves for the outcomes.26
This vision has not been realised as completely as was originally envisaged. It illustrates, however, the central role that outcomes played in the financial management reforms and play in the public management system. Conceptually, the New Zealand system focuses on outcomes. There have, however, been difficulties integrating outcomes into public management, principally because it is hard to specify, measure, and manage for outcomes. Work continues to address these difficult issues.27
24 For example, Australia, Canada, New Zealand, and the UK.25 A. Kibblewhite and C. Ussher. 2002. New Zealand Treasury Outcome-Focused Management in New Zealand. OECD Journal
on Budgeting. Paris: OECD. p. 86.26 G. Scott, P. Bushnell, and N. Sallee. 1990. Reform of the Core Public Sector: New Zealand Experience, Governance, 3, p. 157.27 Note that the criticisms by Allen Schick of the New Zealand system appear to relate only to the use of explicit contracts
between the Minister and the Chief Executive Officer in the delivery of outputs. Many of the criticisms that Schick makes are valid in the questionability of the use of explicit contracts, but the view of the present author is that Schick overstates his case, and the New Zealand model, if implemented properly (but not necessarily with accrual accounting or with explicit contracts), is quite appropriate.

16 Implementing Results-Based Budget Management Frameworks
The reality is that political masters also take a close interest in which outputs are to be cut and which are to be allocated a funding increase. The political arm of government’s close involvement in output determination is counter to the philosophical arguments used to support outcome budgeting.
Obviously, the idea that responsibility for the achievement of outcomes can somehow be divorced from responsibility for deciding on the outputs to be produced lacks consistency with the RBBM logic framework outlined in Figure 2. Whoever decides which outputs will be produced, and to what service delivery specifications, is effectively responsible for delivering the socioeconomic outcome(s) targets to which the output is directed.
Output budgeting has been characterized in some jurisdictions by a formal “contracting” process between the ministers and their agency—for example, the output agreement in New Zealand (formerly known as the purchase agreement) and the public service agreement (PSA) in the UK (which was modified or abandoned following the election of the Cameron government in 2011). These agreements reflect the view that not only are outcomes determined at the political level, but so too are the kinds of outputs used to achieve desired outcomes. Under the UK’s RBBM system up to 2010, and the New Zealand system since inception, the bureaucrats agree to deliver outputs at specified service delivery standards given a certain budget allocation. The bureaucrats have some
freedom to determine how inputs are combined to deliver outputs at the lowest cost for the given service delivery standards, but they do not decide which outputs will be delivered.
The argument that outcome budgeting is somehow different from output budgeting overlooks a number of issues. First, public funds are expended on delivering outputs, not outcomes. Outcomes are the intended changes in socioeconomic characteristics of society as a result of expenditure on outputs. Those socioeconomic changes will, in theory, be manifested in outcome indicator statistics.
Unless the claim that an output is delivering an impact on one or more outcome indicator is publicly tested, transparency in the use of public funds is diminished. Kibblewhite and Ussher (2002) support this conclusion in their analysis of the New Zealand experience:
In summary, a key benefit of retaining a focus on outputs within formal management systems is that this ensures a better understanding of what is done by the public service. This is a prerequisite for assessing value for money. There are other parts to that value for money puzzle, however, including robust outcome information about whether the outputs had the desired impact. In other words, good outcome information is an addition, not a replacement, for good output information.28
Second, the impact of outputs on outcomes may take many years to manifest in outcome indicator data, significant time lags may occur between the delivery of some outputs and their impact on socioeconomic variables. To focus on outcome indicators on an annual basis will generally provide little insight into public sector performance, and analysis of outcome achievement is, in many cases, likely be shallow, providing little or no transparency to government resource usage, even assuming that the outcome descriptions and their respective indicators are well defined (which, currently, is too often not the case). Again, this conclusion is supported by the analysis of Kibblewhite and Ussher (2002) in the case of New Zealand:
28 Footnote 24, p. 90.
The idea that responsibility for the achievement of outcomes can somehow be divorced from responsibility for deciding on the outputs to be produced lacks logical consistency

Results-Based Budget Management 17
One of the lessons that can be learnt from the New Zealand experience is that creating an environment that enables outcomes-focused management is unlikely to be enough. It is difficult to define, measure and manage for outcomes, and in some areas of government activity it is probably too difficult. Central agencies must balance the need to be responsive to the constraints that specific agencies face, with the need to provide impetus and leadership from the center. This makes it difficult to drive outcomes-based management from the top-down.29
For example, increased expenditure on prisoner rehabilitation schemes may not manifest in data as a decreased incidence of crime for a number of years, and focusing on the outcome indicator may mean that inefficient expenditures for some outputs can be hidden for longer within an envelope of more efficient expenditures, which leads to a weaker decision-making framework.
Third, many government outputs are, for many people, an end in themselves and so output service delivery is hidden behind opaque annual outcome reports (which tend to rely on verbose and shallow analyses), and diminishes rather than enhances transparency.
On a more practical note, Holmes and Evans conclude that “Experience suggests that budgets must be concerned to support outcomes but the format for appropriating funds in more developed systems is best targeted towards outputs.”30
The specification of outcome descriptions and outcome indicators, and estimating the correlation of outcomes with outputs, is crucial to allocating fiscal space or reallocating resources among government priorities. Under output budgeting, the allocation of budget funding is, in theory, argued according to not only outputs but also according to output linkages with outcomes. Outcome prioritization is as much a part of output budgeting as it is fundamental to outcome budgeting. In both systems, the bureaucracy must examine which outputs are most cost-effective at delivering particular outcomes.
Technical Efficiency versus Allocative Efficiency
The question of “allocative efficiency” seeks to determine the relative effectiveness of outputs in delivering impacts on outcomes. It does not seek to answer the technical efficiency question as to whether the bureaucracy has produced the outputs at the lowest cost given the quantity, quality, and timeliness dimensions specified for their delivery.
Outputs with the highest impact on the outcome indicator(s) per monetary unit (cost-effectiveness) should be allocated more resources than those outputs with the lower impact per monetary unit31 The b correlation coefficients shown in Figure 3: Estimating Ex Post the Beta Correlation Coefficient are, in effect, the relative impact indicators of the outputs X on the outcome indicator, Y—the higher the b, the higher the impact on Y of X. By dividing the b by the cost of producing the unit of output X,32 one can determine relative cost-effectiveness, given service delivery standards.
29 Footnote 24, p. 105.30 M. Holmes and A. Evans. 2003. A Review of Experience in Implementing Medium-Term Expenditure Frameworks in a PRSP
Context: A Synthesis of Eight Country Studies. London: Overseas Development Institute. p. 30.31 However, when converted to a monetary base, inefficient production of one output relative to another may adversely impact
the assessed allocative efficiency of that output over the other, resulting in a worse allocation based on potential, although a practically better allocation given the current production functions in use.
32 This explanation is an oversimplification in that the econometric calculation must determine some “index” of the various service delivery indicators of the output, such that changes in one or more of the quantity, quality, and timeliness indicators for a given change in cost of production can be comparable from one time period to the next.

18 Implementing Results-Based Budget Management Frameworks
The questions of whether sufficient outputs were procured to achieve the outcome in the time frame set, or whether sufficient funds were allocated for the procurement of the outputs at the service delivery standards specified, are technical engineering issues related to knowledge and understanding of the operating environment. Such questions must be resolved among the technical experts of the line agency and the central financing and/or planning agencies.
Given knowledge of the marginal impact that additional units of output are expected to have on an outcome indicator, it should be relatively straightforward for the budget analyst to determine whether the quantity of outputs funded will be sufficient to deliver the change in the outcome indicator(s) over the budget time frame, all other things being equal.
Questions of technical efficiency are addressed through performance indicators specified at the output level, which should be comparable between similar outputs produced by other ministries, the private sector, or by governments in other jurisdictions. The issue then becomes comparability of financial data. Given that most governments continue to use cash accounting while the private sector will generally price its outputs on an accrual costed basis, benchmarking can be problematic when comparing the government cost of delivery relative to a private sector provider.
Furthermore, the question as to whether the bureaucracy has produced the outputs at the lowest potential cost can only be assessed by examining the cost in conjunction with the quantity of outputs produced for given quality and timeliness standards. This should be a simpler exercise than determining allocative efficiency but, nevertheless, it is faced with significant issues in determining differences in quality and timeliness measures, and whether cost differences are appropriate for quantity, quality, and timeliness differences.
A properly implemented RBBM framework should be able to provide data that facilitates benchmarking of output production efficiency across agencies within a single jurisdiction, and across agencies in multiple jurisdictions. However, this requires output descriptions and their associated output performance indicators to be defined according to a clear set of principles and standards, which must relate to the aspects of output delivery relevant to the buyer or consumer (i.e., end-beneficiary). A review of some of the OECD countries that pursued budget frameworks more heavily dependent on performance indicators suggests that few, if any, have attained a logically rigorous implementation of RBBM. While outputs, outcomes, and performance indicators may be present, a structured approach to data with tightly defined elements underpinning the analytical function of the logical framework is almost always missing. Instead, well-defined outcomes, outputs, and performance indicators are more an exception than the rule. The results of an assessment of the implementation of RBBM concepts in a range of countries are in Chapter 4.
Well-defined outcomes, outputs, and performance indicators are more an exception than the rule

Transparent Reporting of Results
Introduction
Whether the performance of the bureaucracy, actual and intended, should be subject to public reporting in annual budget documents is moot but, in the interest of transparency, there is only one answer. In any case, as demonstrated in Figure 2 and Figure 3, outcome budgeting cannot provide a framework for budgeting without consideration of the impact that particular outputs have on the desired outcomes. As such, rigorous measurement of outputs is an integral part of outcome budgeting and the appropriate definition of outputs and their performance indicators for service delivery cannot be disregarded.
Transparency in output and outcome budgeting requires at least the following characteristics for budget documents:
(i) Operational Framework
• Outcome descriptions that are clearly expressed as socioeconomic characteristics targeted by government;
• A framework of outcomes that reflect annual changes in government priorities through changes in outcome indicator targets, not wholesale changes to outcome descriptions or outcome indicators;
• An outcome description classification system that may be aligned to a significant degree with the classification of functions of government (COFOG) on monetary expenditures (see the example in Appendix 3);
• Specification of outcome indicators that will be used to measure progress toward achievement of outcome descriptions, the definitions of which will remain inter-temporally stable;
• Output descriptions that clearly and simply describe the output being delivered to clients external to the agency and that will, for ongoing outputs, remain inter-temporally constant;
• A set of output type classifications associated with a standardization of output descriptions and output performance indicators, across government agencies, of like-for-like outputs (see examples in Appendix 4);
• A set of output performance indicators for each agency output that specifies the quantity, quality, and timeliness with which each output is to be delivered for a given budgeted amount, and that will remain inter-temporally stable;
• A relational database that replicates the relationships of the logic model in Figure 2; • Budget documents that show resource allocations consistent with the relationships in
Figure 2 ; and• Periodic analysis of output effectiveness implied by the relationships in Figure 3.
Changes in government policies and priorities should almost always be reflected in changes to outcome and output indicator targets, not changes to outcome and/or output descriptions and outcome and output indicators.
3

20 Implementing Results-Based Budget Management Frameworks
(ii) Budget Documents
• Budget documents that include the latest measurements of outcome indicator statistics, along with specification of future targets across the budget and forward-estimates periods;
• Budget documents that show the assumed linkages between an output and one or more outcome indicators across the whole of government;
• Estimated expenditure (both historical and future) outputs for each common outcome indicator;
• Estimated output indicator targets for the budget year and forward estimates;• Estimated and actual expenditures and output indicator targets for 2−3 years prior to
the current financial year and for the current financial year; and• Explanations of significant changes in output funding based on an analysis of relative
effectiveness of the output or on changes in government priorities as reflected in changes to outcome indicator targets.
Budget Documents and Annual Reporting
At an experience-sharing workshop facilitated by the World Bank to discuss performance budgeting, the following quote was provided as part of the summary of the findings of the workshop: “There was a feeling among participants that too many reports are of poor quality, representing nominal or even “malicious” compliance at best.”33
For results-based budget management (RBBM) to deliver transparency to the readers of budget documents, multiyear comparable data must be provided that enables the reader to identify performance trends in the performance indicators for both outputs and outcomes. Obviously, this is not possible from the outset of a newly instituted RBBM framework, but as the database is gradually built, the budget documents can incorporate trend analysis and reporting. This means that, rather than simply reporting a target for the coming budget, the budget papers should report the previous 3 years’, say, actual results for each performance indicator, which should include as a minimum an estimate for the last financial year’s results along with the target that was included in the previous year’s budget, and the targets for the
upcoming budget year and any forward years based on forecast resourcing. Table 1 shows how an output performance indicator set can appear in the budget documents (including notional actuals and targets).
33 B. Perrin. 2007. Moving from Outputs to Outcomes: Practical Advice from Governments Around the World. In Breul and Moravitz, eds. Integrating Performance and Budgets: The Budget Office of Tomorrow. IBM Centre for the Business of Government. Rowman and Littlefield Publishers Inc. p. 138.
Budget documents must present trend series data showing historical performance along with targets consistent with the forecast resourcing years presented in the budget

Transparent Reporting of Results 21
Table 2 illustrates a possible approach to demonstrating linkages between outputs and outcomes in a budget document, and Table 3 provides an example of an appropriations layout. The appropriation amounts related to an output may have been determined using cost accounting to methodically distribute budgets from a Program Budget structure to each of the outputs of the agency. The funds may actually be appropriated by Program.
Table 2: Presenting Outputs According to Outcomes
Outcome Description(s): Primary school students are well-prepared for secondary schooling
Outcome Indicator Descriptions
Target 20yy-1
Estimated Actual 20yy-1
Targets 20yy
Estimated Actual 20yy
Targets 20yy+1
Targets 20yy+2
Targets 20yy+3
Output: Provision of Primary Education ServicesPerformance Indicator Class
Performance Indicator
DescriptionsTarget 20yy-1
Actual 20yy-1
Targets 20yy
Estimated Actual 20yy
Targets 20yy+1
Targets 20yy+2
Targets 20yy+3
QuantityQualityTimelinessFinancial
yy = to be substituted by numbers denoting the year.Source: Author.
Table 1: Reporting Performance Data in Budget Documents
Output Name
Performance Indicator
DescriptionBudget Year-3
Budget Year-2
Budget Year -1 Target
Budget Year
- 1 Est. Actual
Budget Target
Budget + 1
Budget + 2
Provision of technical advisory services –Agriculture
Number of technical advisories issued
120 110 120 130 >125 >125 >125% of technical advisories rated by clients as good or better 65.2 68.5 70 69 >72 >75 >75% of advisories issued within 10 days of request 35 41.82 45.83 38.46 >44 >50 >50Cost per advisory ($,000) 8,3 10.0 10.1 9.3 10.6 <10.0 <10.0
Est. = Estimated out-turn, since budget documents are prepared before final data is available.
Source: Author.

22 Implementing Results-Based Budget Management Frameworks
Table 3: Possible Appropriations Layout
Output: Provision of Primary Education ServicesCURRENT OPERATING EXPENDITURE
Acc. Item Details of Expenditure 20yyActual
Expenditure
20yy+1 Approved
Budget
20yy+2 Budget
Estimates
20yy+3 Budget
Estimates PERSONNEL SERVICES
1 Salaries/Wages2 Other Compensation3 Other Benefits4 Fixed Personal Expenditure
OTHER OPERATING EXPENSES1 Travel2 Communication3 Repairs and Maintenance4 Transport 5 Office Consumables6 Rent7 Interest8 Utilities9 Training
10 Miscellaneous11 Taxes12 Professional Services
TOTAL CURRENT OPERATING EXPENDITURES
CAPITALLand and Land ImprovementsBuildings and StructureOffice EquipmentTransport Equipment
TOTAL CAPITAL
PROJECTS
20yyActual
Expenditure
20yy+1 Approved
Budget
20yy+2 Budget
Estimates
20yy+3 Budget
Estimates Acc. Description
Personnel ServicesOther Operating ExpensesCapital Outlays
TOTAL PROJECTS
STAFFING RESOURCES (full-time equivalent funded positions)Class 1Class 2Class 3Class 4
TOTAL STAFFING
Acc. = Account codeyy = to be substituted by numbers denoting the year.Source: Author.

Transparent Reporting of Results 23
Capital Expenditure
Capital expenditure that impacts output delivery should be presented with forecasts of how it will impact the capacity of the organization to deliver its outputs over the expected useful life of the asset, if not in the budget then at least as part of any budget proposal justifying the capital expenditure. This should be translated into the specific outputs for which the asset can be expected to provide service in marginal impacts on each output’s quantity, quality, timeliness, and cost performance indicator.
Failure to provide this kind of analysis during budget preparation and budget reporting suggests a lack of capacity within government to use RBBM concepts. To be unable to provide this type of background information is entirely inconsistent with not only RBBM, but also basic cost–benefit analysis. This is the data that should form the basis of any financial analysis of an investment proposal, either in government or the private sector. Appendix 5 provides an outline of budget submission templates for capital expenditure.
Data Management
Introduction
RBBM is highly dependent on data, and data management should be of utmost interest and concern to central agencies whose role is to coordinate the efficient allocation of resources among competing bids from government spending agencies. Data management includes determining
• an appropriate data dictionary,• appropriate structural metadata and descriptive metadata,• appropriate technical standards,• appropriate fields and their names,• appropriate records associations,• critical data elements, and• the database management protocols or standard operating procedures.
Data management is not something the intellectual forces behind the implementation of an RBBM system should ignore. As pointed out by Claudio Weber Abramo (2002): “The main piece of software required to structure information resides in the human brain; information technology is only the means to structure data according to an intellectual conception.”34
Centralizing Database Management
Decentralized data input should be differentiated from centralized management of the database structure. The question arises as to whether database management and data storage for a government-wide outputs–outcomes framework should be centralized or decentralized. The case for a decentralized database relies on arguments around rapid updating of information in the database, the wide variety of
34 C. W. Abramo. 2002. Access to Information—A Long Way to Go. OECD/OAS Public Sector Transparency and Accountability: Making it Happen. Paris: OECD Publishing. http://dx.doi.org/10.1787/9789264176287-en. p. 148.

24 Implementing Results-Based Budget Management Frameworks
data that is required across the whole of government, and the overwhelming task required if this data is to be entered from a central location. Decentralization argues that each information “node” should be responsible for gathering, processing, and making available the data relevant to their organization, or “node.” However, these arguments do not negate the storage of data in a central database, the integrity and structure of which is controlled by a single, centralized entity. The storage of data for outputs and outcomes across the whole of government may be centralized for the following reasons:
(i) Speed in updating the data is not an essential requirement of an RBBM information system;
(ii) A very significant percentage of outcome indicators across all government agencies are likely to have a common root;
(iii) To benchmark common outputs across government agencies, a common database structure must apply across all agencies for critical data sorting/classification codes; and
(iv) Data entry can be decentralized while the database is centrally managed.
The case for centralization is, as described by Abramo (2002), that, “Decentralisation…comes with its own problems, chaos the first among them.”35 Unfortunately, in many jurisdictions, a decentralized approach has been adopted not only for data input but also for database specification and management, which has resulted in a lack of consistency in output descriptions, outcome frameworks, output performance indicators, and outcome indicators characterizing all of the RBBM frameworks examined. Furthermore, the descriptions have been unstable from one time period to the next, resulting in discontinuous time series and therefore an inability to undertake longitudinal studies and analysis of efficiency and effectiveness. A stable classification system is an essential ingredient to analysis, as noted below
“Classification provides a method of distributing coded concepts in a sorted and meaningful manner. A good classification structure facilitates both immediate and longitudinal data management and retrieval across a number of different groups. Quality research requires the use of a reliable and suitable classification system.”36
An obvious constraint to efficient implementation of RBBM is the lack of a centralized, well-designed and structured data classification and management framework, with rigorous quality controls embedded in the database management protocols. As Abramo (2002) points out
“The key to an efficient information processing facility is dedicating time and effort to intelligently considering which information should be related to which other information; which aggregations are useful to which ends; and most importantly, how information is to be presented in order to be of the greatest value to [the] public…
The overall objective—providing useful information to the public—must be constantly kept in mind (C.W Abramo (2002), p 147).”
The RBBM frameworks implemented in most jurisdictions appear to have dedicated insufficient time, reasoning, and resources to these questions.
As noted by MacKay (2011) in his analysis of the Australian RBBM system, the lack of attention to methodical data collection can impede the usefulness of the RBBM system, as he points out the following:
35 Footnote 32, p. 147.36 University of Sydney. Family Medicine Research Centre. http://sydney.edu.au/medicine/fmrc/classifications/

Transparent Reporting of Results 25
“One limitation of the government’s evaluation strategy was that it paid insufficient attention to the regular collection, reporting and use of performance information, via tools such as management information systems and performance indicators…”37
RBBM is a statistics-intensive system, with extensive nonfinancial indicators as important as financial accounts and indicators. For statistics to be useful in estimating relative importance and effectiveness of government interventions, an overarching and rigorous set of data standards and a data classification system are imperative.
Statistics are generally derived from base data, which must be collected and stored. A database structure must be designed with classification codes that enable end users to extract data and generate various reports in the various ways that may be needed by the analyst, specialist, politician, or general public. The design of the database coding structure should reflect the logic model of the RBBM framework, and is just as important to RBBM as the design of the chart of accounts is to the financial reports of government. The control and ongoing management of the database is equally important.
The design of an RBBM database structure depends on the type of analysis intended to be carried out on the data. The linkages between the data elements in the database need to be thought through at the design stage, including outcome descriptions, outcome indicator descriptions, outcome indicator targets, outcome indicator results, outputs, output indicator descriptions, output indicator targets, output indicator results, etc.—and their associated relationships. This should always transpire before the RBBM concept and framework is rolled out to line ministries.
The physical infrastructure, including software and hardware with its capacity designed to meet foreseeable data quantum, should be established for the storage and retrieval of data prior to rolling out the system across the whole of government. The testing of concepts in pilot agencies has, as its primary objective, the identification of future software and hardware requirements to avoid unnecessary costs when the time comes to procure and establish systems that meet the whole-of-government needs.
Stable Output, Outcome Descriptions, Performance Indicators, and Outcome Indicators
A centralized approach to data management is not enough. One of the fundamental problems with almost all RBBM posturing systems was the lack of stability and relevance in their output descriptions, outcome descriptions, output performance indicator definitions, and outcome indicators. Tyrone Carlin (2002) recognized this issue, when he concluded that
“The empirical review of performance indicator disclosure in recent Victorian budget papers over three budget cycles reveals considerable turmoil in indicator disclosure…users are often, by reason of high turnover, unable to observe time series results….Given the low survival rates noted in our empirical analysis, this means that in many cases, no actual data is ever reported in respect of performance indicators. Instead, during the (often brief) period of their survival, the only reported data is in the form of targets. An inability to compare actual outcomes with targeted outcomes is a fundamental flaw in any system of accountability. Likewise, the inability
37 K. MacKay. 2011. The Performance Framework of the Australian Government, 1987 to 2011. OECD Journal on Budgeting. (3). p. 8.

26 Implementing Results-Based Budget Management Frameworks
to construct consistent performance time series represents a serious weakness in the current budget accountability regime in Victoria.”38
While Carlin (2002) recognized the importance of stable performance and outcome indicators, he did not resolve why the instability was occurring, although he speculated that the high turnover in performance and outcome indicators could be due to report preparers’ desire to obfuscate, but suggested that
“Explanations of variation in the budget papers we examined tended to suggest that changes were based on a desire to improve the extant performance indicator inventory, to provide an enhanced view of the underlying operations, efficiency and effectiveness of Victorian government agencies (footnote 37).”
The unfortunate truth is that unless the organizations’ outputs are defined in a rigorous manner so their description will be stable over time, then the performance indicators will not be stable and the performance indicator time-series will be regularly terminated. The problem in Victoria is still unresolved.
In the United Kingdom (UK), Her Majesty’s Treasury provides guidance on developing a framework for performance information in Choosing the Right Fabric: A Framework for Performance Information. Its Foreword notes: “Given the sophisticated demands for information from a wide range of stakeholders, including Parliament, government must respond in kind with world-class performance measurement and reporting systems.”39
The Foreword is signed by the five heads of the collaborating organizations.40
Chapter 4 then goes on to list the five components of the FABRIC acronym as the desirable characteristics of a performance information system.
The system should be
Focused on the organization’s aims and objectives;Appropriate to, and useful for, the stakeholders who are likely to use it;Balanced, giving a picture of what the organization is doing, covering all significant areas of work;Robust in order to withstand organizational changes or individuals leaving;Integrated into the organization, being part of the business planning and management processes; andCost-effective, balancing the benefits of the information against the costs.41
The guidelines issued by central agencies to assist line agencies in the development of their RBBM frameworks are full of catchy acronyms, platitudes, and phrases like “FABRIC” or “SMART,” but rely too much on the reader having fundamental knowledge on the use and application of not only statistics
38 T. Carlin. 2002. Performance and Transparency: Are Australia’s “Leading Edge” Systems Really Working? In OECD/OAS Public Sector Transparency and Accountability: Making it Happen. Paris: OECD Publishing. p. 148.
39 HM Treasury, Cabinet Office, National Audit Office, Audit Commission, and Office for National Statistics. 2008. Choosing the Right Fabric: A Framework for Performance Information. London: UK Government. p. 1.
40 The five organizations are Her Majesty’s Treasury, Cabinet Office, National Audit Office, Audit Commission, and Office for National Statistics.
41 Footnote 37, p. 11.

Transparent Reporting of Results 27
but also management information systems. Unfortunately, this is rarely the case and a more centralized approach to quality assurance and database management is called for, without exception.
Issues with Public Service Management
Some civil servants clearly struggle to define their ongoing outputs within the context of a good or service provided to an external client. Too often, the defense is that the outputs of the civil service are different from those of the private sector. This is a fallacy. Any output by the public service is equally capable of being delivered by the private sector. The basis of provision of policy advisory services by a quasi-independent civil service is that, in theory, the civil service is not beholden to any vested interests and is therefore able to give independent and unbiased advice to government ministers.
Many public service managers tend to rise to management positions with little, if any, applied training or experience in organizational management concepts, although they may have accumulated some on-the-job experience in human resource management in a supervisory role at some point during their rise to the top. Bureaucrats tend to be promoted based on their technical expertise in a particular policy area, but have limited knowledge or use of performance indicators in organizational management.42
Consequently, while performance indicator specification, data collection, data storage, and data use become, in theory, a major part of the public servant’s field of responsibility upon promotion to a position of manager, in practice, they may have little understanding or experience in any of these skills. Public service managers often have little or no experience in establishing internal management systems, because management systems within the civil service are usually inherited as part of the organization’s history, or imposed from outside the organization by a specialist/central agency. Organizational management is very different from the simple human resource management function involved with staff supervision.
Internal management skills combined with fundamental technical knowledge are critical to improving organizational productivity and achievement of performance targets. However, due to the (persistent) absence of a rigorous accountability system across most public service agencies, combined with weak implementation of RBBM, public service managers are able to postpone indefinitely the rigorous application of performance indicators in their management processes and procedures.
RBBM, as a system, is well suited to a “hard” style of management, whereas public service is often characterized by a “soft” style. The soft style of management can be blamed for the failure of central agencies to dictate corrective actions when ministries submit poorly defined outputs, outcomes, or performance indicators. The failure of central agencies to impose discipline and quality assurance is explained away under the guise of wanting the line agency to “own” the output. However, the ministries do not “own” the output but, in essence and in fact, have been awarded a notional “contract” to supply the output. Government does not “owe” ministries a right to their existence, or public servants a right to their employment, and yet the “soft” style of management—allowing ministries to “own” the output—seems to take this as their starting point.
Such an approach is an abrogation of duty by the central agencies, particularly because the output is funded from the national budget and the performance indicators are supposed to specify the service delivery aspects of the output, commensurate with funding provided under the central agencies’ oversight.
42 There are some exceptions to this, such as the health, education, and engineering-based areas of government, where performance indicators have long played an important part in their day-to-day efforts.

28 Implementing Results-Based Budget Management Frameworks
However, central agencies are not able to drive change without unflinching support from the political actors in the face of bureaucratic resentment, antipathy, and antagonism. During these periods of the reform process, political support for bureaucratic reformers is essential and critical. It is therefore imperative that, before undertaking change, a “plan of attack” is devised and clearly articulated to the political actors, to obtain their “buy-in” to a disciplined enforcement of reform without ambiguity or equivocation. The RBBM reform must address the weaknesses identified in Chapter 5 and must adopt measures dealing with the desired characteristics listed therein.
Institutionalizing Quality Assurance
Central agency personnel’s lack of interest in, and lack of understanding of the RBBM business model has undermined the integrity of implementation of many RBBM frameworks. Whether this lack of interest or understanding was a consequence of the lack of an overarching database management framework to facilitate implementation of RBBM is moot. In any case, the absence of an integrated approach to data management and analysis allowed a multitude of interpretations of various aspects of RBBM frameworks to be manifested across agencies within countries. This has allowed bureaucracies to produce performance reports that lack rigor, avoid accountability, and, in many cases, deliberately obfuscate performance.
For a government-wide budgeting system, no matter how simple or complex, quality assurance can be institutionalized in only one way—by a centralized mechanism of control of classifications and review of both financial and nonfinancial database elements, or analytical elements, to ensure consistent application of principles, guidelines, and definitions.
While central agencies often issue a reasonable set of guidance describing what an output or outcome description should be, enforcing adherence to guidance has been problematic. It is unclear why in this time of large computer storage capacity and quick data transfer speeds that central agencies have permitted data storage and data standards to be devolved to line agencies such that central agencies no longer have access to reliable performance information. Furthermore, the descriptions of outputs and outcomes and their associated performance indicators change according to the whims of ministerial or departmental leaders, without the application of database management protocols designed to ensure comparability from one period to the next. The integrity of time-series data is thereby compromised, often irretrievably. This is the same as allowing departments to create their own chart of accounts or economic and functional classification systems separate from the rest of government.
A centralized database ensures control over the relationships within the database and, if managed by persons with appropriate understanding of data classification and database management, should ensure that the integrity of data time-series is defended across time periods. Unless a centralized database is established where performance information is stored systematically, and from which performance data can be confidently extracted for analysis as to comparability of data in a single time-series, the RBBM system will inevitably produce inconsistent data that might inadvertently produce policy options based on flawed evaluations. Any changes that budget-dependent agencies seek to make to data elements, descriptions, and relations should be channeled through a centralized control mechanism that would screen the proposed changes for adherence to data classification principles, and ensure the integrity of time-series data through “translation files.”43
43 Translation files are electronic files that interface between the analyst and raw data in the database. The translation files convert data in a time-series according to a new organizational or data classification structure. This ensures that the analyst uses comparable data from the “old” structure to the “new” structure.

Transparent Reporting of Results 29
Tried and trusted database management protocols have been relinquished of late, or in the case of many countries, never adopted, thereby diminishing the ability to analyze RBBM data and reducing transparency.
Developing an Inter-temporally Stable Outcome Prioritization Framework for Outputs
In the Napoleonic presidential systems, such as that of Indonesia, the Philippines and the United States (US), a set of “presidential priorities” is often prescribed in which the allocation of fiscal space is expected to be given precedence or preference. In parliamentary democracies, governments often produce papers that outline their priorities. Priorities change through the financial year as economic circumstances change and social topics gain prominence. If government priorities result in a new set of objectives or outcomes with each change in government or each change in circumstances, then inconsistencies and breaks in time-series data are inevitable. Thus, the database structure must accommodate the identification of new government priorities and changes in planning priorities, not only with every change of government but with every change of priority within a government’s term. The data structure cannot be completely overwritten every time a priority changes.
New Zealand presents a case where the classification of government priorities regularly changes that makes time-series analysis problematic. As noted by Kibblewhite and Ussher (2002):
“Since the mid-1990s, this requirement has been met by various sets of strategic priorities under a variety of names. There have been Strategic Result Areas and Strategic Priorities and Overarching Goals. Currently, there are Key Government Goals to Guide Public Sector Policy and Performance…In general, these strategic priorities have not been goals as much as statements of broad direction. They are not tightly specified, and no targets or quantifiable measures have been developed to monitor progress against them (footnote 23).”
Several jurisdictions maintain a planning function separate from the financing function. Such jurisdictions need the data structure to facilitate identification of planning priorities within the resource allocation framework. If the definitions of objectives in the planning system change from one planning period to the next, then inconsistencies and breaks in time-series data are inevitable, thereby undermining the usefulness of an RBBM framework. If, as in the Indonesian and Philippine situations, the planning framework does not use a framework common to and synchronized with the financing framework then, without an overarching classification system, inconsistencies are inevitable.
Even in jurisdictions where the planning and financing functions are integrated, such as Australia and New Zealand, they need to identify the various initiatives undertaken within separate organizations that may target common outcome objectives and common outcome indicators. Such “cross-organization programs,” as they are sometimes called, can be accommodated in a number of ways, but the simplest and perhaps most economical and effective approach involves linking each organizational output with one or more common outcome indicators, classified under a common outcome description classification framework.
Outcome indicators must be, in general, inter-temporally stable and reflect the various socioeconomic sectors in which government has historically intervened. Changes in policy priorities can be reflected in outcome indicator targets rather than creating completely new outcome descriptions. The framework could be constructed within a relational
Changes in policy priorities can be reflected in outcome indicator targets rather than the creation of completely new outcome descriptions

30 Implementing Results-Based Budget Management Frameworks
database, thereby making analysis, reporting, and aggregation a relatively straightforward exercise. Perhaps a most practical and efficient approach to identifying common linkages to outcomes across government agencies is to use, as a guide, the preexisting and rigorously developed classification framework of COFOG as the basis for an outcome indicator classification system.
The COFOG framework was developed over many years with inputs from the Organization for Economic Co-operation and Development (OECD), the United Nations (UN), the International Monetary Fund (IMF), and others. The COFOG framework provides a comprehensive classification structure that spans all government activities, and is based on a study of the historical interventions by governments in the socioeconomic sphere, within which outcome descriptions may be grouped, and associated outcome indicators may be linked to outputs. The advantage of using COFOG to guide the development of an outcome indicator classification system is, firstly, it is comprehensive and encompasses the totality of government interventions and, secondly, most countries have already identified the COFOG classification codes by which their expenditures are coded and classified. Linking outcome statements and identifying appropriate outcome indicators under each COFOG Division and Group is relatively easy and inexpensive, which can use most, if not all, the existing budget coding to create an immediate reporting environment.
Canada recently defined a set of 16 “strategic outcome areas.” The set is part of Canada’s “whole-of-government framework” and Canada’s programs44 and “tailored” outcome descriptions of departments must be classified under the set. Canada has not yet created formal linkages of programs to outcome indicators in each of the 16 areas. The outline is shown in Figure 5.
Prior to 2010, each agency had its own outcome descriptions, which could change from year to year and
44 Canada does not define outputs for its programs.
Figure 5: Canadian Whole-of-Government Outcomes Framework
Economic A�airs
Income security and employment for Canadians
A safe and secure world through international engagement
Global poverty reduction through international sustainable development
A strong and mutually beneficial North American partnership
A prosperous Canada through global commerce
A vibrant Canadian culture and heritage
Strong economic growth
An innovative and knowledge-based economy
A clean and healthy environment
A fair and secure marketplace
SPENDING AREAS (4)
GO
VER
NM
ENT
OF
CAN
AD
A
OU
TCO
ME
ARE
AS
(16)
InternationalA�airs
Healthy Canadians
A safe and secure Canada
A diverse society that promotes linguistic duality and social inclusion
SocialA�airs
Strong and independent democratic institutions
A transparent, accountable and responsive federal government
Well-managed and e�cient government operations
GovernmentA�airs
Source: Treasury Board of Canada Secretariat, Whole-of-Government Framework. http://www.tbs-sct.gc.ca/ppg-cpr/frame-cadre-eng.aspx

Transparent Reporting of Results 31
made analysis of efficiency and effectiveness of programs problematic. With the 16 strategic outcomes, a stable reference point was created and under it, a stable set of outcome indicator definitions can also be created.
Why Canada did not emulate the COFOG framework more closely in developing its 16 outcome areas is not known. The reason may have been a desire to be different, or the structure developed may have more closely reflected the government’s program structure and policies, or it might have simply been an oversight. Nevertheless, it is clear where much of the COFOG structure can be aligned within the 16 outcome areas with which Canada chose to link all its programs.
Singapore also established sets of “strategic outcomes” across six high-level policy areas, as described in Chapter 4. Other countries linked their programs or outputs to outcomes, but without an overarching analytical structure. As noted by Kibblewhite and Ussher about New Zealand, the overarching outcomes framework is not necessarily stable , as shown in the following:
Parliament appropriates for outputs. The Public Finance Act, however, requires ministers to identify in the estimates (ministers’ requests to Parliament for appropriations): the link between the classes of outputs to be purchased by the Crown and the government’s desired outcomes.
Current practice at making this link is variable. For the most part, it has been done in a cursory fashion merely by asserting that output a contributes to outcome goal b.45
The Philippines also followed a path that seeks to link all government outputs to a set of presidential priorities that change from one President to the next and from one year to the next.
Depending on the nature of government’s priority statement(s), the linkage can become frivolous when the government’s policy priority is stated in a pithy catchphrase such as, “Reducing poverty through inclusive growth and good governance.” Under this policy statement, the bureaucracy might be required to link all expenditures, so that even military spending is part of the poverty reduction effort even though the priority statement does not mention national or personal security. In addition, with every change in presidential priorities, the outcome structure changes. With every change in president, the data becomes less connected across periods, unless the priorities can be framed within a stable, overarching outcome indicator classification structure.
A well-structured and stable set of outcome descriptions and outcome indicators that can capture government priorities, no matter who is in power, is the kind of outcomes structure that must frame all governments’ output interventions. For this to be possible, the overarching outcomes classification system must map to all government expenditures and policies. However, not all government expenditures must map to government’s stated priorities. If they did, the priority statements become trivial and all expenditure programs have a claim to equal priority, resulting in no prioritization.
An illustration of how an outcomes description classification framework might be aligned with COFOG is in Appendix 3.
45 Footnote 23, p. 87.

32 Implementing Results-Based Budget Management Frameworks
Steps to Implementing Reform
From the preceding review, we can identify some obvious steps to prepare to undertake reform46 and further steps to take during implementation. The more obvious are listed in Table 4.
Table 4: Implementing Reform—Some Practical Steps
Steps to Implementing Reform Time Required1. Get your organizational structures sorted into
an efficient configuration—FIRSTMonths
a. Set up a reform design Steering Committee (SC) (Team to come from leadership, with input from the Project Management Team (PMT)
T = 0
b. Set up the PMT (leadership to come from practitioners within the organization—outside expertise may inform both PMT and the SC)
T + 1
c. Identify the budget processes and procedures that are the subject(s) of reform (Terms of reference by SC, specific recommendations endorsed by SC on the advice of practitioners from PMT)
T + 1-4
d. Design the proposed changes to the processes and procedures and identify where they impact on organizational units and where they impact on data collection and data entry to data storage facilities (designed by PMT with input and guidance from external experts, under the guidance of SC)
T + 2-5
e. Identify data storage requirements relative to existing facilities and develop a future procurement and implementation plan (by PMT)
T + 3-6
f. Design the model accountability structure that optimizes operational efficiency (by PMT)
T + 3-6
g. Analyze current organizational structure against proposed budget accountability framework (PMT)
T + 4-8
h. Design optimal organization structures to match budget structure (PMT) T + 4-8i. Map phased transition actions necessary to move organizational
structures and maintain financial management integrity (PMT)T + 5-8
2. Commence implementation of revised organization and budget structure—SECONDa. Set up project steering committee (PSC) to oversee organizational restructuring T + 4b. Design staff communication strategy T + 5-8c. Disseminate objectives of reform and set out the phased
development stages implementing organizational restructuring and revised budget processes and procedures
T + 5-9
d. Establish information technology (IT) steering committee to oversee procurement and training in new IT hardware and software
T + 5
e. Restructure the organization in line with the proposed budget accountability structure, in harmony with any changed financial management processes and procedures required to facilitate transition
T + 8 - 26
Source: Author.
46 These steps do not attempt to identify internal or external approval and endorsement activities that need to be undertaken at frequent points along the way.

Case Studies on the Current Status of Results-Based Budget Management
Introduction
In assessing the current state of results-based budget management (RBBM) in the eight countries examined, the author was only able to examine materials readily available from sources on the internet, although some assessment of Indonesia and the Philippines was aided by the author’s firsthand knowledge of working within their systems. The assessment did not involve in-depth discussions with current practitioners in any of the countries concerned.
The countries examined were Australia, Canada, Indonesia, Malaysia, New Zealand, the Philippines, Singapore, and the United Kingdom (UK). To make a quick assessment of the current state of RBBM in the eight countries, 10 RBBM aspects were assessed:
(i) the RBBM logical framework specified for the national budgeting system,
(ii) database management,
(iii) output definitions,
(iv) output classification framework,
(v) output performance indicator definitions,
(vi) outcome definitions,
(vii) outcome indicators,
(viii) outcome classification framework,
(ix) analytical reports, and
(x) quality assurance practices.
The criteria used to assess each of these aspects are in Appendix 7 and the documents reviewed for each country are listed in Appendix 8.
Given the limited time allocated to preparing this report, the review focused primarily on the budget documents and annual reports of the central agencies of selected line agencies for each jurisdiction, along with the documents of the central agencies generally believed to be responsible for driving the implementation of RBBM frameworks.
The general finding is that line agencies implement RBBM concepts to a higher standard than central financing agencies in each jurisdiction, but there is a wide disparity from agency to agency in the
4

34 Implementing Results-Based Budget Management Frameworks
quality of the budget documents and annual reports in all jurisdictions. This disparity is largely rooted in poor output specification, resulting in poor output performance indicator specification, poor outcome specification, and in many cases, a disconnect in the logic within documents. For example, the Australian Department of Finance budget document and annual reports focus on task reporting rather than outputs. These tasks or projects should normally be treated as a service delivery data point of an output description, not as the organizational output description. Sometimes, these projects may not even be the data point of an output but instead constitute a capital creation activity designed to improve the capability of the organization to deliver its outputs.
Outcomes were largely directed at the achievement of low-level tasks and not on the achievement of national socioeconomic targets.
The RBBM systems of Australia and the UK were in a state of flux for several years and appear to have lost most, if not all, of their integrity from a whole-of-government business model perspective (although there were still islands of excellence within some spending agencies).
New Zealand struggled to come to terms with the notion of outcomes, and even its output performance indicator and output descriptions appear to be deteriorating over time.
Canada is the best of the eight jurisdictions, even though it does not specify outputs for its programs or have a particularly well-structured set of program performance delivery indicators. Canada has well-described programs, and the program titles give a better description of the type of outputs to be expected than the output descriptions of other jurisdictions, including Australia, Indonesia, and the UK. Singapore and Canada are unique in that they created a high-level set of outcome descriptions that cut across spending agencies, and to which agencies must link their programs. This facilitates the tracking of programs with common goals and should facilitate analysis by central agencies.
Australia
Australia has undergone a series of budgetary reforms since it commenced introducing RBBM in the late 1980s and early 1990s. Until 1997, Australia’s introduction of RBBM followed a relatively trouble-free path, which was considered to be well constructed and implemented. In the 1999−2000 budget, Australia introduced the concept of outcomes and outputs and appropriated funds according to outcomes. For the appropriation mechanism to be functional, the appropriation bill had to be read in conjunction with “portfolio budget statements” to clarify the purpose of an appropriation. The statements identified the outputs each agency was intending to produce and the funding allocated against those outputs, along with performance indicators for the outputs and outcomes.
From the 2009−2010 budget, the Australian federal budget transitioned from an outcome budget supplemented by an output allocation to an outcome budget supplemented by a program allocation. In 2015−2016, funds continue to be appropriated by outcomes, and the portfolio budget statements detail supporting information according to “programs” and “subprograms.”
The Outcomes and Outputs Framework Guidance Document (the Guide) issued in November 2000 by the Department of Finance and Administration, showed a clear and logical framework for RBBM.47 However,
47 Department of Finance and Administration. 2000. The Outcomes and Outputs Framework Guidance Document. Canberra, Commonwealth of Australia.

Case Studies on the Current Status of Results-Based Budget Management 35
the Guide did not clearly articulate that output performance indicators were in the nature of service delivery standards. (No requirement was set for a “timeliness” indicator for delivery of outputs to end customers or clients). Its treatment of outcomes was confused. Paragraph 1.2.5 of the Guide, which deals with cross-agency outcomes, demonstrates a lack of appreciation of how an outcomes classification system aligned with, say, classification of functions of government (COFOG), could have assisted in the analysis of output effectiveness. Furthermore, guidance on how to describe outcomes ignores the role of outcome indicators in defining the nature of an outcome. Instead, the Guide suggests incorporating a number of descriptive aspects into the outcome description that might be better left demonstrated by linkage of an output with a set of outcome indicators. Many of the outcome description examples are objective statements related to undertaking tasks, more in the nature of organizational outcomes rather than national outcomes resulting from the provision of outputs. For example, “The investigation and prevention of crime against the Commonwealth, and the protection of Commonwealth interests in Australia and overseas” (footnote 40) is an outcome adopted for the Australian Federal Police. This is more of an output statement than an outcome statement. Surely the outcomes that the Australian Federal Police seeks, inherent in this output, include (i) a society free of crime; and (ii) safe and secure Australian assets, both domestic and international.
Similarly, “Contribution to Australia’s export trade performance by providing financial and other assistance to eligible organisations” is not an outcome but a statement of what is hoped as a relationship. The outcome should be worded as, “A healthy level of exports of Australian products consistent with Australia’s economic potential.” This would be the outcome to which Austrade hopes to contribute through the delivery of its outputs of “export finance facilitation” and “technical advisory services.”
When it comes to providing clarity on defining performance indicators, the Guide becomes lost in detail and lacks direction in how a performance indicator should be described. For example, “Centrelink people have the skills to do their job and are committed to delivering services to our customers (measured by survey)” is not a performance indicator for an output but an objective statement. How does Centrelink propose to measure skills? How do they measure commitment to delivering services? When they can define the measures for these aspects, then they might be describing performance indicators (although not necessarily a measure of the output delivered, but rather an internal measure of their own skill set and readiness to deliver an output).
The “Guide to Preparing the 2015−16 Portfolio Budget Statements” issued by the Department of Finance (DOF) in 2015 shows a significant conflation of corporate planning-type elements with the national budgeting approach.
Also, the ring-fencing of “Administered Items” is misconceived. Given that 80% of the Commonwealth Budget is made up of “administered” items, this should be a significant issue. The ring-fencing of Administered Items suggests that either
• The bureaucracy was worried it would be held accountable for aspects of output production that it considered were beyond its control;
• The bureaucracy was not savvy enough to define its own output in terms of administering grants and payments systems; and/or
• It reflects the notion of “outcome budgeting,” which requires that the bureaucracy determine the outputs to be produced given funding allocated by the Parliament for the achievement of outcomes, and that administered funds were grants and social welfare payments that were nondiscretionary as far as the civil service was concerned.48
48 As noted in Chapter 2, this approach does not conform to reality and it is considered inappropriate to RBBM. The Australian system has moved away from outcome budgeting and is in the process of adopting and improving a program budget aligned with outcomes, similar to the approach used in Canada, albeit without the overarching outcomes classification framework.

36 Implementing Results-Based Budget Management Frameworks
MacKay (2011) notes of the Australian experience:
“Australia’s performance framework during this period (1997−2007) provides a strong example of how not to go about constructing a system of performance indicators. The framework encountered many conceptual and data difficulties. It also suffered from severe problems of implementation by departments and agencies, and from a lack of effective oversight by the DoF (Department of Finance).”49
Some of the reasons for the currently weak RBBM framework in Australia, as documented by MacKay (2011) (footnote 36), include poor oversight by central agencies, a lack of application of data classification standards, and unstable definitions from one year to the next. As seen in Figure 6, the assessed overall score for the Commonwealth’s output definitions was 4 out of a possible 10 and for output performance indicator definitions, the score was only 3 out of a possible 10. Furthermore, the lack of a coherent outcomes classification structure scored the budgeting system a 0 out of 10, while the outcome indicators used scored only 5 out of 10. These are hardly auspicious scores for a system in development since before 1999.
In its 2007 report, 20 years after the Commonwealth of Australia began to introduce its RBBM, the Australian National Audit Office (ANAO) noted that
“Approximately half of the surveyed agencies stated that their key priority in the ongoing application of the framework was to develop better performance indicators. The main reasons given were to overcome difficulties in measuring and reporting against current performance indicators, and to improve the quality and relevance of reporting to enable better use of performance information in management decision making.”50
The ANAO report goes on to say
“…In particular, approximately 60 per cent of surveyed agencies considered that not all of their outcome indicators were measurable, and targets and benchmarks were generally not identified…(footnote 50)”
This says nothing about the quality of the other 40% of surveyed agencies, whose outcome indicators are also likely to be suspect in one form or another. The ANAO adds: “The ANAO identified that almost two-thirds of the performance indicators were not sufficiently specific.”51
One wonders how long it should take the bureaucracy to get their performance indicators right, when it is not a complex or difficult academic exercise. Is 20 years not enough? It is likely that many of the issues surrounding the poor performance indicator specification identified by the ANAO is rooted in poorly specified output descriptions; poorly specified outcome descriptions; the absence of a robust, overarching data classification framework; and lack of capacity in, and understanding of the importance of statistical methods, both within central agencies and line agencies.
The DOF required that agencies seek its approval for changes to their outcome statements, but did not require its approval for changes to their output descriptions or performance indicators.
49 Footnote 36. p. 43.50 Australian National Audit Office (ANAO). 2007. Application of the Outcomes and Outputs Framework. Canberra:
Commonwealth of Australia. p. 59.51 Footnote 50, p. 54.

Case Studies on the Current Status of Results-Based Budget Management 37
Australia’s DOF issued a discussion paper, in an attempt to identify ways in which its RBBM framework could be improved. The discussion paper admits that
“Since the 1980s, the Commonwealth has attempted a number of reforms to improve the reliability and scope of information on the performance of the Commonwealth public sector with mixed results….
No reforms have yet succeeded in embedding a performance focus into the workings of the Commonwealth public sector as a whole.”52
However, the questions raised in the paper suggest that the DOF has not recognized that its weak control from the center significantly contributed to the poor state of affairs, and the changes proposed in the review exercise are unlikely to address the fundamental weakness of the Australian system, which includes poorly defined outputs, a lack of data structure, and no centralized management information system to control quality and provide consistent structure across all agencies. The solution inherent in the DOF-issued paper is the creation of even more layers of potentially poor quality information.53
The DOF, in its 2016 Portfolio Budget Statements, lists three outcomes that are not written as outcomes, but as organizational objectives to provide support in three areas. Nothing is said about how the outcomes should look or manifest themselves in the community. One is reminded of the quote from Confucius in ADB’s Handbook of Style and Usage, 2011 Edition:
If language is not correct, then what is said is not what is meant; if what is said is not what is meant, then what ought to be done remains undone…
—Confucius
Figure 6 shows how the wide variability across government agencies in the quality of performance indicator definitions and output and outcome definitions resulted in low scores for output definitions, output performance indicator definitions, outcome definitions outcome indicators, quality assurance, and analytical reports.
As found across almost all jurisdictions, the central agencies are among the worst performers in output definitions, outcome definitions, and specification of their respective performance indicators.
52 Commonwealth Department of Finance. 2014. Enhanced Commonwealth Performance Framework: Discussion Paper. Canberra: Commonwealth of Australia. p. 1.
53 The paper proposes additional publications including a corporate plan, a performance plan, and an annual performance statement. These are mostly duplications of information that is, or could be, included in portfolio budget statements and annual reports. How this is expected to improve the quality of performance data and implementation of the (already adequate) guidelines is anybody’s guess.
Figure 6: Characteristics of Australia’s Results-Based Budget Management Implementation
Logical framework documentation
Output definitions
Output classification framework
Output performance indicator definitions
Outcome definitions
Outcome indicators
Outcome classification framework
Analytical reports
Quality assurance
Data management
Sources: Author. See Appendix 8 for a list of resources used as the basis for assessment.

38 Implementing Results-Based Budget Management Frameworks
In the DOF Annual Report for 2013/2014, the department seeks to enlighten us as to its performance in Programme 1.1 with the following information:
Table 5: Department of Finance Annual Report 2013/2014, Extract from Table 1, p. 35
Key Performance Indicator Result
Accurate and timely financial statements are prepared as part of the budget documentation.
Achieved
Appropriation bills accurately reflect the decisions of the Government of Australia, and are finalized for introduction into Parliament as agreed by the government.
Achieved
Source: Department of Finance Annual Report 2013/2014. p. 35.
None of the preceding are key performance indicators. Instead, these are statements of objectives. The reader must take for granted the DOF’s assertion that it achieved these objectives. There is no inherent time-series of performance data that can be constructed from information contained in this table. Almost all key performance indicators set out in the DOF Annual Report for 2013/2014 are objective statements, not performance indicators. This characteristic is prevalent year after year, demonstrating the fundamental problem with instilling a performance culture when the agency responsible for overseeing its integrity constructs such flawed performance indicators.
Canada
Canada has been at the forefront of RBBM implementation for a number of years. It has made marginal improvements to its framework without the radical changes of other jurisdictions such as Australia and the UK. This may be testament to the bureaucrats’ ability to manage political transitions or it may reflect the effectiveness of the Treasury Board of Canada in managing the reform processes and developing guidance materials and standards.
Canada’s ministries produce departmental performance reports that have a well-structured outcomes framework linked to a well-structured program budget, along with performance indicators for each program. This is a blend of performance-based program budgeting (PBPB) and RBBM. Prior to 2010, Canada’s outcomes structure was as poorly conceived as that of other jurisdictions assessed within this report. However, from 2010, Canada introduced a constant set of 16 “strategic outcomes.” All programs across government must be linked to at least one of the outcomes. This creates an analytical tool that enables policy analysts to identify all interventions targeting the same outcome area.
However, the outcomes structure lacks a set of outcome indicators correlated across programs, and the annual reporting documents do not show a series of performance indicator targets associated with actual performance, but only a report on the most recent budget year’s actual achievements versus targets.
Canada scored an “8” for output definitions (Figure 7) even though it has not defined program outputs. Instead, it uses program or subprogram descriptions in place of output descriptions. The program and/or subprogram descriptions used in Canada are generally superior to many of the output descriptions

Case Studies on the Current Status of Results-Based Budget Management 39
used in other jurisdictions such as Australia, Indonesia, and the UK, and are relatively clear in identifying the type of good or service the program and/or subprogram provides. However, Canada does not have a classification system that identifies an association between programs and/or subprograms that produce similar goods or services. Therefore, Canada received a score of “0” for an outputs classification framework.
Canada has undertaken a slow but consistent reform path, and has not suffered from disruptive changes to its reform direction. However, its program performance indicators are limited and do not adequately or consistently capture the complete set of nonfinancial service delivery aspects of program outputs including quantity, quality, and timeliness. Much can still be done to improve Canada’s RBBM system.
Indonesia
Indonesia commenced implementing its RBBM in 2003 with the passage of Law 17/2003. This was further emphasized with the passage of Law 25/2004. However, progress has been hampered by the lack of alignment between planning and budgeting documents in the RBBM terminology and concepts. This lack of progress should be viewed in context and in comparison with other jurisdictions that have embarked on a similar course.
Figure 7: Characteristics of Canada’s Results-Based Budget Management Implementation
Logical framework documentation
Output definitions
Output classification framework
Output performance indicator definitions
Outcome definitions
Outcome indicators
Outcome classification framework
Analytical reports
Quality assurance
Data management
Source: Author. See Appendix 8 for a list of resources used as the basis for assessment.

40 Implementing Results-Based Budget Management Frameworks
Figure 8 assists with examining the current state of play with the Indonesian RBBM, and assessing it against the criteria listed in Chapter 3 as considered necessary for an effective RBBM.
Indonesia has a reasonably well-defined logic framework and a satisfactory set of outcome objectives defined within each Kementerian/Lembaga (ministry/agency), but the rest of the characteristics are below the requirements for an effective RBBM. Outcome indicators are often irrelevant or lack clarity as to what is being measured.
The root of the problem is the program budget structure that is the foundation for output definitions. Most program descriptions are worded as objective statements, not as program descriptions, so it is difficult for the reader to know what each program is producing. The output descriptions developed as an overlay to program budgeting are also worded as objective statements, inputs, or multiple activities, not as output descriptions, so the reader does not know what goods or services the bureaucracy produces.
Furthermore, many of the performance indicator descriptions were developed without considering what is measured or whether the measurement is possible or logical. It is as if words were plugged into the blank spaces merely to fill out a template rather than any thought given to service delivery, accountability, logical consistency, and rigor.
Figure 8: Characteristics of Indonesia’s Results-Based Budget Management Implementation
Logical framework documentation
Output definitions
Output classification framework
Output performance indicator definitions
Outcome definitions
Outcome indicators
Outcome classification framework
Analytical reports
Quality assurance
Data management
Source: Author. See Appendix 8 for a list of resources used as the basis for assessment.

Case Studies on the Current Status of Results-Based Budget Management 41
To remedy the poor output descriptions and performance indicator descriptions, the Indonesian Ministry of Finance recently attempted to introduce Arsitektur Dan Indikator Kinerja—ADIK, the aggregation of outputs at a higher level than what currently exists within each organization. It is unclear if this initiative will be successful because minimal training was done and any confusion resulting from the first phase introducing performance-based budgeting (PBB) is not likely to be corrected. Furthermore, no attempt was made to institutionalize a centralized quality assurance function.
In addition, the relationship between the Ministry of Finance and the central planning agency (Bappenas) suffers a disconnect between the outputs and outcomes specified for the national plan, and the outputs and outcomes specified for the national budget. Given that much of the functional spending in Indonesia is now undertaken by regional and local governments, a unified analytical framework is needed, from the national government to the local governments. But no mechanism is currently in place for the Ministry of Finance and Bappenas to control or manage such a system.
Malaysia
Mucciarone and Nielson (2011) note that interest in performance measurement in Malaysian government circles had its roots in the Manpower, Planning, and Modernizing Unit (MAMPU) Circular 2 of 2005, that introduced the concept of key performance indicators into the public sector management system, and which in 2010 became part of a “Government Transformation Program.”54
The IMF suggests that the output-based “modified budgeting system” was in place for 20 years prior to the introduction of outcome-based budgeting (OBB) in 2012, which included extensive use of output performance indicators and delegation of virement55 authority to managers to assist them in achieving results.56 However, the report also found that, over time, the modified budgeting system degenerated into a compliance exercise with minimal use of performance data, largely because outputs were not correlated with outcomes. OBB is seen as a method of building on the foundation laid by the modified budgeting system.
The World Bank reports that Malaysia adopted a set of national program objectives and outcomes resourced through PBB. The World Bank also suggests that, in the future, development and operating expenditures would be integrated into a single budget for each ministry and that new programs would be identified that align with the national priorities. The report further states that Malaysia has identified six key priority areas in its Government Transformation Program—reducing crime, fighting corruption, improving student outcomes, raising living standards of low-income households, improving rural basic infrastructure, and improving urban public transport, known as the “National Key Results Areas.” Key challenges are identified within each area, which are further divided into short-term priorities and long-term issues.57
The IMF reports that by 2015, nine pilot ministries had redesigned their program structures to link to outcomes, with plans to roll out the framework to all ministries.58 According to the IMF report, the
54 M. Mucciarone and J. Neilson. 2011. Performance Reporting in the Malaysian Government. Asian Academy of Management Journal of Accounting and Finance. 7 (2). p. 37.
55 The administrative transfer of funds from one part of a budget to another.56 T. Curristine et al. 2015. Malaysia Technical Assistance Report—Strengthening Outcome Based Budgeting: IMF Country Report
No. 15/266. Washington, D.C.: International Monetary Fund. pp. 13–14.57 Footnote 54, p. 41.58 Footnote 54, p. 7.

42 Implementing Results-Based Budget Management Frameworks
current outcomes structure has major issues with overlap, gaps, and prioritization. Outcomes have been “…designed for different purposes and at different times,” which “…makes it difficult to arrive at a single, coherent set of outcome priorities for OBB.”59
The lack of a stable outcomes structure is a fundamental flaw, particularly where the focus of the budgeting system is outcomes. The Malaysian system of outcomes can change from plan to plan, and year to year, creating an unstable data relationship between program outputs and outcomes.
Outputs and output performance indicators have been published since 2010 for programs. However, output definitions are often problematic, many being activities associated with delivery of an internal service or a partial output to the public rather than the output itself. This results in output performance indicators that often refer to activities and not a service delivery standard. Furthermore, the output performance indicators generally refer to a quantity of output with no measures incorporated for quality or timeliness of service delivery. This is understandable given that the output definitions themselves may be inappropriate, making identification of complementary service delivery standards problematic.
The budget estimates document is well structured for the presentation of performance data, with output performance indicators showing the latest available actual results for the year, 2 years prior to the budget year, and the last budget year’s target. This enables the reader to make judgments about where performance is headed. However, the budget documents fail to include any outcome indicator, which is an important shortcoming because this is an OBB. The lack of outcome indicators dragged down the scoring for the “Analytical Reports” aspect in Figure 9, although it is still respectable. While the logical framework of the Malaysian system is well designed, many of the reports do not rigorously correlate programs with the outcomes to which they are linked.
59 Footnote 57, p. 30.
Figure 9: Characteristics of Malaysia’s Results-Based Budget Management Implementation
Logical framework documentation
Output definitions
Output classification framework
Output performance indicator definitions
Outcome definitions
Outcome indicators
Outcome classification framework
Analytical reports
Quality assurance
Data management
Source: Author. See Appendix 8 for a list of resources used as the basis for assessment.

Case Studies on the Current Status of Results-Based Budget Management 43
Malaysia has two strengths to its current implementation path, as follows:
(i) the potential for “MyResults” as a central database for storage and controlling of performance data, and
(ii) a “…well-informed and highly motivated OBB team” to manage and guide implementation.60
Malaysia is investing significant resources in its information technology (IT) systems to support the presentation of performance information. Malaysia’s dashboard system of reporting performance indicators is appealing, but at times there is a disconnect between the information presented in relation to high-level socioeconomic statistics and the output or program upon which a report is focused.
The inconsistent application of concepts detracts from Malaysia’s RBBM framework and indicates a lack of quality assurance undertaken and control exercised by central agencies in ensuring well-defined outputs and well-structured performance indicators for output service delivery. The lack of well-defined outputs will ultimately detract from the analysis of allocative and operational efficiency.
New Zealand
In the case of New Zealand, output budgeting was introduced in 1989 and, in 2004, a pilot program was introduced to examine ways the budgeting process could increase its focus on outcomes beyond the focus on outputs.
The New Zealand Auditor-General in his 2008 report expresses disappointment with the New Zealand framework. The auditor-general laments that after 20 years
“Overall, the poor quality of nonfinancial performance reporting by public entities is disappointing…”
In my view, many entities’ performance reports:• do not seem to set out coherent performance frameworks showing logical links from the
medium-term outcomes information and organisational strategies to the annual output information…; and
• do not have well-specified, relevant, understandable, reliable, and comparable performance measures and targets…
Those preparing performance reports also need to better set out the elements of the reports by:• applying the definitions of the elements (in particular, of outcomes and outputs) – if the
underlying elements are not properly identified and presented, the basis of the reporting is undermined; and
• considering how to meaningfully aggregate elements (in particular, outputs and output classes) with enough detail to communicate a comprehensive yet succinct and coherent account of the outputs they deliver.61
60 Footnote 57, p. 16.61 Auditor General of New Zealand. 2008. Discussion Paper—The Auditor General’s Observations on the Quality of
Performance Reporting. Wellington: Office of the Auditor General. p. 3.

44 Implementing Results-Based Budget Management Frameworks
The auditor-general says that the outcome and output definitions are not rigorously defined, which undermines the basis of the performance report. He also suggests that the aggregation of outputs at the higher level is not done with proper care and diligence.
A review of selected agencies confirms the lack of structure provided to outcomes and deterioration in the output descriptions and their associated performance indicators.
One of the “outputs” the Ministry of Justice produced in 2011/12 is its “Sector Leadership and Support.” Three of the performance indicators that the Ministry of Justice used to measure its output delivery performance are in Table 6.
While the format New Zealand uses for performance reporting is good, showing the previous year’s actual performance against the targeted performance (“standard”) and the actual achieved along with an explanation for any variance, the performance indicators themselves leave a lot to be desired (never mind the “output” description). The first performance indicator refers to the ministry’s own policy criteria as the benchmark for performance, rather than an independent measure. We must also take at face value that the Ministry states it met 100% of its criteria 100% of the time. The second performance indicator is expressed as an objective statement, not as a performance indicator. Again, we must just accept that they achieved this vague goal. The third indicator potentially holds the minister to ransom. Again, it is not worded as an indicator.
Figure 10: Characteristics of New Zealand’s Results-Based Budget Management Implementation
Logical framework documentation
Output definitions
Output classification framework
Output performance indicator definitions
Outcome definitions
Outcome indicators
Outcome classification framework
Analytical reports
Quality assurance
Data management
Sources: Author. See Appendix 8 for a list of resources used as the basis for assessment.

Case Studies on the Current Status of Results-Based Budget Management 45
Table 6: Sector Leadership and Support
Actual 2010/11 Performance Measures Standard
2011/12Actual 2011/12
Variance Explanation
100%Percentage of justice sector leadership advice and documentation that meets the ministry’s policy criteria
100% 100%
Achieved
Justice sector information assets, such as the Integrated Sector Intelligence System, are maintained and enhanced and two to three initiatives are delivered as per the annual work program
Achieved Achieved
Good
The minister will be requested to indicate his/her level of satisfaction with the quality of support and advice provided by the ministry in relation to its management of Crown entities and agencies.
Satisfactory or better Very good
Source: Statement of Service Performance 2011/12, Ministry of Justice. p. 5. Previously available through http://www.justice.govt.nz/publications global-publications.
In other cases, the output performance indicators, and the output descriptions are well written. It is this variability that results in a score of only “5” for both output descriptions and output performance indicator definitions in Figure 10. There is no outcomes classification framework, hence, a score of “0” in that measure in Figure 10. The output classification framework is limited to aggregation of similar outputs within an agency as an “output class,” but there is no classification of output types across agencies, therefore, inhibiting benchmarking of output performance across agencies. Thus, a nominal score of “2” for the existence of an output classification framework in Figure 10.
Similarly, while New Zealand’s analytical reports are better than for most countries examined, it scores only 5 out of a possible 10 because of inconsistencies from one agency to the next in performance indicators, output definitions, and the overall quality of the presentation of performance data. It is disappointing that among the worst examples are those from central agencies, which drags down the overall score. As noted elsewhere, however, this trait among central agencies is common across jurisdictions.
Philippines
The Philippines has been developing its RBBM framework since the late 1990s. The effort suffers from gaps in its approach, and a lack of capacity within central agencies to provide quality assurance services. Figure 11 shows an assessment of the current state of the Philippines’ RBBM framework.
In Figure 11, the Philippines’ score for output definitions and output performance indicator specifications are relatively high at present due to a top-down review undertaken in 2013−2014, resulting in redefinitions of outputs and performance indicators across all government agencies, including government-owned enterprises. This facilitated uniformity and consistency in describing outputs across agencies, which facilitates benchmarking of outputs and provides a clear understanding of the nature of each output. The redefinition was provided by a specialist group of consultants under the umbrella of the Department of Budget and Management and the authority of the National Budget Circular 532

46 Implementing Results-Based Budget Management Frameworks
(NBC 532).62 This centralized approach created a uniform application of principles for both output descriptions and performance indicator definitions, and a consistent approach across all government agencies.63
Unfortunately, the wording of output descriptions and performance indicator definitions presented in the budget documents is deteriorating in some agencies, sometimes marginally, sometimes significantly. This deterioration is due to the following:
• ineffective quality assurance exercised by either the Department of Budget and Management or the line agencies for each annual budget update,
• no centralized database of outputs and performance indicators, and • no database management protocol that facilitates the imposition of data classification and
quality control standards on the budget documents and the accounting framework.
Consequently, the disparity in perceptions and levels of understanding within and across line agencies manifest across working units within each line agency and then into the budgeting and accounting documents.
62 The author was the team leader for the group of national consultants who undertook this rewrite and is therefore familiar with the constraints and issues in the Philippines.
63 Outcome descriptions and outcome indicators (of which there were none) were not reviewed.
Figure 11: Characteristics of the Philippines’ Results-Based Budget Management Implementation
Logical framework documentation
Output definitions
Output classification framework
Output performance indicator definitions
Outcome definitions
Outcome indicators
Outcome classification framework
Analytical reports
Quality assurance
Data management
Sources: Author. See Appendix 8 for a list of resources used as the basis for assessment.

Case Studies on the Current Status of Results-Based Budget Management 47
Furthermore, outputs are ostensibly linked to organizational outcomes, which are supposed to be connected to sector outcomes. However, there is confusion among agencies as to what constitutes an organizational outcome and the nature of its potential connection to a sector outcome. In many cases, the organizational outcomes are more in the nature of national outcomes, and result in a repetition of outcome descriptions at both the organizational and sector levels.
In any case, no formal connections are made, and no outcome indicators are specified to measure the impact of outputs against outcomes.
In 2014, a revised budget appropriation format was tried that integrated nonfinancial performance data with the budget appropriation. This is a significant improvement. However, there is a lack of data of historical performance and future performance, with output performance indicator targets set for the budget year, but nothing else. In some cases, in the 2016 National Expenditure Program, some agencies did not understand what is meant by setting targets or how to go about such an exercise.
Singapore
Prior to 2006, Singapore agencies’ program budget documents were accompanied by a statement of their “desired outcomes,” but without outcome indicators. performance indicators were presented for program activities. The performance indicators were a mixed bag of workload indicators, efficiency indicators, quantity indicators, and timeliness indicators, but not integrated into a set of service delivery standards capable of describing an output to end-clients. The performance indicators were sometimes directed at internal processes and sometimes at delivery of a service to an external client. From 2006, some agencies began publishing key performance indicators associated with their stated “desired outcomes.”
Post 2008, efficiency indicators were dropped and programs were associated with outcomes grouped under six themes, as depicted in Figure 12, which show a close correlation with the COFOG system of classification. Biennial reports of outcome achievement were published in the Singapore Public Sector Outcomes Review. After 2008, there is no public disclosure of program performance measures, only reports claiming credit for achieving outcomes.
The Singapore model shifted to a focus on outcomes but lacks sufficient supporting information to enable the reader to ascertain whether the performance trend in outcome indicators is due to government intervention or some other factor(s).
The budget documents limit reporting to financial data with a brief explanation of the functions of the agencies’ programs. No performance data is included in budget documents, other than information on initiatives proposed to be undertaken in the forthcoming period.
Previous annual reports of agencies contained a mix of output, efficiency, and outcome measures. However, annual reports are not structured to facilitate evaluation of effectiveness or efficiency of their outputs to end-beneficiaries. The annual reports are more of marketing tools rather than tools for accountability, and the Singapore Public Sector Outcomes Review follows a doctrine of claiming favorable trends, explaining away unfavorable trends resulting from factors outside their control. True accountability is absent from the public documents.

48 Implementing Results-Based Budget Management Frameworks
Figure 13: Characteristics of Singapore’s Results-Based Budget Management Implementation
Logical framework documentation
Output definitions
Output classification framework
Output performance indicator definitions
Outcome definitions
Outcome indicators
Outcome classification framework
Analytical reports
Quality assurance
Data management
Source: See Appendix 8 for a list of resources used as the basis for assessment.
Figure 12: Singapore's Outcome Classification Structure
Sustainable Economic
Growth
MTEF
PBB targets
E�ective Government
Strong Families, Cohesive Society
Secure and Influential Singapore
Strategic Outcomes• Robust Engines of Growth• Macroeconomic Stability• Conducive to Business and Entrepreneurship• Good Job Opportunities and Lifelong Employability• Globally Competitive Workforce
Strategic Outcomes• Financial Security• Good and A ordable
Healthcare• A ordable, Quality Public
Housing
Strategic Outcomes• Dynamic, Forward-Looking
Public Service Leadership• Rule of Law• Incorruptible and Committed
Public O�cers• Customer-Centric and
Consultative Government• Fiscal Sustainability• E ective and E�cient Use
of Resources
Strategic Outcomes• Quality Education• Strong Singaporean Core• Racial and Religious Harmony• Strong Families, More Families• Caring and Inclusive Society
Strategic Outcomes• Distinctive and Vibrant
Global City• Robust Infrastructure Good
Connectivity• Clean Environment,
Sustainable Development
Strategic Outcomes• Sovereign and Secure
Singapore• Safe and Secure Home• Strong National Identity and
Resilience• Preparedness for Crisis• Congenial International
Environment
MTEF = medium-term expenditure framework, PBB = performance-based budgeting Source: Government of Singapore. 2010. The Singapore Public Sector Outcomes Review –Meeting Challenges of Tomorrow with a Whole-of-Government Approach. Singapore. p. 2.

Case Studies on the Current Status of Results-Based Budget Management 49
United Kingdom
Until 2010, the UK’s RBBM framework required government ministries to report their activities that supported a series of public service agreements setting out the government’s priority outcomes it sought to achieve across various sectors. The minister of each agency was directly accountable for achieving outcome targets.64
The auditor-general, in his 2009 report, found that
…performance measurement frameworks are widely used, and focus on strategic objectives, but rarely relate to a coherent business model or provide a comprehensive picture of performance…
…organisations need to devote more attention to data quality, and improve its presentation, to support decision-making…
…performance measurement frameworks did not link financial information and performance information satisfactorily, hindering informed strategic decision-making.65
The auditor-general found further in the second review of the UK’s performance management framework that, while the framework was well considered, the business models adopted lacked clarity, as noted below:
A good performance measurement framework is based around clear performance objectives; tailors performance measurement to key delivery drivers, and affords a full view of the organization’s current performance and credible projections of future performance. Most of the organisations we reviewed had frameworks which covered objectives, inputs and outputs and/or outcomes—and therefore scored relatively well for the development of frameworks. But the strength of evidence supporting the framework or the articulation of the underlying business models was often weak. That affects the ability to link inputs and activities to outputs and outcomes, to interpret current performance and to project future performance. These weaknesses are part of the explanation for lower scores in the reporting and use part of the matrix.66
In 2010, the incoming conservative government abolished public service agreements and replaced them with a list of actions the government required each agency to complete to support one or more of the government’s stated priorities. These actions are project milestones rather than a stable set of outputs that would be normal under a business model that defined the outputs produced by each agency.
The framework is similar to what previously existed, with poorly defined outcomes and outcome indicators. Figure 14 is based on a review of the current budget documentation and shows a cobweb quickly shrinking to oblivion. A 2013 review of evaluations in the UK by the National Audit Office found significant gaps in coverage, questionable quality, and a lack of use of evaluations and impact analysis in requests for funding.67
64 See, for example, N. Panchamia and P. Thomas. 2010. Civil Service Reform in the Real World—Patterns of Success in UK Civil Service Reform. London: Institute for Government. p. 50.
65 D. French et al. 2009. Performance Frameworks and Board Reporting I: A Review by the Performance Measurement Practice. London: National Audit Office. pp. 4–5.
66 Footnote 65, p. 7.67 A. Athanasopoulou et al. 2013. Evaluation in Government. London: National Audit Office.

50 Implementing Results-Based Budget Management Frameworks
Summary
The central agencies of Australia (Department of Finance) and New Zealand (Ministry of Finance) at some point lost momentum and enthusiasm for reform, or failed to follow through due to a lack of technical expertise, combined with inherent issues with public service management in general (including political expediency). Cobweb charts of these two RBBM leaders, and a cursory examination of their budgetary documentation, literature, and data indicate they have significant challenges ahead, even after 20 years or more of implementation. These “leading” countries have far from satisfactory implementation when their strengths and weaknesses are compared against the characteristic aspects of a well-implemented RBBM framework.
The UK junked the RBBM framework it implemented before 2010 and is in the process of rethinking its framework. Little remains of a performance management framework relating to operational and allocative efficiency.
Singapore has, since 2008, introduced an outcomes framework to which it links its expenditures, and while it produces biennial reports on the achievement of outcomes, it does not provide information that enables the observer to assess the performance of the bureaucracy in delivering outputs that impact on outcomes. Singapore also ceased publishing specific performance information on individual
Figure 14: Characteristics of the United Kingdom’s Results-Based Budget Management Implementation
Logical framework documentation
Output definitions
Output classification framework
Output performance indicator definitions
Outcome definitions
Outcome indicators
Outcome classification framework
Analytical reports
Quality assurance
Data management
Sources: Author. See Appendix 8 for a list of resources used as the basis for assessment.

Case Studies on the Current Status of Results-Based Budget Management 51
government programs, and annual reports of agencies have assumed more of a marketing role than an accountability function.
The bright spot among the pioneers of RBBM is Canada, which has made slow but steady progress in advancing its RBBM framework.
Of the so-called “developing” countries, the Philippines has made significant strides in developing a meaningful RBBM framework. However, without a centralized database to control amendments to output definitions, performance indicator definitions, and their linkages to an overarching outcomes analytical framework, the disparate knowledge and skill base among line agencies and within the central agencies puts any advances to date at risk of being undermined.
Malaysia is in the process of rebuilding, while rebuilding needs to take place in Indonesia.
The main point of this comparative analysis is that the developing countries are not far behind the pioneers in their RBBM frameworks, primarily because the pioneers have not successfully implemented their RBBM and have even regressed because of the failure to realize the intended benefits of a properly implemented, rigorous performance management framework.

Introduction
Results-based budget management (RBBM) should empower central agencies, among others, to look keenly into the operations of spending agencies. Some of the key characteristics of an effective and useful RBBM framework include the following:
(i) a well-developed logical framework;
(ii) a well-defined set of organizational outputs that remain constant over multiple time periods, at least for the foreseeable, planned future;
(iii) an output classification framework that facilitates data extraction for comparative analysis of similar outputs across the whole of government and which is suitable for benchmarking output performance;
(iv) a well-defined set of output performance indicators that specify output delivery standards (when combined with a “target”) in quantity, quality, and timeliness (for a given “price”), that will remain relevant over multiple time periods for the expected life of the output;
(v) a well-defined, structured set of outcome descriptions (preferably aligned with the classification of functions of government [COFOG]) that may be used across multiple time periods and over the long-term planning period;
(vi) a well-defined set of outcome indicators that may be used across multiple time periods and over the long-term planning period68 and to which government interventions and/or organizational outputs may be correlated;
(vii) a well-developed outcome classification system facilitating the formal correlation of outputs to outcome indicators over multiple time periods, for the foreseeable future;
68 The European Commission Agriculture Directorate-General. 2001. A Framework for Indicators for the Economic and Social Dimensions of Sustainable Agriculture and Rural Development. Brussels: European Commission. p. 10, set out the following criteria for indicators:“The indicators should meet the following criteria:• Policy relevance• Conceptual soundness• Definition at an appropriate level of aggregation• Effectiveness• Statistical validity• Analytical soundness• Technical feasibility• Cost-efficiency
Furthermore, indicators should be limited in number, and simple and easy to interpret to make them useful for policy decisions.”
5 Government Bureaucracies: Their Nature and Impact on Results-Based Budget Management Reforms

Government Bureaucracies: Their Nature and Impact on Results-Based Budget Management Reforms 53
(viii) a highly structured, centralized database management system with rigorously enforced database management protocols that facilitates analysis of efficiency and effectiveness of output service delivery in achieving outcome objectives;
(ix) a quality assurance protocol that maintains all database elements across all agencies in rigorous form using a consistent standard for both concepts and classification principles; and
(x) the ability to generate meaningful analytical reports using data extracted from the database that may be used to assess effectiveness of outputs in achieving outcomes and the relative efficiency of the output production in one organization compared to another.
The importance of an accurate output costing methodology, or an accrual accounting system, is not in this list. While these are both ideal, they are not fundamental to the initial establishment of a useful, functioning RBBM framework. Initially, it is important to have the base elements of the system well defined, leaving the accrual accounting and output pricing components of the framework for the last.
The failure of bureaucracies to efficiently implement an effective RBBM system has been characterized during the initial 10- to 25-year period of implementation by the following:
(i) an inability of the bureaucracy to define its outputs in a business context, resulting in a fragmented and disorganized performance framework and hollow and meaningless output performance indicators;
(ii) a lack of experience in using performance indicators for management purposes, particularly among central agencies;
(iii) a lack of experience in implementing and/or using rigorous human resource and organizational management practices;
(iv) the dispersion across government organizations of responsibility for implementing sound and rigorous human resource and organizational management practices, meaning that no single person can be held to account for poor practices within each individual organization;
(v) a lack of understanding of the importance of and/or commitment to, quality controls and application of data classification principles and standards on the elements of the performance management framework (particularly among central agency staff), thereby affecting the quality of output definitions, performance indicator definitions, outcome definitions, outcome indicators, analysis, and reporting;
(vi) a lack of appreciation among all stakeholders, particularly central agencies, of the importance of establishing and managing the control of a centralized database of performance statistics;
(vii) a lack of appreciation by key managers of the importance to effective and efficient implementation of RBBM of a well-designed, computer-based data management system;
(viii) a lack of appreciation (by central agencies in particular) of the importance of the imposition of rigorous database management protocols and data classification principles to the effective and efficient implementation of RBBM; and
(ix) incongruent understanding among stakeholders of both the meaning of terminology and how the performance management framework should work—in particular, a lack of common appreciation of the meaning and integration of terminology such as “service standards,” “impacts,” “outcomes,” and “responsibility.”
These problems constrain the efficient and effective implementation of RBBM.

54 Implementing Results-Based Budget Management Frameworks
Much of the disharmony observed or experienced by both the proponents and the detractors of RBBM can be attributed to chaotic implementation, which is the result of a civil service bureaucracy that has not been led with the same strength, determination, and single-mindedness as would a private sector entity with personal wealth at stake. The “principal−agent” problem (discussed below) is always present in government reform initiatives.
RBBM does not address the principal−agent problem inherent in government, although it clearly articulates the issue, assists to identify the existence of inefficiencies, and may be used as a foundation for an incentives-based system that might be used to address the principal−agent problem.
The Principal−Agent Problem
Conflicts of interest and moral hazard issues may arise when a principal hires an agent to perform specific duties that are in the principal’s best interest but may be costly, or not in the agent’s best interest. The principal–agent problem69 (also known as agency dilemma or theory of agency) occurs when one person or entity (the “agent”) is able to make decisions on behalf of, or that impact, another person or entity (the “principal”). The dilemma exists because sometimes the agent is motivated to act in his own best interests rather than those of the principal.70
Principals create incentives for the agent to act as the principal wants because the principal (may) face information asymmetry and risk on whether the agent has effectively completed a contract.
A significant problem arises where the two parties have different interests and asymmetric information (the agent having more information), such that the principal cannot directly ensure that the agent is always acting in its (the principal’s) best interest, particularly when activities preferable for the principal are costly to the agent, and where elements of what the agent does are costly for the principal to observe.71
A principal will (should) attempt to create an environment in which the agent’s interest is aligned with that of the principal, usually through an incentive-based payments system. Any incentive-based payment must be of sufficient magnitude to counteract the opposite incentives and/or disincentives that the agent experiences, either as “costs” of following the principal’s best interest or as benefits bestowed by alternative actions not in the best interest of the principal (and about which the principal may not become aware).
Principal−agency theory proposes that individuals can attach monetary values to nonmonetary costs or benefits as well as monetary costs and benefits. The magnitude of an incentive payment required to align the principal’s interest with that of the agent will vary from case to case, with agents at one extreme requiring no incentive while at the other extreme, a large monetary incentive might be required (in which case, the agent would, we hope, be found to be too expensive to engage unless the agent reformed the value system!).
69 Sourced from http://www.investopedia.com/terms/p/principal-agent-problem.asp70 In the case of the RBBM, the “principal” is the general public (taxpayers, voters, and general members of society), whereas
the agent encompasses both the public service bureaucracy and the political representatives. 71 Based on the explanation in https://en.wikipedia.org/wiki/Principal%E2%80%93agent_problem

Government Bureaucracies: Their Nature and Impact on Results-Based Budget Management Reforms 55
In the case of the government bureaucracy, the principal (the political wing of government) is itself an agent (of the people). Therefore, any incentives-based payments system that the political wing may provide to the bureaucracy is itself at risk of distortions and inefficiencies that permeate the principal−agent problem between the people and the politicians.
The public service bureaucrats are in a unique position relative to their private sector counterparts. The bureaucracy usually has security of tenure, an absence of responsibility to generate a surplus above salaries, and an equity holder (the general public) that suffers from not only asymmetric information but also a deprivation of the means of exercising direct influence over the bureaucracy.
This conflict between the agent’s motivation and the principal’s “instructions” is often associated with perverse or corrupt behavior in government. In extreme examples of the principal−agent problem, senators and people’s representatives are seen to behave in the interest of financial benefactors and themselves rather than the majority of the people they represent, and police and judicial officers receive money from third parties in exchange for favorable treatment or judgments.
Principal−agent conflict is also present in the day-to-day operation of public service, where managers may make lifestyle choices ahead of their duty as managers. These seemingly less important conflicts of interest can have very major costs to the whole government in perpetuating inefficient polices, practices, and procedures.
Introducing public financial management (PFM) reforms across the public sector is always accompanied by some form of the principal−agent problem.72 The “champion” of reform may suffer “costs” from two potential sources, including
• personal stress between the individual agent and counterparts in the bureaucracy, and• potential impediments to future career prospects within the bureaucracy as a result
of “damaged” relations associated with the introduction of PFM reforms.
Both these costs may lead the reform “champion” to choose a less optimal reform path than that the principal would wish. This is a particular problem when the agent is also the object of the reform, and even more so where reforms involve or require significant changes in processes, procedures, and responsibility or accountability.
Reforms that are primarily procedural usually involve a lower “cost” to relationships than those that result in heightened accountability or responsibility.
When introducing RBBM, some jurisdictions attempted to improve alignment of the interests of the agents with the goals of RBBM by suggesting that the RBBM will enable the payment of bonuses to the objects of reform (which include the agents). This tactic has worked to a greater or lesser extent in garnering support at the grassroots level of the bureaucracy, but is not a substitute for a well-planned execution accompanied by strong, centralized quality control.
72 In terms of RBBM, the principal may be taken to be society, and the agent may be taken to be the individual managers within the public service bureaucracy.
Introducing public financial management reforms across the public sector is almost always accompanied by some form of principal-agent problem

56 Implementing Results-Based Budget Management Frameworks
Impacts of Dispersion of Responsibility for Organizational and Human Resources Development
Every reform initiative involves some change or modification to the organizational systems in place, either for a single organization or across the whole of government. In the case of RBBM, reform represents a dramatic shift toward the accountability practices of the private sector, away from the historical “soft” style management of the public service.
A “soft” style of management focuses on addressing poor performance in individuals (in whatever way “performance” may be measured) by applying organizational resources to “develop” that individual. Similarly, poor organizational performance is explained away by various “extraneous” factors and with ad hoc initiatives to further “develop staff” or “strengthen the organization,” even though the root cause of the performance problem may not yet be identified.
Human resources management systems and practices entrenched in the public service since time immemorial are based on the “soft” style of public service management, where the employee is the center of importance and profits have no place in the organizational and human resource management structures. This lack of a profit motive has also meant that the clients, or intended end-beneficiaries, of civil service interventions have not been front-and-center in day-to-day or even strategic organizational thinking. The primary focus of individuals
operating within government organizations has been power relations at the political and organizational levels, and socioeconomic interventions are the result of those relations rather than their focus. This is a classical principal−agent conflict of interest.
Today’s public service managers inherited their organizational structures, processes, and procedures from a long line of public service managers and are understandably cautious about change.73
The public service, as a bureaucratic structure, treats individual ministries and agencies as part of a whole. In doing so, significant aspects of organizational and human resource development policy and practice are governed by specialist bodies established to develop standards and provide initiatives across the whole government, such as staff development, staff discipline, staff assessment, remuneration frameworks, auditing, procurement policies and practices, management information systems, budgeting, and accounting. This diminishes accountability within individual organizations and spreads accountability across multiple organizations.
On the positive side, these entrenched structures supported and enabled managers with technical skills to rise to management levels and survive with minimal prior, present, or future training in either human resources, organizational, or financial management skills. But it also meant that the existing silo structures of human resources and organizational management specialists had an inordinate influence over the manner the reform of existing processes and procedures was designed and implemented.
73 Many of the existing practices, processes, and procedures of individual government organizations, and government as a whole, were developed over more than one generation of public servants and influenced, in many cases, by the processes and procedures designed, modified, perfected, and embedded over several generations of public servants.
The public service bureaucratic management style has historically been characterized as “soft”

Government Bureaucracies: Their Nature and Impact on Results-Based Budget Management Reforms 57
As a result, implementation of reform suffered from a dichotomy of skills. On the one hand, the approach to reform must take account of and address human factors. But on the other hand, reform must take account of the importance of technical aspects of the processes and procedures that are the subject of reform. When addressing human aspects of reform, the technical requirements are often subjugated to paternal or maternal considerations for human resources and are hostage to the principal−agent problem described earlier.
The approaches and methods used by most (if not all) countries that tried to introduce RBBM focused on the “human” aspect of change management, emphasizing “ownership” by line agencies of the output descriptions, the outcome descriptions, the output performance indicators, and the outcome indicators they were required to specify, and their production the government funded.
Central agencies issue guidance in broad principles for specifying outcomes, outputs, and performance indicators, but failed to rigorously enforce appropriate statistical and data classification standards on the data frameworks of their RBBM. For example, the overarching outcomes framework should have been constructed across the whole government within a data classification system that should, by and large, follow a COFOG74 approach. This has not been effectively done in any jurisdiction that introduced an RBBM framework using outputs and outcomes.75
At the expense of a “feel good” approach toward colleagues and counterparts, RBBM has been compromised, lacking appropriate output descriptions and appropriate performance indicators that should reflect service delivery standards for outputs. This has undermined the integrity and robustness of many accounting frameworks, irrespective of whether they are based on sound business principles and measured with robust data. The resulting RBBM systems can be confusing and often less transparent than a simple program budget.
Without the rigorous application of output description standards and statistical structure required for an RBBM framework, reforms have largely failed to improve transparency, operational efficiency, or allocative effectiveness and, in some cases, have decreased transparency.
Disparate Interpretations and Understanding of the Logical Framework
Central agencies are usually the primary drivers behind the introduction of RBBM. However, many central agencies commenced introducing RBBM without sufficient capacity within their own organizations to see the reform through to full implementation.76 Consequently, a common understanding of all parts of the RBBM framework concept is often missing within key areas of the
74 Classification of Functions of Government (European Communities 2007; OECD 2009).75 Although as demonstrated in Figure 5, Canada has, since 2010, made a first step in this direction. 76 In the case of Australia, a political idealism that resulted in a significant downsizing of the Department of Finance after 1996
is likely to have had a serious detrimental effect on the progress of PBB implementation due to the effect on capacity within the Department of Finance, because there was a significant loss of experienced staff who knew the importance of database management and structured classification systems. See also MacKay (footnote 2, p. 28).
Central agencies have failed to enforce appropriate statistical and data classification standards on the data frameworks of their RBBM
58 Implementing Results-Based Budget Management Frameworks
central agencies, some parts of which may be important fulcrums to line ministries for dissemination and implementation of the RBBM concepts. This is likely to lead to inconsistent standards applied and implemented across ministries.
MacKay (2011) notes the disparate manner in which RBBM has been interpreted not only between organizations within the one jurisdiction but also between individuals within the same organization in the Australian experience as indicated below:
Particular difficulties included definitional changes from year to year and different definitions adopted by different departments; these made it difficult to analyse departmental performance over time, or to make efficiency comparisons between departments… It can be argued that one advantage of a systemic and centralised approach to performance measurement is that it enables exactly such comparisons to be made. A devolved approach, in contrast, is inherently unlikely to achieve this.77
It is essential that a centralized database management and quality assurance function is institutionalized according to the agreed standards and guidelines, and that the database management protocol institutionalizes safety measures that protect the integrity of the database structure and the data stored within the database.
Central agencies often failed to provide quality assurance and control services to ensure that concepts are implemented consistently within each agency and from agency to agency. The abrogation of responsibility for this function, under the guise of enabling ministries to “own” the outputs and outcomes they define, is one of the great tragedies of RBBM implementation. This “hands-off” approach fails to understand the essentially technical and intensely statistical nature of RBBM and the importance of constructing and rigorously managing strictly defined classification and database management systems covering outputs, outcomes, and performance indicators (including outcome indicators) and creating the logical links within the database that reflect the logic model.
A coherent classification system can only be implemented consistently if a rigorous quality assurance system is used to oversee implementation and ongoing use of the RBBM concepts. Unfortunately, too few central agency staff members are familiar with the principles of data classification or database management, which should be considered a core fundamental of all PFM systems.
Unless tight control is maintained over the integrity of the RBBM system, changes will occur over time, as personnel and perceptions change. This leads to variability in standards and can undermine the philosophy on which the system is based. If different elements of the government organization as a whole begin to move away from a common standard, data become less comparable and time-series data become discontinuous and unsuitable for analytical purposes.
Most central agencies have long understood and continue to promote a unified classification system of financial transactions. However, less well understood or appreciated is that the same principles must be applied to nonfinancial data.
77 MacKay (2011), footnote 2, p. 25.
Unless the RBBM is institutionalized through a centralized, structured, and rigorously managed database, the logic model data relationships can be quickly compromised by personnel changes in key central agency policy areas

Government Bureaucracies: Their Nature and Impact on Results-Based Budget Management Reforms 59
“Nonfinancial data” generally refers to the specification of outcome descriptions, of output descriptions, of outcome indicators, of output indicators, of program structures, and the remaining elements of the chart of accounts. In most jurisdictions, the move toward RBBM was not accompanied by a standardization of principles for describing and defining outcomes, outputs, or performance indicators—or even program budgeting structures.
Government budget papers and public reporting in accordance with RBBM suffered greatly as a result of the poor state of output definitions, outcome definitions, and their associated indicators.

Summary and Recommendations
While many shortfalls in implementing such a significant (some might even say “radical”) reform initiative as the results-based budget management (RBBM) are likely to be observed in the short to medium term at least, with continuous improvement processes, the shortfalls are expected to be overcome after 20 or more years of implementation. That is not the case for the countries examined here. On the contrary, some countries’ RBBM systems have seriously regressed.
We argue that two technical aspects of reform implementation are critical to success and these are the:
• enforcement of quality controls over definitional aspects of the RBBM in line agencies’ logic frameworks and PIs, and
• centralized and (highly) structured RBBM database of nonfinancial PIs in which the logic model should be embedded and clearly manifested.
Lee McCormack, executive director, Results-Based Management of the Treasury Board Secretariat, and Government of Canada noted the following:
• There is no end point—persistence over many years is required and you never get it “right.”• You need central leadership to build capacity—someone with authority must set the game
plan, make and enforce policies and invest.• A detailed understanding of the program base is essential—it is easy to lose and not easy to
get back.• Information systems are always a challenge.• You need a common whole-of-government planning and reporting framework if you want to
do real strategic planning and reporting.• Evaluation needs backbone and support.• [In Canada] Parliamentarians and the external auditor demand better public performance
information; this is good.
There is no managing for results without sound management practices, period—you need clear expectations and annual assessment 78
Responsibility for weak implementation of RBBM rests primarily on the central agencies, which firstly drive the reform initiatives and must then adequately oversee their implementation and embed the reforms systematically.
78 T. R. Robinson. 2007. Presentation at the Conference on Performance Based Budgeting, Warsaw, Poland, sponsored by the European Social Fund Operational Program—Human Capital. 7−9 November.
6
Summary and Recommendations 61
While many factors contribute to the failure, after 20 years or more, to embed the business model inherent in RBBM, two critical tools that could be used to largely overcome the problems are centralized institutionalization of
• a quality control function, which screens all proposed outcome, output, performance indicator definitions, and logical correlations; and
• a structured database that embeds the logical framework, prevents the introduction of elements that do not conform to guidelines, and facilitates time-series analysis of performance data.
The implementation of an RBBM framework must be planned very carefully, and implemented from a strong centralized position of control and quality assurance.
Three salient recommendations that follow from the assessment above are
(i) Countries should review the output descriptions and performance indicator definitions across the whole of government, as was done in the Philippines in 2013–2014.
(ii) An outcomes classification structure along the lines of COFOG should be developed to which outcome indicators may be related and to which organizational outputs may be linked in a relational database.
(iii) While the identification of organizational outputs should be straightforward, civil service bureaucrats often have difficulty in doing so, because they are unable to imagine themselves as a private sector provider of a service. Therefore, any technical assistance should be provided by specialists who are able to identify an output description to simply and clearly describe the good or service provided by the public sector organization, along with relevant service delivery parameters.

APPENDIX 1Program Budgeting
A1.1 Introduction
A program budget structure seeks to identify all organizational revenues and/or expenditures associated with a unique policy subject or objective and to identify a program (and/or subprogram) that addresses the subject or supports the achievement of each objective.
Program budgeting is, essentially, the organization of the budget into a logical structure that reflects an engineered process required to produce a product in the form of either a good or service. The purpose of producing the good or service should generally be understood as a purpose or “program objective.”
The good or service produced by an expenditure program may be used by one or more other programs as an input, but is usually final in nature and has as its ultimate objective some impact on the socioeconomic fabric of society. Where a program produces more than one end-output, then each end-output should be produced through a separate subprogram of the program.
The original idea of program budgeting was to create a “work breakdown structure” of what was essentially a production process. Program budgeting is a budget format designed around an “activity-based costing” method of determining resource requirements to achieve a particular purpose. It is to improve transparency and simplify the budgeting process by introducing orderliness and clarity using the engineered breakdown to understand how a change in activity outputs in one part of the process will impact input requirements in other parts of the production process.
Therefore, a program budget is a collection of funded activities designed to meet some end-objective or purpose, usually translated as the delivery to the community of an output in the form of a good or service. The output serves some purpose, much like an outcome under RBBM.
If it is useful or necessary to group a set of programs with similar goals into a single program structure, then the separate programs may be renamed as subprograms under an overarching program description. The program is then a collection of related outputs designed to meet some common end-objective. Each subprogram produces outputs with more specific sub-objectives related to the higher-level, broader, all-encompassing objective. The subprogram structure is based on some logical reasoning that distinguishes each subprogram from the other.
Program budgeting requires that an organization identify the “purpose(s)” or function(s) for which it will receive each budgeted block of funds, and to construct a list of all the discrete activities and projects that it undertakes to deliver or realize the stated purpose(s).
Projects tend to be capital-creating with a defined start date and end date, the time period of which is much shorter than the intended life of the program(s) to which the projects relate.
Each program or subprogram will align or correlate with at least one government objective

Program Budgeting 63
The budget is constructed for each program according to, first, the objects of transactions (line items) recorded under each of the activities that make up the program. Second, the objects of transactions are then aggregated as the budget for the “purpose,” or program. Third, projects are added, which are also costed by line item (or “object,” in the nomenclature of the chart of accounts). Each purpose or objective for which government allocates funding results in the creation of a program of expenditures.
Program budgeting also focuses on prioritizating expenditures relative to line-item budgeting, i.e., allocation of funds to the sectors and programs considered most important (at the political level at least). Program budgeting should facilitate
• policy analysis and managerial planning, • results-oriented decision making, • analysis of cost structures, and• control over total expenditure.
It is important to understand that a program structure is intended to be stable over long periods of time. That is to say, each program, its description and activities, will continue to exist for the foreseeable future. Unlike a project, there is no date by when the program should cease operating (otherwise it would be termed a “project”). The specification of a program or subprogram envisages the ongoing delivery of a good or service to the community. It is not usually a one-off or short-term intervention, although government could decide to terminate the program shortly after it has commenced, or at any time thereafter.
A project, on the other hand, has a definite start date and end date, and is not considered a program. The project usually results in the creation or enhancement of one or more capital assets that may, once completed, be used as an input to one or many programs and/or subprograms.
Each program or subprogram is broken down into the identifiable process steps, or activities, required to produce the goods or services that target a particular policy objective.79 A series of logically related activities is specified that, when undertaken step-by-step, aggregate into a “production process” for each program or subprogram. For example, the subprogram “Primary School Teaching” may be constructed from several activities, including
Activity 1: Procurement of teaching supplies, stationery, and office supplies;
Activity 2: General administration (payment of salaries, recruitment, logistics, discipline, etc.);
Activity 3: Structured teaching (classroom and/or formal teaching);
Activity 4: Extracurricular teaching (school trips, after-school sports, etc.); and
Activity 5: Curriculum development and teacher training.
An activity is ongoing over the life of the program and generally will be regularly undertaken throughout
79 A project is also broken down into a logically related series of steps, but each step is terminating and is associated with a “milestone” date.
Programs and activities, once specified, are intended to continue over the foreseeable time frame—but may be terminated by government at any time

64 Appendix 1
the annual production process. One-off activities will generally not be explicitly defined as an activity, but expenditure on one-off actions will be subsumed within one of the major activity descriptions. Program activities should not be so narrowly defined that they cannot accommodate the recording of expenditure on one-off or infrequent actions related to program delivery. The number of activities in a production process is, usually, no less than three, representing a beginning, middle, and an end to the production process.
A1.2 Designing the Program Structure
The design of a program structure should be guided by a top-down, bottom-up review of the organization’s existing revenues and expenditures. This construct works in two directions, as mentioned—top-down and bottom-up. From the top, the organization’s budget may be disaggregated into programs (broad objectives of government), which may be further disaggregated into subprograms (more focused objectives encompassed by the higher-level program objective), and then into activities. From the bottom, activities and projects are reviewed and amended as necessary, and financing requirements estimated based on objects of expenditure and revenue, or the natural accounts.
Whether a budget grouping is at the organizational, program, subprogram, activity, or object and/or item level, all members of a grouping must
• contribute and/or relate to the same objective(s),• not overlap, • capture all finances of the organization’s appropriation, and • reflect finances only once in the program structure (no double counting).
Most countries that use program budgeting suggest that an organizational budget can be efficiently divided into three levels of program hierarchy: program, subprogram, and activity (where the item, or object, level of classification is treated as the bottom rung of revenue and expenditure), with projects identified separately outside the program structure, as in Figure A1.1.
Top-down specification of strategic program budgeting structure, bottom-up allocation of resources to those strategic elements based on knowledge of on-the-ground operations
Figure A1.1: Program Budgeting Levels
Programs
Activities
Objects/line items of transactions, andProjects, and
Objects/line items of transactions
Subprograms
Source: Author.

Program Budgeting 65
In cases where projects are considered as stand-alone, terminating budget allocations, and not part of a specific program (they often contribute to more than one program and/or subprogram), then by definition, the sum of all transactions incurred by activities under a program or subprogram must equal the total funding allocated to that program or subprogram.
Similarly, the sum of all funds allocated to subprograms must equal the total of all funding allocated to the program. And, the sum of all funding allocated to programs and projects for the organization (defined as all members of a group or program) must equal the total funding allocated to the organization.
The objects of transactions in the Chart of Accounts will appear under each activity and project. Revenue and expenditure will only be recorded at the object level, although coded according to the various elements of the Chart of Accounts. From there, it can be summed by object across all activities of the subprogram or program and projects, as the case may be, to give a total budget for the subprogram or program or projects.
A program does not have to contain subprograms. However, subprograms are desirable, perhaps even necessary, when more than one sub-objective is funded within a program. This suggests the following rule: If subprograms are to be developed underneath a program, then there must be at least two subprograms. A single subprogram under a program would mean the subprogram is identical to the program. In the Chart of Accounts, where two digits are allocated for a subprogram code, this code would be, say, “00” if there are no subprograms under the program.
Figure A1.2 presents the three-layered program structure.
The sum of all funding allocated to a sublevel classification must equal the total allocated to the next higher level of classification
• All members of a group (vote or program) should contribute to the same objective.
• Members should not overlap.
• All costs and revenues should be reflected—but only once.
Figure A1.2: Three-Layered Program Structure
Activity 1.1.1Activity 1.1.2Activity 1.1.3Activity 1.1.4
Activity 1.2.1Activity 1.2.2Activity 1.2.3Activity 1.2.4
Activity 1.3.1Activity 1.3.2Activity 1.3.3Activity 1.3.4Activity 1.3.5Activity 1.3.6
Activity 2.1.1Activity 2.1.2Activity 2.1.3Activity 2.1.4Activity 2.1.5Activity 2.1.6
Activity 2.2.1Activity 2.2.2Activity 2.2.3Activity 2.2.4Activity 2.2.5Activity 2.2.6
Subprogram 1 Subprogram 2
Program 1 Program 2
Organization
Subprogram 3 Subprogram 1 Subprogram 2
Source: Author.
66 Appendix 1
Similarly, by definition, two or more activities must always be specified beneath the program or subprogram, whichever is the case. If the activities and sub-activities are to be logically structured, there must be more than one, otherwise the activity or sub-activity is simply a rewording of the level above it, rather than a breakdown of that level into its component parts.
If a program has subprograms, no activities can be specified for the program—activities will be specified only under the subprogram level. If there are no subprograms, the activities will be specified for the program.
Accordingly, a program (for example “Vocational Education and Training,” as in Table A1.3) may be divided into subprograms (for example, “Trade School Operations,” and “Nursing School Operations”) and these would be further divided into activities (for example, “Classroom Training in Theory,” and , “Workshop Practical Training”), and under each activity would be the objects against which revenues and expenditures would be recorded.
For a subprogram such as “Primary School Education,” projects such as the construction of new classrooms are usually considered “one-off” capital expenditures and not part of ongoing operations, so it is convenient to separate them from the programs and list them separately as projects. Projects are not shown with an activity structure, but project expenditure will be recorded according to objects of expenditure, and delivery of the project is identified with milestones that align with the completion of certain activities that are part of an engineered “work breakdown structure.”
The budget documents may include information regarding a project’s start date, projected end date, and the current state of affairs, such as expenditure to-date, forward estimates, and milestones achieved. In contract documents, the project is broken down into completion stages. And the contractor will have developed a detailed work breakdown structure for costing and project management purposes.
A “School Feeding Program” may serve as an example of activity structure. The School Feeding Program would be made up of a number of distinct activities for the program to deliver its output, including
• procurement of food supplies;• distribution of food inputs to schools;• preparation and distribution of food to learners; and• administration (such as payment of salaries and creditor invoices, logistical planning, etc.).
If the program is delivered under an all-inclusive contract with a supplier, then perhaps an alternative construct for the program activities might be as follows:
• supply of meals to learners (capturing the full contract with the supplier),• inspection and verification of contract performance (an overhead), and• contract administration and evaluation and/or impact analysis (an overhead).
A properly specified program structure must have more than one activity per program or subprogram and, where there are sub-activities, there must be more than one sub-activity per activity

Program Budgeting 67
In some localities, if the Ministry of Education directly provides the meals while a third party contract supplies others meals, create a combined list of activities, or identify two subprograms, one dealing with the supply of outputs by the third party and one with the supply of the output by the government agency. In this way, the finances of each stage of production of the subprogram can be identified.
A1.3. Program, Activity, and Objective Descriptions
The program’s description or name should give a good idea of the purpose of the budgeted revenue and expenditure grouped under its heading. Each program is described by its name or title, and may refer to its overarching objective. If a program encompasses other key outputs, these should be captured in the subprogram descriptions.
As the program objective must encapsulate all of its subprograms’ objectives, the subprograms are each part of a subset of objectives that contribute to the overall objective of the program. Programs and subprograms otherwise share the same characteristics. This hierarchy is illustrated in Table A1.1.
Table A1.1: Hierarchy of Objectives
Program: Primary School Education Objective: To provide a sound educational basis for children to succeed at secondary schooling.
Subprogram 1: Provision of teaching services Objective 1: To provide children with comprehensive primary school level instruction.
Activities: The objectives for activities will relate to the completion of processes, and not to the delivery of end outputs (even though their completion is instrumental in the delivery of the output). These objectives are suitable for work plans and performance management objectives used by managers and individuals.
Subprogram 2: Provision of textbooks to children
Objective 1 (a): To ensure all children have equal access to necessary learning materials.
Activities:Subprogram 3: Supply of student meals Objective 1 (b): To ensure that the education of
country’s children is not impeded by hunger.Activities:Subprogram 4: Hostel accommodation for students
Objective 1 (c): To ensure that students from remote areas have access to affordable accommodation when they must attend school away from home.
Activities:Projects:Construction of x classrooms at school aConstruction of y classrooms at school bConstruction of z classrooms at school c
The objectives of projects relate to the provision of facilities for use as inputs to programs or subprograms and do not speak directly to an output or outcome. They usually have as their objective an increase in the agency’s productivity and ability to deliver outputs.
Source: Author.
The program name (description) should• be no more than
5−6 words, if possible;• include at least one noun
in its description; and• give insight into the
output of the program

68 Appendix 1
Table A1.1 shows how the objectives of subprograms are covered by the overall program objective. The outputs of subprograms within a program should not overlap with each other, but should be differentiated by some criteria. In the preceding example, one subprogram was related to provision of teaching staff, one to provision of food, another to provision of textbooks while the last was the provision of accommodation. There was no overlap of outputs.
The program objective should be explicit and brief—ideally one sentence. There has to be a clear link between strategic and operational objectives of the organization. Examples of well-formulated program objectives include “To provide a sound educational basis for children to succeed at secondary schooling” (for the program “Primary School Education”) or “To provide a sound educational basis for children to progress to higher education, gainful employment, and living fruitful lives” (for the program, “Secondary School Education”). Table A1.2 provides an example of how program objectives can be reformulated.
Each program's objective should relate to all revenues and expenditures recorded under that program
If there are multiple program objectives, there should be a separate statement for each variable
Table A1.2: Reformulating Program Objective Descriptions
Original Objective Revised Objective Implied OutcomesProgram: Preprimary and Early Childhood DevelopmentPreprimary education is widely recognized as having a significant impact on the subsequent performance of children in the basic education programs. It lays the foundation for acquiring basic literacy and numeracy skills, considerably reduces dropout and repetition rates and, well managed, it predisposes the child toward learning and attending school. Preprimary education would ensure a smooth transition between early childhood development and primary education and lay the foundation for lifelong learning.
To provide basic literacy skills to ensure a smooth transition from early childhood education to primary schooling.To provide basic numeracy skills to ensure a smooth transition from early childhood education to primary schooling.
Lower dropout rates.Lower repetition rates.Improved primary school attendance.Higher average achievement scores in primary school.
Program: Primary School EducationPrimary education is the crucial phase when the foundation is laid for secondary and ultimately tertiary education. It entails the provision of basic education facilities, hostels, sanitation, library services, recruitment and retention of qualified teachers and support staff, provision of textbooks and other teaching and learning support materials, and the provision of school feeding to all needy learners.
To provide a sound educational basis for children to succeed at secondary schooling.
Improved average achievement scores in secondary school.
In addition to the teaching and learning activities for grades 1−7 learners, which are the core focus areas for the primary phase; sub- activities for professional development and capacity building are also taken care of during the academic year by the regional directorates of education—training of trainers, teachers, heads of departments, school principals, school board members, education officers for advisory services, and inspectors of education—all benefit during such training activities.
continued on next page

Program Budgeting 69
Original Objective Revised Objective Implied Outcomes
Program: Secondary School EducationSecondary education forms the hub of a child’s education. This is the stage where children become adolescents, where their vision for life and careers is clearly formulated. Therefore, the purpose of secondary education is to provide quality teaching and learning at the grades 8−12 levels and produce quality graduates who feed into the system to produce high-quality human capital. Secondary education develops skills and knowledge prerequisite for the country’s socioeconomic development.The program structure makes secondary education a stand-alone program because secondary education is the critical time in the life of the child.This is the stage when children choose a career that determines their future. Secondary education is carried out through teaching activities from grades 8−12. In the past, this program formed part of general education.
To provide quality education that provides a basis for future employment, and vocational or higher education study.
Increased employment rate.Higher gross domestic product per person.
Program: Higher EducationThe purpose of this program is to provide mid- and high-level skills in key priority human resource areas as described in National Development Plan 4. The program focuses on the delivery of higher education in pursuit of a knowledge society. It aims to enhance the relevance and responsiveness of higher education to national development goals, accredit programs of higher education institutions, and audit higher education institutions. It also aims to provide funding to students from disadvantaged communities who aspire to pursue higher education qualifications.
To produce graduates with internationally recognized skill sets needed to meet <insert country’s name> development goals.
Lower share of technical positions filled from foreign recruitment.Increased gross domestic product.Increased employment in knowledge-based industries.
Source: Based on the author’s proposed rewrite of an African country’s 2013 education objectives.
The program name should be short and informative (for example, “Adult Literacy”). Such a name makes clear to the political leadership, the Parliament, and the public what the program is about. A program’s targeted outcome(s), output(s), objective(s), or beneficiaries contained in the program’s original establishment documents will also provide clarity for interested persons. For example, education ministries typically have separate programs for primary and secondary education. These programs can be linked to an overarching outcome for the ministry (say, “educated and socialized young people”), but target different beneficiaries and have different lower-level objectives, as in Table A1.2.
Furthermore, the activity should also be described so the reader can clearly understand the type of activities to which resources are directed.
Table A1.2 continued

70 Appendix 1
A1.4. How Many Programs, Subprograms, and Activities?
Historical literature often refers to limiting the number of programs within a ministerial or departmental administrative structure. Limiting the number of programs to a “manageable” level ranges between 4 and 10, depending on the complexity of the agency.
However, such limitations were arbitrary, and usually developed in response to the circumstances of the sponsoring reform agency (usually the Ministry of Finance of the particular jurisdiction) at the time the available program budgeting guidance was written (primarily during the mid-1980s). Factors that led to the arbitrary upper limit on the number of programs in an organization’s budget included
• size of the line agencies’ budgets; • a manual (rather than electronic) editing process using hard copies of draft budget
documents, leading to a desire to limit the size and content of the budget documents;• desire to limit printing costs; • desire to keep documentation accessible and not overly cluttered with detail;• a very limited (by today’s standards) memory and processing capacity of computers at the
time when program budgeting was becoming more widely fashionable; and• limited computer literacy and end-user capacity of organization personnel, meaning that the
analysis of numerous programs or subprograms was time-consuming and difficult to manage.
With the explosive growth in computer processing speeds, storage capacity, analytical capacity, and reduced cost of hardware and software, arbitrary limitations imposed on the number of programs and subprograms can be relaxed or ignored. Instead, the number of programs and subprograms can be determined by other considerations, such as the
(i) number of objectives and sub-objectives funded under each organizational appropriation with community-level significance,
(ii) number of funded objectives and sub-objectives with political-level significance,
(iii) relative importance (size) of funding for a particular objective or sub-objective vis-a-vis the total organizational appropriation,
(iv) relative importance to a particular sector of the outputs produced by the proposed program or subprogram (not only the inputs used), and
(v) ease that organizational administration costs may be allocated across programs.
In general, the first two criteria are a matter of perception, judgment, and government direction. The last three criteria can be quantified using a “rule of thumb.” Regarding criterion iii, for example, if funding for an objective constitutes 10% or more of the total budget for the organization, it should be identified as a distinct program or subprogram.
If a proposed subprogram constitutes less than 10% of the funding provided for a program then, unless criteria i or ii applies, it may be considered for merging with another subprogram with a similar output objective. The wording of the objective of the
The number of funded objectives considered very important
to the community should be a determinant of the number
of programs or subprograms identified for the organization

Program Budgeting 71
merged subprogram may need to be revised so that its description adequately encompasses all funding for the subprogram. Similarly, the name of the merged subprogram may need to be refined.
On criterion iv, where the agency produces a significant proportion of the national or regional output of a particular good or service (including revenue collection), then the expenditure that delivers that output should be identified as a separate program or subprogram. A “significant” level might be 5% or more at either the national or regional level, but this is, again, a “rule of thumb.”
On criterion v, if administrative expenses can be appropriately allocated across an agency’s programs and subprograms, there is no need to identify a separate program for “General Administration.” However, if it is logistically difficult to reasonably identify the appropriate allocation of overheads to the different programs and/or subprograms, it may be simpler and/or proper to create a special purpose program for identifying all costs associated with coordination, management, and administration of the agency as a whole.
Ministerial portfolios that receive a significantly large proportion of the total budget and have significant importance at both the community and political levels, such as education or health, are likely to have numerous programs and subprograms that need to be separately and explicitly identified and evaluated.
A1.5. Aligning Program Budget Structure and Organizational Structure
The organizational structure needs to be aligned to a logically sound program budget structure, but not rigidly so.
The more diverse the agency, the more programs are likely to be required and the less appropriate it is to develop a program structure without subprograms. Therefore, the agency should
(i) identify the various agency initiatives and expenditures that can be collated into distinct expenditure programs directed toward a single objective;
(ii) identify and name the agency programs adequately, preferably with reference to the objectives that are widely accepted as being associated with the portfolio;
(iii) organize all identified initiatives into overarching programs and their subprograms—more complex ministries, such as education, could have up to 20−30 distinct subprograms across the programs; and
(iv) analyze each program and subprogram and work out the broad production phases as activities—organizations of significant size and diversity, such as the education or health sectors, could have between 60−90 components.
The agency should not limit itself to having organizational divisions at only one level of the program structure (i.e., one program may be served by several organizational divisions as subprograms, or one organizational division may constitute a single program).
The number of activities representing a production process should, usually, not be less than three, representing a beginning, middle, and an end to a production process

72 Appendix 1
Organizational protocols and niceties must not be allowed to drive program budgeting structures, and organizational structures should not be driven by the program budgeting structure, although human nature often makes following that advice difficult.
The key to success is that organizational divisions and the program budgeting structure are linked clearly at different points that may be specific to each program, and that all agency staff, decision makers, and the public understand the links. Furthermore, programs require a program manager to be accountable for operations, and the same program manager can be accountable for multiple programs, or for one, more or all subprograms.
Cost center or subprogram? Regarding the program structure, care should be taken to avoid classifying administrative units as a subprogram for no reason other than their discrete administrative nature. It may be more appropriate to reflect an administrative unit as a cost center under a subprogram of, say, “Policy Coordination” or “Planning and Support Services.” For example, the “Office of the Minister”80 and or “chief executive officer” are more of cost centers to be recorded under either, for example, “Policy Coordination” or “Planning and Support Services,” or both.
However, the classification of the Office of the Minister as a cost center does not prevent the minister from also holding the role of program or subprogram manager for one or the other, or of both a policy coordination subprogram and planning and support services subprogram.
Activities versus subprograms. In some cases, not having a subprogram level between the program and activities levels of program budgeting can be problematic. If the level of “activity” is so broad that it is akin to a subprogram, the whole purpose of program budgeting is defeated. Program budgeting’s original intent was to facilitate the transparent costing of activities undertaken to deliver some end-output. However, over-aggregation, where a single activity takes on the role of a subprogram, means that costing is not carried out at the activity level but at a highly aggregated level of line items at the subprogram level.
Where a policy decision has been made, for whatever reason, not to use the concept of subprograms, the alternative is to split the “activities” into new programs or create sub-activities under the activities.
Lines of accountability. When establishing a program classification, it is important to ensure that
• clear responsibility for managing each program or subprogram, and accountability for its results, is allocated to a specific unit and/or program manager within the ministry or department concerned; and
• the program classification provides a cost-effective and useful basis for data collection, reporting, monitoring, and analysis.
Activities may contribute to more than one program, although they should be aligned with only one program manager.
As for administrative classifications, there is no specific international norm for codifying programs. Program classification depends on the needs in each country, and on both the implementing agencies and the central agencies such as finance, planning, and human resources.
80 In some government systems, the term “secretary” is equivalent to the term “minister” as used here.
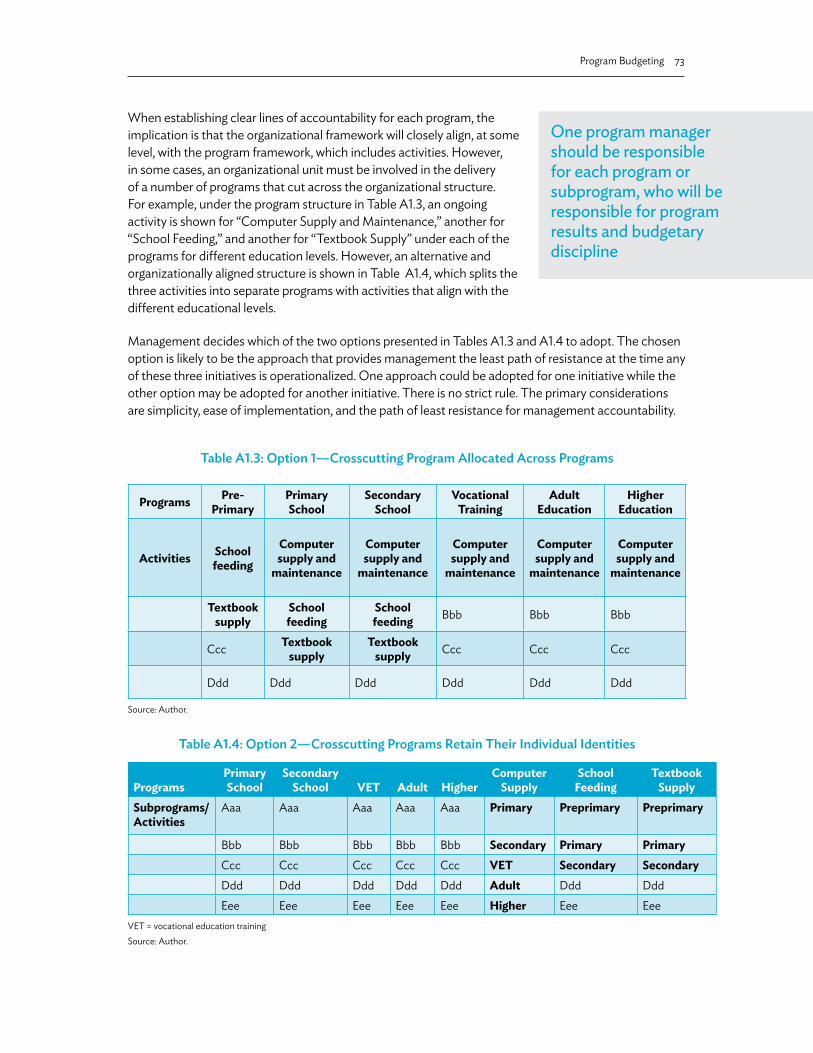
Program Budgeting 73
When establishing clear lines of accountability for each program, the implication is that the organizational framework will closely align, at some level, with the program framework, which includes activities. However, in some cases, an organizational unit must be involved in the delivery of a number of programs that cut across the organizational structure. For example, under the program structure in Table A1.3, an ongoing activity is shown for “Computer Supply and Maintenance,” another for “School Feeding,” and another for “Textbook Supply” under each of the programs for different education levels. However, an alternative and organizationally aligned structure is shown in Table A1.4, which splits the three activities into separate programs with activities that align with the different educational levels.
Management decides which of the two options presented in Tables A1.3 and A1.4 to adopt. The chosen option is likely to be the approach that provides management the least path of resistance at the time any of these three initiatives is operationalized. One approach could be adopted for one initiative while the other option may be adopted for another initiative. There is no strict rule. The primary considerations are simplicity, ease of implementation, and the path of least resistance for management accountability.
Table A1.3: Option 1—Crosscutting Program Allocated Across Programs
Programs Pre-Primary
Primary School
Secondary School
Vocational Training
Adult Education
Higher Education
Activities School feeding
Computer supply and
maintenance
Computer supply and
maintenance
Computer supply and
maintenance
Computer supply and
maintenance
Computer supply and
maintenance
Textbook supply
School feeding
School feeding Bbb Bbb Bbb
Ccc Textbook supply
Textbook supply Ccc Ccc Ccc
Ddd Ddd Ddd Ddd Ddd Ddd
Source: Author.
Table A1.4: Option 2—Crosscutting Programs Retain Their Individual Identities
ProgramsPrimary School
Secondary School VET Adult Higher
Computer Supply
School Feeding
Textbook Supply
Subprograms/ Activities
Aaa Aaa Aaa Aaa Aaa Primary Preprimary Preprimary
Bbb Bbb Bbb Bbb Bbb Secondary Primary PrimaryCcc Ccc Ccc Ccc Ccc VET Secondary SecondaryDdd Ddd Ddd Ddd Ddd Adult Ddd DddEee Eee Eee Eee Eee Higher Eee Eee
VET = vocational education trainingSource: Author.
One program manager should be responsible for each program or subprogram, who will be responsible for program results and budgetary discipline

74 Appendix 1
A1.6. Performance-Based Program Budgeting
Performance-based program budgeting (PBPB) may be loosely interpreted to be any program budgeting structure that uses performance indicators, both financial and nonfinancial, to inform the reader of the delivery of outputs under the program and the achievement of objectives.
PBPB may be implemented in a variety of ways. At one end of the spectrum, the PBPB framework may be implemented using a highly structured approach with tightly defined definitions of performance indicators focused on a particular aspect of the program. At the other end of the spectrum, the PBPB framework may have minimum structure and/or rigor with a variety of performance indicators overlaying the program budgeting structure, some being process and input indicators while others may measure outputs and/or outcomes. Using this second approach, the analyst is left with much freedom as to how to interpret performance and results.
APPENDIX 2Medium-Term Expenditure Frameworks
A2.1. Introduction
There are many misconceptions surrounding the role and function of medium-term expenditure frameworks (MTEFs). Some people think that the MTEF is an integral part of performance-based program budgeting and RBBM. It is not. The MTEF is a stand-alone process intended to assist in two critical areas by
(i) setting a resource envelope within which budget preparation should be undertaken, and
(ii) assisting managers to plan programmatic expenditures over multiple budgeting periods.
The level of detail and number of pages in a typical MTEF document has increased exponentially in recent times. The original concept of an MTEF was simple and straightforward. First, estimate the government’s resource constraint over the forward estimates period, which should have been calculated with certainty for the budget year but with less certainty the further out the estimates are. Second, allocate the resource constraint across departments, with due regard to their existing commitments and allowing for government’s policy statements and commitments to incur new expenditure.
In recent times, many MTEFs changed to setting limits on programmatic expenditures, not only departmental ceilings.
While a well-constructed MTEF combined with its disciplined use is exceptionally useful for budget management and planning, it is only a supplementary tool to the RBBM framework. Furthermore, while many countries claim to have implemented an MTEF and forward estimates, they are of limited use if the preparation is treated merely as a formal compliance exercise with little or no consequences for inaccuracy of estimates and little or no influence on future budget allocations.
A2.2. Background
The concept of an MTEF originated in the evolution of Australia’s forward estimates system, which was first established when Australia had a line-item budgeting system. The forward estimates were subsequently supplemented by the calculation of “global limits,” which were imposed on departmental budgets at the outset of the budget preparation process, based on someone’s estimate of the resource constraint, which was itself based on a fiscal deficit and/or surplus target.
Australia introduced the notion of forward estimates into its budgeting software system before 1984. However, the forward estimates, while updated semiannually, were not used for any strategic purpose until much later, and in 1984 and even 1985, their accuracy could best be described as “tenuous.”

76 APPENDIX 2
Nevertheless, an electronic system was established, which was centrally managed in a highly efficient manner that drove the momentum in later years and, in the meantime, the central managers asked the budget divisions of the Department of Finance to gradually introduce more rigor and accuracy into the forward estimates.
With the shift toward program budgeting in 1985 and the introduction of the concept of global limits, improving the accuracy of the forward estimates became important. Subsequently, the Department of Finance’s Financial Management and Accounting Policy Division issued a circular to all budget divisions to work through the forward estimates and ensure compliance with a set of policies and guidelines for ensuring the current and future accuracy of the forward estimates in the system.
Through this gradual process of enhancing the management and use of the forward estimates, and especially through tight control and oversight exercised over the database by the Financial Management and Accounting Policy Division, a set of credible forward estimates was gradually generated. This supported the calculation of forward commitments and estimated revenues, allowing for a more accurate calculation of available fiscal space. The forward revenue estimates generated were used as the basis for
(i) calculating the resource envelope,
(ii) developing fiscal policy, and
(iii) targeting deficit or surplus numbers, as the case may be.
The introduction of global limits resulted in, either by accident or design, two important changes in the outcomes delivered by Australia’s federal budgeting processes and procedures. First, it brought under control the growth in government expenditures (by design), which at the time was considered unsustainable. To achieve this result required collaboration between the central agencies and the government’s Cabinet of Ministers. The commitment of the Cabinet to a firm budget ceiling allocated across departments was critical to the success of “global limits.” This was the first rudimentary form of what became known as the “medium-term fiscal framework.” The assumptions underpinning the estimation of the resource envelope and debt sustainability calculations were not made public at the time, but formed the basis of briefings to Cabinet that intended to obtain government endorsement and commitment to the macroeconomic fiscal strategy. This required discipline within the Cabinet during budget preparation period, so that “pet (political) projects” were not approved out of expediency, and control was exercised diligently over total government expenditures.
A series of rules were introduced that allowed agencies to increase expenditures in areas they considered of higher priority, but only if accompanied by offsetting savings in other areas that were of lower priority. These proposals were debated in Cabinet with input from central agencies. Thus, strategic allocation across sectors was determined during Cabinet discussions, while prioritization of programmatic expenditures was allowed to be led by the agencies, albeit with oversight from central agencies and with the opportunity for challenge, with the Cabinet as the final arbiter.
The introduction of global limits was the Government of Australia’s first effort at disciplined application of a “hard” resource constraint, aimed at achieving a maximum deficit target. True to the adage that reform is born out of necessity, Australia had, at the time, an unsustainable level of public debt and an excessive current account deficit fuelled by expansive government spending. Allocating global limits across departments was the first step toward allowing line agencies more freedom to manage their resources, with reduced interference from and accountability to central agencies.

Medium-Term Expenditure Frameworks 77
Secondly, perhaps less by design, global limits freed up the time of central agency staff by reducing the time they spent fighting rear-guard actions to prevent overambitious agencies from obtaining Cabinet approval for tenuous projects. This meant that central agency staff had more time for strategic analysis and reviews, and the budget preparation process became less confrontational. While central agencies still had to review proposals for additional spending within departmental ceilings and proposals to shift resources between programs, the workload was substantially reduced and the quality of analysis improved.
Thus, the MTEF, which started as a basic control on global spending to limit growth in public and private debt, has evolved into a full-fledged budget document in many countries.
The successful introduction in Australia of what is now the MTEF was founded on
(i) long-term planning and foresight (by accident or design),
(ii) automation of data storage and forecasting processes and procedures,
(iii) strong centralized control and quality assurance over the database (of forward estimates),
(iv) a clear end-objective accepted and embraced by political leadership, and
(v) a sensible implementation strategy that appealed to all stakeholders.
In the beginning, the “MTEF” was not a document that was produced, but merely a process of budget management that was followed. No budget document published was identified as “The MTEF” and, therefore, the existing workload was not added to but, instead, was offset by savings elsewhere. However, the current emphasis on “transparency” has meant that the production of the MTEF document is more an additional workload that, in many cases, has not resulted in any offsetting reduction in workload.
Also important to the success of Australia’s MTEF was the transition from line-item budgeting to program budgeting, which allowed expenditure to be viewed in a more strategic light and perhaps assisted the political arm of government when considering the merits of expenditure proposals and sector policies.

APPENDIX 3Aligning the Classification of Government Functions Outcome Classification Structure
Appendix 3 shows how expenditure that is classified according to the COFOG framework can be subsumed under an outcomes framework, using a translation file.
To interpret the table, consider that expenditure under each COFOG categorization will be grouped beneath an overarching outcome description. Further sub-categorizations of outcomes (sub-outcomes) can be constructed under the overarching outcome descriptions, under which the COFOG structure can be more finely aligned according to purpose. The number of sub-outcome levels would be determined according to the complexity of the national budget but, generally, no more than three should be necessary.
Outputs would then be linked to the lowest level outcome categorization, and the actual expenditure recorded according to outputs could then be reported according to the level of aggregation required for a particular report. Thus, the COFOG structure provides a useful starting point to identifying a generalized, long-lived outcomes structure that is appropriate irrespective of changes in government.

Aligning the Classification of Government Functions Outcome Classification Structure 79
Tabl
e A
3: T
rans
latin
g Fu
nctio
ns o
f Gov
ernm
ent i
nto
an O
utco
mes
Str
uctu
re
COFO
G
Code
Uni
ted
Nat
ions
Sta
tistic
s Div
isio
n CO
FOG
D
escr
iptio
ns
Exam
ple
Out
com
e Co
de
Leve
l 1 O
utco
me
Clas
sific
atio
n St
ruct
ure
Leve
l 2
Sub-
Out
com
eLe
vel 3
Su
b-O
utco
me
01
Gen
eral
pub
lic se
rvic
es01
00H
igh
qual
ity
gove
rnan
ce01
.1Ex
ecut
ive
and
legi
slativ
e or
gans
, fina
ncia
l an
d fis
cal a
ffairs
, ext
erna
l affa
irs01
03Pa
rliam
enta
ry sy
stem
is c
orru
ptio
n-fre
e an
d he
ld in
hig
h re
gard
.01
.1.1
Exec
utiv
e an
d le
gisla
tive
orga
ns (C
S)01
.1.2
Fina
ncia
l and
fisc
al a
ffairs
(CS
)01
.1.3
Exte
rnal
affa
irs (C
S)01
.2Fo
reig
n ec
onom
ic a
id01
02Fo
reig
n ai
d is
disp
ense
d fa
irly
and
acco
rdin
g to
purp
ose.
01.2
.1Ec
onom
ic a
id to
dev
elop
ing c
ount
ries
and
coun
tries
in tr
ansit
ion
(CS)
01.2
.2Ec
onom
ic a
id ro
uted
thro
ugh
inte
rnat
iona
l org
aniza
tions
(CS
)01
.3G
ener
al se
rvic
es01
01Pu
blic
serv
ice
is co
rrupt
ion-
free
and
effici
ent.
01.3
.1 G
ener
al p
erso
nnel
serv
ices
(CS)
01.3
.2O
vera
ll pla
nnin
g and
stat
istic
al se
rvic
es (C
S)01
.3.3
O
ther
gene
ral s
ervi
ces (
CS)
01.4
Basic
rese
arch
0101
Publ
ic se
rvic
e is
corru
ptio
n-fre
e an
d effi
cien
t.01
.4.0
Basic
rese
arch
(CS)
01.5
R&D
gene
ral p
ublic
serv
ices
0101
Publ
ic se
rvic
e is
corru
ptio
n-fre
e an
d effi
cien
t.01
.5.0
R&D
gene
ral p
ublic
serv
ices
(CS
)01
.6G
ener
al p
ublic
serv
ices
n.e
.c.
0101
Publ
ic se
rvic
e is
corru
ptio
n-fre
e an
d effi
cien
t.01
.6.0
Gen
eral
pub
lic se
rvic
es n
.e.c
. (CS
)01
.7
Publ
ic d
ebt t
rans
actio
ns01
01Pu
blic
serv
ice
is co
rrupt
ion-
free
and
effici
ent.
01.7.
0 Pu
blic
deb
t tra
nsac
tions
(CS)
cont
inue
d on
nex
t pag
e

80 Appendix 3
COFO
G
Code
Uni
ted
Nat
ions
Sta
tistic
s Div
isio
n CO
FOG
D
escr
iptio
ns
Exam
ple
Out
com
e Co
de
Leve
l 1 O
utco
me
Clas
sific
atio
n St
ruct
ure
Leve
l 2
Sub-
Out
com
eLe
vel 3
Su
b-O
utco
me
01.8
Tr
ansf
ers o
f a ge
nera
l cha
ract
er b
etw
een
diffe
rent
leve
ls of
gove
rnm
ent
0101
Publ
ic se
rvic
e is
corru
ptio
n-fre
e an
d effi
cien
t.
01.8
.0
Tran
sfer
s of a
gene
ral c
hara
cter
bet
wee
n di
ffere
nt le
vels
of go
vern
men
t (CS
)01
01Pu
blic
serv
ice
is co
rrupt
ion-
free
and
effici
ent.
02
D
efen
se02
00Th
e ru
le o
f law
is
uphe
ld a
nd
resp
ecte
d.02
.1
Milit
ary d
efen
se02
01D
efen
se fo
rces
act
acc
ordi
ng to
the
cons
titut
ion
and
defe
nd th
e na
tion.
02.1.
0
Milit
ary d
efen
se (C
S)02
.2
Ci
vil d
efen
se02
01D
efen
se fo
rces
act
acc
ordi
ng to
the
cons
titut
ion
and
defe
nd th
e na
tion.
02.2
.0
Ci
vil d
efen
se (C
S)02
.3
Fore
ign
milit
ary a
id02
01D
efen
se fo
rces
act
acc
ordi
ng to
the
cons
titut
ion
and
defe
nd th
e na
tion.
02.3
.0
Fo
reig
n m
ilitar
y aid
(CS)
02.4
R&
D d
efen
se02
01D
efen
se fo
rces
act
acc
ordi
ng to
the
cons
titut
ion
and
defe
nd th
e na
tion.
02.4
.0
R&D
def
ense
(CS)
02.5
Def
ense
n.e
.c.
0201
Def
ense
forc
es a
ct a
ccor
ding
to th
e co
nstit
utio
n an
d de
fend
the
natio
n.02
.5.0
Def
ense
n.e
.c. (
CS)
03
Publ
ic o
rder
and
safe
ty02
00Th
e ru
le o
f law
is
uphe
ld a
nd
resp
ecte
d03
.1
Po
lice
serv
ices
0202
Polic
e an
d se
curit
y ser
vice
s are
cor
rupt
ion-
free
and
appl
y the
law
app
ropr
iate
ly
to th
e pu
blic
and
them
selv
es.
03.1.
0
Po
lice
serv
ices
(CS)
Tabl
e A
3 co
ntin
ued
cont
inue
d on
nex
t pag
e

Aligning the Classification of Government Functions Outcome Classification Structure 81
COFO
G
Code
Uni
ted
Nat
ions
Sta
tistic
s Div
isio
n CO
FOG
D
escr
iptio
ns
Exam
ple
Out
com
e Co
de
Leve
l 1 O
utco
me
Clas
sific
atio
n St
ruct
ure
Leve
l 2
Sub-
Out
com
eLe
vel 3
Su
b-O
utco
me
03.2
Fi
re-p
rote
ctio
n se
rvic
es02
04Th
e pu
blic
is p
rote
cted
from
fir
e an
d na
tura
l disa
ster
s.03
.2.0
Fire
-pro
tect
ion
serv
ices
(CS)
03.3
La
w c
ourts
0203
Judi
cial
syst
em is
cor
rupt
ion-
free
and
appl
ies t
he la
w a
ppro
pria
tely.
03.3
.0
La
w c
ourts
(CS)
03.4
Priso
ns02
03Ju
dici
al sy
stem
is c
orru
ptio
n-fre
e an
d ap
plie
s the
law
app
ropr
iate
ly.03
.4.0
Priso
ns (C
S)03
.5
R&
D p
ublic
ord
er a
nd sa
fety
0202
Polic
e an
d se
curit
y ser
vice
s are
cor
rupt
ion-
free
and
appl
y the
law
app
ropr
iate
ly
to th
e pu
blic
and
them
selv
es.
03.5
.0
R&
D p
ublic
ord
er a
nd sa
fety
(CS)
03.6
Publ
ic o
rder
and
safe
ty n
.e.c
.02
02Po
lice
and
secu
rity s
ervi
ces a
re c
orru
ptio
n-fre
e an
d ap
ply t
he la
w a
ppro
pria
tely
to
the
publ
ic a
nd th
emse
lves
.03
.6.0
Publ
ic o
rder
and
safe
ty n
.e.c
. (CS
)04
Ec
onom
ic a
ffairs
0300
Sust
aina
ble
econ
omic
de
velo
pmen
t04
.1
G
ener
al e
cono
mic
, com
mer
cial
, and
labo
r affa
irs03
01Th
e pr
ivat
e se
ctor
is th
e pr
imar
y driv
er
of e
cono
mic
dev
elop
men
t and
grow
th.
0313
The
labo
r mar
ket i
s com
petit
ive.
04.1.
1
Gen
eral
eco
nom
ic a
nd c
omm
erci
al a
ffairs
(CS)
04.1.
2
Gen
eral
labo
r affa
irs (C
S)04
.2
Agr
icul
ture
, for
estry
, fish
ing,
and
hunt
ing
Tabl
e A
3 co
ntin
ued
cont
inue
d on
nex
t pag
e
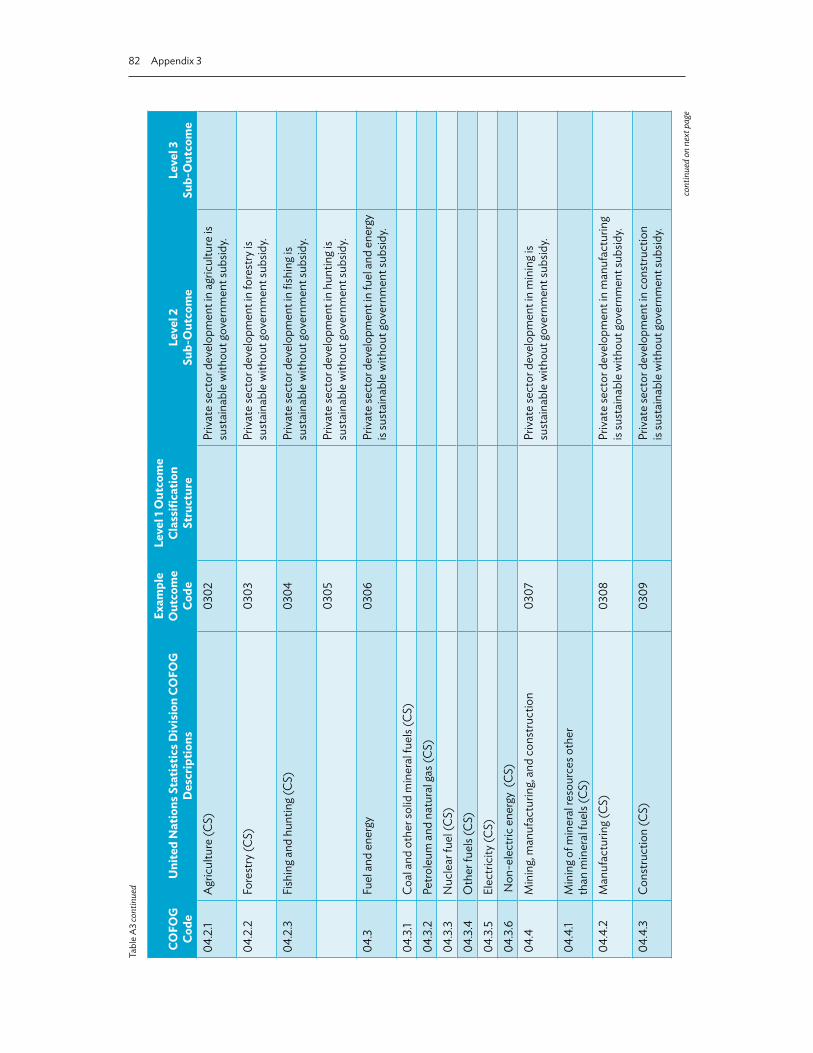
82 Appendix 3
COFO
G
Code
Uni
ted
Nat
ions
Sta
tistic
s Div
isio
n CO
FOG
D
escr
iptio
ns
Exam
ple
Out
com
e Co
de
Leve
l 1 O
utco
me
Clas
sific
atio
n St
ruct
ure
Leve
l 2
Sub-
Out
com
eLe
vel 3
Su
b-O
utco
me
04.2
.1
A
gric
ultu
re (C
S)03
02Pr
ivat
e se
ctor
dev
elop
men
t in
agric
ultu
re is
su
stai
nabl
e w
ithou
t gov
ernm
ent s
ubsid
y.
04.2
.2
Fo
rest
ry (C
S)03
03Pr
ivat
e se
ctor
dev
elop
men
t in
fore
stry
is
sust
aina
ble
with
out g
over
nmen
t sub
sidy.
04.2
.3
Fi
shin
g and
hun
ting (
CS)
0304
Priv
ate
sect
or d
evel
opm
ent i
n fis
hing
is
sust
aina
ble
with
out g
over
nmen
t sub
sidy.
0305
Priv
ate
sect
or d
evel
opm
ent i
n hu
ntin
g is
sust
aina
ble
with
out g
over
nmen
t sub
sidy.
04.3
Fu
el a
nd e
nerg
y03
06Pr
ivat
e se
ctor
dev
elop
men
t in
fuel
and
ener
gy
is su
stai
nabl
e w
ithou
t gov
ernm
ent s
ubsid
y.
04.3
.1
Co
al a
nd o
ther
solid
min
eral
fuel
s (CS
)04
.3.2
Petro
leum
and
nat
ural
gas (
CS)
04.3
.3
N
ucle
ar fu
el (C
S)04
.3.4
Oth
er fu
els (
CS)
04.3
.5
El
ectri
city
(CS)
04.3
.6
N
on-e
lect
ric e
nerg
y (C
S)04
.4
Min
ing,
man
ufac
turin
g, an
d co
nstru
ctio
n03
07Pr
ivat
e se
ctor
dev
elop
men
t in
min
ing i
s su
stai
nabl
e w
ithou
t gov
ernm
ent s
ubsid
y.
04.4
.1
M
inin
g of m
iner
al re
sour
ces o
ther
th
an m
iner
al fu
els (
CS)
04.4
.2
M
anuf
actu
ring (
CS)
0308
Priv
ate
sect
or d
evel
opm
ent i
n m
anuf
actu
ring
is su
stai
nabl
e w
ithou
t gov
ernm
ent s
ubsid
y.
04.4
.3
Co
nstru
ctio
n (C
S)03
09Pr
ivat
e se
ctor
dev
elop
men
t in
cons
truct
ion
is su
stai
nabl
e w
ithou
t gov
ernm
ent s
ubsid
y.
Tabl
e A
3 co
ntin
ued
cont
inue
d on
nex
t pag
e

Aligning the Classification of Government Functions Outcome Classification Structure 83
COFO
G
Code
Uni
ted
Nat
ions
Sta
tistic
s Div
isio
n CO
FOG
D
escr
iptio
ns
Exam
ple
Out
com
e Co
de
Leve
l 1 O
utco
me
Clas
sific
atio
n St
ruct
ure
Leve
l 2
Sub-
Out
com
eLe
vel 3
Su
b-O
utco
me
04.5
Tran
spor
t03
10Pr
ivat
e se
ctor
dev
elop
men
t in
trans
port
is su
stai
nabl
e w
ithou
t gov
ernm
ent s
ubsid
y.
04.5
.1
Road
tran
spor
t (CS
)04
.5.2
Wat
er tr
ansp
ort (
CS)
04.5
.3
Ra
ilway
tran
spor
t (CS
)04
.5.4
Air
trans
port
(CS)
04.5
.5
Pi
pelin
e an
d ot
her t
rans
port
(CS)
04.6
Co
mm
unic
atio
n03
11Pr
ivat
e se
ctor
dev
elop
men
t in
tele
com
mun
icat
ions
is su
stai
nabl
e w
ithou
t gov
ernm
ent s
ubsid
y.04
.6.0
Com
mun
icatio
n (C
S)04
.7
Oth
er in
dust
ries
04.7.
1
Dist
ribut
ive
trade
s, st
orag
e an
d w
areh
ousin
g (CS
)04
.7.2
Hot
els a
nd re
stau
rant
s (CS
)04
.7.3
Tour
ism (C
S)03
12Pr
ivat
e se
ctor
dev
elop
men
t in
the
tour
ism in
dust
ry is
sust
aina
ble
with
out g
over
nmen
t sub
sidy.
04.7.
4
M
ultip
urpo
se d
evel
opm
ent p
roje
cts (
CS)
0301
The
priv
ate
sect
or is
the
prim
ary d
river
of
eco
nom
ic d
evel
opm
ent a
nd gr
owth
.
04.8
R&
D e
cono
mic
affa
irs03
01Th
e pr
ivat
e se
ctor
is th
e pr
imar
y driv
er
of e
cono
mic
dev
elop
men
t and
grow
th.
04.8
.1
R&D
gene
ral e
cono
mic
, com
mer
cial
an
d la
bor a
ffairs
(CS)
04.8
.2
R
&D
agr
icul
ture
, for
estry
, fish
ing,
and
hunt
ing (
CS)
04.8
.3
R&
D fu
el a
nd e
nerg
y (CS
)
Tabl
e A
3 co
ntin
ued
cont
inue
d on
nex
t pag
e

84 Appendix 3
COFO
G
Code
Uni
ted
Nat
ions
Sta
tistic
s Div
isio
n CO
FOG
D
escr
iptio
ns
Exam
ple
Out
com
e Co
de
Leve
l 1 O
utco
me
Clas
sific
atio
n St
ruct
ure
Leve
l 2
Sub-
Out
com
eLe
vel 3
Su
b-O
utco
me
04.8
.4
R&
D m
inin
g, m
anuf
actu
ring,
and
cons
truct
ion
(CS)
04.8
.5
R&
D tr
ansp
ort (
CS)
04.8
.6
R&
D c
omm
unic
atio
n (C
S)04
.8.7
R&D
oth
er in
dust
ries (
CS)
04.9
Econ
omic
affa
irs n
.e.c
.03
01Th
e pr
ivat
e se
ctor
is th
e pr
imar
y driv
er
of e
cono
mic
dev
elop
men
t and
grow
th.
04.9
.0
Ec
onom
ic a
ffairs
n.e
.c. (
CS)
05
Envi
ronm
enta
l pro
tect
ion
0400
Sust
aina
ble
envi
ronm
enta
l use
an
d de
velo
pmen
t05
.1
W
aste
man
agem
ent
0401
Was
te p
rodu
cts d
o no
t pol
lute
the
land
. 05
.1.0
W
aste
man
agem
ent
(CS)
05.2
W
aste
wat
er m
anag
emen
t04
02W
aste
pro
duct
s do
not p
ollu
te th
e w
ater
s. 05
.2.0
Was
tew
ater
man
agem
ent (
CS)
05.3
Po
llutio
n ab
atem
ent
05.3
.0
Po
llutio
n ab
atem
ent (
CS)
05.4
Pr
otec
tion
of b
iodi
vers
ity a
nd la
ndsc
ape
0403
The
land
scap
e an
d ur
bans
cape
re
mai
n pl
easin
g to
view
.04
04Th
e bo
tani
cal a
nd a
nim
al sp
ecie
s di
vers
ity re
mai
ns in
tact
.05
.4.0
Prot
ectio
n of
bio
dive
rsity
and
land
scap
e (C
S)05
.5
R&
D e
nviro
nmen
tal p
rote
ctio
n04
00Su
stai
nabl
e en
viro
nmen
tal u
se
and
deve
lopm
ent
05.5
.0
R&
D e
nviro
nmen
tal p
rote
ctio
n (C
S)
Tabl
e A
3 co
ntin
ued
cont
inue
d on
nex
t pag
e

Aligning the Classification of Government Functions Outcome Classification Structure 85
COFO
G
Code
Uni
ted
Nat
ions
Sta
tistic
s Div
isio
n CO
FOG
D
escr
iptio
ns
Exam
ple
Out
com
e Co
de
Leve
l 1 O
utco
me
Clas
sific
atio
n St
ruct
ure
Leve
l 2
Sub-
Out
com
eLe
vel 3
Su
b-O
utco
me
05.6
En
viro
nmen
tal p
rote
ctio
n n.
e.c.
05.6
.0
Envi
ronm
enta
l pro
tect
ion
n.e.
c. (C
S)06
H
ousin
g and
com
mun
ity a
men
ities
0500
Hou
sing f
or c
itize
ns06
.1
H
ousin
g dev
elop
men
t05
02H
ousin
g is a
fford
able
, bui
lt to
qua
lity
stan
dard
s, an
d w
ith m
oder
n pu
blic
am
eniti
es.
0503
Age
d, fr
ail, a
nd d
isabl
ed p
erso
ns
unab
le to
car
e fo
r the
mse
lves
ha
ve a
pub
lic h
ousin
g opt
ion.
06.1.
0
H
ousin
g dev
elop
men
t (CS
)06
.2
Com
mun
ity d
evel
opm
ent
0502
Hou
sing i
s affo
rdab
le, b
uilt
to q
ualit
y st
anda
rds,
and
with
mod
ern
publ
ic a
men
ities
.
06.2
.0
Co
mm
unity
dev
elop
men
t (CS
)06
.3
Wat
er su
pply
0501
The
wat
er su
pply
is re
liabl
e an
d sa
fe to
drin
k.06
.3.0
Wat
er su
pply
(CS)
06.4
Stre
et lig
htin
g05
02H
ousin
g is a
fford
able
, bui
lt to
qua
lity
stan
dard
s, an
d w
ith m
oder
n pu
blic
am
eniti
es.
06.4
.0
St
reet
light
ing (
CS)
06.5
R&
D h
ousin
g and
com
mun
ity a
men
ities
0502
Hou
sing i
s affo
rdab
le, b
uilt
to q
ualit
y st
anda
rds,
and
with
mod
ern
publ
ic a
men
ities
.
0503
Age
d, fr
ail, a
nd d
isabl
ed p
erso
ns
unab
le to
car
e fo
r the
mse
lves
ha
ve a
pub
lic h
ousin
g opt
ion.
06.5
.0
R&
D h
ousin
g and
com
mun
ity a
men
ities
(CS)
Tabl
e A
3 co
ntin
ued
cont
inue
d on
nex
t pag
e
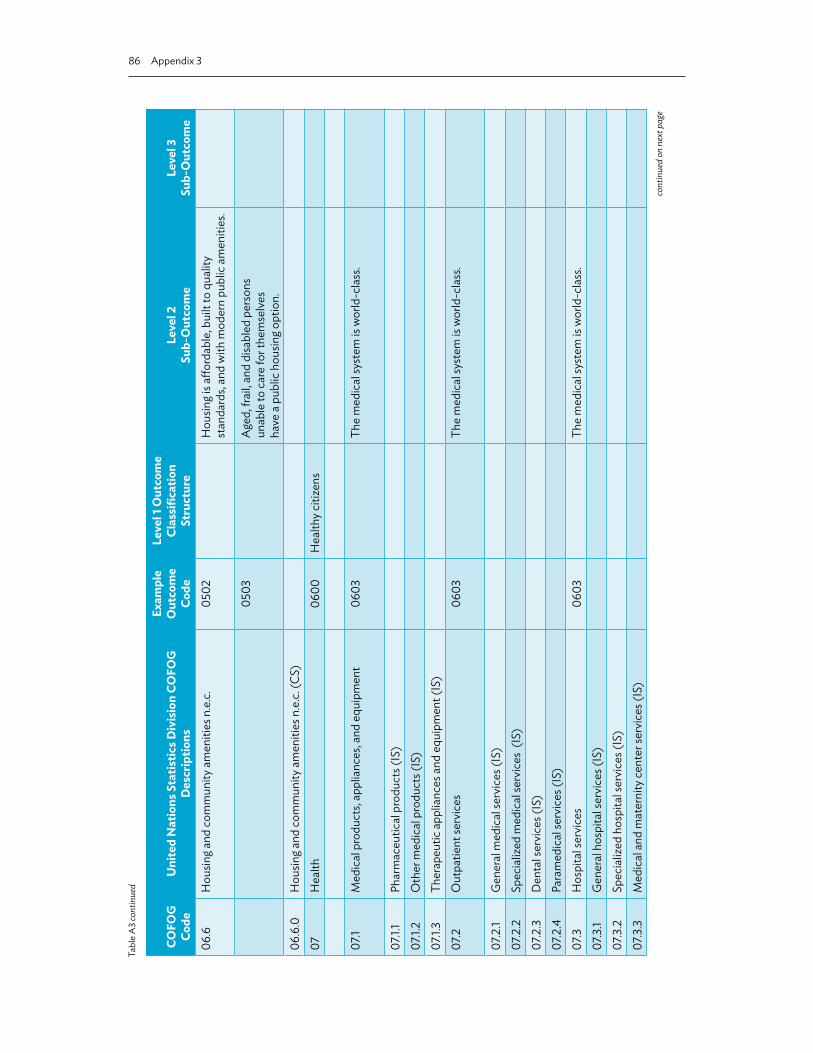
86 Appendix 3
COFO
G
Code
Uni
ted
Nat
ions
Sta
tistic
s Div
isio
n CO
FOG
D
escr
iptio
ns
Exam
ple
Out
com
e Co
de
Leve
l 1 O
utco
me
Clas
sific
atio
n St
ruct
ure
Leve
l 2
Sub-
Out
com
eLe
vel 3
Su
b-O
utco
me
06.6
H
ousin
g and
com
mun
ity a
men
ities
n.e
.c.
0502
Hou
sing i
s affo
rdab
le, b
uilt
to q
ualit
y st
anda
rds,
and
with
mod
ern
publ
ic a
men
ities
.
0503
Age
d, fr
ail, a
nd d
isabl
ed p
erso
ns
unab
le to
car
e fo
r the
mse
lves
ha
ve a
pub
lic h
ousin
g opt
ion.
06.6
.0
H
ousin
g and
com
mun
ity a
men
ities
n.e
.c. (
CS)
07
Hea
lth06
00H
ealth
y citi
zens
07.1
Med
ical
pro
duct
s, ap
plia
nces
, and
equ
ipm
ent
0603
The
med
ical
syst
em is
wor
ld-c
lass
.
07.1.
1
Phar
mac
eutic
al p
rodu
cts (
IS)
07.1.
2
O
ther
med
ical
pro
duct
s (IS
)07
.1.3
Ther
apeu
tic a
pplia
nces
and
equ
ipm
ent (
IS)
07.2
O
utpa
tient
serv
ices
0603
The
med
ical
syst
em is
wor
ld-c
lass
.
07.2
.1
G
ener
al m
edic
al se
rvic
es (I
S)07
.2.2
Spec
ializ
ed m
edic
al se
rvic
es (
IS)
07.2
.3
D
enta
l ser
vice
s (IS
)07
.2.4
Para
med
ical
serv
ices
(IS)
07.3
H
ospi
tal s
ervi
ces
0603
The
med
ical
syst
em is
wor
ld-c
lass
.07
.3.1
Gen
eral
hos
pita
l ser
vice
s (IS
)07
.3.2
Spec
ializ
ed h
ospi
tal s
ervi
ces (
IS)
07.3
.3
M
edic
al a
nd m
ater
nity
cen
ter s
ervi
ces (
IS)
Tabl
e A
3 co
ntin
ued
cont
inue
d on
nex
t pag
e

Aligning the Classification of Government Functions Outcome Classification Structure 87
COFO
G
Code
Uni
ted
Nat
ions
Sta
tistic
s Div
isio
n CO
FOG
D
escr
iptio
ns
Exam
ple
Out
com
e Co
de
Leve
l 1 O
utco
me
Clas
sific
atio
n St
ruct
ure
Leve
l 2
Sub-
Out
com
eLe
vel 3
Su
b-O
utco
me
07.3
.4
N
ursin
g and
con
vale
scen
t hom
e se
rvic
es (I
S)07
.4
Publ
ic h
ealth
serv
ices
0601
Child
ren
are
heal
thy.
0602
The
adul
t pop
ulat
ion
is he
alth
y.07
.4.0
Publ
ic h
ealth
serv
ices
(IS)
07.5
R&
D h
ealth
0601
Child
ren
are
heal
thy.
0602
The
adul
t pop
ulat
ion
is he
alth
y.07
.5.0
R&D
hea
lth (C
S)07
.6
Hea
lth n
.e.c
.06
01Th
e ch
ildre
n ar
e he
alth
y.06
02Th
e ad
ult p
opul
atio
n is
heal
thy.
07.6
.0
H
ealth
n.e
.c. (
CS)
08
Recr
eatio
n, c
ultu
re, a
nd re
ligio
n07
00Fr
eedo
m o
f cul
ture
an
d re
ligio
n
08.1
Recr
eatio
nal a
nd sp
ortin
g ser
vice
s06
01Th
e ch
ildre
n ar
e he
alth
y.06
02Th
e ad
ult p
opul
atio
n is
heal
thy.
08.1.
0
Recr
eatio
nal a
nd sp
ortin
g ser
vice
s (IS
)08
.2
Cu
ltura
l ser
vice
s07
01Th
e na
tion
supp
orts
cul
tura
l div
ersit
y.08
.2.0
Cultu
ral s
ervi
ces (
IS)
08.3
Broa
dcas
ting a
nd p
ublis
hing
serv
ices
0701
The
natio
n su
ppor
ts c
ultu
ral d
iver
sity.
08.3
.0
Br
oadc
astin
g and
pub
lishi
ng se
rvic
es (C
S)08
.4
Re
ligio
us a
nd o
ther
com
mun
ity se
rvic
es07
02Th
e na
tion
supp
orts
relig
ious
div
ersit
y
Tabl
e A
3 co
ntin
ued
cont
inue
d on
nex
t pag
e
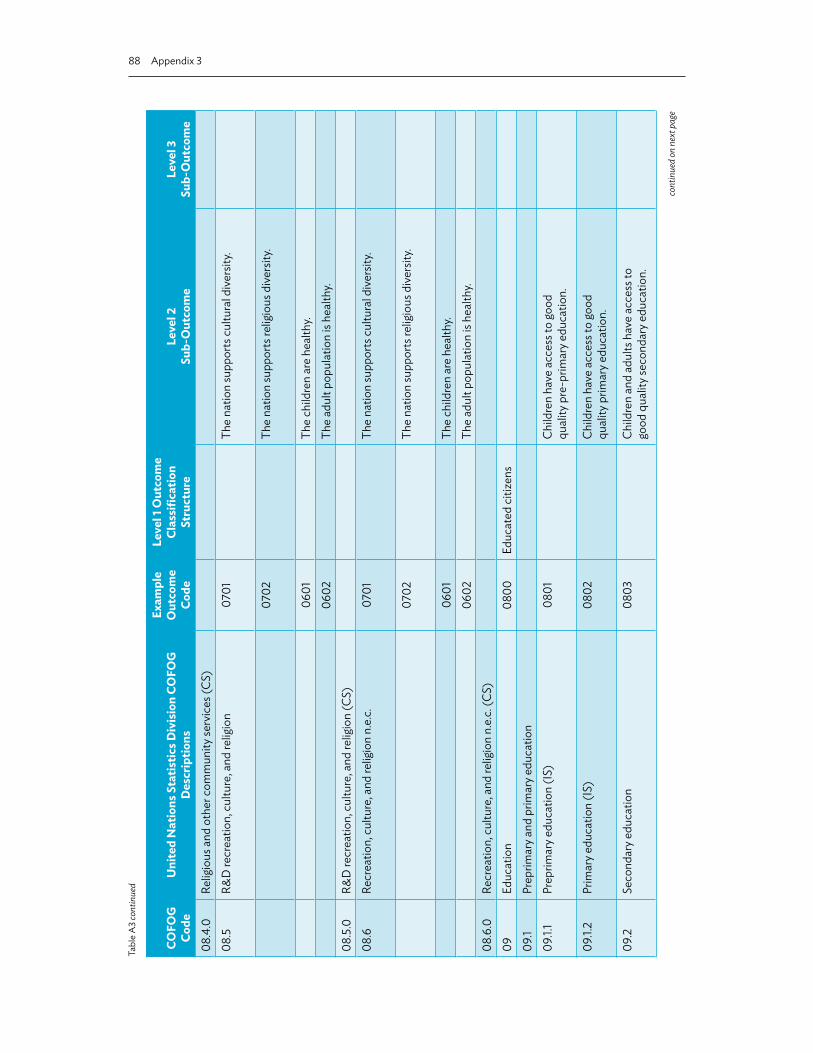
88 Appendix 3
COFO
G
Code
Uni
ted
Nat
ions
Sta
tistic
s Div
isio
n CO
FOG
D
escr
iptio
ns
Exam
ple
Out
com
e Co
de
Leve
l 1 O
utco
me
Clas
sific
atio
n St
ruct
ure
Leve
l 2
Sub-
Out
com
eLe
vel 3
Su
b-O
utco
me
08.4
.0
Re
ligio
us a
nd o
ther
com
mun
ity se
rvic
es (C
S)08
.5
R&D
recr
eatio
n, c
ultu
re, a
nd re
ligio
n07
01Th
e na
tion
supp
orts
cul
tura
l div
ersit
y.
0702
The
natio
n su
ppor
ts re
ligio
us d
iver
sity.
0601
The
child
ren
are
heal
thy.
0602
The
adul
t pop
ulat
ion
is he
alth
y.08
.5.0
R&D
recr
eatio
n, c
ultu
re, a
nd re
ligio
n (C
S)08
.6
Recr
eatio
n, c
ultu
re, a
nd re
ligio
n n.
e.c.
0701
The
natio
n su
ppor
ts c
ultu
ral d
iver
sity.
0702
The
natio
n su
ppor
ts re
ligio
us d
iver
sity.
0601
The
child
ren
are
heal
thy.
0602
The
adul
t pop
ulat
ion
is he
alth
y.08
.6.0
Recr
eatio
n, c
ultu
re, a
nd re
ligio
n n.
e.c.
(CS)
09
Educ
atio
n08
00Ed
ucat
ed c
itize
ns09
.1
Prep
rimar
y and
prim
ary e
duca
tion
09.1.
1
Pr
eprim
ary e
duca
tion
(IS)
0801
Child
ren
have
acc
ess t
o go
od
qual
ity p
re-p
rimar
y edu
catio
n.
09.1.
2
Prim
ary e
duca
tion
(IS)
0802
Child
ren
have
acc
ess t
o go
od
qual
ity p
rimar
y edu
catio
n.
09.2
Se
cond
ary e
duca
tion
0803
Child
ren
and
adul
ts h
ave
acce
ss to
go
od q
ualit
y sec
onda
ry e
duca
tion.
Tabl
e A
3 co
ntin
ued
cont
inue
d on
nex
t pag
e

Aligning the Classification of Government Functions Outcome Classification Structure 89
COFO
G
Code
Uni
ted
Nat
ions
Sta
tistic
s Div
isio
n CO
FOG
D
escr
iptio
ns
Exam
ple
Out
com
e Co
de
Leve
l 1 O
utco
me
Clas
sific
atio
n St
ruct
ure
Leve
l 2
Sub-
Out
com
eLe
vel 3
Su
b-O
utco
me
09.2
.1
Lo
wer
-sec
onda
ry e
duca
tion
(IS)
09.2
.2
Upp
er-s
econ
dary
edu
catio
n (I
S)09
.3
Po
stse
cond
ary n
onte
rtiar
y edu
catio
n08
05Ch
ildre
n an
d ad
ults
hav
e ac
cess
to
good
qua
lity v
ocat
iona
l edu
catio
n.09
.3.0
Post
seco
ndar
y non
terti
ary e
duca
tion
(IS)
09.4
Te
rtiar
y edu
catio
n08
04Th
e po
pula
tion
has a
cces
s to
good
qu
ality
terti
ary e
duca
tion.
09.4
.1
Fi
rst s
tage
of t
ertia
ry e
duca
tion
(IS)
09.4
.2
Se
cond
stag
e of
terti
ary e
duca
tion
(IS)
09.5
Ed
ucat
ion
not d
efina
ble
by le
vel
0800
Educ
ated
citi
zens
09.5
.0
Ed
ucat
ion
not d
efina
ble
by le
vel (
IS)
09.6
Su
bsid
iary
serv
ices
to e
duca
tion
0800
Educ
ated
citi
zens
09.6
.0
Su
bsid
iary
serv
ices
to e
duca
tion
(IS)
09.7
R&
D e
duca
tion
0800
Educ
ated
citi
zens
09.7.
0
R&
D e
duca
tion
(CS)
09.8
Educ
atio
n n.
e.c.
0800
Educ
ated
citi
zens
09.8
.0
Educ
atio
n n.
e.c.
(CS)
10
Soci
al p
rote
ctio
n09
00So
cial
pro
tect
ion
for d
isadv
anta
ged
citiz
ens
10.1
Sick
ness
and
disa
bilit
y09
02Ch
ildre
n ar
e pr
otec
ted
from
sic
knes
s and
hom
eles
snes
s.09
03A
ged
and
disa
bled
peo
ple
are
prot
ecte
d fro
m si
ckne
ss a
nd h
omel
essn
ess.
Tabl
e A
3 co
ntin
ued
cont
inue
d on
nex
t pag
e
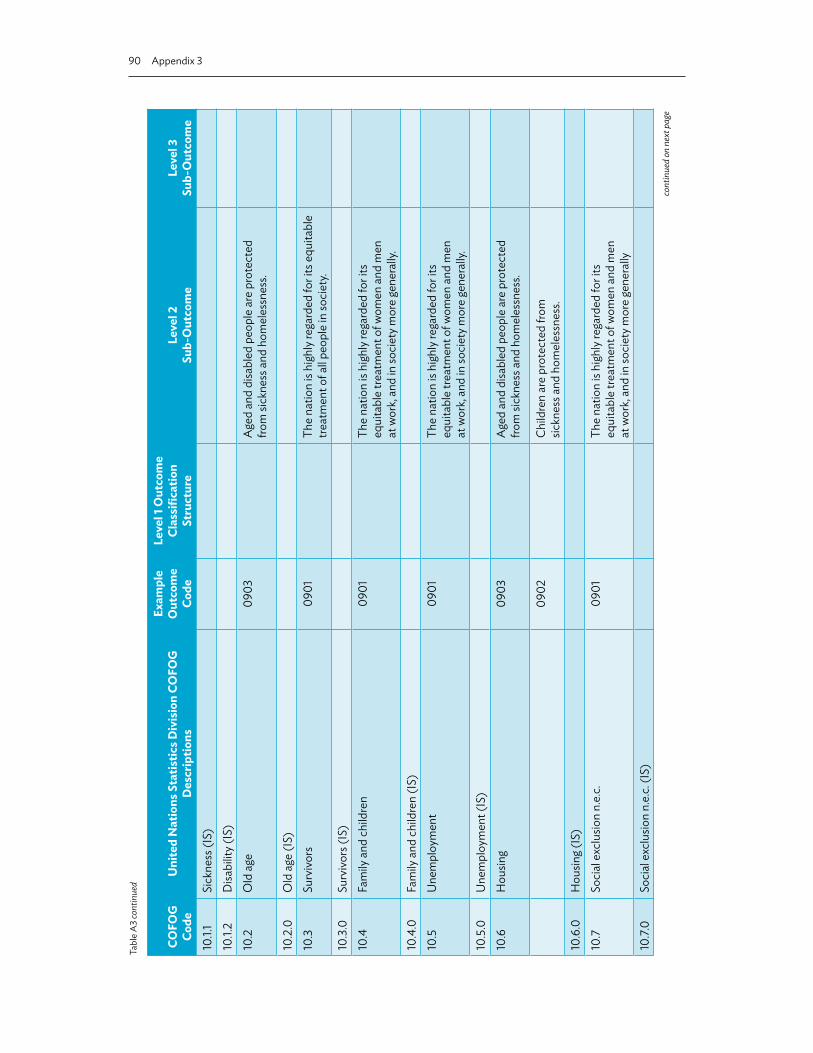
90 Appendix 3
COFO
G
Code
Uni
ted
Nat
ions
Sta
tistic
s Div
isio
n CO
FOG
D
escr
iptio
ns
Exam
ple
Out
com
e Co
de
Leve
l 1 O
utco
me
Clas
sific
atio
n St
ruct
ure
Leve
l 2
Sub-
Out
com
eLe
vel 3
Su
b-O
utco
me
10.1.
1
Sick
ness
(IS)
10.1.
2
Disa
bilit
y (IS
)10
.2
Old
age
0903
Age
d an
d di
sabl
ed p
eopl
e ar
e pr
otec
ted
from
sick
ness
and
hom
eles
snes
s.
10.2
.0
Old
age
(IS)
10.3
Surv
ivor
s09
01Th
e na
tion
is hi
ghly
rega
rded
for i
ts e
quita
ble
treat
men
t of a
ll peo
ple
in so
ciet
y.10
.3.0
Su
rviv
ors (
IS)
10.4
Fa
mily
and
chi
ldre
n09
01Th
e na
tion
is hi
ghly
rega
rded
for i
ts
equi
tabl
e tre
atm
ent o
f wom
en a
nd m
en
at w
ork,
and
in so
ciet
y mor
e ge
nera
lly.
10.4
.0
Fa
mily
and
chi
ldre
n (I
S)10
.5
Une
mpl
oym
ent
0901
The
natio
n is
high
ly re
gard
ed fo
r its
eq
uita
ble
treat
men
t of w
omen
and
men
at
wor
k, an
d in
soci
ety m
ore
gene
rally
.10
.5.0
U
nem
ploy
men
t (IS
)10
.6
H
ousin
g09
03A
ged
and
disa
bled
peo
ple
are
prot
ecte
d fro
m si
ckne
ss a
nd h
omel
essn
ess.
0902
Child
ren
are
prot
ecte
d fro
m
sickn
ess a
nd h
omel
essn
ess.
10.6
.0
H
ousin
g (IS
)10
.7
Soci
al e
xclu
sion
n.e.
c.09
01Th
e na
tion
is hi
ghly
rega
rded
for i
ts
equi
tabl
e tre
atm
ent o
f wom
en a
nd m
en
at w
ork,
and
in so
ciet
y mor
e ge
nera
lly10
.7.0
Soci
al e
xclu
sion
n.e.
c. (I
S)
Tabl
e A
3 co
ntin
ued
cont
inue
d on
nex
t pag
e

Aligning the Classification of Government Functions Outcome Classification Structure 91
COFO
G
Code
Uni
ted
Nat
ions
Sta
tistic
s Div
isio
n CO
FOG
D
escr
iptio
ns
Exam
ple
Out
com
e Co
de
Leve
l 1 O
utco
me
Clas
sific
atio
n St
ruct
ure
Leve
l 2
Sub-
Out
com
eLe
vel 3
Su
b-O
utco
me
10.8
R&
D so
cial
pro
tect
ion
0901
The
natio
n is
high
ly re
gard
ed fo
r its
eq
uita
ble
treat
men
t of w
omen
and
men
at
wor
k, an
d in
soci
ety m
ore
gene
rally
10.8
.0
R&
D so
cial
pro
tect
ion
(CS)
10.9
Soci
al p
rote
ctio
n n.
e.c.
0901
The
natio
n is
high
ly re
gard
ed fo
r its
eq
uita
ble
treat
men
t of w
omen
and
men
at
wor
k, an
d in
soci
ety m
ore
gene
rally
10.9
.0
So
cial
pro
tect
ion
n.e.
c. (C
S)
COFO
G =
cla
ssifi
catio
n of
func
tions
of g
over
nmen
t, CS
= c
olle
ctiv
e se
rvic
es, I
S =
indi
vidu
al se
rvic
es, n
.e.c
. = n
ot e
lsew
here
cla
ssifi
ed,
R&D
= re
sear
ch a
nd d
evel
opm
ent.
Sour
ce: A
utho
r.

APPENDIX 4Common Outputs and their Performance Indicators
Table A4.1: Output Type Classifications (Example)
Output Type Code Common Output Types
Internal Output or External Output at
Organizational Level Comments
0 Not classifiable1 Adjudicatory Services EO
2 Asset Management Services IO/EO Public works sometimes provides this service to other agencies.
3 Collection of Taxes, Fees, and Charges EO
4 Construction Services EO5 Disaster Management Services EO6 Dispute Resolution Services EO
7 Education and Training Services IO/EO This service can be provided across programs or to external clients.
8 Financial Management Services IO/EO This service can be provided across programs or to external clients.
9 Financial Asset and Liability Management Services EO Usually provided by a unit on
behalf of government.10 Hospital Services EO
11 Human Resource Management Services IO
12 Indigenous Development EO
13 Information Management Services IO/EO Can be provided across programs or for the whole of government.
14 Internal Auditing Services IO15 Land Management Services EO
16 Legal Advisory Services IO/EO Can be provided across programs or for the whole of government.
17 Maintenance of Registry(ies) IO/EO Can be provided across programs or for external clients.
18 Network Management IO/EOCan be provided across programs or for the whole of government, or to other external clients.
19 Office Equipment Support Services IO
continued on next page

Common Outputs and their Performance Indicators 93
Output Type Code Common Output Types
Internal Output or External Output at
Organizational Level Comments
20 Organizational Management Services IO
21 Organizational Development Services IO
22 Passenger Services EO23 Planning and Budgeting Services IO24 Primary Education Services EO
25 Property Management IO/EO
Public works sometimes provides this service to other agencies and is also often an internal output across programs.
26 Public Awareness Promotions EO
27 Public Relations and Publicity Services IO
28 Public Reporting EO29 Regulatory Services EO
30 Repair and Maintenance Services IO/EOPublic works sometimes provides this service to other agencies and is also often an internal output.
31 Research and Development EO32 Secondary Education Services EO33 Secretariat Services IO34 Supply of Energy EO35 Supply of Goods EO36 Supply of Manufactured Products EO37 Supply of Water EO38 Surveillance and Policing Services EO
39 Technical Research and Advisory Services EO
40 Tertiary Education Services EO41 Vocational Training EO
42–99 Reserved for future output type code allocations IO/EO On a case-by-case basis, new
outputs may be IO or EO.
EO = external output, IO = internal output.
Source: Author.
Table A4.1 continued
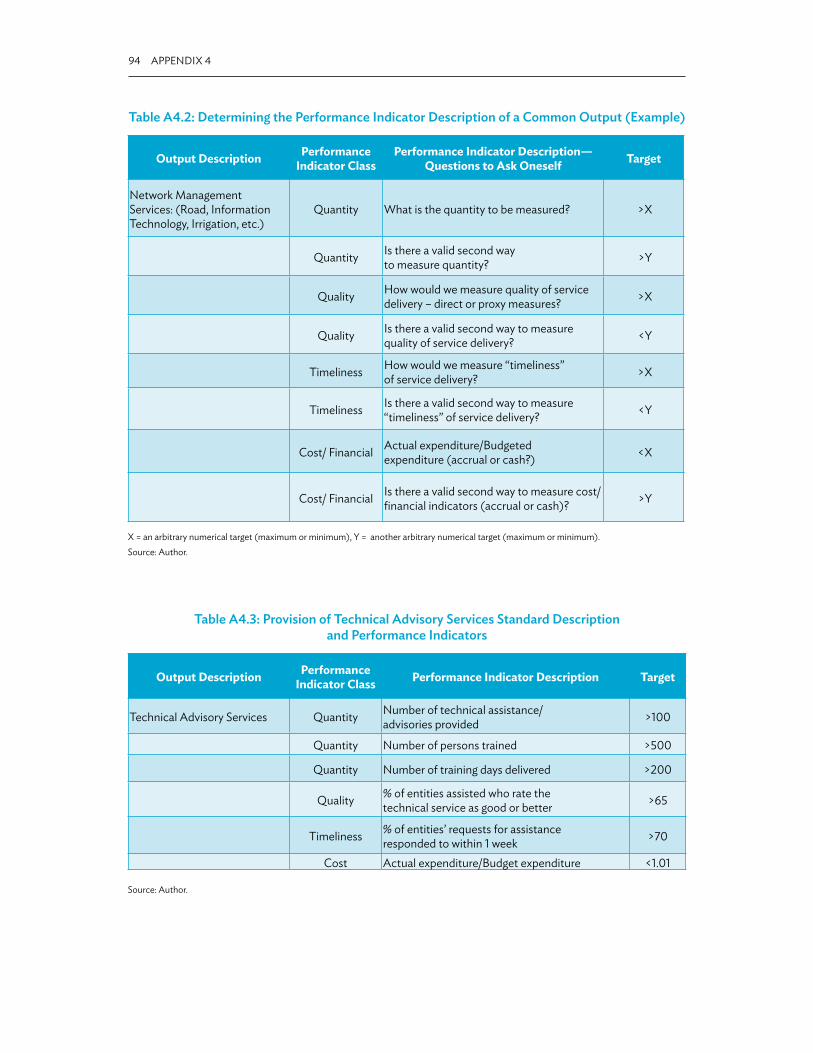
94 APPENDIX 4
Table A4.2: Determining the Performance Indicator Description of a Common Output (Example)
Output Description Performance Indicator Class
Performance Indicator Description—Questions to Ask Oneself Target
Network Management Services: (Road, Information Technology, Irrigation, etc.)
Quantity What is the quantity to be measured? >X
Quantity Is there a valid second way to measure quantity? >Y
Quality How would we measure quality of service delivery – direct or proxy measures? >X
Quality Is there a valid second way to measure quality of service delivery? <Y
Timeliness How would we measure “timeliness” of service delivery? >X
Timeliness Is there a valid second way to measure “timeliness” of service delivery? <Y
Cost/ Financial Actual expenditure/Budgeted expenditure (accrual or cash?) <X
Cost/ Financial Is there a valid second way to measure cost/financial indicators (accrual or cash)? >Y
X = an arbitrary numerical target (maximum or minimum), Y = another arbitrary numerical target (maximum or minimum). Source: Author.
Table A4.3: Provision of Technical Advisory Services Standard Description and Performance Indicators
Output Description Performance Indicator Class Performance Indicator Description Target
Technical Advisory Services Quantity Number of technical assistance/advisories provided >100
Quantity Number of persons trained >500
Quantity Number of training days delivered >200
Quality % of entities assisted who rate the technical service as good or better >65
Timeliness % of entities’ requests for assistance responded to within 1 week >70
Cost Actual expenditure/Budget expenditure <1.01
Source: Author.

Common Outputs and their Performance Indicators 95
Table A4.4: Provision of Legal Advisory Services Standard Description and Performance Indicators
Output Description Performance Indicator Class Performance Indicator Description Target
Provision of legal advisory services Quantity Number of legal advisories provided >100
Quality % of advisories rated by clients as good or better >65
Timeliness % of advisories provided within 10 days of receipt of request >70
Cost Actual expenditure/Budget expenditure <1.01
Source: Author.
Table A4.5: Provision of Management and Administrative Support Services Standard Description and Performance Indicators
Output Description Performance Indicator Class Performance Indicator Description Target
Provision of management and administrative support services Quantity Number of organization coordination
meetings facilitated >12
Quality % of participants who rate the quality of the coordination meetings as good or better >75
Quality Average % of agenda items deferred to a following meeting <10
Timeliness % of meetings that are completed within 10 minutes of their scheduled finishing time >80
Cost Actual expenditure/Budget expenditure <1.01
Source: Author.
Table A4.6: Provision of Internal Audit Services Standard Description and Performance Indicators
Output Description Performance Indicator Class Performance Indicator Description Target
Provision of internal audit services Quantity Number of internal audits undertaken >25
Quantity Number of internal audit reports produced >35
Quality % of clients who rate the internal audit service recommendations as good or better >70
Timeliness % of internal audits completed within 10 business days of commencement >70
Timeliness % of internal audit reports submitted within 10 days of completion of audit >80
Cost Actual expenditure/Budget expenditure <1.01Source: Author.

APPENDIX 5Templates for Capital Budget Proposals
Form 1—Budget Motivation for an Expansion of Service
Proposal for the Expansion of Output Funding
(Note: complete one form for each proposal. All sections should be completed.) Name of Agency: _____________________________________________________Contact Officer for Verification of Technical Detail: ________________________________ Telephone: _____________ E-mail: ________________Part I: Proposal SummaryProgram(s)/Subprogram: _______________________________________________Activity: ___________________________________________________________Output(s): _________________________________________________________
Increase in purchase cost of outputs from the private sector:
Tick if appropriate
Cost of proposed increase in purchase of outputs from the private sector:
Budget (Next) MTEF Year 1 MTEF Year 2 MTEF Year 3Base Cost
Additional Cost Inflation adjustment:Real increase:
Inflation adjustment:Real increase:
Inflation adjustment:Real increase:
Inflation adjustment:Real increase:
Total Cost
MTEF = medium-term expenditure framework.
Increase in production of outputs by the civil service:
Tick if appropriate

Templates for Capital Budget Proposals 97
Cost of proposed increase in cost of outputs by the civil service:
Budget (next) MTEF Year 1 MTEF Year 2 MTEF Year 3OperatingCapitalMaintenance
MTEF = medium-term expenditure framework.
Part II: Scope and Objective(s) of the Proposal
1. Can/is production of the output outsourced to the private sector? [If not, why not? If yes, why should the government continue to manage the production process? What are the financial and other contractual implications of outsourcing or increasing purchases?]
Yes / No [Please circle one]
__________________________________________________________________________________________________________________________________________________________________________________________________________________________________________________________________________________________________________________________________________________________________________________________________________________________________________________________________________________________________________________________________________________________________________________________________________________________________________________________________________
2. Financial relationship between Inputs, Outputs, and Activities of the Proposal
Baseline Output Cost: ___________________
Additional Request: _____________________
Baseline Output Performance Indicators
Impact on Performance Targets of Additional FundingBudget (Next) MTEF Year 1 MTEF Year 2 MTEF Year 3
Quantity Old:
New:Quality Old:
New:Timeliness Old:
New:Cost Old:
New:
MTEF = medium-term expenditure framework.

98 Appendix 5
3. Clearly outline the link between this proposal and the agency’s outputs (In terms of one of the four types of performance measures: quantity, quality, timeliness, and cost).
_________________________________________________________________ ____________________________________________________________________________________________________________________________________________________________________________________________________________________________________________________________________4. How is the increase in output funding expected to impact on the government’s outcome
target(s)?
_________________________________________________________________ ____________________________________________________________________________________________________________________________________________________________________________________________________________________________________________________________________
Targeted Goal Sector Goal IndicatorsBudget (Next)
MTEF Year 1
MTEF Year 2
MTEF Year 3
Old:New:
Old:New:
Old:New:
Old:New:
Old:New:
Old:New:
Old:New:
Old:New:
Old:New:
Old:New:
Old:New:
Old:New:
MTEF = medium-term expenditure framework.
5. Location and duration(Where are the outputs to be produced and where will they be delivered? How long will it take to increase/improve outputs to the intended levels and over what time frame will the expansion/improvement in outputs continue?)
_________________________________________________________________ ____________________________________________________________________________________________________________________________________________________________________________________________________________________________________________________________________

Templates for Capital Budget Proposals 99
6. Clearly identify the impact this proposed expenditure will have on men and women and/or list other agencies likely to be involved/participating in this issue (Include other programs and activities within your own agency that are currently involved in addressing aspects of this issue.)
_________________________________________________________________ ____________________________________________________________________________________________________________________________________________________________________________________________________________________________________________________________________
Part III: Funding the Proposal
7. What are the proposed sources for funding these outputs?(The total operating and capital costs of the project.)
Budget (Next) MTEF Year 1 MTEF Year 2 MTEF Year 3
1. Appropriation Act
2. Others
3. Donor Funds
4. Community/Self-Help
5. User ChargesTOTAL FUNDING REQUIRED
MTEF = medium-term expenditure framework.
8. Sources of funding(Describe how sources might change over time, particularly with respect to user charges.)
_________________________________________________________________ ____________________________________________________________________________________________________________________________________________________________________________________________________________________________________________________________________

100 Appendix 5
Part IV: Financial Analysis of the Proposal
9. Assumptions/risks of this proposal(List key assumptions and describe some possible risks that may hinder the continuance of this proposal/project. This could include human, technical, climatic risks, etc.)
_________________________________________________________________ ____________________________________________________________________________________________________________________________________________________________________________________________________________________________________________________________________
Description of funding needs(Provide a brief summary of what the increase in funding entails and the status of the proposal/project, i.e., what work has been done and what is yet to be completed.)
Capital inputs:
_________________________________________________________________ ____________________________________________________________________________________________________________________________________________________________________________________________________________________________________________________________________
Implications for future maintenance expenditures:
_________________________________________________________________ ____________________________________________________________________________________________________________________________________________________________________________________________________________________________________________________________________
Operating expenses:
_________________________________________________________________ ____________________________________________________________________________________________________________________________________________________________________________________________________________________________________________________________________

Templates for Capital Budget Proposals 101
10. Maintenance schedule(Outline here the implications for maintenance expenditures of any capital purchases.)
Budget (Next) MTEF Year 1 MTEF Year 2 MTEF Year 3Describe types of maintenance required.XxYyZz
Estimated cost of maintenance XxYyZz
Contracted maintenance or in-house?XxYyZz
MTEF = medium-term expenditure framework.
Describe any large maintenance expenditures not covered in the table:
_________________________________________________________________ _____________________________________________________________________________________________________________________________________________________________________________________________________________________________________________________________________________________________________________________________________ _____________________________________________________________________________________________________________________________________________________________________________________________________________________________________________________________________________________________________________________________________ _________________________________________________________________

102 Appendix 5
11. What are the major cost components of this proposal? (Itemize costs associated with the proposal/project and the projections over the duration of this proposal/project. Include the level of recurrent costs.)
($,000)
Current Approved
BudgetAdditional
Request
Proposed
Budget
MTEF Year 1
Projection
MTEF Year 2
Projection
MTEF Year 3
Projection
COSTS:Account Description__________________________________________Total Operating Costs
_____________________
_____________________
_____________________
_____________________
________________________
________________________
Account Description__________________________________________Total Capital Costs
____________________________
____________________________
____________________________
____________________________
________________________________
________________________________
Total of Capital and Operating Costs _______ _______ _______ _______ ________ ________
VAT _______ _______ _______ _______ ________ ________
TOTAL COSTS (VAT inclusive) _______ ______ _______ _______ ________ ________
MTEF = medium-term expenditure framework.
12. What is the estimated net social benefit of this proposal? (Outline the calculations undertaken to justify this proposal in terms of the government guidelines for the calculation of net social benefit.)
_____________________________________________________________________________________________________________________________________________________________________________________________________________________________________________________________________________________________________________________________________

Templates for Capital Budget Proposals 103
Part V: Coordination with Other Agencies
13. Comments(Include comments from other line agencies that are likely to be involved/participating in the issue listed under section 6.)
Other agencies’ comments:
_____________________________________________________________________________________________________________________________________________________________________________________________________________________________________________________________________________________________________________________________________Source: Author.
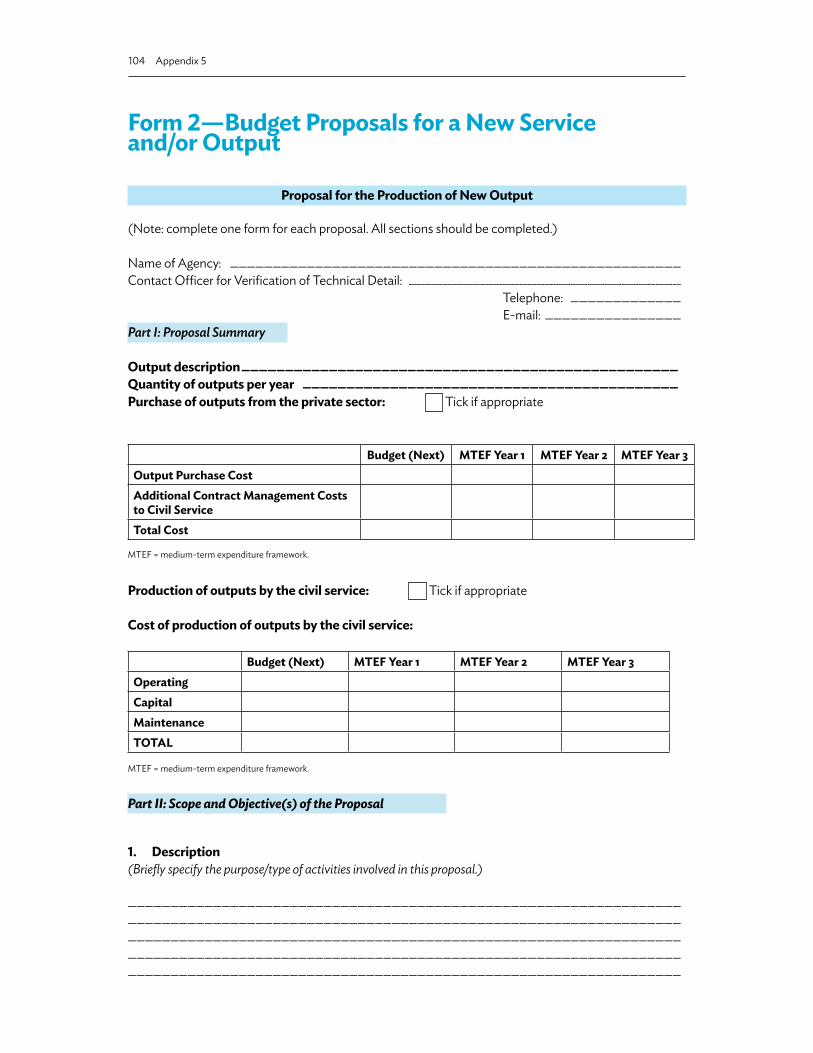
104 Appendix 5
Form 2—Budget Proposals for a New Service and/or Output
Proposal for the Production of New Output
(Note: complete one form for each proposal. All sections should be completed.) Name of Agency: _____________________________________________________Contact Officer for Verification of Technical Detail: ________________________________ Telephone: _____________ E-mail: ________________Part I: Proposal Summary
Output description __________________________________________________Quantity of outputs per year ___________________________________________Purchase of outputs from the private sector: Tick if appropriate
Budget (Next) MTEF Year 1 MTEF Year 2 MTEF Year 3Output Purchase CostAdditional Contract Management Costs to Civil ServiceTotal Cost
MTEF = medium-term expenditure framework.
Production of outputs by the civil service: Tick if appropriate
Cost of production of outputs by the civil service:
Budget (Next) MTEF Year 1 MTEF Year 2 MTEF Year 3OperatingCapitalMaintenanceTOTAL
MTEF = medium-term expenditure framework.
Part II: Scope and Objective(s) of the Proposal
1. Description(Briefly specify the purpose/type of activities involved in this proposal.)
_____________________________________________________________________________________________________________________________________________________________________________________________________________________________________________________________________________________________________________________________________

Templates for Capital Budget Proposals 105
2. Can production of the output be outsourced to the private sector? (If not, why not? If yes, why should government manage/intervene in the production process? What are the financial and other contractual implications of outsourcing to the private sector?)
Yes / No (Please circle one)
_____________________________________________________________________________________________________________________________________________________________________________________________________________________________________________________________________________________________________________________________________
Is the output intended to address an existing outcome targeted by the government?
Yes / No (Please circle one)
If Yes, proceed to the following section. If No, is there a Cabinet Decision notifying of a new outcome and targets? Provide details below, including Cabinet Decision number/reference:
__________________________________________________________________________________________________________________________________________________________________________________________________________________________________________________________________________________________________________________________________________________________________________________________________________________________________________________________________________________________________________________________________________________________________________________________________________________________________________________________________________
3. How is output funding expected to impact the government’s existing outcome target(s)?_____________________________________________________________________________________________________________________________________________________________________________________________________________________________________________________________________________________________________________________________________
Targeted Outcome Key Result Indicator
Targets Budget (next)
Targets MTEF Year 1
Targets MTEF Year 2
Targets MTEF Year 3
Old:New:
Old:New:
Old:New:
Old:New:
Old:New:
Old:New:
Old:New:
Old:New:
Old:New:
Old:New:
Old:New:
Old:New:
MTEF = medium-term expenditure framework.

106 Appendix 5
4. Location and duration of production(Indicate where the output will be produced, where it will be delivered, and the lag between approval to spend funds and delivery of outputs.)
_____________________________________________________________________________________________________________________________________________________________________________________________________________________________________________________________________________________________________________________________________
5. Clearly identify the impact this proposed expenditure will have on men and women and/or list other agencies likely to be involved/participating in this issue
(Include other programs and activities within your own agency that are currently involved in addressing aspects of this issue.)
_____________________________________________________________________________________________________________________________________________________________________________________________________________________________________________________________________________________________________________________________________
Part III: Sources of Funding
6. Indicate the intended source of funding, whether government (central or state), aid, or other.
(Please provide details of the donor/contributor; amount; and expected date of receipt.)
Budget (Next)
MTEF Year 1
MTEF Year 2
MTEF Year 3
Appropriation Act
Others
Donor Funds
Community/Self-Help
User ChargesTOTAL FUNDING REQUIRED
MTEF = medium-term expenditure framework.
7. Source of funding(Describe how sources might change over time, particularly for user charges.)
_____________________________________________________________________________________________________________________________________________________________________________________________________________________________________________________________________________________________________________________________________

Templates for Capital Budget Proposals 107
Part IV: Financial and Economic Analysis of the Proposal
8. Assumptions/risks of this proposal(List key assumptions and describe some possible risks that may hinder the implementation of this proposal. This could include human, technical, climatic factors, etc.)
_____________________________________________________________________________________________________________________________________________________________________________________________________________________________________________________________________________________________________________________________________
9. Financial relationship between Inputs, Outputs, and Activities of the Proposal
Cost OutputTime Frame for Achieving Outcome Impact
Output Performance Indicator
Targets Budget (Next)
Targets MTEF Year 1
Targets MTEF Year 2
Targets MTEF Year 3
MTEF = medium-term expenditure framework.
Targeted GoalSector Goal Indicator
Description
Targets Budget (Next)
Targets MTEF Year 1
Targets MTEF Year 2
Targets MTEF Year 3
MTEF = medium-term expenditure framework.

108 Appendix 5
10. What are the major cost components of this proposal(Itemize costs associated with the proposal/project and the projections over the duration of this proposal/project. The level of recurrent costs should also be included.)
($’000) Budget (Next) MTEF Year 1 MTEF Year 2 MTEF Year 3COSTS:Account Description_________________________________________________________Total Operating Costs
$________$________$________
$________$________$________
$________$________$________
$________$________$________
Account Description_________________________________________________________Total Capital Costs
$________$________$________$_______
$________$________$________$_______
$________$________$________$_______
$________$________$________$_______
Total of Capital and Operating Costs $________ $________ $________ $________
VAT $________ $________ $________ $________
TOTAL COSTS (VAT inclusive)a [A] $________ $________ $________ $________
MTEF = medium-term expenditure framework.a Value Added Tax
11. Justify the need for the new expenditure in relation to outputs:
_____________________________________________________________________________________________________________________________________________________________________________________________________________________________________________________________________________________________________________________________________
12. Description of funding needs [Provide a brief summary of what the increase in funding entails and the status of the proposal/project, i.e., what work has been done and what is yet to be completed.]
Capital inputs:
_____________________________________________________________________________________________________________________________________________________________________________________________________________________________________________________________________________________________________________________________________

Templates for Capital Budget Proposals 109
Implications for future maintenance expenditures:
_____________________________________________________________________________________________________________________________________________________________________________________________________________________________________________________________________________________________________________________________________
Operating expenses:
_____________________________________________________________________________________________________________________________________________________________________________________________________________________________________________________________________________________________________________________________________
13. Maintenance schedule(Outline the implications for maintenance expenditures of any capital purchases.)
FY 20yy/yy FY 20yy/yy FY 20yy/yyDescribe types of maintenance requiredXxYyZzEstimated cost of maintenanceXxYyZzContracted maintenance or in-house?XxYyZz
Describe any known large maintenance expenditures not covered in the table:
____________________________________________________________________________________________________________________________________________________________________________________________________________________________________________________________________
14. What is the estimated net social benefit of this proposal? (Outline the calculations undertaken to justify this proposal in terms of the government guidelines81 for the calculation of net social benefit.)
____________________________________________________________________________________________________________________________________________________________________________________________________________________________________________________________________
81 Government may or may not have issued guidelines on how net social benefits of any project should be estimated, depending on government policy and practice.

110 Appendix 5
Part V: Coordination Comments
15. Comments(Include comments from other line agencies likely to be involved/participating in the issue listed under section 6.)
Other agencies’ comments:
__________________________________________________________________________________________________________________________________________________________________________________________________________________________________________________________________________________________________________________________________________________________________________________________________________________________________________________________________________________________________________________________________________________________________________________________________________________________________________________________________________Source: Author.

Code
Hig
h-Le
vel O
I G
roup
ing
Code
Leve
l 2 S
ecto
r OI
Gro
upin
gCo
deSu
b-ca
tego
ry
OI G
roup
ing
OI_
ID
(uni
que)
OI D
escr
iptio
nSD
G
Refe
renc
e
Targ
et
Max
or
Min
(2,1)
Uni
t of
mea
sure
Des
crip
tion
of ca
lcul
atio
n m
etho
dolo
gyTa
rget
2
016
Targ
et
201
7Ta
rget
2
018
Targ
et
201
9Ta
rget
2
030
12
34
56
78
910
1112
1314
1516
2800
0000
Gen
eral
Cro
ss
Cutti
ng00
0100
Gen
eral
cro
ss c
uttin
g00
0100
Gen
eral
ec
onom
ic a
nd
soci
al in
dica
tors
0001
7%
cha
nge
in
expo
rts17
.111
%10
0000
00G
ener
al C
ross
Cu
tting
0001
00G
ener
al c
ross
cut
ting
0001
00G
ener
al
econ
omic
and
so
cial
indi
cato
rs
0000
3%
Cha
nge
in G
DP
1%
0000
00G
ener
al C
ross
Cu
tting
0001
00G
ener
al c
ross
cut
ting
0001
00G
ener
al
econ
omic
and
so
cial
indi
cato
rs
0000
5%
of p
eopl
e ea
rnin
g $
at o
r bel
ow
the
asse
ssed
po
verty
rate
2%
0000
00G
ener
al C
ross
Cu
tting
0001
00G
ener
al c
ross
cut
ting
0001
00G
ener
al
econ
omic
and
so
cial
indi
cato
rs
0000
7%
of p
eopl
e liv
ing
on le
ss th
an $
1.25
a da
y adj
uste
d fo
r in
flatio
n (b
ase
year
201
5)
1.12
%10
0000
00G
ener
al C
ross
Cu
tting
0001
00G
ener
al c
ross
cut
ting
0001
00G
ener
al
econ
omic
and
so
cial
indi
cato
rs
0001
2%
of p
eopl
e su
fferin
g m
alnu
tritio
n in
any
year
2.2
2%
10
0000
00G
ener
al C
ross
Cu
tting
0001
00G
ener
al c
ross
cut
ting
0001
00G
ener
al
econ
omic
and
so
cial
indi
cato
rs
0000
6%
of t
he
popu
latio
n pr
actic
ing
cont
race
ptio
n
1%
0000
00G
ener
al C
ross
Cu
tting
0001
00G
ener
al c
ross
cut
ting
0001
00G
ener
al
econ
omic
and
so
cial
indi
cato
rs
0001
6Av
erag
e %
cha
nge
in e
cono
mic
pr
oduc
tivity
(How
do
you
prop
ose
to m
easu
re th
is ac
ross
all s
ecto
rs?)
8.2
1%
1
APP
END
IX 6
An
Out
com
e Cl
assifi
catio
n Sy
stem
w
ith O
utco
me
Indi
cato
rs
cont
inue
d on
nex
t pag
e

112 Appendix 6
Code
Hig
h-Le
vel O
I G
roup
ing
Code
Leve
l 2 S
ecto
r OI
Gro
upin
gCo
deSu
b-ca
tego
ry
OI G
roup
ing
OI_
ID
(uni
que)
OI D
escr
iptio
nSD
G
Refe
renc
e
Targ
et
Max
or
Min
(2,1)
Uni
t of
mea
sure
Des
crip
tion
of ca
lcul
atio
n m
etho
dolo
gyTa
rget
2
016
Targ
et
201
7Ta
rget
2
018
Targ
et
201
9Ta
rget
2
030
12
34
56
78
910
1112
1314
1516
2800
0000
Gen
eral
Cro
ss
Cutti
ng00
0100
Gen
eral
cro
ss c
uttin
g00
0100
Gen
eral
ec
onom
ic a
nd
soci
al in
dica
tors
0005
2Av
erag
e %
cha
nge
in th
e pr
opor
tion
of c
hild
ren
of
all a
ges l
ivin
g in
pov
erty
in a
ll its
dim
ensio
ns
acco
rdin
g to
nat
iona
l de
finiti
ons
(How
w
ould
you
like
to c
alcu
late
th
e av
erag
e?
1.22
%-5
0
0000
00G
ener
al C
ross
Cu
tting
0001
00G
ener
al c
ross
cut
ting
0001
00G
ener
al
econ
omic
and
so
cial
indi
cato
rs
0000
8Av
erag
e %
cha
nge
in th
e pr
opor
tion
of m
en liv
ing
in p
over
ty in
all
its d
imen
sions
ac
cord
ing
to n
atio
nal
defin
ition
s
1.22
%-5
0
0000
00G
ener
al C
ross
Cu
tting
0001
00G
ener
al c
ross
cut
ting
0001
00G
ener
al
econ
omic
and
so
cial
indi
cato
rs
0000
9Av
erag
e %
cha
nge
in th
e pr
opor
tion
of w
omen
of
all a
ges l
ivin
g in
pov
erty
in a
ll its
dim
ensio
ns
acco
rdin
g to
nat
iona
l de
finiti
ons
1.22
%-5
0
0000
00G
ener
al C
ross
Cu
tting
0001
00G
ener
al c
ross
cut
ting
0001
00G
ener
al
econ
omic
and
so
cial
indi
cato
rs
0001
8Av
erag
e %
va
rianc
e in
ann
ual
FX e
xcha
nge
rate
s
17.13
2%
10
0000
00G
ener
al C
ross
Cu
tting
0001
00G
ener
al c
ross
cut
ting
0001
00G
ener
al
econ
omic
and
so
cial
indi
cato
rs
0002
0Av
erag
e va
rianc
e in
con
sum
er
pric
e in
dice
s
17.13
2%
3
0000
00G
ener
al C
ross
Cu
tting
0001
00G
ener
al c
ross
cut
ting
0001
00G
ener
al
econ
omic
and
so
cial
indi
cato
rs
0001
4Es
timat
ed
aver
age
% o
f ec
onom
ic gr
owth
de
rived
from
effi
cien
cy ga
ins
8.4
1%
50
0000
00G
ener
al C
ross
Cu
tting
0001
00G
ener
al c
ross
cut
ting
0001
00G
ener
al
econ
omic
and
so
cial
indi
cato
rs
0001
5Es
timat
ed av
erag
e %
of e
cono
mic
gr
owth
driv
en b
y po
pula
tion
grow
th
8.4
2%
-1
cont
inue
d on
nex
t pag
e

An Outcome Classification System with Outcome Indicators 113
Code
Hig
h-Le
vel O
I G
roup
ing
Code
Leve
l 2 S
ecto
r OI
Gro
upin
gCo
deSu
b-ca
tego
ry
OI G
roup
ing
OI_
ID
(uni
que)
OI D
escr
iptio
nSD
G
Refe
renc
e
Targ
et
Max
or
Min
(2,1)
Uni
t of
mea
sure
Des
crip
tion
of ca
lcul
atio
n m
etho
dolo
gyTa
rget
2
016
Targ
et
201
7Ta
rget
2
018
Targ
et
201
9Ta
rget
2
030
12
34
56
78
910
1112
1314
1516
2800
0000
Gen
eral
Cro
ss
Cutti
ng00
0100
Gen
eral
cro
ss c
uttin
g00
0100
Gen
eral
ec
onom
ic a
nd
soci
al in
dica
tors
0115
9Es
timat
ed
aver
age
per
capi
ta ki
louj
oule
co
nsum
ptio
n/Es
timat
ed av
erag
e pe
r cap
ita ki
lojo
ule
requ
irem
ent
8.4
2ra
tio1
11
11
0000
00G
ener
al C
ross
Cu
tting
0001
00G
ener
al c
ross
cut
ting
0001
00G
ener
al
econ
omic
and
so
cial
indi
cato
rs
0000
4G
DP
per c
apita
1$
0000
00G
ener
al C
ross
Cu
tting
0001
00G
ener
al c
ross
cut
ting
0001
00G
ener
al
econ
omic
and
so
cial
indi
cato
rs
0002
1G
INI r
atio
for
<ins
ert c
ount
ry
nam
e>
2in
dex
0000
00G
ener
al C
ross
Cu
tting
0001
00G
ener
al c
ross
cut
ting
0001
00G
ener
al
econ
omic
and
so
cial
indi
cato
rs
0115
8N
umbe
r of
regu
lato
ry
inst
rum
ents
th
at in
corp
orat
e di
scrim
inat
ory
prov
ision
s w
ith re
spec
t to
one
pers
on’s
char
acte
ristic
s ov
er a
noth
er
2N
umbe
r of
inst
rum
ents
0
0000
00G
ener
al C
ross
Cu
tting
0001
00G
ener
al c
ross
cut
ting
0001
00G
ener
al
econ
omic
and
so
cial
indi
cato
rs
0000
2Pa
rtici
patio
n ra
te1
%
0000
00G
ener
al C
ross
Cu
tting
0001
00G
ener
al c
ross
cut
ting
0001
00G
ener
al
econ
omic
and
so
cial
indi
cato
rs
0001
9Th
ree
year
av
erag
e an
nual
bu
dget
defi
cit
as a
% o
f GD
P
17.13
2%
3
0000
00G
ener
al C
ross
Cu
tting
0001
00G
ener
al c
ross
cut
ting
0001
00G
ener
al
econ
omic
and
so
cial
indi
cato
rs
0000
1U
nem
ploy
men
t ra
te2
%
0100
00H
igh
Qua
lity
Gov
erna
nce
0101
00H
igh
qual
ity n
atio
nal
gove
rnm
ent
0101
00G
ener
al00
033
% c
hang
e in
offi
cial
de
velo
pmen
t as
sista
nce
and
rem
ittan
ces
10.b
1%
1
0100
00H
igh
Qua
lity
Gov
erna
nce
0101
00H
igh
qual
ity n
atio
nal
gove
rnm
ent
0101
00G
ener
al00
037
% o
f app
eals
agai
nst d
enia
l of
acce
ss to
dat
a th
at is
inve
stig
ated
by
the
freed
om
of in
form
atio
n om
udsm
an
16.6
1%
99.9
cont
inue
d on
nex
t pag
e

114 Appendix 6
Code
Hig
h-Le
vel O
I G
roup
ing
Code
Leve
l 2 S
ecto
r OI
Gro
upin
gCo
deSu
b-ca
tego
ry
OI G
roup
ing
OI_
ID
(uni
que)
OI D
escr
iptio
nSD
G
Refe
renc
e
Targ
et
Max
or
Min
(2,1)
Uni
t of
mea
sure
Des
crip
tion
of ca
lcul
atio
n m
etho
dolo
gyTa
rget
2
016
Targ
et
201
7Ta
rget
2
018
Targ
et
201
9Ta
rget
2
030
12
34
56
78
910
1112
1314
1516
2801
0000
Hig
h Q
ualit
y G
over
nanc
e01
0100
Hig
h qu
ality
nat
iona
l go
vern
men
t01
0100
Gen
eral
0002
8%
of c
entra
l ag
enci
es w
ith
a sc
ore
of 7.
5 or
bet
ter i
n th
e In
tegr
ity o
f Pu
blic
Ser
vice
s A
sses
smen
t (ou
t of
a m
axim
um
of 10
)
1%
0100
00H
igh
Qua
lity
Gov
erna
nce
0101
00H
igh
qual
ity n
atio
nal
gove
rnm
ent
0101
00G
ener
al00
030
% o
f cen
tral
agen
cies
with
on
e or
mor
e ac
cusa
tions
of
corru
ptio
n w
ithin
th
e la
st 3
year
s
2%
0100
00H
igh
Qua
lity
Gov
erna
nce
0101
00H
igh
qual
ity n
atio
nal
gove
rnm
ent
0101
00G
ener
al01
163
% o
f cen
tral
agen
cies
with
un
qual
ified
aud
its
1%
0100
00H
igh
Qua
lity
Gov
erna
nce
0101
00H
igh
qual
ity n
atio
nal
gove
rnm
ent
0101
00G
ener
al00
036
% o
f fre
edom
of
info
rmat
ion
requ
ests
that
ar
e de
nied
by
gove
rnm
ent
bure
aucr
acie
s
16.6
2%
1
0100
00H
igh
Qua
lity
Gov
erna
nce
0101
00H
igh
qual
ity n
atio
nal
gove
rnm
ent
0101
00G
ener
al00
038
% o
f inv
estig
atio
ns
by th
e an
ti-co
rrupt
ion
auth
ority
that
are
im
pede
d by
cou
rt ro
om a
ctio
ns
16.6
2%
1
0100
00H
igh
Qua
lity
Gov
erna
nce
0101
00H
igh
qual
ity n
atio
nal
gove
rnm
ent
0101
00G
ener
al01
171
% c
hang
e in
the
num
ber o
f pub
lic
serv
ants
(ele
cted
po
litic
ians
and
pe
rson
s who
se
sala
ry is
pai
d fro
m go
vern
men
t ta
xes o
r the
re
sult
of b
usin
ess
oper
atio
ns
esta
blish
ed
by vi
rtue
of
gove
rnm
ent
regu
latio
n) th
at
have
acc
usat
ions
of
cor
rupt
ion
outs
tand
ing
or p
rove
d
2%
.000
001
cont
inue
d on
nex
t pag
e
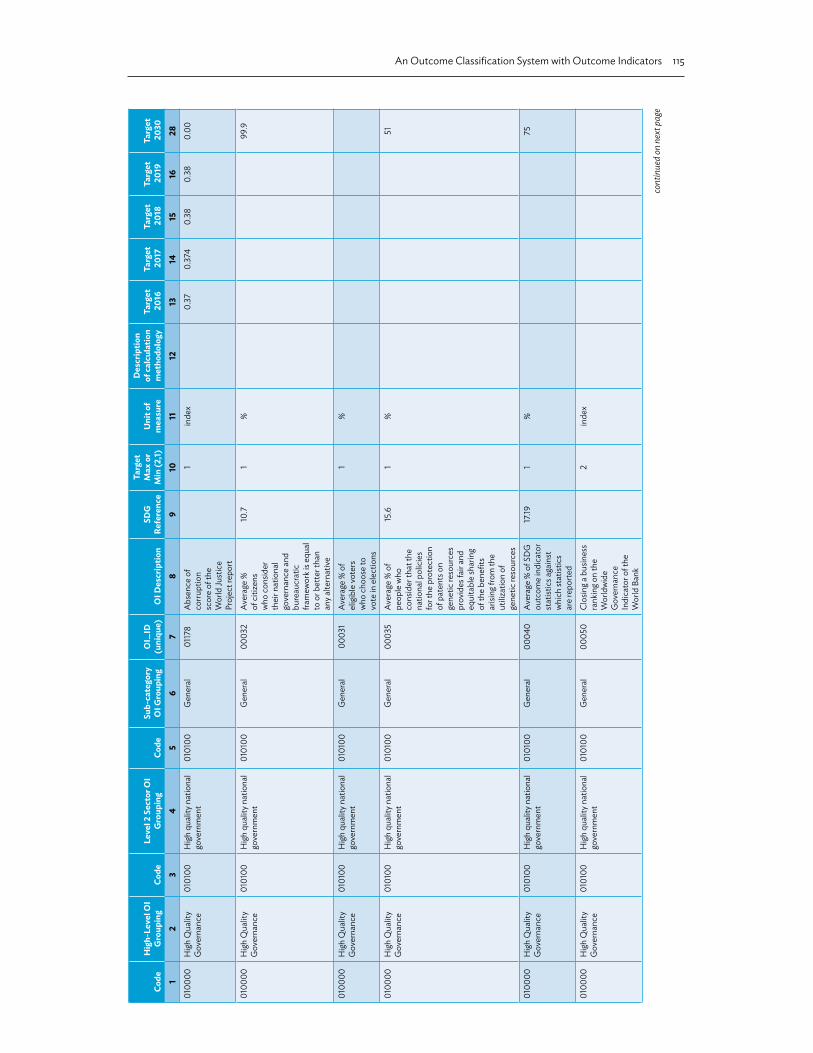
An Outcome Classification System with Outcome Indicators 115
Code
Hig
h-Le
vel O
I G
roup
ing
Code
Leve
l 2 S
ecto
r OI
Gro
upin
gCo
deSu
b-ca
tego
ry
OI G
roup
ing
OI_
ID
(uni
que)
OI D
escr
iptio
nSD
G
Refe
renc
e
Targ
et
Max
or
Min
(2,1)
Uni
t of
mea
sure
Des
crip
tion
of ca
lcul
atio
n m
etho
dolo
gyTa
rget
2
016
Targ
et
201
7Ta
rget
2
018
Targ
et
201
9Ta
rget
2
030
12
34
56
78
910
1112
1314
1516
2801
0000
Hig
h Q
ualit
y G
over
nanc
e01
0100
Hig
h qu
ality
nat
iona
l go
vern
men
t01
0100
Gen
eral
0117
8A
bsen
ce o
f co
rrupt
ion
scor
e of
the
Wor
ld Ju
stic
e Pr
ojec
t rep
ort
1in
dex
0.37
0.37
40.
380.
380.
00
0100
00H
igh
Qua
lity
Gov
erna
nce
0101
00H
igh
qual
ity n
atio
nal
gove
rnm
ent
0101
00G
ener
al00
032
Aver
age
%
of c
itize
ns
who
con
sider
th
eir n
atio
nal
gove
rnan
ce a
nd
bure
aucr
atic
fra
mew
ork i
s equ
al
to o
r bet
ter t
han
any a
ltern
ativ
e
10.7
1%
99.9
0100
00H
igh
Qua
lity
Gov
erna
nce
0101
00H
igh
qual
ity n
atio
nal
gove
rnm
ent
0101
00G
ener
al00
031
Aver
age
% o
f el
igib
le vo
ters
w
ho c
hoos
e to
vo
te in
ele
ctio
ns
1%
0100
00H
igh
Qua
lity
Gov
erna
nce
0101
00H
igh
qual
ity n
atio
nal
gove
rnm
ent
0101
00G
ener
al00
035
Aver
age
% o
f pe
ople
who
co
nsid
er th
at th
e na
tiona
l pol
icie
s fo
r the
pro
tect
ion
of p
aten
ts o
n ge
netic
reso
urce
s pr
ovid
es fa
ir an
d eq
uita
ble
shar
ing
of th
e be
nefit
s ar
ising
from
the
utiliz
atio
n of
ge
netic
reso
urce
s
15.6
1%
51
0100
00H
igh
Qua
lity
Gov
erna
nce
0101
00H
igh
qual
ity n
atio
nal
gove
rnm
ent
0101
00G
ener
al00
040
Aver
age
% o
f SD
G
outc
ome
indi
cato
r st
atist
ics a
gain
st
whi
ch st
atist
ics
are
repo
rted
17.19
1%
75
0100
00H
igh
Qua
lity
Gov
erna
nce
0101
00H
igh
qual
ity n
atio
nal
gove
rnm
ent
0101
00G
ener
al00
050
Clos
ing a
bus
ines
s ra
nkin
g on
the
Wor
ldw
ide
Gov
erna
nce
Indi
cato
r of t
he
Wor
ld B
ank
2in
dex
cont
inue
d on
nex
t pag
e

116 Appendix 6
Code
Hig
h-Le
vel O
I G
roup
ing
Code
Leve
l 2 S
ecto
r OI
Gro
upin
gCo
deSu
b-ca
tego
ry
OI G
roup
ing
OI_
ID
(uni
que)
OI D
escr
iptio
nSD
G
Refe
renc
e
Targ
et
Max
or
Min
(2,1)
Uni
t of
mea
sure
Des
crip
tion
of ca
lcul
atio
n m
etho
dolo
gyTa
rget
2
016
Targ
et
201
7Ta
rget
2
018
Targ
et
201
9Ta
rget
2
030
12
34
56
78
910
1112
1314
1516
2801
0000
Hig
h Q
ualit
y G
over
nanc
e01
0100
Hig
h qu
ality
nat
iona
l go
vern
men
t01
0100
Gen
eral
0117
4Co
nstra
ints
on
Gov
ernm
ent
Pow
ers s
core
in
the
Wor
ld Ju
stic
e Pr
ojec
t rep
ort
1in
dex
0.64
0.64
60.
650.
660.
00
0100
00H
igh
Qua
lity
Gov
erna
nce
0101
00H
igh
qual
ity n
atio
nal
gove
rnm
ent
0101
00G
ener
al00
046
Corru
ptio
n ra
nkin
g on
the
Wor
ldw
ide
Gov
erna
nce
Indi
cato
r of t
he
Wor
ld B
ank
2in
dex
0100
00H
igh
Qua
lity
Gov
erna
nce
0101
00H
igh
qual
ity n
atio
nal
gove
rnm
ent
0101
00G
ener
al00
206
Expo
rts a
s a %
of
GD
P (n
omin
al)
1%
0100
00H
igh
Qua
lity
Gov
erna
nce
0101
00H
igh
qual
ity n
atio
nal
gove
rnm
ent
0101
00G
ener
al00
207
Expo
rts a
s a %
of
GD
P (r
eal)
1%
0100
00H
igh
Qua
lity
Gov
erna
nce
0101
00H
igh
qual
ity n
atio
nal
gove
rnm
ent
0101
00G
ener
al00
048
Fund
amen
tal
Righ
ts S
core
in
the
Wor
ld Ju
stic
e Pr
ojec
t Rul
e of
La
w In
dex
1in
dex
0.52
0.52
50.
530.
540.
00
0100
00H
igh
Qua
lity
Gov
erna
nce
0101
00H
igh
qual
ity n
atio
nal
gove
rnm
ent
0101
00G
ener
al00
040
Inve
stm
ent a
s a %
of
GD
P (n
omin
al)
1%
0100
00H
igh
Qua
lity
Gov
erna
nce
0101
00H
igh
qual
ity n
atio
nal
gove
rnm
ent
0101
00G
ener
al01
172
Inve
stm
ent a
s a
% o
f GD
P (r
eal)
1%
0100
00H
igh
Qua
lity
Gov
erna
nce
0101
00H
igh
qual
ity n
atio
nal
gove
rnm
ent
0101
00G
ener
al01
168
Num
ber o
f re
gula
tory
in
stru
men
ts o
r in
stitu
tiona
l or
bure
aucr
atic
bl
ocka
ge o
r lim
itatio
ns o
n fo
reig
n di
rect
in
vest
men
t
10.b
2%
.000
1
0100
00H
igh
Qua
lity
Gov
erna
nce
0101
00H
igh
qual
ity n
atio
nal
gove
rnm
ent
0101
00G
ener
al00
047
Ope
n G
over
nmen
t Sc
ore
in th
e W
orld
Just
ice
Proj
ect r
epor
t
1in
dex
0.58
0.58
60.
590.
600.
00
0100
00H
igh
Qua
lity
Gov
erna
nce
0101
00H
igh
qual
ity n
atio
nal
gove
rnm
ent
0101
00G
ener
al00
007
Ove
rall s
core
in
the
Wor
ld Ju
stic
e Pr
ojec
t rep
ort
1in
dex
0.52
0.55
0.58
0.6
0.62
cont
inue
d on
nex
t pag
e

An Outcome Classification System with Outcome Indicators 117
Code
Hig
h-Le
vel O
I G
roup
ing
Code
Leve
l 2 S
ecto
r OI
Gro
upin
gCo
deSu
b-ca
tego
ry
OI G
roup
ing
OI_
ID
(uni
que)
OI D
escr
iptio
nSD
G
Refe
renc
e
Targ
et
Max
or
Min
(2,1)
Uni
t of
mea
sure
Des
crip
tion
of ca
lcul
atio
n m
etho
dolo
gyTa
rget
2
016
Targ
et
201
7Ta
rget
2
018
Targ
et
201
9Ta
rget
2
030
12
34
56
78
910
1112
1314
1516
2801
0000
Hig
h Q
ualit
y G
over
nanc
e01
0100
Hig
h qu
ality
nat
iona
l go
vern
men
t01
0100
Gen
eral
0004
1Po
litic
al st
abilit
y ra
nkin
g on
the
Wor
ldw
ide
Gov
erna
nce
Indi
cato
r of t
he
Wor
ld B
ank
2in
dex
0100
00H
igh
Qua
lity
Gov
erna
nce
0101
00H
igh
qual
ity n
atio
nal
gove
rnm
ent
0101
00G
ener
al00
011
Priv
ate
inve
stm
ent
expe
nditu
re a
s a
% o
f GD
P
1%
0100
00H
igh
Qua
lity
Gov
erna
nce
0101
00H
igh
qual
ity n
atio
nal
gove
rnm
ent
0101
00G
ener
al00
045
Rank
ing o
f <in
sert
coun
try n
ame>
in
the
Glo
bal
Com
petit
iven
ess
Inde
x of t
he
Wor
ld E
cono
mic
Fo
rum
(WEF
)
2in
dex
0100
00H
igh
Qua
lity
Gov
erna
nce
0101
00H
igh
qual
ity n
atio
nal
gove
rnm
ent
0101
00G
ener
al00
044
Regu
lato
ry
Enfo
rcem
ent
scor
e in
the
Wor
ld Ju
stic
e Pr
ojec
t rep
ort
1in
dex
0.51
0.51
50.
520.
530.
00
0100
00H
igh
Qua
lity
Gov
erna
nce
0101
00H
igh
qual
ity n
atio
nal
gove
rnm
ent
0101
00G
ener
al01
177
Rule
of l
aw ra
nkin
g on
the
Wor
ldw
ide
Gov
erna
ce
Indi
cato
r of t
he
Wor
ld B
ank
2in
dex
0100
00H
igh
Qua
lity
Gov
erna
nce
0101
00H
igh
qual
ity n
atio
nal
gove
rnm
ent
0101
00G
ener
al00
049
Star
ting a
bus
ines
s ra
nkin
g on
the
Wor
ldw
ide
Gov
erna
nce
Indi
cato
r of t
he
Wor
ld B
ank
2in
dex
0100
00H
igh
Qua
lity
Gov
erna
nce
0101
00H
igh
qual
ity n
atio
nal
gove
rnm
ent
0101
00G
ener
al01
173
Voic
e an
d ac
coun
tabi
lity
rank
ing o
n th
e W
orld
wid
e G
over
nanc
e In
dica
tor o
f the
W
orld
Ban
k
2in
dex
0100
00H
igh
Qua
lity
Gov
erna
nce
0101
00H
igh
qual
ity n
atio
nal
gove
rnm
ent
0101
00G
ener
al01
193
Num
ber o
f G
over
nmen
t A
genc
ies/
Num
ber
of C
OFO
G
Div
ision
s
2ra
tio
cont
inue
d on
nex
t pag
e

118 Appendix 6
Code
Hig
h-Le
vel O
I G
roup
ing
Code
Leve
l 2 S
ecto
r OI
Gro
upin
gCo
deSu
b-ca
tego
ry
OI G
roup
ing
OI_
ID
(uni
que)
OI D
escr
iptio
nSD
G
Refe
renc
e
Targ
et
Max
or
Min
(2,1)
Uni
t of
mea
sure
Des
crip
tion
of ca
lcul
atio
n m
etho
dolo
gyTa
rget
2
016
Targ
et
201
7Ta
rget
2
018
Targ
et
201
9Ta
rget
2
030
12
34
56
78
910
1112
1314
1516
2801
0000
Hig
h Q
ualit
y G
over
nanc
e01
0100
Hig
h qu
ality
nat
iona
l go
vern
men
t01
0100
Gen
eral
0119
4%
of o
utpu
t se
rvic
e de
liver
y ta
rget
s ach
ieve
d w
ithin
+/-
5%
1%
0100
00H
igh
Qua
lity
Gov
erna
nce
0102
00H
igh
qual
ity lo
cal
gove
rnm
ent
0102
00G
ener
al01
180
% o
f loc
al
gove
rnm
ent
agen
cies
with
a
scor
e of
7.0
or b
ette
r in
the
Inte
grity
of
Publ
ic S
ervi
ces
Ass
essm
ent (
out
of m
axim
um o
f 10)
1%
0100
00H
igh
Qua
lity
Gov
erna
nce
0102
00H
igh
qual
ity lo
cal
gove
rnm
ent
0102
00G
ener
al01
181
% o
f loc
al
gove
rnm
ent
agen
cies
with
on
e or
mor
e ac
cusa
tions
of
corru
ptio
n w
ithin
th
e la
st 3
year
s
2%
0100
00H
igh
Qua
lity
Gov
erna
nce
0102
00H
igh
qual
ity lo
cal
gove
rnm
ent
0102
00G
ener
al01
182
% o
f loc
al
gove
rnm
ent
agen
cies
with
un
qual
ified
aud
its
1%
0100
00H
igh
Qua
lity
Gov
erna
nce
0102
00H
igh
qual
ity lo
cal
gove
rnm
ent
0102
00G
ener
al01
178
Abs
ence
of
corru
ptio
n sc
ore
of th
e W
orld
Just
ice
Proj
ect r
epor
t
1in
dex
0.37
0.37
40.
380.
380.
00
0100
00H
igh
Qua
lity
Gov
erna
nce
0102
00H
igh
qual
ity lo
cal
gove
rnm
ent
0102
00G
ener
al01
170
Aver
age
varia
nce
in p
rovi
ncia
l G
DP
($)
2$
0100
00H
igh
Qua
lity
Gov
erna
nce
0102
00H
igh
qual
ity lo
cal
gove
rnm
ent
0102
00G
ener
al00
046
Corru
ptio
n ra
nkin
g on
the
Wor
ldw
ide
Gov
erna
nce
Indi
cato
r of t
he
Wor
ld B
ank
2in
dex
0100
00H
igh
Qua
lity
Gov
erna
nce
0102
00H
igh
qual
ity lo
cal
gove
rnm
ent
0102
00G
ener
al00
047
Ope
n G
over
nmen
t Sc
ore
in th
e W
orld
Just
ice
Proj
ect r
epor
t
1in
dex
0.52
0.52
50.
530.
540.
00
0100
00H
igh
Qua
lity
Gov
erna
nce
0102
00H
igh
qual
ity lo
cal
gove
rnm
ent
0102
00G
ener
al01
160
Prov
inci
al
inve
stm
ent a
s a
% o
f Pro
vinc
ial
GD
P (n
omin
al)
1%
cont
inue
d on
nex
t pag
e
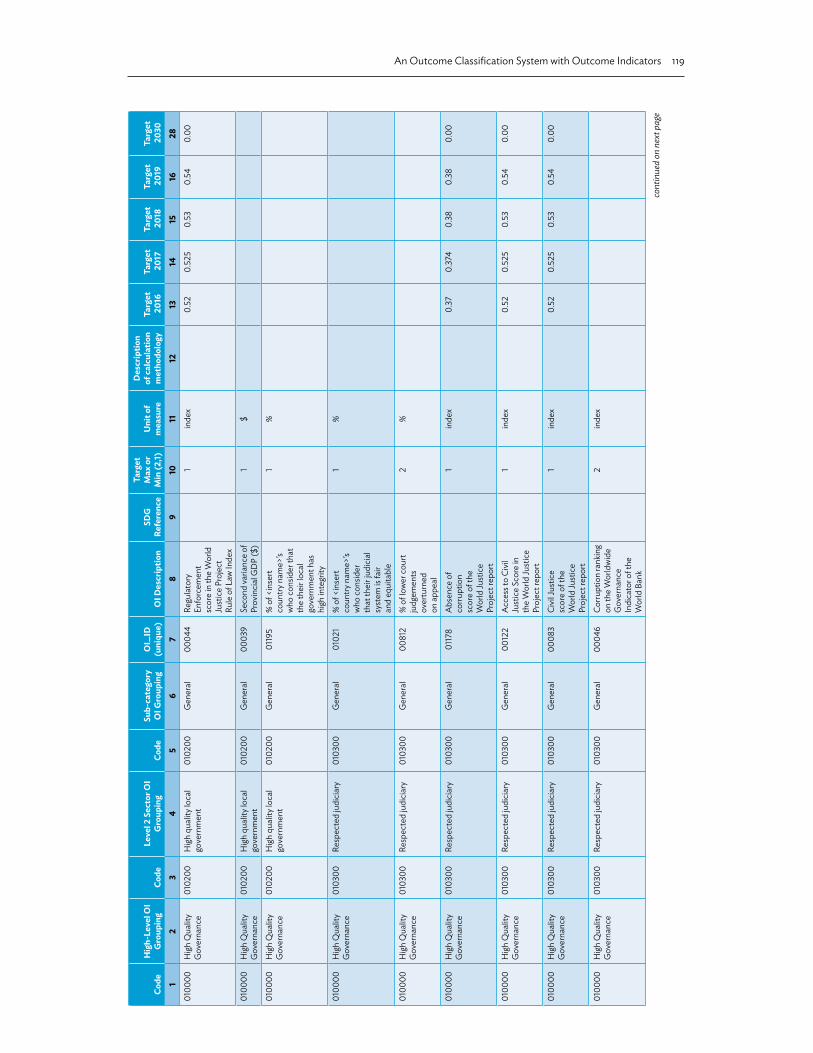
An Outcome Classification System with Outcome Indicators 119
Code
Hig
h-Le
vel O
I G
roup
ing
Code
Leve
l 2 S
ecto
r OI
Gro
upin
gCo
deSu
b-ca
tego
ry
OI G
roup
ing
OI_
ID
(uni
que)
OI D
escr
iptio
nSD
G
Refe
renc
e
Targ
et
Max
or
Min
(2,1)
Uni
t of
mea
sure
Des
crip
tion
of ca
lcul
atio
n m
etho
dolo
gyTa
rget
2
016
Targ
et
201
7Ta
rget
2
018
Targ
et
201
9Ta
rget
2
030
12
34
56
78
910
1112
1314
1516
2801
0000
Hig
h Q
ualit
y G
over
nanc
e01
0200
Hig
h qu
ality
loca
l go
vern
men
t01
0200
Gen
eral
0004
4Re
gula
tory
En
forc
emen
t sc
ore
in th
e W
orld
Ju
stic
e Pr
ojec
t Ru
le o
f Law
Inde
x
1in
dex
0.52
0.52
50.
530.
540.
00
0100
00H
igh
Qua
lity
Gov
erna
nce
0102
00H
igh
qual
ity lo
cal
gove
rnm
ent
0102
00G
ener
al00
039
Seco
nd va
rianc
e of
Pr
ovin
cial
GD
P ($
)1
$
0100
00H
igh
Qua
lity
Gov
erna
nce
0102
00H
igh
qual
ity lo
cal
gove
rnm
ent
0102
00G
ener
al01
195
% o
f <in
sert
coun
try n
ame>
’s w
ho c
onsid
er th
at
the
thei
r loc
al
gove
rnm
ent h
as
high
inte
grity
1%
0100
00H
igh
Qua
lity
Gov
erna
nce
0103
00Re
spec
ted
judi
ciar
y01
0300
Gen
eral
0102
1%
of <
inse
rt co
untry
nam
e>’s
who
con
sider
th
at th
eir j
udic
ial
syst
em is
fair
and
equi
tabl
e
1%
0100
00H
igh
Qua
lity
Gov
erna
nce
0103
00Re
spec
ted
judi
ciar
y01
0300
Gen
eral
0081
2%
of l
ower
cou
rt ju
dgem
ents
ov
ertu
rned
on
app
eal
2%
0100
00H
igh
Qua
lity
Gov
erna
nce
0103
00Re
spec
ted
judi
ciar
y01
0300
Gen
eral
0117
8A
bsen
ce o
f co
rrupt
ion
scor
e of
the
Wor
ld Ju
stic
e Pr
ojec
t rep
ort
1in
dex
0.37
0.37
40.
380.
380.
00
0100
00H
igh
Qua
lity
Gov
erna
nce
0103
00Re
spec
ted
judi
ciar
y01
0300
Gen
eral
0012
2A
cces
s to
Civi
l Ju
stic
e Sc
ore
in
the
Wor
ld Ju
stic
e Pr
ojec
t rep
ort
1in
dex
0.52
0.52
50.
530.
540.
00
0100
00H
igh
Qua
lity
Gov
erna
nce
0103
00Re
spec
ted
judi
ciar
y01
0300
Gen
eral
0008
3Ci
vil J
ustic
e sc
ore
of th
e W
orld
Just
ice
Proj
ect r
epor
t
1in
dex
0.52
0.52
50.
530.
540.
00
0100
00H
igh
Qua
lity
Gov
erna
nce
0103
00Re
spec
ted
judi
ciar
y01
0300
Gen
eral
0004
6Co
rrupt
ion
rank
ing
on th
e W
orld
wid
e G
over
nanc
e In
dica
tor o
f the
W
orld
Ban
k
2in
dex
cont
inue
d on
nex
t pag
e

120 Appendix 6
Code
Hig
h-Le
vel O
I G
roup
ing
Code
Leve
l 2 S
ecto
r OI
Gro
upin
gCo
deSu
b-ca
tego
ry
OI G
roup
ing
OI_
ID
(uni
que)
OI D
escr
iptio
nSD
G
Refe
renc
e
Targ
et
Max
or
Min
(2,1)
Uni
t of
mea
sure
Des
crip
tion
of ca
lcul
atio
n m
etho
dolo
gyTa
rget
2
016
Targ
et
201
7Ta
rget
2
018
Targ
et
201
9Ta
rget
2
030
12
34
56
78
910
1112
1314
1516
2801
0000
Hig
h Q
ualit
y G
over
nanc
e01
0300
Resp
ecte
d ju
dici
ary
0103
00G
ener
al00
084
Crim
inal
just
ice
scor
e of
the
Wor
ld Ju
stic
e Pr
ojec
t rep
ort
1In
dex
0.52
0.52
50.
530.
540.
00
0100
00H
igh
Qua
lity
Gov
erna
nce
0103
00Re
spec
ted
judi
ciar
y01
0300
Gen
eral
0008
5D
ue P
roce
ss o
f La
w a
nd R
ight
s of
the
Acc
used
sc
ore
in th
e W
orld
Just
ice
Proj
ect r
epor
t
4.3
1In
dex
0.35
0100
00H
igh
Qua
lity
Gov
erna
nce
0103
00Re
spec
ted
judi
ciar
y01
0300
Gen
eral
0004
4Re
gula
tory
En
forc
emen
t sc
ore
in th
e W
orld
Just
ice
Proj
ect r
epor
t
1in
dex
0.52
0.52
50.
530.
540.
00
0100
00H
igh
Qua
lity
Gov
erna
nce
0103
00Re
spec
ted
judi
ciar
y01
0300
Gen
eral
0117
7Ru
le o
f law
rank
ing
on th
e W
orld
wid
e G
over
nace
In
dica
tor o
f the
W
orld
Ban
k
2in
dex
0200
00Th
e ru
le o
f la
w, o
rder
and
pu
blic
safe
ty
is up
held
and
re
spec
ted
0201
00D
omes
tic c
rimin
al
activ
ity is
elim
inat
ed02
0100
Gen
eral
0061
1%
Cha
nge
in th
e nu
mer
of r
ecor
ded
crim
e in
cide
nts
0200
00Th
e ru
le o
f la
w, o
rder
and
pu
blic
safe
ty
is up
held
and
re
spec
ted
0201
00D
omes
tic c
rimin
al
activ
ity is
elim
inat
ed02
0100
Gen
eral
0118
4%
of i
ncid
ents
of
illega
l poa
chin
g an
d cr
oss b
orde
r tra
ffick
ing i
n flo
ra
and
faun
a th
at
are
succ
essf
ully
pr
osec
uted
15.7
1%
0200
00Th
e ru
le o
f la
w, o
rder
and
pu
blic
safe
ty
is up
held
and
re
spec
ted
0201
00D
omes
tic c
rimin
al
activ
ity is
elim
inat
ed02
0100
Gen
eral
0118
5Av
erag
e %
cha
nge
in th
e nu
mbe
r of
viol
ence
re
late
d de
aths
16.1
2%
-10
0200
00Th
e ru
le o
f la
w, o
rder
and
pu
blic
safe
ty
is up
held
and
re
spec
ted
0201
00D
omes
tic c
rimin
al
activ
ity is
elim
inat
ed02
0100
Gen
eral
0118
5Av
erag
e %
cha
nge
in th
e nu
mbe
r of
viol
ence
rela
ted
inci
dent
s
16.1
2%
-10
cont
inue
d on
nex
t pag
e

An Outcome Classification System with Outcome Indicators 121
Code
Hig
h-Le
vel O
I G
roup
ing
Code
Leve
l 2 S
ecto
r OI
Gro
upin
gCo
deSu
b-ca
tego
ry
OI G
roup
ing
OI_
ID
(uni
que)
OI D
escr
iptio
nSD
G
Refe
renc
e
Targ
et
Max
or
Min
(2,1)
Uni
t of
mea
sure
Des
crip
tion
of ca
lcul
atio
n m
etho
dolo
gyTa
rget
2
016
Targ
et
201
7Ta
rget
2
018
Targ
et
201
9Ta
rget
2
030
12
34
56
78
910
1112
1314
1516
2802
0000
The
rule
of
law,
ord
er a
nd
publ
ic sa
fety
is
uphe
ld a
nd
resp
ecte
d
0201
00D
omes
tic c
rimin
al
activ
ity is
elim
inat
ed02
0100
Gen
eral
0081
5Av
erag
e %
of
gree
n an
d pu
blic
op
en sp
aces
with
a
high
er in
cide
nce
of c
rime
than
the
natio
nal a
vera
ge
11.7
2%
.000
1
0200
00Th
e ru
le o
f la
w, o
rder
and
pu
blic
safe
ty
is up
held
and
re
spec
ted
0201
00D
omes
tic c
rimin
al
activ
ity is
elim
inat
ed02
0100
Gen
eral
0008
4Cr
imin
al Ju
stic
e sc
ore
of th
e W
orld
Just
ice
Proj
ect r
epor
t
0.52
0.52
50.
530.
540.
00
0200
00Th
e ru
le o
f la
w, o
rder
and
pu
blic
safe
ty
is up
held
and
re
spec
ted
0201
00D
omes
tic c
rimin
al
activ
ity is
elim
inat
ed02
0100
Gen
eral
0008
5D
ue P
roce
ss o
f La
w a
nd R
ight
s of
the
Acc
used
sc
ore
in th
e W
orld
Just
ice
Proj
ect r
epor
t
4.3
1In
dex
0.35
0200
00Th
e ru
le o
f la
w, o
rder
and
pu
blic
safe
ty
is up
held
and
re
spec
ted
0201
00D
omes
tic c
rimin
al
activ
ity is
elim
inat
ed02
0100
Gen
eral
0001
0O
rder
and
Se
curit
y Sco
re in
th
e W
orld
Just
ice
Proj
ect r
epor
t
1in
dex
0.52
0.52
50.
530.
540.
00
0200
00Th
e ru
le o
f la
w, o
rder
and
pu
blic
safe
ty
is up
held
and
re
spec
ted
0201
00D
omes
tic c
rimin
al
activ
ity is
elim
inat
ed02
0100
Gen
eral
0001
0O
rder
and
Secu
rity
Scor
e in
the
Wor
ld
Just
ice
Proj
ect
Rule
of L
aw In
dex
0.52
0.52
50.
530.
540.
00
0200
00Th
e ru
le o
f la
w, o
rder
and
pu
blic
safe
ty
is up
held
and
re
spec
ted
0201
00D
omes
tic c
rimin
al
activ
ity is
elim
inat
ed02
0100
Gen
eral
0117
7Ru
le o
f law
rank
ing
on th
e W
orld
wid
e G
over
nace
In
dica
tor o
f the
W
orld
Ban
k
0200
00Th
e ru
le o
f la
w, o
rder
and
pu
blic
safe
ty
is up
held
and
re
spec
ted
0201
00D
omes
tic c
rimin
al
activ
ity is
elim
inat
ed02
0100
Gen
eral
0120
9N
umbe
r of
reco
rded
inci
dent
s of
viol
atio
ns o
f <i
nser
t cou
ntry
na
me>
’s bo
rder
in
tegr
ity
2N
umbe
r of
inci
dent
s
0200
00Th
e ru
le o
f la
w, o
rder
and
pu
blic
safe
ty
is up
held
and
re
spec
ted
0202
00In
tern
atio
nal c
rimin
al
activ
ity is
elim
inat
ed02
0200
Gen
eral
0001
3%
of i
ncid
ents
of
illega
l poa
chin
g an
d cr
oss b
orde
r tra
ffick
ing i
n flo
ra
and
faun
a th
at
are
succ
essf
ully
pr
osec
uted
15.7
1%
cont
inue
d on
nex
t pag
e

122 Appendix 6
Code
Hig
h-Le
vel O
I G
roup
ing
Code
Leve
l 2 S
ecto
r OI
Gro
upin
gCo
deSu
b-ca
tego
ry
OI G
roup
ing
OI_
ID
(uni
que)
OI D
escr
iptio
nSD
G
Refe
renc
e
Targ
et
Max
or
Min
(2,1)
Uni
t of
mea
sure
Des
crip
tion
of ca
lcul
atio
n m
etho
dolo
gyTa
rget
2
016
Targ
et
201
7Ta
rget
2
018
Targ
et
201
9Ta
rget
2
030
12
34
56
78
910
1112
1314
1516
2802
0000
The
rule
of
law,
ord
er a
nd
publ
ic sa
fety
is
uphe
ld a
nd
resp
ecte
d
0202
00In
tern
atio
nal c
rimin
al
activ
ity is
elim
inat
ed02
0200
Gen
eral
0008
4Cr
imin
al Ju
stic
e sc
ore
of th
e W
orld
Just
ice
Proj
ect r
epor
t
0.52
0.52
50.
530.
540.
00
0200
00Th
e ru
le o
f la
w, o
rder
and
pu
blic
safe
ty
is up
held
and
re
spec
ted
0202
00In
tern
atio
nal c
rimin
al
activ
ity is
elim
inat
ed02
0200
Gen
eral
0008
5D
ue P
roce
ss o
f La
w a
nd R
ight
s of
the
Acc
used
sc
ore
in th
e W
orld
Just
ice
Proj
ect r
epor
t
4.3
1In
dex
0.35
0200
00Th
e ru
le o
f la
w, o
rder
and
pu
blic
safe
ty
is up
held
and
re
spec
ted
0202
00In
tern
atio
nal c
rimin
al
activ
ity is
elim
inat
ed02
0200
Gen
eral
0001
0O
rder
and
Secu
rity
Scor
e in
the
Wor
ld
Just
ice
Proj
ect
Rule
of L
aw In
dex
0.52
0.52
50.
530.
540.
00
0200
00Th
e ru
le o
f la
w, o
rder
and
pu
blic
safe
ty
is up
held
and
re
spec
ted
0202
00In
tern
atio
nal c
rimin
al
activ
ity is
elim
inat
ed02
0200
Gen
eral
0117
7Ru
le o
f law
rank
ing
on th
e W
orld
wid
e G
over
nace
In
dica
tor o
f the
W
orld
Ban
k
0200
00Th
e ru
le o
f la
w, o
rder
and
pu
blic
safe
ty
is up
held
and
re
spec
ted
0203
00D
omes
tic c
ivil a
nd
adm
inist
rativ
e co
des a
re e
nfor
ced
0203
00G
ener
al01
178
Abs
ence
of
corru
ptio
n sc
ore
of th
e W
orld
Just
ice
Proj
ect r
epor
t
1in
dex
0.37
0.37
40.
380.
380.
00
0200
00Th
e ru
le o
f la
w, o
rder
and
pu
blic
safe
ty
is up
held
and
re
spec
ted
0203
00D
omes
tic c
ivil a
nd
adm
inist
rativ
e co
des a
re e
nfor
ced
0203
00G
ener
al00
083
Civi
l Jus
tice
scor
e of
the
Wor
ld
Just
ice
Proj
ect
0.52
0.52
50.
530.
540.
00
0200
00Th
e ru
le o
f la
w, o
rder
and
pu
blic
safe
ty
is up
held
and
re
spec
ted
0203
00D
omes
tic c
ivil a
nd
adm
inist
rativ
e co
des a
re e
nfor
ced
0203
00G
ener
al00
010
Ord
er an
d Se
curit
y Sc
ore
in th
e W
orld
Ju
stic
e Pr
ojec
t Ru
le o
f Law
Inde
x
0.52
0.52
50.
530.
540.
00
0200
00Th
e ru
le o
f la
w, o
rder
and
pu
blic
safe
ty
is up
held
and
re
spec
ted
0203
00D
omes
tic c
ivil a
nd
adm
inist
rativ
e co
des a
re e
nfor
ced
0203
00G
ener
al00
044
Regu
lato
ry
Enfo
rcem
ent
scor
e in
the
Wor
ld
Just
ice
Proj
ect
Rule
of L
aw In
dex
0.52
0.52
50.
530.
540.
00
0200
00Th
e ru
le o
f la
w, o
rder
and
pu
blic
safe
ty
is up
held
and
re
spec
ted
0203
00D
omes
tic c
ivil a
nd
adm
inist
rativ
e co
des a
re e
nfor
ced
0203
00G
ener
al01
177
Rule
of l
aw ra
nkin
g on
the
Wor
ldw
ide
Gov
erna
ce
Indi
cato
r of t
he
Wor
ld B
ank
cont
inue
d on
nex
t pag
e

An Outcome Classification System with Outcome Indicators 123
Code
Hig
h-Le
vel O
I G
roup
ing
Code
Leve
l 2 S
ecto
r OI
Gro
upin
gCo
deSu
b-ca
tego
ry
OI G
roup
ing
OI_
ID
(uni
que)
OI D
escr
iptio
nSD
G
Refe
renc
e
Targ
et
Max
or
Min
(2,1)
Uni
t of
mea
sure
Des
crip
tion
of ca
lcul
atio
n m
etho
dolo
gyTa
rget
2
016
Targ
et
201
7Ta
rget
2
018
Targ
et
201
9Ta
rget
2
030
12
34
56
78
910
1112
1314
1516
2802
0000
The
rule
of
law,
ord
er a
nd
publ
ic sa
fety
is
uphe
ld a
nd
resp
ecte
d
0204
00In
tern
atio
nal c
ivil
and
adm
inist
rativ
e ag
reem
ents
are
en
forc
ed
0204
00G
ener
al01
178
Abs
ence
of
corru
ptio
n sc
ore
of th
e W
orld
Just
ice
Proj
ect r
epor
t
1in
dex
0.37
0.37
40.
380.
380.
00
0200
00Th
e ru
le o
f la
w, o
rder
and
pu
blic
safe
ty
is up
held
and
re
spec
ted
0204
00In
tern
atio
nal c
ivil
and
adm
inist
rativ
e ag
reem
ents
are
en
forc
ed
0204
00G
ener
al00
083
Civi
l Jus
tice
scor
e of
the
Wor
ld Ju
stic
e Pr
ojec
t rep
ort
0.52
0.52
50.
530.
540.
00
0200
00Th
e ru
le o
f la
w, o
rder
and
pu
blic
safe
ty
is up
held
and
re
spec
ted
0204
00In
tern
atio
nal c
ivil
and
adm
inist
rativ
e ag
reem
ents
are
en
forc
ed
0204
00G
ener
al01
161
Num
ber o
f bor
der
disp
utes
on
foot
/Num
ber o
f bo
rder
disp
utes
re
giste
red
with
the
Inte
rnat
iona
l Cou
rt at
the
Hag
ue
1Ra
tio
0200
00Th
e ru
le o
f la
w, o
rder
and
pu
blic
safe
ty
is up
held
and
re
spec
ted
0204
00In
tern
atio
nal c
ivil
and
adm
inist
rativ
e ag
reem
ents
are
en
forc
ed
0204
00G
ener
al00
044
Regu
lato
ry
Enfo
rcem
ent
scor
e in
the
Wor
ld
Just
ice
Proj
ect
Rule
of L
aw In
dex
0.52
0.52
50.
530.
540.
00
0200
00Th
e ru
le o
f la
w, o
rder
and
pu
blic
safe
ty
is up
held
and
re
spec
ted
0204
00In
tern
atio
nal c
ivil
and
adm
inist
rativ
e ag
reem
ents
are
en
forc
ed
0204
00G
ener
al01
177
Rule
of l
aw ra
nkin
g on
the
Wor
ldw
ide
Gov
erna
ce
Indi
cato
r of t
he
Wor
ld B
ank
0300
00Su
stai
nabl
e ec
onom
ic
deve
lopm
ent
0301
00G
ener
al03
0100
0002
7%
cha
nge
in gr
oss
priv
ate
rese
arch
an
d de
velo
pmen
t sp
endi
ng
9.5
1%
1
0300
00Su
stai
nabl
e ec
onom
ic
deve
lopm
ent
0301
00G
ener
al03
0100
0002
6%
cha
nge
in gr
oss
publ
ic re
sear
ch
and
deve
lopm
ent
spen
ding
9.5
1%
1
0300
00Su
stai
nabl
e ec
onom
ic
deve
lopm
ent
0301
00G
ener
al03
0100
0002
5%
cha
nge
in
the
num
ber o
f re
sear
ch a
nd
deve
lopm
ent
wor
kers
per
1 m
illion
peo
ple
9.5
1%
1
0300
00Su
stai
nabl
e ec
onom
ic
deve
lopm
ent
0301
00G
ener
al03
0100
0116
4%
cha
nge
inco
me
of
the
botto
m
40 p
er c
ent o
f th
e po
pula
tion/
%
chan
ge n
atio
nal
inco
me
10.1
1ra
tio o
f ch
ange
in
inco
me
of
botto
m 4
0%
to gr
owth
in
nat
iona
l in
com
e
1
cont
inue
d on
nex
t pag
e

124 Appendix 6
Code
Hig
h-Le
vel O
I G
roup
ing
Code
Leve
l 2 S
ecto
r OI
Gro
upin
gCo
deSu
b-ca
tego
ry
OI G
roup
ing
OI_
ID
(uni
que)
OI D
escr
iptio
nSD
G
Refe
renc
e
Targ
et
Max
or
Min
(2,1)
Uni
t of
mea
sure
Des
crip
tion
of ca
lcul
atio
n m
etho
dolo
gyTa
rget
2
016
Targ
et
201
7Ta
rget
2
018
Targ
et
201
9Ta
rget
2
030
12
34
56
78
910
1112
1314
1516
2803
0000
Sust
aina
ble
econ
omic
de
velo
pmen
t
0301
00G
ener
al03
0100
0116
6%
of c
ount
ries
with
whi
ch <
inse
rt co
untry
nam
e>
has o
ne o
r mor
e in
tern
atio
nal
coop
erat
ion
agre
emen
ts to
sh
arin
g acc
ess
to sc
ienc
e,
tech
nolo
gy a
nd
inno
vatio
n id
eas
17.6
1%
99.9
0300
00Su
stai
nabl
e ec
onom
ic
deve
lopm
ent
0301
00G
ener
al03
0100
0002
2%
of d
istric
ts
asse
ssed
as
unde
rdev
elop
ed
2%
0300
00Su
stai
nabl
e ec
onom
ic
deve
lopm
ent
0301
00G
ener
al03
0100
0002
1%
of G
DP
prod
uced
ou
tsid
e of
Java
0300
00Su
stai
nabl
e ec
onom
ic
deve
lopm
ent
0301
00G
ener
al03
0100
0116
7%
of t
he D
oha
Dev
elop
men
t A
gend
a ag
reem
ents
th
at h
ave
been
im
plem
ente
d in
<i
nser
t cou
ntry
na
me>
’s le
gal
fram
ewor
k go
vern
ing t
rade
17.1
1%
99.9
0300
00Su
stai
nabl
e ec
onom
ic
deve
lopm
ent
0301
00G
ener
al03
0100
0002
3Av
erag
e %
cha
nge
in in
dust
ry’s
shar
e of
em
ploy
men
t
9.2
1%
10
0300
00Su
stai
nabl
e ec
onom
ic
deve
lopm
ent
0301
00G
ener
al03
0100
0002
4Av
erag
e %
cha
nge
in in
dust
ry’s
shar
e of
GD
P
9.2
1%
10
0300
00Su
stai
nabl
e ec
onom
ic
deve
lopm
ent
0301
00G
ener
al03
0100
0116
2Av
erag
e %
cha
nge
in p
ropo
rtion
of
popu
latio
n w
ith
mob
ile o
r fixe
d lin
e in
tern
et
conn
ectio
ns
9.c
1%
10
0300
00Su
stai
nabl
e ec
onom
ic
deve
lopm
ent
0301
00G
ener
al03
0100
0002
9Av
erag
e co
st
per M
egab
yte
of
data
tran
sfer
9.c
2U
SD.0
1
cont
inue
d on
nex
t pag
e

An Outcome Classification System with Outcome Indicators 125
Code
Hig
h-Le
vel O
I G
roup
ing
Code
Leve
l 2 S
ecto
r OI
Gro
upin
gCo
deSu
b-ca
tego
ry
OI G
roup
ing
OI_
ID
(uni
que)
OI D
escr
iptio
nSD
G
Refe
renc
e
Targ
et
Max
or
Min
(2,1)
Uni
t of
mea
sure
Des
crip
tion
of ca
lcul
atio
n m
etho
dolo
gyTa
rget
2
016
Targ
et
201
7Ta
rget
2
018
Targ
et
201
9Ta
rget
2
030
12
34
56
78
910
1112
1314
1516
2803
0000
Sust
aina
ble
econ
omic
de
velo
pmen
t
0301
00G
ener
al03
0100
0116
9Av
erag
e va
rianc
e in
pro
vinc
ial G
DP
0300
00Su
stai
nabl
e ec
onom
ic
deve
lopm
ent
0301
00G
ener
al03
0100
0005
0Cl
osin
g a b
usin
ess
rank
ing o
n th
e W
orld
wid
e G
over
nanc
e In
dica
tor o
f the
W
orld
Ban
k
0300
00Su
stai
nabl
e ec
onom
ic
deve
lopm
ent
0301
00G
ener
al03
0100
0004
6Effi
cien
cy
Enha
ncer
s ra
nkin
g in
the
Wor
ld E
cono
mic
Fo
rum
repo
rt
2in
dex
46
0300
00Su
stai
nabl
e ec
onom
ic
deve
lopm
ent
0301
00G
ener
al03
0100
0004
6Effi
cien
cy
Enha
ncer
s sco
re
in th
e W
orld
Ec
onom
ic
Foru
m re
port
1in
dex
4.38
0300
00Su
stai
nabl
e ec
onom
ic
deve
lopm
ent
0301
00G
ener
al03
0100
0002
1G
INI C
oeffi
cien
t fo
r <in
sert
coun
try n
ame>
0300
00Su
stai
nabl
e ec
onom
ic
deve
lopm
ent
0301
00G
ener
al03
0100
0004
3G
loba
l Co
mpe
titiv
enes
s In
dica
tor (
GCI
) ra
nkin
g in
the
Wor
ld E
cono
mic
Fo
rum
repo
rt
2in
dex
34
0300
00Su
stai
nabl
e ec
onom
ic
deve
lopm
ent
0301
00G
ener
al03
0100
0004
3G
loba
l Co
mpe
titiv
enes
s In
dica
tor (
GCI
) sc
ore
in th
e W
orld
Eco
nom
ic
Foru
m re
port
1in
dex
4.57
0300
00Su
stai
nabl
e ec
onom
ic
deve
lopm
ent
0301
00G
ener
al03
0100
0004
2G
row
th in
in
dust
rial
outp
ut (%
)
0300
00Su
stai
nabl
e ec
onom
ic
deve
lopm
ent
0301
00G
ener
al03
0100
0117
6In
nova
tion
and
Soph
istic
atio
n Fa
ctor
s ra
nkin
g in
the
Wor
ld
Econ
omic
Fo
rum
repo
rt
2in
dex
30
cont
inue
d on
nex
t pag
e

126 Appendix 6
Code
Hig
h-Le
vel O
I G
roup
ing
Code
Leve
l 2 S
ecto
r OI
Gro
upin
gCo
deSu
b-ca
tego
ry
OI G
roup
ing
OI_
ID
(uni
que)
OI D
escr
iptio
nSD
G
Refe
renc
e
Targ
et
Max
or
Min
(2,1)
Uni
t of
mea
sure
Des
crip
tion
of ca
lcul
atio
n m
etho
dolo
gyTa
rget
2
016
Targ
et
201
7Ta
rget
2
018
Targ
et
201
9Ta
rget
2
030
12
34
56
78
910
1112
1314
1516
2803
0000
Sust
aina
ble
econ
omic
de
velo
pmen
t
0301
00G
ener
al03
0100
0117
6In
nova
tion
and
Soph
istic
atio
n Fa
ctor
s sco
re
in th
e W
orld
Ec
onom
ic
Foru
m re
port
1in
dex
4.2
0300
00Su
stai
nabl
e ec
onom
ic
deve
lopm
ent
0301
00G
ener
al03
0100
0004
0In
vest
men
t as a
%
of G
DP
(nom
inal
)
0300
00Su
stai
nabl
e ec
onom
ic
deve
lopm
ent
0301
00G
ener
al03
0100
0117
2In
vest
men
t as a
%
of G
DP
(rea
l)
0300
00Su
stai
nabl
e ec
onom
ic
deve
lopm
ent
0301
00G
ener
al03
0100
0116
5N
umbe
r of
regu
lato
ry
inst
rum
ents
or
inst
itutio
nal
bloc
kage
s tha
t pr
even
t or l
imit
fore
ign
inve
stm
ent
in a
com
mer
cial
en
terp
rise
in
any s
ecto
r of
the
econ
omy
2%
0300
00Su
stai
nabl
e ec
onom
ic
deve
lopm
ent
0301
00G
ener
al03
0100
0003
4N
umbe
r of
regu
lato
ry
inst
rum
ents
or
inst
itutio
nal
prac
tices
with
one
or
mor
e po
licie
s or
pra
ctic
es th
at
disc
rimin
ates
ag
ains
t or i
n fa
vour
of
one
or m
ore
pote
ntia
l tra
ding
or
inve
stin
g en
titie
s (ot
her
than
in re
spec
t of
inte
rnat
iona
lly
endo
rsed
sa
nctio
ns) r
elat
ive
to th
e w
hole
17.1
2N
umbe
r of
inst
rum
ents
.001
0300
00Su
stai
nabl
e ec
onom
ic
deve
lopm
ent
0301
00G
ener
al03
0100
0003
9Se
cond
varia
nce
of
Prov
inci
al G
DP
($)
cont
inue
d on
nex
t pag
e
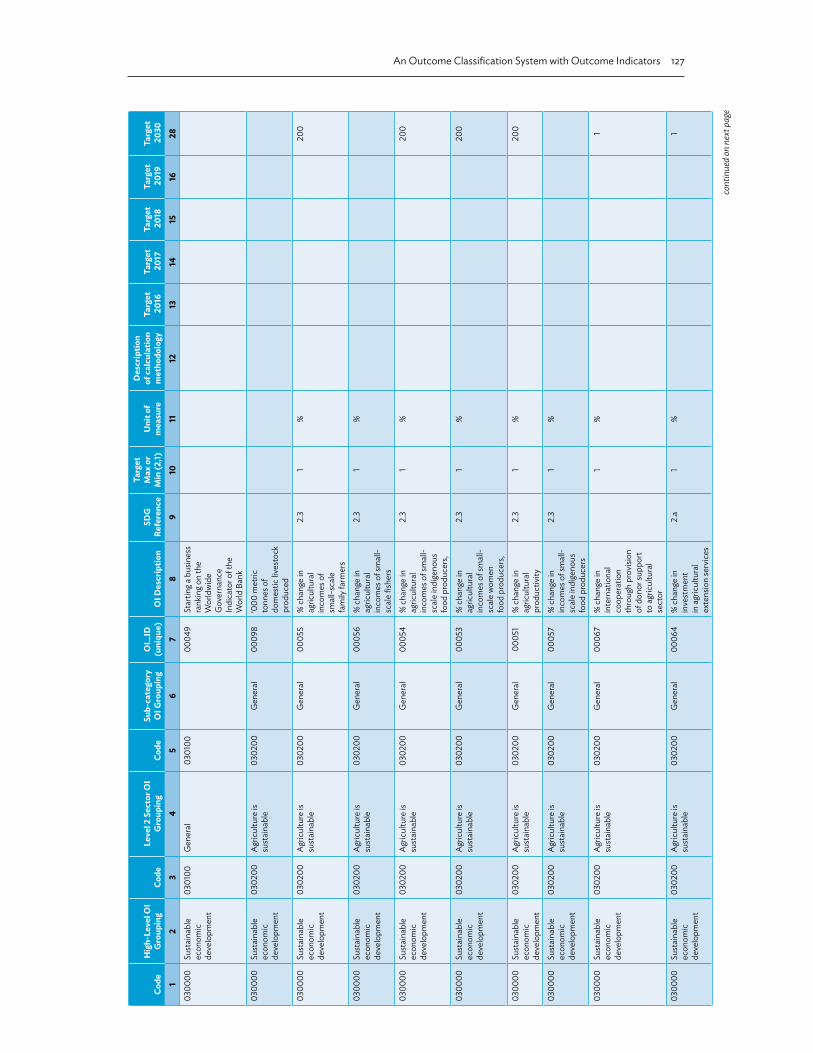
An Outcome Classification System with Outcome Indicators 127
Code
Hig
h-Le
vel O
I G
roup
ing
Code
Leve
l 2 S
ecto
r OI
Gro
upin
gCo
deSu
b-ca
tego
ry
OI G
roup
ing
OI_
ID
(uni
que)
OI D
escr
iptio
nSD
G
Refe
renc
e
Targ
et
Max
or
Min
(2,1)
Uni
t of
mea
sure
Des
crip
tion
of ca
lcul
atio
n m
etho
dolo
gyTa
rget
2
016
Targ
et
201
7Ta
rget
2
018
Targ
et
201
9Ta
rget
2
030
12
34
56
78
910
1112
1314
1516
2803
0000
Sust
aina
ble
econ
omic
de
velo
pmen
t
0301
00G
ener
al03
0100
0004
9St
artin
g a b
usin
ess
rank
ing o
n th
e W
orld
wid
e G
over
nanc
e In
dica
tor o
f the
W
orld
Ban
k
0300
00Su
stai
nabl
e ec
onom
ic
deve
lopm
ent
0302
00A
gric
ultu
re is
su
stai
nabl
e 03
0200
Gen
eral
0009
8‘0
00 m
etric
to
nnes
of
dom
estic
lives
tock
pr
oduc
ed
0300
00Su
stai
nabl
e ec
onom
ic
deve
lopm
ent
0302
00A
gric
ultu
re is
su
stai
nabl
e 03
0200
Gen
eral
0005
5%
cha
nge
in
agric
ultu
ral
inco
mes
of
smal
l-sca
le
fam
ily fa
rmer
s
2.3
1%
200
0300
00Su
stai
nabl
e ec
onom
ic
deve
lopm
ent
0302
00A
gric
ultu
re is
su
stai
nabl
e 03
0200
Gen
eral
0005
6%
cha
nge
in
agric
ultu
ral
inco
mes
of s
mal
l-sc
ale
fishe
rs
2.3
1%
0300
00Su
stai
nabl
e ec
onom
ic
deve
lopm
ent
0302
00A
gric
ultu
re is
su
stai
nabl
e 03
0200
Gen
eral
0005
4%
cha
nge
in
agric
ultu
ral
inco
mes
of s
mal
l-sc
ale
indi
geno
us
food
pro
duce
rs,
2.3
1%
200
0300
00Su
stai
nabl
e ec
onom
ic
deve
lopm
ent
0302
00A
gric
ultu
re is
su
stai
nabl
e 03
0200
Gen
eral
0005
3%
cha
nge
in
agric
ultu
ral
inco
mes
of s
mal
l-sc
ale
wom
en
food
pro
duce
rs,
2.3
1%
200
0300
00Su
stai
nabl
e ec
onom
ic
deve
lopm
ent
0302
00A
gric
ultu
re is
su
stai
nabl
e 03
0200
Gen
eral
0005
1%
cha
nge
in
agric
ultu
ral
prod
uctiv
ity
2.3
1%
200
0300
00Su
stai
nabl
e ec
onom
ic
deve
lopm
ent
0302
00A
gric
ultu
re is
su
stai
nabl
e 03
0200
Gen
eral
0005
7%
cha
nge
in
inco
mes
of s
mal
l-sc
ale
indi
geno
us
food
pro
duce
rs
2.3
1%
0300
00Su
stai
nabl
e ec
onom
ic
deve
lopm
ent
0302
00A
gric
ultu
re is
su
stai
nabl
e 03
0200
Gen
eral
0006
7%
cha
nge
in
inte
rnat
iona
l co
oper
atio
n th
roug
h pr
ovisi
on
of d
onor
supp
ort
to a
gric
ultu
ral
sect
or
1%
1
0300
00Su
stai
nabl
e ec
onom
ic
deve
lopm
ent
0302
00A
gric
ultu
re is
su
stai
nabl
e 03
0200
Gen
eral
0006
4%
cha
nge
in
inve
stm
ent
in a
gric
ultu
ral
exte
nsio
n se
rvic
es
2.a
1%
1
cont
inue
d on
nex
t pag
e

128 Appendix 6
Code
Hig
h-Le
vel O
I G
roup
ing
Code
Leve
l 2 S
ecto
r OI
Gro
upin
gCo
deSu
b-ca
tego
ry
OI G
roup
ing
OI_
ID
(uni
que)
OI D
escr
iptio
nSD
G
Refe
renc
e
Targ
et
Max
or
Min
(2,1)
Uni
t of
mea
sure
Des
crip
tion
of ca
lcul
atio
n m
etho
dolo
gyTa
rget
2
016
Targ
et
201
7Ta
rget
2
018
Targ
et
201
9Ta
rget
2
030
12
34
56
78
910
1112
1314
1516
2803
0000
Sust
aina
ble
econ
omic
de
velo
pmen
t
0302
00A
gric
ultu
re is
su
stai
nabl
e 03
0200
Gen
eral
0006
3%
cha
nge
in
inve
stm
ent
in a
gric
ultu
ral
rese
arch
2.a
1%
1
0300
00Su
stai
nabl
e ec
onom
ic
deve
lopm
ent
0302
00A
gric
ultu
re is
su
stai
nabl
e 03
0200
Gen
eral
0006
5%
cha
nge
in
inve
stm
ent
in a
gric
ultu
ral
tech
nolo
gy
deve
lopm
ent
2.a
1%
1
0300
00Su
stai
nabl
e ec
onom
ic
deve
lopm
ent
0302
00A
gric
ultu
re is
su
stai
nabl
e 03
0200
Gen
eral
0006
6%
cha
nge
in
inve
stm
ent i
n pl
ant a
nd liv
esto
ck
gene
ban
ks
2.a
1%
1
0300
00Su
stai
nabl
e ec
onom
ic
deve
lopm
ent
0302
00A
gric
ultu
re is
su
stai
nabl
e 03
0200
Gen
eral
0006
2%
cha
nge
in
inve
stm
ent i
n ru
ral
infra
stru
ctur
e
2.a
1%
1
0300
00Su
stai
nabl
e ec
onom
ic
deve
lopm
ent
0302
00A
gric
ultu
re is
su
stai
nabl
e 03
0200
Gen
eral
0005
8%
cha
nge
in
the
num
ber
of ge
netic
ally
di
ffere
nt se
eds
2.5
1%
0300
00Su
stai
nabl
e ec
onom
ic
deve
lopm
ent
0302
00A
gric
ultu
re is
su
stai
nabl
e 03
0200
Gen
eral
0005
9%
cha
nge
in
the
num
ber o
f ge
netic
ally
div
erse
cu
ltiva
ted
plan
ts
2.5
1%
0300
00Su
stai
nabl
e ec
onom
ic
deve
lopm
ent
0302
00A
gric
ultu
re is
su
stai
nabl
e 03
0200
Gen
eral
0006
0%
cha
nge
in
the
num
ber
of ge
netic
ally
di
vers
e fa
rmed
an
d do
mes
ticat
ed
anim
als
2.5
1%
0300
00Su
stai
nabl
e ec
onom
ic
deve
lopm
ent
0302
00A
gric
ultu
re is
su
stai
nabl
e 03
0200
Gen
eral
0006
1%
cha
nge
in
the
num
ber o
f ge
netic
ally
div
erse
w
ild sp
ecie
s
2.5
1%
0300
00Su
stai
nabl
e ec
onom
ic
deve
lopm
ent
0302
00A
gric
ultu
re is
su
stai
nabl
e 03
0200
Gen
eral
0007
5%
of a
gric
ultu
ral
com
mod
ities
with
an
info
rmat
ion
exch
ange
faci
lity
to p
rovi
de
cons
umer
s and
tra
ders
with
tim
ely
acce
ss to
mar
ket
info
rmat
ion
(incl
udin
g on
food
rese
rves
)
99.9
cont
inue
d on
nex
t pag
e

An Outcome Classification System with Outcome Indicators 129
Code
Hig
h-Le
vel O
I G
roup
ing
Code
Leve
l 2 S
ecto
r OI
Gro
upin
gCo
deSu
b-ca
tego
ry
OI G
roup
ing
OI_
ID
(uni
que)
OI D
escr
iptio
nSD
G
Refe
renc
e
Targ
et
Max
or
Min
(2,1)
Uni
t of
mea
sure
Des
crip
tion
of ca
lcul
atio
n m
etho
dolo
gyTa
rget
2
016
Targ
et
201
7Ta
rget
2
018
Targ
et
201
9Ta
rget
2
030
12
34
56
78
910
1112
1314
1516
2803
0000
Sust
aina
ble
econ
omic
de
velo
pmen
t
0302
00A
gric
ultu
re is
su
stai
nabl
e 03
0200
Gen
eral
0007
3%
of a
gric
ultu
ral
com
mod
ities
w
ith go
vern
men
t m
arke
t in
terv
entio
n pr
actic
es d
esig
ned
to in
fluen
ce
food
com
mod
ity
mar
kets
or t
heir
deriv
ativ
e m
arke
ts
(suc
h as
futu
res
and
optio
ns)
2%
.000
1
0300
00Su
stai
nabl
e ec
onom
ic
deve
lopm
ent
0302
00A
gric
ultu
re is
su
stai
nabl
e 03
0200
Gen
eral
0007
4%
of a
gric
ultu
ral
com
mod
ities
w
ith go
vern
men
t pr
ice
cont
rol
mec
hani
sms
that
inte
rfere
w
ith c
omm
odity
m
arke
ts a
nd th
eir
deriv
ativ
e m
arke
ts
2%
.000
1
0300
00Su
stai
nabl
e ec
onom
ic
deve
lopm
ent
0302
00A
gric
ultu
re is
su
stai
nabl
e 03
0200
Gen
eral
0007
2%
of a
gric
ultu
ral
com
mod
ities
w
ith o
ne o
r mor
e tra
de re
stric
tions
or
subs
idie
s in
cont
rave
ntio
n of
the
man
date
of
the
Doh
a D
evel
opm
ent
Roun
d
2%
.000
1
0300
00Su
stai
nabl
e ec
onom
ic
deve
lopm
ent
0302
00A
gric
ultu
re is
su
stai
nabl
e 03
0200
Gen
eral
0007
9A
gric
ultu
re
prod
uctio
n lo
st
due
to w
eath
er
syst
ems (
$)
0300
00Su
stai
nabl
e ec
onom
ic
deve
lopm
ent
0302
00A
gric
ultu
re is
su
stai
nabl
e 03
0200
Gen
eral
0006
9Av
erag
e %
ch
ange
in ru
ral
sect
or c
apita
l in
vest
men
t (re
al)
1%
10
0300
00Su
stai
nabl
e ec
onom
ic
deve
lopm
ent
0302
00A
gric
ultu
re is
su
stai
nabl
e 03
0200
Gen
eral
0007
8Av
erag
e in
com
e pe
r agr
icul
ture
w
orke
r/med
ian
<ins
ert c
ount
ry
nam
e>n
inco
me
cont
inue
d on
nex
t pag
e

130 Appendix 6
Code
Hig
h-Le
vel O
I G
roup
ing
Code
Leve
l 2 S
ecto
r OI
Gro
upin
gCo
deSu
b-ca
tego
ry
OI G
roup
ing
OI_
ID
(uni
que)
OI D
escr
iptio
nSD
G
Refe
renc
e
Targ
et
Max
or
Min
(2,1)
Uni
t of
mea
sure
Des
crip
tion
of ca
lcul
atio
n m
etho
dolo
gyTa
rget
2
016
Targ
et
201
7Ta
rget
2
018
Targ
et
201
9Ta
rget
2
030
12
34
56
78
910
1112
1314
1516
2803
0000
Sust
aina
ble
econ
omic
de
velo
pmen
t
0302
00A
gric
ultu
re is
su
stai
nabl
e 03
0200
Gen
eral
0007
7Av
erag
e in
flatio
n ra
te in
bas
ic fo
od
com
mod
ities
(in
sert
defin
ition
of
“bas
ic fo
od
com
mod
ities
”)
0300
00Su
stai
nabl
e ec
onom
ic
deve
lopm
ent
0302
00A
gric
ultu
re is
su
stai
nabl
e 03
0200
Gen
eral
0008
0G
ross
valu
e ad
ded
by a
gric
ultu
re
sect
or ($
)
0300
00Su
stai
nabl
e ec
onom
ic
deve
lopm
ent
0302
00A
gric
ultu
re is
su
stai
nabl
e 03
0200
Gen
eral
0008
1G
ross
valu
e ad
ded
by c
ropp
ing (
$)
0300
00Su
stai
nabl
e ec
onom
ic
deve
lopm
ent
0302
00A
gric
ultu
re is
su
stai
nabl
e 03
0200
Gen
eral
0008
2G
ross
valu
e ad
ded
by liv
esto
ck
husb
andr
y ($)
0300
00Su
stai
nabl
e ec
onom
ic
deve
lopm
ent
0302
00A
gric
ultu
re is
su
stai
nabl
e 03
0200
Gen
eral
0007
6G
row
th in
ag
ricul
ture
ou
tput
(rea
l, $)
0300
00Su
stai
nabl
e ec
onom
ic
deve
lopm
ent
0302
00A
gric
ultu
re is
su
stai
nabl
e 03
0200
Gen
eral
0008
5M
etric
tonn
es
of b
anan
a pe
r he
ctar
e
0300
00Su
stai
nabl
e ec
onom
ic
deve
lopm
ent
0302
00A
gric
ultu
re is
su
stai
nabl
e 03
0200
Gen
eral
0009
6M
etric
tonn
es
of c
abba
ge
per h
ecta
re
0300
00Su
stai
nabl
e ec
onom
ic
deve
lopm
ent
0302
00A
gric
ultu
re is
su
stai
nabl
e 03
0200
Gen
eral
0009
1M
etric
tonn
es o
f ca
cao
per h
ecta
re
0300
00Su
stai
nabl
e ec
onom
ic
deve
lopm
ent
0302
00A
gric
ultu
re is
su
stai
nabl
e 03
0200
Gen
eral
0009
7M
etric
tonn
es
of c
aulifl
ower
he
ctar
e
0300
00Su
stai
nabl
e ec
onom
ic
deve
lopm
ent
0302
00A
gric
ultu
re is
su
stai
nabl
e 03
0200
Gen
eral
0008
6M
etric
tonn
es
of c
ocon
ut a
nd
copr
a pe
r hec
tare
0300
00Su
stai
nabl
e ec
onom
ic
deve
lopm
ent
0302
00A
gric
ultu
re is
su
stai
nabl
e 03
0200
Gen
eral
0009
0M
etric
tonn
es o
f co
ffee
per h
ecta
re
0300
00Su
stai
nabl
e ec
onom
ic
deve
lopm
ent
0302
00A
gric
ultu
re is
su
stai
nabl
e 03
0200
Gen
eral
0009
4M
etric
tonn
es
of e
ggpl
ant
per h
ecta
re
0300
00Su
stai
nabl
e ec
onom
ic
deve
lopm
ent
0302
00A
gric
ultu
re is
su
stai
nabl
e 03
0200
Gen
eral
0008
8M
etric
tonn
es o
f m
ango
per
hec
tare
cont
inue
d on
nex
t pag
e

An Outcome Classification System with Outcome Indicators 131
Code
Hig
h-Le
vel O
I G
roup
ing
Code
Leve
l 2 S
ecto
r OI
Gro
upin
gCo
deSu
b-ca
tego
ry
OI G
roup
ing
OI_
ID
(uni
que)
OI D
escr
iptio
nSD
G
Refe
renc
e
Targ
et
Max
or
Min
(2,1)
Uni
t of
mea
sure
Des
crip
tion
of ca
lcul
atio
n m
etho
dolo
gyTa
rget
2
016
Targ
et
201
7Ta
rget
2
018
Targ
et
201
9Ta
rget
2
030
12
34
56
78
910
1112
1314
1516
2803
0000
Sust
aina
ble
econ
omic
de
velo
pmen
t
0302
00A
gric
ultu
re is
su
stai
nabl
e 03
0200
Gen
eral
0008
7M
etric
tonn
es
of p
inea
pple
pe
r hec
tare
0300
00Su
stai
nabl
e ec
onom
ic
deve
lopm
ent
0302
00A
gric
ultu
re is
su
stai
nabl
e 03
0200
Gen
eral
0009
2M
etric
tonn
es o
f ru
bber
per
hec
tare
0300
00Su
stai
nabl
e ec
onom
ic
deve
lopm
ent
0302
00A
gric
ultu
re is
su
stai
nabl
e 03
0200
Gen
eral
0008
9M
etric
tonn
es
of su
garc
ane
per h
ecta
re
0300
00Su
stai
nabl
e ec
onom
ic
deve
lopm
ent
0302
00A
gric
ultu
re is
su
stai
nabl
e 03
0200
Gen
eral
0009
5M
etric
tonn
es
of to
mat
o pe
r he
ctar
e
0300
00Su
stai
nabl
e ec
onom
ic
deve
lopm
ent
0302
00A
gric
ultu
re is
su
stai
nabl
e 03
0200
Gen
eral
0009
3M
etric
tonn
es
of ve
geta
bles
pe
r hec
tare
0300
00Su
stai
nabl
e ec
onom
ic
deve
lopm
ent
0302
00A
gric
ultu
re is
su
stai
nabl
e 03
0200
Gen
eral
0007
1N
umbe
r of
agric
ultu
ral
com
mod
ities
w
ith e
xpor
t en
hanc
emen
t m
easu
res t
hat
effec
tivel
y su
bsid
ize
thei
r exp
ort
2N
umbe
r of
com
mod
ities
1
0300
00Su
stai
nabl
e ec
onom
ic
deve
lopm
ent
0302
00A
gric
ultu
re is
su
stai
nabl
e 03
0200
Gen
eral
0007
0N
umbe
r of
agric
ultu
ral
com
mod
ities
w
ith e
xpor
t su
bsid
ies i
n pl
ace
2N
umbe
r of
com
mod
ities
1
0300
00Su
stai
nabl
e ec
onom
ic
deve
lopm
ent
0302
00A
gric
ultu
re is
su
stai
nabl
e 03
0200
Gen
eral
0006
8N
umbe
r of
regu
latio
ns o
r ot
her f
orm
alize
d ob
stac
les
prev
entin
g or
limiti
ng
inte
rnat
iona
l in
vest
men
t in
<ins
ert c
ount
ry
nam
e>’s
agric
ultu
ral s
ecto
r.
2N
umbe
r of
regu
latio
ns.0
0001
0300
00Su
stai
nabl
e ec
onom
ic
deve
lopm
ent
0302
00A
gric
ultu
re is
su
stai
nabl
e 03
0200
Gen
eral
0008
4Va
lue
of
agric
ultu
ral
expo
rts (U
SD)
1U
SD
cont
inue
d on
nex
t pag
e

132 Appendix 6
Code
Hig
h-Le
vel O
I G
roup
ing
Code
Leve
l 2 S
ecto
r OI
Gro
upin
gCo
deSu
b-ca
tego
ry
OI G
roup
ing
OI_
ID
(uni
que)
OI D
escr
iptio
nSD
G
Refe
renc
e
Targ
et
Max
or
Min
(2,1)
Uni
t of
mea
sure
Des
crip
tion
of ca
lcul
atio
n m
etho
dolo
gyTa
rget
2
016
Targ
et
201
7Ta
rget
2
018
Targ
et
201
9Ta
rget
2
030
12
34
56
78
910
1112
1314
1516
2803
0000
Sust
aina
ble
econ
omic
de
velo
pmen
t
0302
00A
gric
ultu
re is
su
stai
nabl
e 03
0201
Irrig
atio
n Se
rvic
es a
re
sust
aina
ble
and
effici
ent
0011
9%
of h
ecta
res
whe
re e
stim
ated
5
year
aver
age
(val
ue a
dded
pe
r meg
alitr
e de
liver
ed/c
ost
per m
egal
itre)
is
less
than
1
2%
11
11
1
0300
00Su
stai
nabl
e ec
onom
ic
deve
lopm
ent
0302
00A
gric
ultu
re is
su
stai
nabl
e 03
0201
Irrig
atio
n Se
rvic
es a
re
sust
aina
ble
and
effici
ent
0011
8Es
timat
ed 5
year
av
erag
e of
the
ratio
- (va
lue
adde
d pe
r m
egal
itre
of
irrig
atio
n w
ater
de
liver
ed/c
ost
per m
egal
itre
of
irrig
atio
n w
ater
de
liver
ed)
1Ra
tio1
11
11
0300
00Su
stai
nabl
e ec
onom
ic
deve
lopm
ent
0302
00A
gric
ultu
re is
su
stai
nabl
e 03
0201
Irrig
atio
n Se
rvic
es a
re
sust
aina
ble
and
effici
ent
0012
0M
egal
itres
de
liver
ed p
er
indu
stry
wor
ker
1M
egal
itres
pe
r per
son
0300
00Su
stai
nabl
e ec
onom
ic
deve
lopm
ent
0302
00A
gric
ultu
re is
su
stai
nabl
e 03
0201
Irrig
atio
n Se
rvic
es a
re
sust
aina
ble
and
effici
ent
0011
7To
tal ir
rigab
le
land
/Tot
al la
nd
unde
r irri
gatio
n
2Ra
tio1
11
11
0300
00Su
stai
nabl
e ec
onom
ic
deve
lopm
ent
0302
00A
gric
ultu
re is
su
stai
nabl
e 03
0202
Rice
pro
duct
ion
is su
stai
nabl
e an
d effi
cien
t
0013
2%
of p
rodu
ctio
n lo
st p
ost
harv
est (
rice)
2%
0300
00Su
stai
nabl
e ec
onom
ic
deve
lopm
ent
0302
00A
gric
ultu
re is
su
stai
nabl
e 03
0202
Rice
pro
duct
ion
is su
stai
nabl
e an
d effi
cien
t
0012
9D
omes
tic
cons
umpt
ion
rice/
Dom
estic
pr
oduc
tion
rice
1Ra
tio1
0300
00Su
stai
nabl
e ec
onom
ic
deve
lopm
ent
0302
00A
gric
ultu
re is
su
stai
nabl
e 03
0202
Rice
pro
duct
ion
is su
stai
nabl
e an
d effi
cien
t
0013
1Es
timat
ed 5
year
av
erag
e of
the
ratio
- (r
even
ue
per t
onne
of
rice
harv
este
d/co
st p
er to
nne
of
rice
prod
uced
)
1ra
tio1
0300
00Su
stai
nabl
e ec
onom
ic
deve
lopm
ent
0302
00A
gric
ultu
re is
su
stai
nabl
e 03
0202
Rice
pro
duct
ion
is su
stai
nabl
e an
d effi
cien
t
0013
0M
etric
tonn
es o
f pa
di p
er h
ecta
re1
tonn
es/
hect
are
0300
00Su
stai
nabl
e ec
onom
ic
deve
lopm
ent
0302
00A
gric
ultu
re is
su
stai
nabl
e 03
0202
Rice
pro
duct
ion
is su
stai
nabl
e an
d effi
cien
t
0013
3To
nnes
pro
duce
d pe
r ind
ustry
w
orke
r
1
cont
inue
d on
nex
t pag
e

An Outcome Classification System with Outcome Indicators 133
Code
Hig
h-Le
vel O
I G
roup
ing
Code
Leve
l 2 S
ecto
r OI
Gro
upin
gCo
deSu
b-ca
tego
ry
OI G
roup
ing
OI_
ID
(uni
que)
OI D
escr
iptio
nSD
G
Refe
renc
e
Targ
et
Max
or
Min
(2,1)
Uni
t of
mea
sure
Des
crip
tion
of ca
lcul
atio
n m
etho
dolo
gyTa
rget
2
016
Targ
et
201
7Ta
rget
2
018
Targ
et
201
9Ta
rget
2
030
12
34
56
78
910
1112
1314
1516
2803
0000
Sust
aina
ble
econ
omic
de
velo
pmen
t
0302
00A
gric
ultu
re is
su
stai
nabl
e 03
0202
Rice
pro
duct
ion
is su
stai
nabl
e an
d effi
cien
t
0012
8To
tal r
ice
prod
uctio
n (m
illion
tonn
es)
1%
0300
00Su
stai
nabl
e ec
onom
ic
deve
lopm
ent
0302
00A
gric
ultu
re is
su
stai
nabl
e 03
0203
Soy p
rodu
ctio
n is
sust
aina
ble
and
effici
ent
0013
9%
of p
rodu
ctio
n lo
st p
ost h
arve
st
(soy
a)
2%
0300
00Su
stai
nabl
e ec
onom
ic
deve
lopm
ent
0302
00A
gric
ultu
re is
su
stai
nabl
e 03
0203
Soy p
rodu
ctio
n is
sust
aina
ble
and
effici
ent
0013
7D
omes
tic
cons
umpt
ion
soy/
dom
estic
pr
oduc
tion
soy
1ra
tio1
0300
00Su
stai
nabl
e ec
onom
ic
deve
lopm
ent
0302
00A
gric
ultu
re is
su
stai
nabl
e 03
0203
Soy p
rodu
ctio
n is
sust
aina
ble
and
effici
ent
0013
8Es
timat
ed 5
year
av
erag
e of
the
ratio
- (r
even
ue
per t
onne
of
soya
har
vest
ed/
cost
per
tonn
e of
so
ya p
rodu
ced)
1ra
tio1
0300
00Su
stai
nabl
e ec
onom
ic
deve
lopm
ent
0302
00A
gric
ultu
re is
su
stai
nabl
e 03
0203
Soy p
rodu
ctio
n is
sust
aina
ble
and
effici
ent
0014
0To
nnes
pro
duce
d pe
r ind
ustry
w
orke
r - S
oya
1
0300
00Su
stai
nabl
e ec
onom
ic
deve
lopm
ent
0302
00A
gric
ultu
re is
su
stai
nabl
e 03
0203
Soy p
rodu
ctio
n is
sust
aina
ble
and
effici
ent
0013
6To
tal s
oy
prod
uctio
n (m
illion
tonn
es)
1%
0300
00Su
stai
nabl
e ec
onom
ic
deve
lopm
ent
0302
00A
gric
ultu
re is
su
stai
nabl
e 03
0204
Corn
pro
duct
ion
is su
stai
nabl
e an
d effi
cien
t
0014
8%
of p
rodu
ctio
n lo
st p
ost h
arve
st
(cor
n)
2%
0300
00Su
stai
nabl
e ec
onom
ic
deve
lopm
ent
0302
00A
gric
ultu
re is
su
stai
nabl
e 03
0204
Corn
pro
duct
ion
is su
stai
nabl
e an
d effi
cien
t
0014
4D
omes
tic
cons
umpt
ion
corn
/dom
estic
pr
oduc
tion
corn
1ra
tio1
0300
00Su
stai
nabl
e ec
onom
ic
deve
lopm
ent
0302
00A
gric
ultu
re is
su
stai
nabl
e 03
0204
Corn
pro
duct
ion
is su
stai
nabl
e an
d effi
cien
t
0014
7Es
timat
ed 5
year
av
erag
e of
the
ratio
- (r
even
ue
per t
onne
of
corn
har
vest
ed/
cost
per
tonn
e of
co
rn p
rodu
ced)
1ra
tio1
0300
00Su
stai
nabl
e ec
onom
ic
deve
lopm
ent
0302
00A
gric
ultu
re is
su
stai
nabl
e 03
0204
Corn
pro
duct
ion
is su
stai
nabl
e an
d effi
cien
t
0014
5M
etric
tonn
es
of w
hite
cor
n pe
r hec
tare
tonn
es/
hect
are
0300
00Su
stai
nabl
e ec
onom
ic
deve
lopm
ent
0302
00A
gric
ultu
re is
su
stai
nabl
e 03
0204
Corn
pro
duct
ion
is su
stai
nabl
e an
d effi
cien
t
0014
6M
etric
tonn
es
of ye
llow
cor
n pe
r hec
tare
tonn
es/
hect
are
cont
inue
d on
nex
t pag
e

134 Appendix 6
Code
Hig
h-Le
vel O
I G
roup
ing
Code
Leve
l 2 S
ecto
r OI
Gro
upin
gCo
deSu
b-ca
tego
ry
OI G
roup
ing
OI_
ID
(uni
que)
OI D
escr
iptio
nSD
G
Refe
renc
e
Targ
et
Max
or
Min
(2,1)
Uni
t of
mea
sure
Des
crip
tion
of ca
lcul
atio
n m
etho
dolo
gyTa
rget
2
016
Targ
et
201
7Ta
rget
2
018
Targ
et
201
9Ta
rget
2
030
12
34
56
78
910
1112
1314
1516
2803
0000
Sust
aina
ble
econ
omic
de
velo
pmen
t
0302
00A
gric
ultu
re is
su
stai
nabl
e 03
0204
Corn
pro
duct
ion
is su
stai
nabl
e an
d effi
cien
t
0014
9To
nnes
pro
duce
d pe
r ind
ustry
w
orke
r - C
orn
1
0300
00Su
stai
nabl
e ec
onom
ic
deve
lopm
ent
0302
00A
gric
ultu
re is
su
stai
nabl
e 03
0204
Corn
pro
duct
ion
is su
stai
nabl
e an
d effi
cien
t
0014
3To
tal c
orn
prod
uctio
n (m
illion
tonn
es)
1%
0300
00Su
stai
nabl
e ec
onom
ic
deve
lopm
ent
0302
00A
gric
ultu
re is
su
stai
nabl
e 03
0205
Suga
r pr
oduc
tion
is su
stai
nabl
e an
d effi
cien
t
0016
1%
of p
rodu
ctio
n lo
st p
ost h
arve
st
(sug
ar)
2%
0300
00Su
stai
nabl
e ec
onom
ic
deve
lopm
ent
0302
00A
gric
ultu
re is
su
stai
nabl
e 03
0205
Suga
r pr
oduc
tion
is su
stai
nabl
e an
d effi
cien
t
0015
9do
mes
tic
cons
umpt
ion
suga
r/dom
estic
pr
oduc
tion
suga
r
1ra
tio1
0300
00Su
stai
nabl
e ec
onom
ic
deve
lopm
ent
0302
00A
gric
ultu
re is
su
stai
nabl
e 03
0205
Suga
r pr
oduc
tion
is su
stai
nabl
e an
d effi
cien
t
0016
0Es
timat
ed 5
year
av
erag
e of
the
ratio
- (r
even
ue
per t
onne
of
suga
r har
vest
ed/
cost
per
tonn
e of
su
gar p
rodu
ced)
1ra
tio1
0300
00Su
stai
nabl
e ec
onom
ic
deve
lopm
ent
0302
00A
gric
ultu
re is
su
stai
nabl
e 03
0205
Suga
r pr
oduc
tion
is su
stai
nabl
e an
d effi
cien
t
0016
2To
nnes
pro
duce
d pe
r ind
ustry
w
orke
r - S
ugar
1
0300
00Su
stai
nabl
e ec
onom
ic
deve
lopm
ent
0302
00A
gric
ultu
re is
su
stai
nabl
e 03
0205
Suga
r pr
oduc
tion
is su
stai
nabl
e an
d effi
cien
t
0015
8To
tal s
ugar
pr
oduc
tion
(milli
on to
nnes
)
1%
0300
00Su
stai
nabl
e ec
onom
ic
deve
lopm
ent
0302
00A
gric
ultu
re is
su
stai
nabl
e 03
0206
Chic
ken
prod
uctio
n is
sust
aina
ble
and
effici
ent
0017
1%
of p
rodu
ctio
n lo
st p
ost h
arve
st
(chi
cken
)
2%
0300
00Su
stai
nabl
e ec
onom
ic
deve
lopm
ent
0302
00A
gric
ultu
re is
su
stai
nabl
e 03
0206
Chic
ken
prod
uctio
n is
sust
aina
ble
and
effici
ent
0016
8do
mes
tic
cons
umpt
ion
chic
ken/
dom
estic
pr
oduc
tion
chic
ken
1ra
tio1
0300
00Su
stai
nabl
e ec
onom
ic
deve
lopm
ent
0302
00A
gric
ultu
re is
su
stai
nabl
e 03
0206
Chic
ken
prod
uctio
n is
sust
aina
ble
and
effici
ent
0017
0Es
timat
ed 5
year
av
erag
e of
the
ratio
- (r
even
ue
per t
onne
of
chic
ken
harv
este
d/co
st p
er to
nne
of
chic
ken
prod
uced
)
1ra
tio1
cont
inue
d on
nex
t pag
e

An Outcome Classification System with Outcome Indicators 135
Code
Hig
h-Le
vel O
I G
roup
ing
Code
Leve
l 2 S
ecto
r OI
Gro
upin
gCo
deSu
b-ca
tego
ry
OI G
roup
ing
OI_
ID
(uni
que)
OI D
escr
iptio
nSD
G
Refe
renc
e
Targ
et
Max
or
Min
(2,1)
Uni
t of
mea
sure
Des
crip
tion
of ca
lcul
atio
n m
etho
dolo
gyTa
rget
2
016
Targ
et
201
7Ta
rget
2
018
Targ
et
201
9Ta
rget
2
030
12
34
56
78
910
1112
1314
1516
2803
0000
Sust
aina
ble
econ
omic
de
velo
pmen
t
0302
00A
gric
ultu
re is
su
stai
nabl
e 03
0206
Chic
ken
prod
uctio
n is
sust
aina
ble
and
effici
ent
0016
9G
ross
valu
e ad
ded
by p
oulte
rers
($)
1$
(nom
inal
)
0300
00Su
stai
nabl
e ec
onom
ic
deve
lopm
ent
0302
00A
gric
ultu
re is
su
stai
nabl
e 03
0206
Chic
ken
prod
uctio
n is
sust
aina
ble
and
effici
ent
0017
2To
nnes
pro
duce
d pe
r ind
ustry
w
orke
r - C
hick
en
1
0300
00Su
stai
nabl
e ec
onom
ic
deve
lopm
ent
0302
00A
gric
ultu
re is
su
stai
nabl
e 03
0206
Chic
ken
prod
uctio
n is
sust
aina
ble
and
effici
ent
0016
7To
tal c
hick
en
prod
uctio
n (m
illion
tonn
es)
1%
0300
00Su
stai
nabl
e ec
onom
ic
deve
lopm
ent
0302
00A
gric
ultu
re is
su
stai
nabl
e 03
0207
Beef
pro
duct
ion
is su
stai
nabl
e an
d effi
cien
t
0017
8%
of p
rodu
ctio
n lo
st p
ost h
arve
st
(bee
f)
2%
0300
00Su
stai
nabl
e ec
onom
ic
deve
lopm
ent
0302
00A
gric
ultu
re is
su
stai
nabl
e 03
0207
Beef
pro
duct
ion
is su
stai
nabl
e an
d effi
cien
t
0017
6do
mes
tic
cons
umpt
ion
beef
/dom
estic
pr
oduc
tion
beef
1ra
tio1
0300
00Su
stai
nabl
e ec
onom
ic
deve
lopm
ent
0302
00A
gric
ultu
re is
su
stai
nabl
e 03
0207
Beef
pro
duct
ion
is su
stai
nabl
e an
d effi
cien
t
0017
7Es
timat
ed 5
year
av
erag
e of
the
ratio
- (r
even
ue
per t
onne
of
beef
har
vest
ed/
cost
per
tonn
e of
be
ef p
rodu
ced)
1ra
tio1
0300
00Su
stai
nabl
e ec
onom
ic
deve
lopm
ent
0302
00A
gric
ultu
re is
su
stai
nabl
e 03
0207
Beef
pro
duct
ion
is su
stai
nabl
e an
d effi
cien
t
0017
9To
nnes
pro
duce
d pe
r ind
ustry
w
orke
r - B
eef
1
0300
00Su
stai
nabl
e ec
onom
ic
deve
lopm
ent
0302
00A
gric
ultu
re is
su
stai
nabl
e 03
0207
Beef
pro
duct
ion
is su
stai
nabl
e an
d effi
cien
t
0017
5To
tal b
eef
prod
uctio
n (m
illion
tonn
es)
1%
0300
00Su
stai
nabl
e ec
onom
ic
deve
lopm
ent
0302
00A
gric
ultu
re is
su
stai
nabl
e 03
0208
Bana
na
prod
uctio
n is
sust
aina
ble
and
effici
ent
0018
8%
of p
rodu
ctio
n lo
st p
ost h
arve
st
(ban
ana)
2%
0300
00Su
stai
nabl
e ec
onom
ic
deve
lopm
ent
0302
00A
gric
ultu
re is
su
stai
nabl
e 03
0208
Bana
na
prod
uctio
n is
sust
aina
ble
and
effici
ent
0018
6Es
timat
ed 5
year
av
erag
e of
the
ratio
- (r
even
ue
per t
onne
of
bana
na h
arve
sted
/co
st p
er to
nne
of
bana
na p
rodu
ced)
1ra
tio1
cont
inue
d on
nex
t pag
e

136 Appendix 6
Code
Hig
h-Le
vel O
I G
roup
ing
Code
Leve
l 2 S
ecto
r OI
Gro
upin
gCo
deSu
b-ca
tego
ry
OI G
roup
ing
OI_
ID
(uni
que)
OI D
escr
iptio
nSD
G
Refe
renc
e
Targ
et
Max
or
Min
(2,1)
Uni
t of
mea
sure
Des
crip
tion
of ca
lcul
atio
n m
etho
dolo
gyTa
rget
2
016
Targ
et
201
7Ta
rget
2
018
Targ
et
201
9Ta
rget
2
030
12
34
56
78
910
1112
1314
1516
2803
0000
Sust
aina
ble
econ
omic
de
velo
pmen
t
0302
00A
gric
ultu
re is
su
stai
nabl
e 03
0208
Bana
na
prod
uctio
n is
sust
aina
ble
and
effici
ent
0018
9To
nnes
pro
duce
d pe
r ind
ustry
w
orke
r - B
anan
a
1
0300
00Su
stai
nabl
e ec
onom
ic
deve
lopm
ent
0302
00A
gric
ultu
re is
su
stai
nabl
e 03
0208
Bana
na
prod
uctio
n is
sust
aina
ble
and
effici
ent
0018
7To
tal b
anan
a pr
oduc
tion
(met
ric to
nnes
)
1to
nnes
0300
00Su
stai
nabl
e ec
onom
ic
deve
lopm
ent
0302
00A
gric
ultu
re is
su
stai
nabl
e 03
0209
Coco
nut
prod
uctio
n is
sust
aina
ble
and
effici
ent
0019
8%
of p
rodu
ctio
n lo
st p
ost h
arve
st
(coc
onut
)
2%
0300
00Su
stai
nabl
e ec
onom
ic
deve
lopm
ent
0302
00A
gric
ultu
re is
su
stai
nabl
e 03
0209
Coco
nut
prod
uctio
n is
sust
aina
ble
and
effici
ent
0019
6Es
timat
ed 5
ye
ar av
erag
e of
the
ratio
- (r
even
ue p
er
tonn
e of
coc
onut
ha
rves
ted/
cost
per
to
nne
of c
ocon
ut
prod
uced
)
1ra
tio1
0300
00Su
stai
nabl
e ec
onom
ic
deve
lopm
ent
0302
00A
gric
ultu
re is
su
stai
nabl
e 03
0209
Coco
nut
prod
uctio
n is
sust
aina
ble
and
effici
ent
0019
9To
nnes
pro
duce
d pe
r ind
ustry
w
orke
r - C
ocon
ut
1
0300
00Su
stai
nabl
e ec
onom
ic
deve
lopm
ent
0302
00A
gric
ultu
re is
su
stai
nabl
e 03
0209
Coco
nut
prod
uctio
n is
sust
aina
ble
and
effici
ent
0019
7To
tal c
ocon
ut
prod
uctio
n (m
etric
tonn
es)
1to
nnes
0300
00Su
stai
nabl
e ec
onom
ic
deve
lopm
ent
0302
00A
gric
ultu
re is
su
stai
nabl
e 03
0210
Pine
appl
e pr
oduc
tion
is su
stai
nabl
e an
d effi
cien
t
0020
3%
of p
rodu
ctio
n lo
st p
ost h
arve
st
(pin
eapp
le)
2%
0300
00Su
stai
nabl
e ec
onom
ic
deve
lopm
ent
0302
00A
gric
ultu
re is
su
stai
nabl
e 03
0210
Pine
appl
e pr
oduc
tion
is su
stai
nabl
e an
d effi
cien
t
0020
1Es
timat
ed 5
year
av
erag
e of
the
ratio
- (r
even
ue
per t
onne
of
pine
appl
e ha
rves
ted/
cost
per
to
nne
of p
inap
ple
prod
uced
)
1ra
tio1
0300
00Su
stai
nabl
e ec
onom
ic
deve
lopm
ent
0302
00A
gric
ultu
re is
su
stai
nabl
e 03
0210
Pine
appl
e pr
oduc
tion
is su
stai
nabl
e an
d effi
cien
t
0020
4To
nnes
pr
oduc
ed p
er
indu
stry
wor
ker
- Pin
eapp
les
1
0300
00Su
stai
nabl
e ec
onom
ic
deve
lopm
ent
0302
00A
gric
ultu
re is
su
stai
nabl
e 03
0210
Pine
appl
e pr
oduc
tion
is su
stai
nabl
e an
d effi
cien
t
0020
2To
tal p
inea
pple
pr
oduc
tion
(met
ric to
nnes
)
1to
nnes
cont
inue
d on
nex
t pag
e
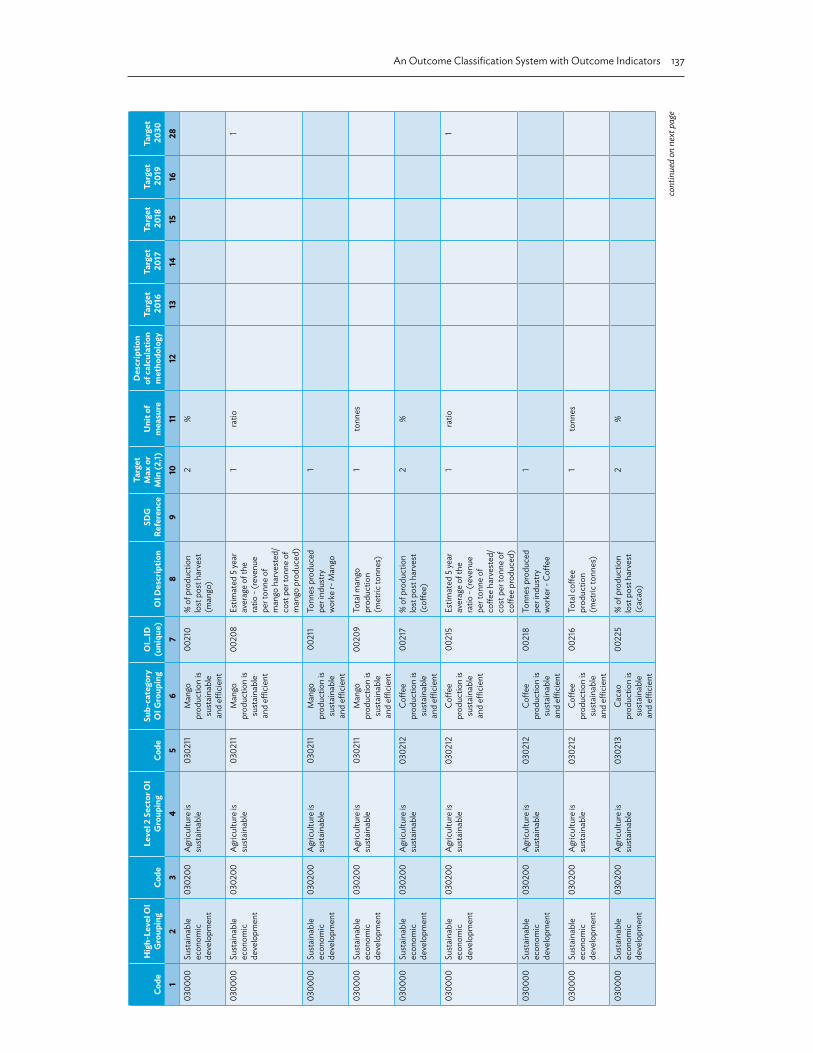
An Outcome Classification System with Outcome Indicators 137
Code
Hig
h-Le
vel O
I G
roup
ing
Code
Leve
l 2 S
ecto
r OI
Gro
upin
gCo
deSu
b-ca
tego
ry
OI G
roup
ing
OI_
ID
(uni
que)
OI D
escr
iptio
nSD
G
Refe
renc
e
Targ
et
Max
or
Min
(2,1)
Uni
t of
mea
sure
Des
crip
tion
of ca
lcul
atio
n m
etho
dolo
gyTa
rget
2
016
Targ
et
201
7Ta
rget
2
018
Targ
et
201
9Ta
rget
2
030
12
34
56
78
910
1112
1314
1516
2803
0000
Sust
aina
ble
econ
omic
de
velo
pmen
t
0302
00A
gric
ultu
re is
su
stai
nabl
e 03
0211
Man
go
prod
uctio
n is
sust
aina
ble
and
effici
ent
0021
0%
of p
rodu
ctio
n lo
st p
ost h
arve
st
(man
go)
2%
0300
00Su
stai
nabl
e ec
onom
ic
deve
lopm
ent
0302
00A
gric
ultu
re is
su
stai
nabl
e 03
0211
Man
go
prod
uctio
n is
sust
aina
ble
and
effici
ent
0020
8Es
timat
ed 5
year
av
erag
e of
the
ratio
- (r
even
ue
per t
onne
of
man
go h
arve
sted
/co
st p
er to
nne
of
man
go p
rodu
ced)
1ra
tio1
0300
00Su
stai
nabl
e ec
onom
ic
deve
lopm
ent
0302
00A
gric
ultu
re is
su
stai
nabl
e 03
0211
Man
go
prod
uctio
n is
sust
aina
ble
and
effici
ent
0021
1To
nnes
pro
duce
d pe
r ind
ustry
w
orke
r- M
ango
1
0300
00Su
stai
nabl
e ec
onom
ic
deve
lopm
ent
0302
00A
gric
ultu
re is
su
stai
nabl
e 03
0211
Man
go
prod
uctio
n is
sust
aina
ble
and
effici
ent
0020
9To
tal m
ango
pr
oduc
tion
(met
ric to
nnes
)
1to
nnes
0300
00Su
stai
nabl
e ec
onom
ic
deve
lopm
ent
0302
00A
gric
ultu
re is
su
stai
nabl
e 03
0212
Coffe
e pr
oduc
tion
is su
stai
nabl
e an
d effi
cien
t
0021
7%
of p
rodu
ctio
n lo
st p
ost h
arve
st
(coff
ee)
2%
0300
00Su
stai
nabl
e ec
onom
ic
deve
lopm
ent
0302
00A
gric
ultu
re is
su
stai
nabl
e 03
0212
Coffe
e pr
oduc
tion
is su
stai
nabl
e an
d effi
cien
t
0021
5Es
timat
ed 5
year
av
erag
e of
the
ratio
- (r
even
ue
per t
onne
of
coffe
e ha
rves
ted/
cost
per
tonn
e of
co
ffee
prod
uced
)
1ra
tio1
0300
00Su
stai
nabl
e ec
onom
ic
deve
lopm
ent
0302
00A
gric
ultu
re is
su
stai
nabl
e 03
0212
Coffe
e pr
oduc
tion
is su
stai
nabl
e an
d effi
cien
t
0021
8To
nnes
pro
duce
d pe
r ind
ustry
w
orke
r - C
offee
1
0300
00Su
stai
nabl
e ec
onom
ic
deve
lopm
ent
0302
00A
gric
ultu
re is
su
stai
nabl
e 03
0212
Coffe
e pr
oduc
tion
is su
stai
nabl
e an
d effi
cien
t
0021
6To
tal c
offee
pr
oduc
tion
(met
ric to
nnes
)
1to
nnes
0300
00Su
stai
nabl
e ec
onom
ic
deve
lopm
ent
0302
00A
gric
ultu
re is
su
stai
nabl
e 03
0213
Caca
o pr
oduc
tion
is su
stai
nabl
e an
d effi
cien
t
0022
5%
of p
rodu
ctio
n lo
st p
ost h
arve
st
(cac
ao)
2%
cont
inue
d on
nex
t pag
e

138 Appendix 6
Code
Hig
h-Le
vel O
I G
roup
ing
Code
Leve
l 2 S
ecto
r OI
Gro
upin
gCo
deSu
b-ca
tego
ry
OI G
roup
ing
OI_
ID
(uni
que)
OI D
escr
iptio
nSD
G
Refe
renc
e
Targ
et
Max
or
Min
(2,1)
Uni
t of
mea
sure
Des
crip
tion
of ca
lcul
atio
n m
etho
dolo
gyTa
rget
2
016
Targ
et
201
7Ta
rget
2
018
Targ
et
201
9Ta
rget
2
030
12
34
56
78
910
1112
1314
1516
2803
0000
Sust
aina
ble
econ
omic
de
velo
pmen
t
0302
00A
gric
ultu
re is
su
stai
nabl
e 03
0213
Caca
o pr
oduc
tion
is su
stai
nabl
e an
d effi
cien
t
0022
3Es
timat
ed 5
year
av
erag
e of
the
ratio
- (r
even
ue
per t
onne
of
caca
o ha
rves
ted/
cost
per
tonn
e of
ca
cao
prod
uced
)
1ra
tio1
0300
00Su
stai
nabl
e ec
onom
ic
deve
lopm
ent
0302
00A
gric
ultu
re is
su
stai
nabl
e 03
0213
Caca
o pr
oduc
tion
is su
stai
nabl
e an
d effi
cien
t
0022
6To
nnes
pro
duce
d pe
r ind
ustry
w
orke
r - C
acao
1
0300
00Su
stai
nabl
e ec
onom
ic
deve
lopm
ent
0302
00A
gric
ultu
re is
su
stai
nabl
e 03
0213
Caca
o pr
oduc
tion
is su
stai
nabl
e an
d effi
cien
t
0022
4To
tal c
acao
pr
oduc
tion
(met
ric to
nnes
)
1to
nnes
0300
00Su
stai
nabl
e ec
onom
ic
deve
lopm
ent
0302
00A
gric
ultu
re is
su
stai
nabl
e 03
0214
Rubb
er
prod
uctio
n is
sust
aina
ble
and
effici
ent
0023
3%
of p
rodu
ctio
n lo
st p
ost h
arve
st
(rub
ber)
2%
0300
00Su
stai
nabl
e ec
onom
ic
deve
lopm
ent
0302
00A
gric
ultu
re is
su
stai
nabl
e 03
0214
Rubb
er
prod
uctio
n is
sust
aina
ble
and
effici
ent
0023
1Es
timat
ed 5
year
av
erag
e of
the
ratio
- (r
even
ue
per t
onne
of
rubb
er h
arve
sted
/co
st p
er to
nne
of
rubb
er p
rodu
ced)
1ra
tio1
0300
00Su
stai
nabl
e ec
onom
ic
deve
lopm
ent
0302
00A
gric
ultu
re is
su
stai
nabl
e 03
0214
Rubb
er
prod
uctio
n is
sust
aina
ble
and
effici
ent
0023
4To
nnes
pro
duce
d pe
r ind
ustry
w
orke
r - ru
bber
1
0300
00Su
stai
nabl
e ec
onom
ic
deve
lopm
ent
0302
00A
gric
ultu
re is
su
stai
nabl
e 03
0214
Rubb
er
prod
uctio
n is
sust
aina
ble
and
effici
ent
0023
2To
tal r
ubbe
r pr
oduc
tion
(met
ric to
nnes
)
1to
nnes
0300
00Su
stai
nabl
e ec
onom
ic
deve
lopm
ent
0302
00A
gric
ultu
re is
su
stai
nabl
e 03
0215
Vege
tabl
e pr
oduc
tion
is su
stai
nabl
e an
d effi
cien
t
0024
1%
of p
rodu
ctio
n lo
st p
ost h
arve
st
(veg
etab
le)
2%
cont
inue
d on
nex
t pag
e

An Outcome Classification System with Outcome Indicators 139
Code
Hig
h-Le
vel O
I G
roup
ing
Code
Leve
l 2 S
ecto
r OI
Gro
upin
gCo
deSu
b-ca
tego
ry
OI G
roup
ing
OI_
ID
(uni
que)
OI D
escr
iptio
nSD
G
Refe
renc
e
Targ
et
Max
or
Min
(2,1)
Uni
t of
mea
sure
Des
crip
tion
of ca
lcul
atio
n m
etho
dolo
gyTa
rget
2
016
Targ
et
201
7Ta
rget
2
018
Targ
et
201
9Ta
rget
2
030
12
34
56
78
910
1112
1314
1516
2803
0000
Sust
aina
ble
econ
omic
de
velo
pmen
t
0302
00A
gric
ultu
re is
su
stai
nabl
e 03
0215
Vege
tabl
e pr
oduc
tion
is su
stai
nabl
e an
d effi
cien
t
0023
9Es
timat
ed 5
year
av
erag
e of
the
ratio
- (r
even
ue
per t
onne
of
vege
tabl
es
harv
este
d/co
st p
er to
nne
of ve
geta
bles
pr
oduc
ed)
1ra
tio1
0300
00Su
stai
nabl
e ec
onom
ic
deve
lopm
ent
0302
00A
gric
ultu
re is
su
stai
nabl
e 03
0215
Vege
tabl
e pr
oduc
tion
is su
stai
nabl
e an
d effi
cien
t
0024
2To
nnes
pr
oduc
ed p
er
indu
stry
wor
ker
- veg
etab
les
1
0300
00Su
stai
nabl
e ec
onom
ic
deve
lopm
ent
0302
00A
gric
ultu
re is
su
stai
nabl
e 03
0215
Vege
tabl
e pr
oduc
tion
is su
stai
nabl
e an
d effi
cien
t
0024
0To
tal v
eget
able
pr
oduc
tion
(met
ric to
nnes
)
1to
nnes
0300
00Su
stai
nabl
e ec
onom
ic
deve
lopm
ent
0302
00A
gric
ultu
re is
su
stai
nabl
e 03
0216
Tom
ato
prod
uctio
n is
sust
aina
ble
and
effici
ent
0024
9%
of p
rodu
ctio
n lo
st p
ost h
arve
st
(tom
ato)
2%
0300
00Su
stai
nabl
e ec
onom
ic
deve
lopm
ent
0302
00A
gric
ultu
re is
su
stai
nabl
e 03
0216
Tom
ato
prod
uctio
n is
sust
aina
ble
and
effici
ent
0024
7Es
timat
ed 5
year
av
erag
e of
the
ratio
- (r
even
ue
per t
onne
of
tom
atoe
s ha
rves
ted/
cost
per
to
nne
of to
mat
oes
prod
uced
)
1ra
tio1
0300
00Su
stai
nabl
e ec
onom
ic
deve
lopm
ent
0302
00A
gric
ultu
re is
su
stai
nabl
e 03
0216
Tom
ato
prod
uctio
n is
sust
aina
ble
and
effici
ent
0025
0To
nnes
pro
duce
d pe
r ind
ustry
w
orke
r - to
mat
oes
1
0300
00Su
stai
nabl
e ec
onom
ic
deve
lopm
ent
0302
00A
gric
ultu
re is
su
stai
nabl
e 03
0216
Tom
ato
prod
uctio
n is
sust
aina
ble
and
effici
ent
0024
8To
tal t
omat
o pr
oduc
tion
(met
ric to
nnes
)
1to
nnes
0300
00Su
stai
nabl
e ec
onom
ic
deve
lopm
ent
0302
00A
gric
ultu
re is
su
stai
nabl
e 03
0217
Oni
on
prod
uctio
n is
sust
aina
ble
and
effici
ent
0025
5%
of p
rodu
ctio
n lo
st p
ost h
arve
st
(oni
on)
2%
cont
inue
d on
nex
t pag
e
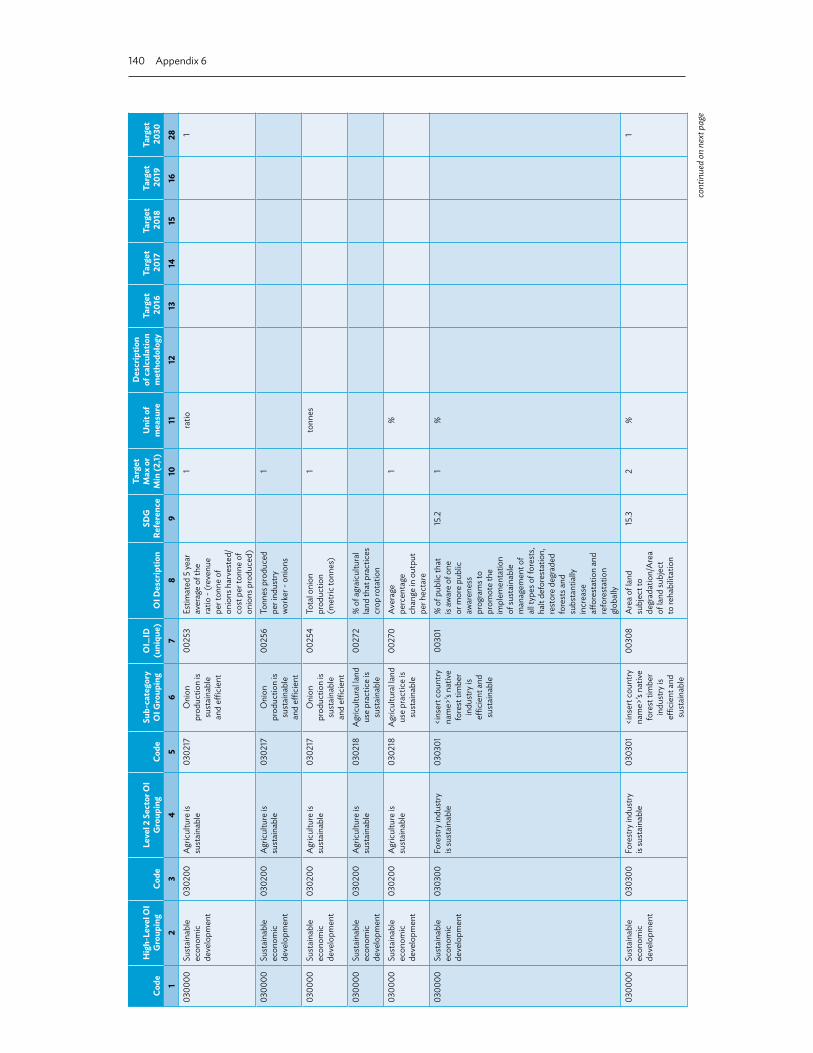
140 Appendix 6
Code
Hig
h-Le
vel O
I G
roup
ing
Code
Leve
l 2 S
ecto
r OI
Gro
upin
gCo
deSu
b-ca
tego
ry
OI G
roup
ing
OI_
ID
(uni
que)
OI D
escr
iptio
nSD
G
Refe
renc
e
Targ
et
Max
or
Min
(2,1)
Uni
t of
mea
sure
Des
crip
tion
of ca
lcul
atio
n m
etho
dolo
gyTa
rget
2
016
Targ
et
201
7Ta
rget
2
018
Targ
et
201
9Ta
rget
2
030
12
34
56
78
910
1112
1314
1516
2803
0000
Sust
aina
ble
econ
omic
de
velo
pmen
t
0302
00A
gric
ultu
re is
su
stai
nabl
e 03
0217
Oni
on
prod
uctio
n is
sust
aina
ble
and
effici
ent
0025
3Es
timat
ed 5
year
av
erag
e of
the
ratio
- (r
even
ue
per t
onne
of
onio
ns h
arve
sted
/co
st p
er to
nne
of
onio
ns p
rodu
ced)
1ra
tio1
0300
00Su
stai
nabl
e ec
onom
ic
deve
lopm
ent
0302
00A
gric
ultu
re is
su
stai
nabl
e 03
0217
Oni
on
prod
uctio
n is
sust
aina
ble
and
effici
ent
0025
6To
nnes
pro
duce
d pe
r ind
ustry
w
orke
r - o
nion
s
1
0300
00Su
stai
nabl
e ec
onom
ic
deve
lopm
ent
0302
00A
gric
ultu
re is
su
stai
nabl
e 03
0217
Oni
on
prod
uctio
n is
sust
aina
ble
and
effici
ent
0025
4To
tal o
nion
pr
oduc
tion
(met
ric to
nnes
)
1to
nnes
0300
00Su
stai
nabl
e ec
onom
ic
deve
lopm
ent
0302
00A
gric
ultu
re is
su
stai
nabl
e 03
0218
Agr
icul
tura
l land
us
e pr
actic
e is
sust
aina
ble
0027
2%
of a
grai
cultu
ral
land
that
pra
ctic
es
crop
rota
tion
0300
00Su
stai
nabl
e ec
onom
ic
deve
lopm
ent
0302
00A
gric
ultu
re is
su
stai
nabl
e 03
0218
Agr
icul
tura
l land
us
e pr
actic
e is
sust
aina
ble
0027
0Av
erag
e pe
rcen
tage
ch
ange
in o
utpu
t pe
r hec
tare
1%
0300
00Su
stai
nabl
e ec
onom
ic
deve
lopm
ent
0303
00Fo
rest
ry in
dust
ry
is su
stai
nabl
e 03
0301
<ins
ert c
ount
ry
nam
e>’s
nativ
e fo
rest
tim
ber
indu
stry
is
effici
ent a
nd
sust
aina
ble
0030
1%
of p
ublic
that
is
awar
e of
one
or
mor
e pu
blic
aw
aren
ess
prog
ram
s to
prom
ote
the
impl
emen
tatio
n of
sust
aina
ble
man
agem
ent o
f al
l typ
es o
f for
ests
, ha
lt de
fore
stat
ion,
re
stor
e de
grad
ed
fore
sts a
nd
subs
tant
ially
in
crea
se
affor
esta
tion
and
refo
rest
atio
n gl
obal
ly
15.2
1%
0300
00Su
stai
nabl
e ec
onom
ic
deve
lopm
ent
0303
00Fo
rest
ry in
dust
ry
is su
stai
nabl
e 03
0301
<ins
ert c
ount
ry
nam
e>’s
nativ
e fo
rest
tim
ber
indu
stry
is
effici
ent a
nd
sust
aina
ble
0030
8A
rea
of la
nd
subj
ect t
o de
grad
atio
n/A
rea
of la
nd su
bjec
t to
reha
bilit
atio
n
15.3
2%
1
cont
inue
d on
nex
t pag
e

An Outcome Classification System with Outcome Indicators 141
Code
Hig
h-Le
vel O
I G
roup
ing
Code
Leve
l 2 S
ecto
r OI
Gro
upin
gCo
deSu
b-ca
tego
ry
OI G
roup
ing
OI_
ID
(uni
que)
OI D
escr
iptio
nSD
G
Refe
renc
e
Targ
et
Max
or
Min
(2,1)
Uni
t of
mea
sure
Des
crip
tion
of ca
lcul
atio
n m
etho
dolo
gyTa
rget
2
016
Targ
et
201
7Ta
rget
2
018
Targ
et
201
9Ta
rget
2
030
12
34
56
78
910
1112
1314
1516
2803
0000
Sust
aina
ble
econ
omic
de
velo
pmen
t
0303
00Fo
rest
ry in
dust
ry
is su
stai
nabl
e 03
0301
<ins
ert c
ount
ry
nam
e>’s
nativ
e fo
rest
tim
ber
indu
stry
is
effici
ent a
nd
sust
aina
ble
0030
7Av
erag
e %
cha
nge
in n
atio
nal
degr
aded
land
an
d so
il are
as
(incl
udin
g lan
d aff
ecte
d by
de
serti
ficat
ion,
dr
ough
t and
flo
ods)
that
is
reha
bilit
ated
15.3
1%
1
0300
00Su
stai
nabl
e ec
onom
ic
deve
lopm
ent
0303
00Fo
rest
ry in
dust
ry
is su
stai
nabl
e 03
0301
<ins
ert c
ount
ry
nam
e>’s
nativ
e fo
rest
tim
ber
indu
stry
is
effici
ent a
nd
sust
aina
ble
0030
6Av
erag
e %
cha
nge
in n
atio
nal la
nd
area
s suff
erin
g de
serti
ficat
ion
15.3
2%
0
0300
00Su
stai
nabl
e ec
onom
ic
deve
lopm
ent
0303
00Fo
rest
ry in
dust
ry
is su
stai
nabl
e 03
0301
<ins
ert c
ount
ry
nam
e>’s
nativ
e fo
rest
tim
ber
indu
stry
is
effici
ent a
nd
sust
aina
ble
0030
3%
cha
nge
in
the
area
of
land
subj
ect t
o de
fore
stat
ion
15.2
2%
0300
00Su
stai
nabl
e ec
onom
ic
deve
lopm
ent
0303
00Fo
rest
ry in
dust
ry
is su
stai
nabl
e 03
0301
<ins
ert c
ount
ry
nam
e>’s
nativ
e fo
rest
tim
ber
indu
stry
is
effici
ent a
nd
sust
aina
ble
0030
2%
cha
nge
in th
e ar
ea o
f nat
ive
fore
sts (
km2)
15.2
1%
0300
00Su
stai
nabl
e ec
onom
ic
deve
lopm
ent
0303
00Fo
rest
ry in
dust
ry
is su
stai
nabl
e 03
0301
<ins
ert c
ount
ry
nam
e>’s
nativ
e fo
rest
tim
ber
indu
stry
is
effici
ent a
nd
sust
aina
ble
0030
4Av
erag
e %
ch
ange
in th
e na
tiona
l are
a of
la
nd su
bjec
t to
affor
esta
tion
and
refo
rest
atio
n
15.2
1%
0300
00Su
stai
nabl
e ec
onom
ic
deve
lopm
ent
0304
00Fi
shin
g ind
ustry
is
sust
aina
ble
0304
00G
ener
al00
322
‘000
met
ric
tonn
es o
f do
mes
tic fi
sh
prod
ucts
0300
00Su
stai
nabl
e ec
onom
ic
deve
lopm
ent
0304
00Fi
shin
g ind
ustry
is
sust
aina
ble
0304
00G
ener
al00
325
‘000
met
ric
tonn
es o
f fish
by
aqu
acul
ture
0300
00Su
stai
nabl
e ec
onom
ic
deve
lopm
ent
0304
00Fi
shin
g ind
ustry
is
sust
aina
ble
0304
00G
ener
al00
323
‘000
met
ric
tonn
es p
rodu
ced
by d
omes
tic
com
mer
cial
fis
herie
s
cont
inue
d on
nex
t pag
e

142 Appendix 6
Code
Hig
h-Le
vel O
I G
roup
ing
Code
Leve
l 2 S
ecto
r OI
Gro
upin
gCo
deSu
b-ca
tego
ry
OI G
roup
ing
OI_
ID
(uni
que)
OI D
escr
iptio
nSD
G
Refe
renc
e
Targ
et
Max
or
Min
(2,1)
Uni
t of
mea
sure
Des
crip
tion
of ca
lcul
atio
n m
etho
dolo
gyTa
rget
2
016
Targ
et
201
7Ta
rget
2
018
Targ
et
201
9Ta
rget
2
030
12
34
56
78
910
1112
1314
1516
2803
0000
Sust
aina
ble
econ
omic
de
velo
pmen
t
0304
00Fi
shin
g ind
ustry
is
sust
aina
ble
0304
00G
ener
al00
326
% c
hang
e in
offi
cial
fina
nce
sect
or lo
ans t
o fis
herm
en
0300
00Su
stai
nabl
e ec
onom
ic
deve
lopm
ent
0304
00Fi
shin
g ind
ustry
is
sust
aina
ble
0304
00G
ener
al00
318
Aver
age
inco
me
per w
orke
r (fis
hing
in
dust
ry)/
Med
ian
<ins
ert c
ount
ry
nam
e>n
inco
me
1Ra
tio
0300
00Su
stai
nabl
e ec
onom
ic
deve
lopm
ent
0304
00Fi
shin
g ind
ustry
is
sust
aina
ble
0304
00G
ener
al00
319
Fish
erie
s pr
oduc
tion
($) l
ost d
ue to
w
eath
er sy
stem
s
0300
00Su
stai
nabl
e ec
onom
ic
deve
lopm
ent
0304
00Fi
shin
g ind
ustry
is
sust
aina
ble
0304
00G
ener
al00
320
Gro
ss va
lue
adde
d by
fish
erie
s se
ctor
($)
0300
00Su
stai
nabl
e ec
onom
ic
deve
lopm
ent
0304
00Fi
shin
g ind
ustry
is
sust
aina
ble
0304
00G
ener
al00
321
Gro
ss va
lue
adde
d by
fish
ing (
$)
0300
00Su
stai
nabl
e ec
onom
ic
deve
lopm
ent
0304
00Fi
shin
g ind
ustry
is
sust
aina
ble
0304
01<i
nser
t cou
ntry
na
me>
’s de
ep
sea
fishi
ng
indu
stry
is
effici
ent a
nd
sust
aina
ble
0033
6Es
timat
ed 5
year
av
erag
e (r
even
ue
per t
onne
of o
cean
fis
h ha
rves
ted/
cost
pe
r ton
ne o
f oce
an
fish
prod
uced
)
1ra
tio1
0300
00Su
stai
nabl
e ec
onom
ic
deve
lopm
ent
0304
00Fi
shin
g ind
ustry
is
sust
aina
ble
0304
01<i
nser
t cou
ntry
na
me>
’s de
ep
sea
fishi
ng
indu
stry
is
effici
ent a
nd
sust
aina
ble
0033
5To
nnes
of
fish
harv
este
d (m
illion
) - O
cean
1%
0300
00Su
stai
nabl
e ec
onom
ic
deve
lopm
ent
0304
00Fi
shin
g ind
ustry
is
sust
aina
ble
0304
01<i
nser
t cou
ntry
na
me>
’s de
ep
sea
fishi
ng
indu
stry
is
effici
ent a
nd
sust
aina
ble
0136
3%
of t
otal
cat
ch
thro
ugh
IUU
de
vice
s
1%
0300
00Su
stai
nabl
e ec
onom
ic
deve
lopm
ent
0304
00Fi
shin
g ind
ustry
is
sust
aina
ble
0304
02<i
nser
t cou
ntry
na
me>
’s aq
uacu
lture
in
dust
ry if
effi
cien
t and
su
stai
nabl
e
0034
1Es
timat
ed 5
year
av
erag
e (r
even
ue
per t
onne
of
fish
harv
este
d by
aqu
acul
ture
/co
st p
er to
nne
of fi
sh h
arve
sted
by
aqu
acul
ture
)
1ra
tio1
cont
inue
d on
nex
t pag
e

An Outcome Classification System with Outcome Indicators 143
Code
Hig
h-Le
vel O
I G
roup
ing
Code
Leve
l 2 S
ecto
r OI
Gro
upin
gCo
deSu
b-ca
tego
ry
OI G
roup
ing
OI_
ID
(uni
que)
OI D
escr
iptio
nSD
G
Refe
renc
e
Targ
et
Max
or
Min
(2,1)
Uni
t of
mea
sure
Des
crip
tion
of ca
lcul
atio
n m
etho
dolo
gyTa
rget
2
016
Targ
et
201
7Ta
rget
2
018
Targ
et
201
9Ta
rget
2
030
12
34
56
78
910
1112
1314
1516
2803
0000
Sust
aina
ble
econ
omic
de
velo
pmen
t
0304
00Fi
shin
g ind
ustry
is
sust
aina
ble
0304
02<i
nser
t cou
ntry
na
me>
’s aq
uacu
lture
in
dust
ry if
effi
cien
t and
su
stai
nabl
e
0032
5‘0
00 m
etric
to
nnes
of fi
sh
by a
quac
ultu
re
1%
0300
00Su
stai
nabl
e ec
onom
ic
deve
lopm
ent
0304
00Fi
shin
g ind
ustry
is
sust
aina
ble
0304
02<i
nser
t cou
ntry
na
me>
’s aq
uacu
lture
in
dust
ry if
effi
cien
t and
su
stai
nabl
e
0136
6%
cha
nge
in
fish
prod
uced
by
aqu
acul
ture
pe
r aqu
acul
ture
w
orke
r
1%
0300
00Su
stai
nabl
e ec
onom
ic
deve
lopm
ent
0304
00Fi
shin
g ind
ustry
is
sust
aina
ble
0304
03<i
nser
t cou
ntry
na
me>
’s riv
er
fishi
ng in
dust
ry
is effi
cien
t and
su
stai
nabl
e
0034
6Es
timat
ed 5
year
av
erag
e of
the
ratio
- (re
venu
e pe
r ton
ne o
f riv
er
fish
harv
este
d/co
st
per t
onne
of r
iver
fis
h pr
oduc
ed)
1ra
tio1
0300
00Su
stai
nabl
e ec
onom
ic
deve
lopm
ent
0304
00Fi
shin
g ind
ustry
is
sust
aina
ble
0304
03<i
nser
t cou
ntry
na
me>
’s riv
er
fishi
ng in
dust
ry
is effi
cien
t and
su
stai
nabl
e
0034
5To
nnes
of
fish
harv
este
d (m
illion
) - ri
vers
1%
0300
00Su
stai
nabl
e ec
onom
ic
deve
lopm
ent
0304
00Fi
shin
g ind
ustry
is
sust
aina
ble
0304
04Se
awee
d in
dust
ry is
effi
cien
t and
su
stai
nabl
e
0035
3Es
timat
ed 5
year
av
erag
e of
the
ratio
- (r
even
ue
per t
onne
of
seaw
eed
prod
uced
/cos
t per
to
nne
of se
awee
d pr
oduc
ed)
1ra
tio1
0300
00Su
stai
nabl
e ec
onom
ic
deve
lopm
ent
0304
00Fi
shin
g ind
ustry
is
sust
aina
ble
0304
04Se
awee
d in
dust
ry is
effi
cien
t and
su
stai
nabl
e
0035
2To
nnes
of
seaw
eed
harv
este
d
1%
0300
00Su
stai
nabl
e ec
onom
ic
deve
lopm
ent
0305
00Su
stai
nabl
e an
d effi
cien
t en
ergy
sect
or
0305
00G
ener
al00
368
% c
hang
e in
num
ber
of te
chni
cal
assis
tanc
e pr
ojec
ts
in th
e en
ergy
se
ctor
del
iver
ed
to d
evel
opin
g co
untri
es
7.b1
%1
cont
inue
d on
nex
t pag
e

144 Appendix 6
Code
Hig
h-Le
vel O
I G
roup
ing
Code
Leve
l 2 S
ecto
r OI
Gro
upin
gCo
deSu
b-ca
tego
ry
OI G
roup
ing
OI_
ID
(uni
que)
OI D
escr
iptio
nSD
G
Refe
renc
e
Targ
et
Max
or
Min
(2,1)
Uni
t of
mea
sure
Des
crip
tion
of ca
lcul
atio
n m
etho
dolo
gyTa
rget
2
016
Targ
et
201
7Ta
rget
2
018
Targ
et
201
9Ta
rget
2
030
12
34
56
78
910
1112
1314
1516
2803
0000
Sust
aina
ble
econ
omic
de
velo
pmen
t
0305
00Su
stai
nabl
e an
d effi
cien
t en
ergy
sect
or
0305
00G
ener
al00
359
% c
hang
e in
the
aver
age
natio
nal
ener
gy e
ffici
ency
(H
ow to
mea
sure
“e
ffici
ency
”?
7.31
%99
.9
0300
00Su
stai
nabl
e ec
onom
ic
deve
lopm
ent
0305
00Su
stai
nabl
e an
d effi
cien
t en
ergy
sect
or
0305
00G
ener
al00
365
% o
f hou
seho
lds
who
se e
nerg
y su
pply
suffe
rs a
n av
erag
e of
0.5
or
mor
e in
terru
ptio
ns
per m
onth
to a
t le
ast o
ne u
rban
ce
nter
with
a
popu
latio
n ov
er
10,0
00 p
erso
ns
7.12
%10
0300
00Su
stai
nabl
e ec
onom
ic
deve
lopm
ent
0305
00Su
stai
nabl
e an
d effi
cien
t en
ergy
sect
or
0305
00G
ener
al00
360
% o
f hou
seho
lds
with
uni
vers
al
acce
ss to
“m
oder
n” e
nerg
y se
rvic
es (H
ow to
de
fine
“mod
ern”
?)
7.11
%99
.9
0300
00Su
stai
nabl
e ec
onom
ic
deve
lopm
ent
0305
00Su
stai
nabl
e an
d effi
cien
t en
ergy
sect
or
0305
00G
ener
al00
362
% o
f hou
seho
lds
with
uni
vers
al
acce
ss to
aff
orda
ble
ener
gy se
rvic
es
(How
to d
efine
“a
fford
able
”?)
7.11
%99
.9
0300
00Su
stai
nabl
e ec
onom
ic
deve
lopm
ent
0305
00Su
stai
nabl
e an
d effi
cien
t en
ergy
sect
or
0305
00G
ener
al00
363
% o
f hou
seho
lds
with
uni
vers
al
acce
ss to
en
ergy
serv
ices
, w
here
aver
age
cons
umpt
ion
cost
s les
s tha
n 20
% o
f the
av
erag
e w
age
7.11
%99
.9
0300
00Su
stai
nabl
e ec
onom
ic
deve
lopm
ent
0305
00Su
stai
nabl
e an
d effi
cien
t en
ergy
sect
or
0305
00G
ener
al00
361
% o
f hou
seho
lds
with
uni
vers
al
acce
ss to
ne
twor
ked
ener
gy se
rvic
es
7.11
%99
.9
cont
inue
d on
nex
t pag
e

An Outcome Classification System with Outcome Indicators 145
Code
Hig
h-Le
vel O
I G
roup
ing
Code
Leve
l 2 S
ecto
r OI
Gro
upin
gCo
deSu
b-ca
tego
ry
OI G
roup
ing
OI_
ID
(uni
que)
OI D
escr
iptio
nSD
G
Refe
renc
e
Targ
et
Max
or
Min
(2,1)
Uni
t of
mea
sure
Des
crip
tion
of ca
lcul
atio
n m
etho
dolo
gyTa
rget
2
016
Targ
et
201
7Ta
rget
2
018
Targ
et
201
9Ta
rget
2
030
12
34
56
78
910
1112
1314
1516
2803
0000
Sust
aina
ble
econ
omic
de
velo
pmen
t
0305
00Su
stai
nabl
e an
d effi
cien
t en
ergy
sect
or
0305
00G
ener
al00
364
% o
f hou
seho
lds
with
uni
vers
al
acce
ss to
relia
ble
ener
gy se
rvic
es
(How
to d
efine
“r
elia
ble”
?)
7.11
%99
.9
0300
00Su
stai
nabl
e ec
onom
ic
deve
lopm
ent
0305
00Su
stai
nabl
e an
d effi
cien
t en
ergy
sect
or
0305
00G
ener
al00
374
% o
f nat
iona
l co
nsum
ptio
n of
foss
il-fu
el
subs
idize
d by
go
vern
men
t
12.c
2%
.000
01
0300
00Su
stai
nabl
e ec
onom
ic
deve
lopm
ent
0305
00Su
stai
nabl
e an
d effi
cien
t en
ergy
sect
or
0305
00G
ener
al00
366
Aver
age
% c
hang
e in
gros
s pub
lic
expe
nditu
re
tow
ard
Uni
ted
Nat
ions
CO
FOG
04
.3, E
nger
gy
7.a1
%1
0300
00Su
stai
nabl
e ec
onom
ic
deve
lopm
ent
0305
00Su
stai
nabl
e an
d effi
cien
t en
ergy
sect
or
0305
00G
ener
al00
369
Aver
age
% c
hang
e in
the
annu
al
kilo
wat
ts p
er h
ead
of p
opul
atio
n of
en
ergy
gene
rate
d
7.b1
%1
0300
00Su
stai
nabl
e ec
onom
ic
deve
lopm
ent
0305
00Su
stai
nabl
e an
d effi
cien
t en
ergy
sect
or
0305
00G
ener
al00
367
Aver
age
% c
hang
e in
the
prop
ortio
n of
glob
al e
nerg
y de
man
d so
urce
d fro
m re
new
able
en
ergy
gene
ratio
n fa
cilit
ies.
7.a1
%1
0300
00Su
stai
nabl
e ec
onom
ic
deve
lopm
ent
0305
00Su
stai
nabl
e an
d effi
cien
t en
ergy
sect
or
0305
00G
ener
al00
358
Aver
age
% sh
are
of
rene
wab
le e
nerg
y in
nat
iona
l ene
rgy
cons
umpt
ion
7.21
%10
0300
00Su
stai
nabl
e ec
onom
ic
deve
lopm
ent
0305
00Su
stai
nabl
e an
d effi
cien
t en
ergy
sect
or
0305
00G
ener
al00
370
Num
ber o
f ki
low
atts
co
nsum
ed p
er
head
of p
opul
atio
n pe
r yea
r
1Ki
low
atts
pe
r per
son
0300
00Su
stai
nabl
e ec
onom
ic
deve
lopm
ent
0305
00Su
stai
nabl
e an
d effi
cien
t en
ergy
sect
or
0305
00G
ener
al01
378
% c
hang
e in
oi
l and
gas
expl
orat
ion
in
<ins
ert c
ount
ry
nam
e>’s
terri
tory
cont
inue
d on
nex
t pag
e

146 Appendix 6
Code
Hig
h-Le
vel O
I G
roup
ing
Code
Leve
l 2 S
ecto
r OI
Gro
upin
gCo
deSu
b-ca
tego
ry
OI G
roup
ing
OI_
ID
(uni
que)
OI D
escr
iptio
nSD
G
Refe
renc
e
Targ
et
Max
or
Min
(2,1)
Uni
t of
mea
sure
Des
crip
tion
of ca
lcul
atio
n m
etho
dolo
gyTa
rget
2
016
Targ
et
201
7Ta
rget
2
018
Targ
et
201
9Ta
rget
2
030
12
34
56
78
910
1112
1314
1516
2803
0000
Sust
aina
ble
econ
omic
de
velo
pmen
t
0305
00Su
stai
nabl
e an
d effi
cien
t en
ergy
sect
or
0305
01Effi
cien
t oil
prod
uctio
n an
d co
nsum
ptio
n
0038
1%
of a
nnua
l co
nsum
ptio
n th
at
is su
bsid
ized
2%
0300
00Su
stai
nabl
e ec
onom
ic
deve
lopm
ent
0305
00Su
stai
nabl
e an
d effi
cien
t en
ergy
sect
or
0305
01Effi
cien
t oil
prod
uctio
n an
d co
nsum
ptio
n
0038
2%
of a
nnua
l pr
oduc
tion
that
is
prot
ecte
d by
tarri
fs
2%
0300
00Su
stai
nabl
e ec
onom
ic
deve
lopm
ent
0305
00Su
stai
nabl
e an
d effi
cien
t en
ergy
sect
or
0305
01Effi
cien
t oil
prod
uctio
n an
d co
nsum
ptio
n
0038
0A
nnua
l dom
estic
gr
oss o
il pr
oduc
tion
as a
%
of gr
oss d
omes
tic
oil d
eman
d
1%
0300
00Su
stai
nabl
e ec
onom
ic
deve
lopm
ent
0305
00Su
stai
nabl
e an
d effi
cien
t en
ergy
sect
or
0305
01Effi
cien
t oil
prod
uctio
n an
d co
nsum
ptio
n
0037
9A
nnua
l oil
prod
uctio
n (b
illion
s of b
arre
ls)
1nu
mbe
r bi
llioin
ba
rrels
of o
il
0300
00Su
stai
nabl
e ec
onom
ic
deve
lopm
ent
0305
00Su
stai
nabl
e an
d effi
cien
t en
ergy
sect
or
0305
02Effi
cien
t gas
pr
oduc
tion
and
cons
umpt
ion
0038
1%
of a
nnua
l co
nsum
ptio
n th
at
is su
bsid
ized
2%
0300
00Su
stai
nabl
e ec
onom
ic
deve
lopm
ent
0305
00Su
stai
nabl
e an
d effi
cien
t en
ergy
sect
or
0305
02Effi
cien
t gas
pr
oduc
tion
and
cons
umpt
ion
0038
2%
of a
nnua
l pr
oduc
tion
that
is
prot
ecte
d by
tarri
fs
2%
0300
00Su
stai
nabl
e ec
onom
ic
deve
lopm
ent
0305
00Su
stai
nabl
e an
d effi
cien
t en
ergy
sect
or
0305
02Effi
cien
t gas
pr
oduc
tion
and
cons
umpt
ion
0038
6A
nnua
l dom
estic
ga
s pro
duct
ion
as
a %
of d
omes
tic
gas d
eman
d
1%
0300
00Su
stai
nabl
e ec
onom
ic
deve
lopm
ent
0305
00Su
stai
nabl
e an
d effi
cien
t en
ergy
sect
or
0305
02Effi
cien
t gas
pr
oduc
tion
and
cons
umpt
ion
0038
5A
nnua
l gas
pr
oduc
tion
(ter
ajou
le)
1N
umbe
r te
rajo
ule
of ga
s
0300
00Su
stai
nabl
e ec
onom
ic
deve
lopm
ent
0305
00Su
stai
nabl
e an
d effi
cien
t en
ergy
sect
or
0305
02Effi
cien
t gas
pr
oduc
tion
and
cons
umpt
ion
0138
7%
of h
ouse
hold
s co
nnec
ted
to
gas p
ipel
ine
1%
0300
00Su
stai
nabl
e ec
onom
ic
deve
lopm
ent
0305
00Su
stai
nabl
e an
d effi
cien
t en
ergy
sect
or
0305
02Effi
cien
t gas
pr
oduc
tion
and
cons
umpt
ion
0138
8%
of g
as
cons
umer
s who
su
ffer o
n or
mor
e in
terru
ptio
n to
th
eir s
uppl
y of g
as
2%
0300
00Su
stai
nabl
e ec
onom
ic
deve
lopm
ent
0305
00Su
stai
nabl
e an
d effi
cien
t en
ergy
sect
or
0305
03Effi
cien
t coa
l pr
oduc
tion
and
cons
umpt
ion
0038
1%
of a
nnua
l co
nsum
ptio
n th
at
is su
bsid
ized
2%
cont
inue
d on
nex
t pag
e

An Outcome Classification System with Outcome Indicators 147
Code
Hig
h-Le
vel O
I G
roup
ing
Code
Leve
l 2 S
ecto
r OI
Gro
upin
gCo
deSu
b-ca
tego
ry
OI G
roup
ing
OI_
ID
(uni
que)
OI D
escr
iptio
nSD
G
Refe
renc
e
Targ
et
Max
or
Min
(2,1)
Uni
t of
mea
sure
Des
crip
tion
of ca
lcul
atio
n m
etho
dolo
gyTa
rget
2
016
Targ
et
201
7Ta
rget
2
018
Targ
et
201
9Ta
rget
2
030
12
34
56
78
910
1112
1314
1516
2803
0000
Sust
aina
ble
econ
omic
de
velo
pmen
t
0305
00Su
stai
nabl
e an
d effi
cien
t en
ergy
sect
or
0305
03Effi
cien
t coa
l pr
oduc
tion
and
cons
umpt
ion
0038
2%
of a
nnua
l pr
oduc
tion
that
is
prot
ecte
d by
tarri
fs
2%
0300
00Su
stai
nabl
e ec
onom
ic
deve
lopm
ent
0305
00Su
stai
nabl
e an
d effi
cien
t en
ergy
sect
or
0305
03Effi
cien
t coa
l pr
oduc
tion
and
cons
umpt
ion
0039
4A
nnua
l gro
ss
dom
estic
pr
oduc
tion
of
coal
as a
% o
f gr
oss d
omes
tic
coal
dem
and
0300
00Su
stai
nabl
e ec
onom
ic
deve
lopm
ent
0305
00Su
stai
nabl
e an
d effi
cien
t en
ergy
sect
or
0305
03Effi
cien
t coa
l pr
oduc
tion
and
cons
umpt
ion
0039
3A
nnua
l pro
duct
ion
of th
erm
al c
oal
0300
00Su
stai
nabl
e ec
onom
ic
deve
lopm
ent
0305
00Su
stai
nabl
e an
d effi
cien
t en
ergy
sect
or
0305
04Su
stai
nabl
e re
new
able
en
ergy
indu
stry
0039
8%
of t
otal
ene
rgy
supp
lied
by
geot
herm
al
sour
ces
0300
00Su
stai
nabl
e ec
onom
ic
deve
lopm
ent
0305
00Su
stai
nabl
e an
d effi
cien
t en
ergy
sect
or
0305
04Su
stai
nabl
e re
new
able
en
ergy
indu
stry
0040
1%
of t
otal
en
ergy
supp
lied
thro
ugh
hydr
o el
ectri
c en
ergy
0300
00Su
stai
nabl
e ec
onom
ic
deve
lopm
ent
0305
00Su
stai
nabl
e an
d effi
cien
t en
ergy
sect
or
0305
04Su
stai
nabl
e re
new
able
en
ergy
indu
stry
0039
9%
of t
otal
ene
rgy
supp
lied
thro
ugh
sola
r ene
rgy
0300
00Su
stai
nabl
e ec
onom
ic
deve
lopm
ent
0305
00Su
stai
nabl
e an
d effi
cien
t en
ergy
sect
or
0305
04Su
stai
nabl
e re
new
able
en
ergy
indu
stry
0040
0%
of t
otal
ene
rgy
supp
lied
thro
ugh
win
d en
ergy
0300
00Su
stai
nabl
e ec
onom
ic
deve
lopm
ent
0305
00Su
stai
nabl
e an
d effi
cien
t en
ergy
sect
or
0305
05Su
stai
nabl
e an
d effi
cien
t el
ectri
city
in
dust
ry
0139
2%
of h
ouse
hold
s co
nnec
ted
to
the
natio
nal
elec
trici
ty gr
id
0300
00Su
stai
nabl
e ec
onom
ic
deve
lopm
ent
0305
00Su
stai
nabl
e an
d effi
cien
t en
ergy
sect
or
0305
05Su
stai
nabl
e an
d effi
cien
t el
ectri
city
in
dust
ry
0139
3%
of h
ouse
hold
s co
nnec
ted
to
a pr
ovin
cial
el
ectri
city
grid
0300
00Su
stai
nabl
e ec
onom
ic
deve
lopm
ent
0305
00Su
stai
nabl
e an
d effi
cien
t en
ergy
sect
or
0305
05Su
stai
nabl
e an
d effi
cien
t el
ectri
city
in
dust
ry
0139
4Av
erag
e %
of
hous
ehol
ds
with
in a
loca
l gr
id c
onne
cted
to
the
loca
l el
ectri
city
grid
0300
00Su
stai
nabl
e ec
onom
ic
deve
lopm
ent
0305
00Su
stai
nabl
e an
d effi
cien
t en
ergy
sect
or
0305
05Su
stai
nabl
e an
d effi
cien
t el
ectri
city
in
dust
ry
0139
5Av
erag
e co
st
per k
ilow
att
of e
lect
ricity
de
liver
ed b
y na
tiona
l grid
cont
inue
d on
nex
t pag
e

148 Appendix 6
Code
Hig
h-Le
vel O
I G
roup
ing
Code
Leve
l 2 S
ecto
r OI
Gro
upin
gCo
deSu
b-ca
tego
ry
OI G
roup
ing
OI_
ID
(uni
que)
OI D
escr
iptio
nSD
G
Refe
renc
e
Targ
et
Max
or
Min
(2,1)
Uni
t of
mea
sure
Des
crip
tion
of ca
lcul
atio
n m
etho
dolo
gyTa
rget
2
016
Targ
et
201
7Ta
rget
2
018
Targ
et
201
9Ta
rget
2
030
12
34
56
78
910
1112
1314
1516
2803
0000
Sust
aina
ble
econ
omic
de
velo
pmen
t
0305
00Su
stai
nabl
e an
d effi
cien
t en
ergy
sect
or
0305
05Su
stai
nabl
e an
d effi
cien
t el
ectri
city
in
dust
ry
0139
6Av
erag
e co
st
per k
ilow
att
of e
lect
ricty
de
liver
ed b
y pr
ovin
cial
grid
s
0300
00Su
stai
nabl
e ec
onom
ic
deve
lopm
ent
0305
00Su
stai
nabl
e an
d effi
cien
t en
ergy
sect
or
0305
05Su
stai
nabl
e an
d effi
cien
t el
ectri
city
in
dust
ry
0139
7Av
erag
e co
st
per k
ilow
att
of e
lect
riict
y de
liver
ed b
y lo
cal g
rids
0300
00Su
stai
nabl
e ec
onom
ic
deve
lopm
ent
0305
00Su
stai
nabl
e an
d effi
cien
t en
ergy
sect
or
0305
05Su
stai
nabl
e an
d effi
cien
t el
ectri
city
in
dust
ry
0142
9%
of n
atio
nal
netw
ork
cust
omer
s who
su
ffer o
ne o
r m
ore
outa
ges
of o
ne h
our
0300
00Su
stai
nabl
e ec
onom
ic
deve
lopm
ent
0306
00Su
stai
nabl
e an
d effi
cien
t min
ing
indu
stry
0306
01Su
stai
nabl
e an
d effi
cien
t gol
d pr
oduc
tion
0040
9A
rea
of la
nd
reha
bilit
ated
as
a %
of a
rea
of d
isuse
d go
ld
min
ing s
ites
0300
00Su
stai
nabl
e ec
onom
ic
deve
lopm
ent
0306
00Su
stai
nabl
e an
d effi
cien
t min
ing
indu
stry
0306
01Su
stai
nabl
e an
d effi
cien
t gol
d pr
oduc
tion
0040
8To
nnes
of g
old
prod
uced
0300
00Su
stai
nabl
e ec
onom
ic
deve
lopm
ent
0307
00Su
stai
nabl
e an
d effi
cien
t m
anuf
actu
ring s
ecto
r
0307
00G
ener
al00
424
Valu
e of
m
erch
andi
se
expo
rts ($
)
1$
0300
00Su
stai
nabl
e ec
onom
ic
deve
lopm
ent
0307
00Su
stai
nabl
e an
d effi
cien
t m
anuf
actu
ring s
ecto
r
0307
00G
ener
al01
412
Impo
rts/T
otal
Co
nsum
ptio
n2
ratio
0300
00Su
stai
nabl
e ec
onom
ic
deve
lopm
ent
0308
00Su
stai
nabl
e an
d effi
cien
t se
rvic
es se
ctor
0308
00G
ener
al00
436
% c
hang
e in
em
ploy
men
t in
serv
ices
sect
or
1%
0300
00Su
stai
nabl
e ec
onom
ic
deve
lopm
ent
0308
00Su
stai
nabl
e an
d effi
cien
t se
rvic
es se
ctor
0308
00G
ener
al00
435
Gro
ss va
lue
adde
d in
serv
ices
se
ctor
(%)
1%
0300
00Su
stai
nabl
e ec
onom
ic
deve
lopm
ent
0308
00Su
stai
nabl
e an
d effi
cien
t se
rvic
es se
ctor
0308
00G
ener
al00
433
Gro
wth
in se
rvic
es
outp
ut (%
)1
%
0300
00Su
stai
nabl
e ec
onom
ic
deve
lopm
ent
0308
00Su
stai
nabl
e an
d effi
cien
t se
rvic
es se
ctor
0308
00G
ener
al00
434
Valu
e of
serv
ices
ex
ports
(USD
)1
$
cont
inue
d on
nex
t pag
e

An Outcome Classification System with Outcome Indicators 149
Code
Hig
h-Le
vel O
I G
roup
ing
Code
Leve
l 2 S
ecto
r OI
Gro
upin
gCo
deSu
b-ca
tego
ry
OI G
roup
ing
OI_
ID
(uni
que)
OI D
escr
iptio
nSD
G
Refe
renc
e
Targ
et
Max
or
Min
(2,1)
Uni
t of
mea
sure
Des
crip
tion
of ca
lcul
atio
n m
etho
dolo
gyTa
rget
2
016
Targ
et
201
7Ta
rget
2
018
Targ
et
201
9Ta
rget
2
030
12
34
56
78
910
1112
1314
1516
2803
0000
Sust
aina
ble
econ
omic
de
velo
pmen
t
0308
00Su
stai
nabl
e an
d effi
cien
t se
rvic
es se
ctor
0308
01Fi
nanc
ial
mar
kets
0044
2%
cha
nge
in
tota
l ass
ets o
f ba
nkin
g sec
tor
0300
00Su
stai
nabl
e ec
onom
ic
deve
lopm
ent
0308
00Su
stai
nabl
e an
d effi
cien
t se
rvic
es se
ctor
0308
01Fi
nanc
ial
mar
kets
0044
3%
cha
nge
in
tota
l ass
ets o
f no
nban
king
fin
anci
al
inst
itutio
ns
0300
00Su
stai
nabl
e ec
onom
ic
deve
lopm
ent
0308
00Su
stai
nabl
e an
d effi
cien
t se
rvic
es se
ctor
0308
01Fi
nanc
ial
mar
kets
0044
9%
of d
eriv
ativ
e in
stru
men
t tra
des
that
are
settl
ed
thro
ugh
an
auto
mat
ed m
arke
t se
ttlem
ent s
yste
m
0300
00Su
stai
nabl
e ec
onom
ic
deve
lopm
ent
0308
00Su
stai
nabl
e an
d effi
cien
t se
rvic
es se
ctor
0308
01Fi
nanc
ial
mar
kets
0044
0%
of r
emitt
ance
co
rrido
rs w
ith
cost
s hig
her
than
5 p
er c
ent
10.c
2%
.000
1
0300
00Su
stai
nabl
e ec
onom
ic
deve
lopm
ent
0308
00Su
stai
nabl
e an
d effi
cien
t se
rvic
es se
ctor
0308
01Fi
nanc
ial
mar
kets
0044
5Av
erag
e nu
mbe
r of
ban
k offi
ces
per c
ity
0300
00Su
stai
nabl
e ec
onom
ic
deve
lopm
ent
0308
00Su
stai
nabl
e an
d effi
cien
t se
rvic
es se
ctor
0308
01Fi
nanc
ial
mar
kets
0044
6Av
erag
e nu
mbe
r of
ban
k offi
ces
per p
rovi
nce
0300
00Su
stai
nabl
e ec
onom
ic
deve
lopm
ent
0308
00Su
stai
nabl
e an
d effi
cien
t se
rvic
es se
ctor
0308
01Fi
nanc
ial
mar
kets
0043
9Av
erag
e tra
nsac
tion
cost
s fo
r rem
ittan
ces
as a
% o
f am
ount
tra
nsfe
rred
10.c
2%
3
0300
00Su
stai
nabl
e ec
onom
ic
deve
lopm
ent
0308
00Su
stai
nabl
e an
d effi
cien
t se
rvic
es se
ctor
0308
01Fi
nanc
ial
mar
kets
0044
8Fa
ce va
lue
of d
eriv
ativ
e in
stru
men
ts
trade
d an
nual
ly
0300
00Su
stai
nabl
e ec
onom
ic
deve
lopm
ent
0308
00Su
stai
nabl
e an
d effi
cien
t se
rvic
es se
ctor
0308
01Fi
nanc
ial
mar
kets
0044
1G
ettin
g cre
dit
rank
ing o
n th
e W
orld
wid
e G
over
nace
In
dica
tor o
f the
W
orld
Ban
k
0300
00Su
stai
nabl
e ec
onom
ic
deve
lopm
ent
0308
00Su
stai
nabl
e an
d effi
cien
t se
rvic
es se
ctor
0308
01Fi
nanc
ial
mar
kets
0044
7N
umbe
r of d
epos
it ac
coun
ts p
er
100,
000
resid
ents
0300
00Su
stai
nabl
e ec
onom
ic
deve
lopm
ent
0308
00Su
stai
nabl
e an
d effi
cien
t se
rvic
es se
ctor
0308
01Fi
nanc
ial
mar
kets
0001
9Ra
tio o
f gro
ss
natio
nal s
avin
g to
GD
P as
a %
cont
inue
d on
nex
t pag
e

150 Appendix 6
Code
Hig
h-Le
vel O
I G
roup
ing
Code
Leve
l 2 S
ecto
r OI
Gro
upin
gCo
deSu
b-ca
tego
ry
OI G
roup
ing
OI_
ID
(uni
que)
OI D
escr
iptio
nSD
G
Refe
renc
e
Targ
et
Max
or
Min
(2,1)
Uni
t of
mea
sure
Des
crip
tion
of ca
lcul
atio
n m
etho
dolo
gyTa
rget
2
016
Targ
et
201
7Ta
rget
2
018
Targ
et
201
9Ta
rget
2
030
12
34
56
78
910
1112
1314
1516
2803
0000
Sust
aina
ble
econ
omic
de
velo
pmen
t
0309
00Su
stai
nabl
e an
d effi
cien
t co
nstru
ctio
n se
ctor
0309
00G
ener
al01
436
0300
00Su
stai
nabl
e ec
onom
ic
deve
lopm
ent
0309
00Su
stai
nabl
e an
d effi
cien
t co
nstru
ctio
n se
ctor
0309
01Re
siden
tial
cons
truct
ion
0144
0
0300
00Su
stai
nabl
e ec
onom
ic
deve
lopm
ent
0309
00Su
stai
nabl
e an
d effi
cien
t co
nstru
ctio
n se
ctor
0309
02Co
mm
erci
al
build
ing a
nd
cons
truct
ion
0144
7
0300
00Su
stai
nabl
e ec
onom
ic
deve
lopm
ent
0310
00Su
stai
nabl
e an
d effi
cien
t roa
d tra
nspo
rt se
ctor
0310
00G
ener
al00
477
Aver
age
% c
hang
e in
the
num
ber o
f in
jurie
s fro
m ro
ad
traffi
c ac
cide
nts
3.6
2%
0300
00Su
stai
nabl
e ec
onom
ic
deve
lopm
ent
0310
00Su
stai
nabl
e an
d effi
cien
t roa
d tra
nspo
rt se
ctor
0310
00G
ener
al00
478
Aver
age
% c
hang
e in
the
num
ber o
f tra
ffic
inci
dent
s
11.2
2%
-99.
9
0300
00Su
stai
nabl
e ec
onom
ic
deve
lopm
ent
0310
00Su
stai
nabl
e an
d effi
cien
t roa
d tra
nspo
rt se
ctor
0310
00G
ener
al00
476
Aver
age
% c
hang
e th
e nu
mbe
r of
deat
hs fr
om ro
ad
traffi
c ac
cide
nts
3.6
2%
0300
00Su
stai
nabl
e ec
onom
ic
deve
lopm
ent
0310
00Su
stai
nabl
e an
d effi
cien
t roa
d tra
nspo
rt se
ctor
0310
01Pu
blic
pas
seng
er
trans
port
0048
5%
cha
nge
in
the
num
ber
of p
asse
nger
ki
lom
etre
s de
liver
ed b
y pu
blic
tran
spor
t
11.2
1%
1
0300
00Su
stai
nabl
e ec
onom
ic
deve
lopm
ent
0310
00Su
stai
nabl
e an
d effi
cien
t roa
d tra
nspo
rt se
ctor
0310
01Pu
blic
pas
seng
er
trans
port
0049
1A
nnua
l num
ber o
f pa
ssen
gers
car
ried
- pub
lic tr
ansp
ort
0300
00Su
stai
nabl
e ec
onom
ic
deve
lopm
ent
0310
00Su
stai
nabl
e an
d effi
cien
t roa
d tra
nspo
rt se
ctor
0310
01Pu
blic
pas
seng
er
trans
port
0048
4Av
erag
e %
ch
ange
in c
ost
per p
asse
nger
ki
lom
etre
on
publ
ic tr
ansp
ort/
Aver
age
wee
kly w
age
11.2
2%
1
0300
00Su
stai
nabl
e ec
onom
ic
deve
lopm
ent
0310
00Su
stai
nabl
e an
d effi
cien
t roa
d tra
nspo
rt se
ctor
0310
01Pu
blic
pas
seng
er
trans
port
0048
3Av
erag
e %
cha
nge
in th
e co
st (r
eal)
per p
asse
nger
ki
lom
etre
on
publ
ic tr
ansp
ort
11.2
2%
-1
cont
inue
d on
nex
t pag
e
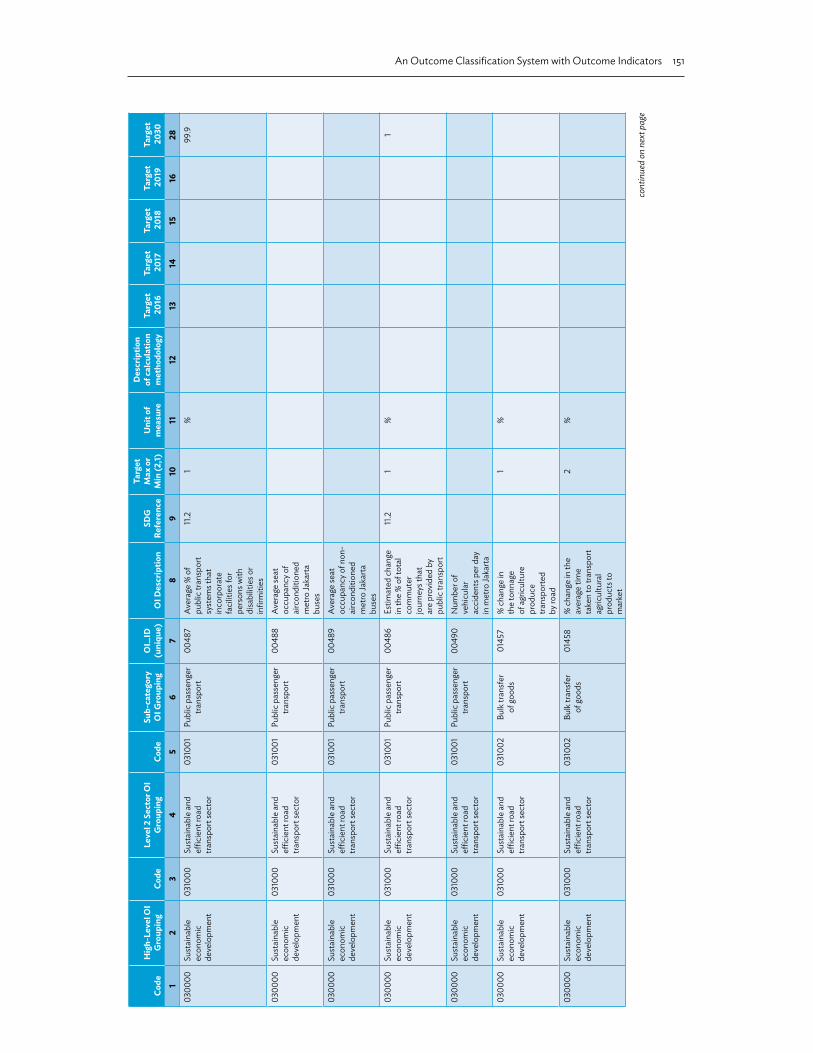
An Outcome Classification System with Outcome Indicators 151
Code
Hig
h-Le
vel O
I G
roup
ing
Code
Leve
l 2 S
ecto
r OI
Gro
upin
gCo
deSu
b-ca
tego
ry
OI G
roup
ing
OI_
ID
(uni
que)
OI D
escr
iptio
nSD
G
Refe
renc
e
Targ
et
Max
or
Min
(2,1)
Uni
t of
mea
sure
Des
crip
tion
of ca
lcul
atio
n m
etho
dolo
gyTa
rget
2
016
Targ
et
201
7Ta
rget
2
018
Targ
et
201
9Ta
rget
2
030
12
34
56
78
910
1112
1314
1516
2803
0000
Sust
aina
ble
econ
omic
de
velo
pmen
t
0310
00Su
stai
nabl
e an
d effi
cien
t roa
d tra
nspo
rt se
ctor
0310
01Pu
blic
pas
seng
er
trans
port
0048
7Av
erag
e %
of
publ
ic tr
ansp
ort
syst
ems t
hat
inco
rpor
ate
faci
litie
s for
pe
rson
s with
di
sabi
litie
s or
infir
miti
es
11.2
1%
99.9
0300
00Su
stai
nabl
e ec
onom
ic
deve
lopm
ent
0310
00Su
stai
nabl
e an
d effi
cien
t roa
d tra
nspo
rt se
ctor
0310
01Pu
blic
pas
seng
er
trans
port
0048
8Av
erag
e se
at
occu
panc
y of
airc
ondi
tione
d m
etro
Jaka
rta
buse
s
0300
00Su
stai
nabl
e ec
onom
ic
deve
lopm
ent
0310
00Su
stai
nabl
e an
d effi
cien
t roa
d tra
nspo
rt se
ctor
0310
01Pu
blic
pas
seng
er
trans
port
0048
9Av
erag
e se
at
occu
panc
y of n
on-
airc
ondi
tione
d m
etro
Jaka
rta
buse
s
0300
00Su
stai
nabl
e ec
onom
ic
deve
lopm
ent
0310
00Su
stai
nabl
e an
d effi
cien
t roa
d tra
nspo
rt se
ctor
0310
01Pu
blic
pas
seng
er
trans
port
0048
6Es
timat
ed c
hang
e in
the
% o
f tot
al
com
mut
er
jour
neys
that
ar
e pr
ovid
ed b
y pu
blic
tran
spor
t
11.2
1%
1
0300
00Su
stai
nabl
e ec
onom
ic
deve
lopm
ent
0310
00Su
stai
nabl
e an
d effi
cien
t roa
d tra
nspo
rt se
ctor
0310
01Pu
blic
pas
seng
er
trans
port
0049
0N
umbe
r of
vehi
cula
r ac
cide
nts p
er d
ay
in m
etro
Jaka
rta
0300
00Su
stai
nabl
e ec
onom
ic
deve
lopm
ent
0310
00Su
stai
nabl
e an
d effi
cien
t roa
d tra
nspo
rt se
ctor
0310
02Bu
lk tr
ansf
er
of go
ods
0145
7%
cha
nge
in
the
tonn
age
of a
gric
ultu
re
prod
uce
trans
porte
d by
road
1%
0300
00Su
stai
nabl
e ec
onom
ic
deve
lopm
ent
0310
00Su
stai
nabl
e an
d effi
cien
t roa
d tra
nspo
rt se
ctor
0310
02Bu
lk tr
ansf
er
of go
ods
0145
8%
cha
nge
in th
e av
erag
e tim
e ta
ken
to tr
ansp
ort
agric
ultu
ral
prod
ucts
to
mar
ket
2%
cont
inue
d on
nex
t pag
e

152 Appendix 6
Code
Hig
h-Le
vel O
I G
roup
ing
Code
Leve
l 2 S
ecto
r OI
Gro
upin
gCo
deSu
b-ca
tego
ry
OI G
roup
ing
OI_
ID
(uni
que)
OI D
escr
iptio
nSD
G
Refe
renc
e
Targ
et
Max
or
Min
(2,1)
Uni
t of
mea
sure
Des
crip
tion
of ca
lcul
atio
n m
etho
dolo
gyTa
rget
2
016
Targ
et
201
7Ta
rget
2
018
Targ
et
201
9Ta
rget
2
030
12
34
56
78
910
1112
1314
1516
2803
0000
Sust
aina
ble
econ
omic
de
velo
pmen
t
0311
00Su
stai
nabl
e an
d effi
cien
t mar
itim
e tra
nspo
rt se
ctor
0311
01<i
nser
t cou
ntry
na
me>
n se
afar
ers a
re
high
ly re
gard
ed
0050
6%
cha
nge
in th
e to
tal n
umbe
r of
<ins
ert c
ount
ry
nam
e>n
seaf
arer
s em
ploy
ed
dom
estic
ally
and
in
tern
atio
nally
1%
0300
00Su
stai
nabl
e ec
onom
ic
deve
lopm
ent
0311
00Su
stai
nabl
e an
d effi
cien
t mar
itim
e tra
nspo
rt se
ctor
0311
02<i
nser
t cou
ntry
na
me>
n se
a po
rts a
re c
ost
effici
ent a
nd
sust
aina
ble
0051
4%
cha
nge
in th
e to
nnes
of c
argo
tra
nssh
ippi
ng
thro
ugh
<ins
ert
coun
try n
ame>
n se
a po
rts
1%
0300
00Su
stai
nabl
e ec
onom
ic
deve
lopm
ent
0311
00Su
stai
nabl
e an
d effi
cien
t mar
itim
e tra
nspo
rt se
ctor
0311
02<i
nser
t cou
ntry
na
me>
n se
a po
rts a
re c
ost
effici
ent a
nd
sust
aina
ble
0051
3%
of p
orts
with
se
a co
ntai
ner
unlo
adin
g rat
es o
f 25
con
tain
ers p
er
hour
or b
ette
r.
1%
0300
00Su
stai
nabl
e ec
onom
ic
deve
lopm
ent
0311
00Su
stai
nabl
e an
d effi
cien
t mar
itim
e tra
nspo
rt se
ctor
0311
02<i
nser
t cou
ntry
na
me>
n se
a po
rts a
re c
ost
effici
ent a
nd
sust
aina
ble
0052
0Av
erag
e be
rth
times
per
ship
2da
ys
0300
00Su
stai
nabl
e ec
onom
ic
deve
lopm
ent
0311
00Su
stai
nabl
e an
d effi
cien
t mar
itim
e tra
nspo
rt se
ctor
0311
02<i
nser
t cou
ntry
na
me>
n se
a po
rts a
re c
ost
effici
ent a
nd
sust
aina
ble
0052
1Av
erag
e be
rth
times
per
ship
to
nnag
e
2da
ys/to
nne
0300
00Su
stai
nabl
e ec
onom
ic
deve
lopm
ent
0311
00Su
stai
nabl
e an
d effi
cien
t mar
itim
e tra
nspo
rt se
ctor
0311
02<i
nser
t cou
ntry
na
me>
n se
a po
rts a
re c
ost
effici
ent a
nd
sust
aina
ble
0051
8Av
erag
e co
ntai
ner d
wel
l tim
es a
t <in
sert
coun
try n
ame>
’s co
ntai
ner p
orts
2da
ys
0300
00Su
stai
nabl
e ec
onom
ic
deve
lopm
ent
0311
00Su
stai
nabl
e an
d effi
cien
t mar
itim
e tra
nspo
rt se
ctor
0311
02<i
nser
t cou
ntry
na
me>
n se
a po
rts a
re c
ost
effici
ent a
nd
sust
aina
ble
0051
7Av
erag
e nu
mbe
r of
vess
el w
aitin
g da
ys a
t <in
sert
coun
try n
ame>
n se
a po
rts
2da
ys
0300
00Su
stai
nabl
e ec
onom
ic
deve
lopm
ent
0311
00Su
stai
nabl
e an
d effi
cien
t mar
itim
e tra
nspo
rt se
ctor
0311
02<i
nser
t cou
ntry
na
me>
n se
a po
rts a
re c
ost
effici
ent a
nd
sust
aina
ble
0052
2Av
erag
e po
rt sh
ip
serv
icin
g tim
e2
days
cont
inue
d on
nex
t pag
e

An Outcome Classification System with Outcome Indicators 153
Code
Hig
h-Le
vel O
I G
roup
ing
Code
Leve
l 2 S
ecto
r OI
Gro
upin
gCo
deSu
b-ca
tego
ry
OI G
roup
ing
OI_
ID
(uni
que)
OI D
escr
iptio
nSD
G
Refe
renc
e
Targ
et
Max
or
Min
(2,1)
Uni
t of
mea
sure
Des
crip
tion
of ca
lcul
atio
n m
etho
dolo
gyTa
rget
2
016
Targ
et
201
7Ta
rget
2
018
Targ
et
201
9Ta
rget
2
030
12
34
56
78
910
1112
1314
1516
2803
0000
Sust
aina
ble
econ
omic
de
velo
pmen
t
0311
00Su
stai
nabl
e an
d effi
cien
t mar
itim
e tra
nspo
rt se
ctor
0311
02<i
nser
t cou
ntry
na
me>
n se
a po
rts a
re c
ost
effici
ent a
nd
sust
aina
ble
0052
4Av
erag
e tim
e lo
st
wai
ting f
or b
erth
(w
aitin
g lay
time)
2da
ys
0300
00Su
stai
nabl
e ec
onom
ic
deve
lopm
ent
0311
00Su
stai
nabl
e an
d effi
cien
t mar
itim
e tra
nspo
rt se
ctor
0311
02<i
nser
t cou
ntry
na
me>
n se
a po
rts a
re c
ost
effici
ent a
nd
sust
aina
ble
0051
5M
etric
tons
(m
illion
) tra
nsiti
ng
<ins
ert c
ount
ry
nam
e>’s
ports
1to
ns
(milli
on)
0300
00Su
stai
nabl
e ec
onom
ic
deve
lopm
ent
0311
00Su
stai
nabl
e an
d effi
cien
t mar
itim
e tra
nspo
rt se
ctor
0311
02<i
nser
t cou
ntry
na
me>
n se
a po
rts a
re c
ost
effici
ent a
nd
sust
aina
ble
0051
6N
umbe
r of
pass
enge
rs
(milli
ons)
tra
nsiti
ng <
inse
rt co
untry
nam
e>’s
sea
ports
1pe
ople
(m
illion
s)
0300
00Su
stai
nabl
e ec
onom
ic
deve
lopm
ent
0311
00Su
stai
nabl
e an
d effi
cien
t mar
itim
e tra
nspo
rt se
ctor
0311
02<i
nser
t cou
ntry
na
me>
n se
a po
rts a
re c
ost
effici
ent a
nd
sust
aina
ble
0051
9Va
rianc
e in
por
t dw
ell t
imes
2da
ys
0300
00Su
stai
nabl
e ec
onom
ic
deve
lopm
ent
0311
00Su
stai
nabl
e an
d effi
cien
t mar
itim
e tra
nspo
rt se
ctor
0311
02<i
nser
t cou
ntry
na
me>
n se
a po
rts a
re c
ost
effici
ent a
nd
sust
aina
ble
0052
3Va
rianc
e in
por
t sh
ip se
rvic
ing
times
2da
ys
0300
00Su
stai
nabl
e ec
onom
ic
deve
lopm
ent
0311
00Su
stai
nabl
e an
d effi
cien
t mar
itim
e tra
nspo
rt se
ctor
0311
02<i
nser
t cou
ntry
na
me>
n se
a po
rts a
re c
ost
effici
ent a
nd
sust
aina
ble
0052
5Va
rianc
e in
por
t w
aitin
g lay
times
2da
ys
0300
00Su
stai
nabl
e ec
onom
ic
deve
lopm
ent
0311
00Su
stai
nabl
e an
d effi
cien
t mar
itim
e tra
nspo
rt se
ctor
0311
03<i
nser
t cou
ntry
na
me>
sea
lane
s are
hig
hly
rega
rded
for
thei
r saf
ety
and
effici
ency
0052
8%
cha
nge
in th
e nu
mbe
r of s
hips
us
ing <
inse
rt co
untry
nam
e>’s
sea
lane
s
1%
0300
00Su
stai
nabl
e ec
onom
ic
deve
lopm
ent
0311
00Su
stai
nabl
e an
d effi
cien
t mar
itim
e tra
nspo
rt se
ctor
0311
03<i
nser
t cou
ntry
na
me>
sea
lane
s are
hig
hly
rega
rded
for
thei
r saf
ety
and
effici
ency
0052
9Av
erag
e co
ntai
ner
ship
trav
ellin
g sp
eed
in <
inse
rt co
untry
nam
e>’s
sea
lane
s
cont
inue
d on
nex
t pag
e

154 Appendix 6
Code
Hig
h-Le
vel O
I G
roup
ing
Code
Leve
l 2 S
ecto
r OI
Gro
upin
gCo
deSu
b-ca
tego
ry
OI G
roup
ing
OI_
ID
(uni
que)
OI D
escr
iptio
nSD
G
Refe
renc
e
Targ
et
Max
or
Min
(2,1)
Uni
t of
mea
sure
Des
crip
tion
of ca
lcul
atio
n m
etho
dolo
gyTa
rget
2
016
Targ
et
201
7Ta
rget
2
018
Targ
et
201
9Ta
rget
2
030
12
34
56
78
910
1112
1314
1516
2803
0000
Sust
aina
ble
econ
omic
de
velo
pmen
t
0312
00Su
stai
nabl
e an
d effi
cien
t avi
atio
n tra
nspo
rt se
ctor
0312
00G
ener
al00
536
% o
f flig
hts a
rrivi
ng
and
depa
rting
w
ithin
10 m
inut
es
of sc
hedu
led
arriv
al a
nd
depa
rture
tim
es
1%
0300
00Su
stai
nabl
e ec
onom
ic
deve
lopm
ent
0312
00Su
stai
nabl
e an
d effi
cien
t avi
atio
n tra
nspo
rt se
ctor
0312
01D
omes
tic
airp
orts
0054
4Av
erag
e w
aitin
g tim
e - l
andi
ngs
dom
estic
airp
orts
0300
00Su
stai
nabl
e ec
onom
ic
deve
lopm
ent
0312
00Su
stai
nabl
e an
d effi
cien
t avi
atio
n tra
nspo
rt se
ctor
0312
01D
omes
tic
airp
orts
0054
5Av
erag
e w
aitin
g tim
e - t
akeo
ffs
dom
estic
airp
orts
0300
00Su
stai
nabl
e ec
onom
ic
deve
lopm
ent
0312
00Su
stai
nabl
e an
d effi
cien
t avi
atio
n tra
nspo
rt se
ctor
0312
01D
omes
tic
airp
orts
0054
3N
umbe
r of
take
offs a
nd
land
ings
- D
omes
tic
0300
00Su
stai
nabl
e ec
onom
ic
deve
lopm
ent
0312
00Su
stai
nabl
e an
d effi
cien
t avi
atio
n tra
nspo
rt se
ctor
0312
02In
tern
atio
nal
airp
orts
0055
0Av
erag
e w
aitin
g tim
e - l
andi
ngs
inte
rnat
iona
l ai
rpor
ts
0300
00Su
stai
nabl
e ec
onom
ic
deve
lopm
ent
0312
00Su
stai
nabl
e an
d effi
cien
t avi
atio
n tra
nspo
rt se
ctor
0312
02In
tern
atio
nal
airp
orts
0055
1Av
erag
e w
aitin
g tim
e - t
akeo
ffs
inte
rnat
iona
l ai
rpor
ts
0300
00Su
stai
nabl
e ec
onom
ic
deve
lopm
ent
0312
00Su
stai
nabl
e an
d effi
cien
t avi
atio
n tra
nspo
rt se
ctor
0312
02In
tern
atio
nal
airp
orts
0054
9N
umbe
r of
take
offs a
nd
land
ings
- in
tern
atio
nal
0300
00Su
stai
nabl
e ec
onom
ic
deve
lopm
ent
0312
00Su
stai
nabl
e an
d effi
cien
t avi
atio
n tra
nspo
rt se
ctor
0312
03In
tern
atio
nal
carg
o tra
nspo
rt00
554
Tota
l car
go
(tho
usan
d to
nnes
) sh
ippe
d th
roug
h in
tern
atio
nal
airp
orts
0300
00Su
stai
nabl
e ec
onom
ic
deve
lopm
ent
0312
00Su
stai
nabl
e an
d effi
cien
t avi
atio
n tra
nspo
rt se
ctor
0312
04D
omes
tic c
argo
tra
nspo
rt00
558
Tota
l car
go
(tho
usan
d to
nnes
) sh
ippe
d th
roug
h do
mes
tic a
irpor
ts
0300
00Su
stai
nabl
e ec
onom
ic
deve
lopm
ent
0312
00Su
stai
nabl
e an
d effi
cien
t avi
atio
n tra
nspo
rt se
ctor
0312
05D
omes
tic
pass
enge
r tra
nspo
rt
0056
2N
umbe
r of
pass
enge
rs
trans
iting
do
mes
tic a
irpor
ts
cont
inue
d on
nex
t pag
e

An Outcome Classification System with Outcome Indicators 155
Code
Hig
h-Le
vel O
I G
roup
ing
Code
Leve
l 2 S
ecto
r OI
Gro
upin
gCo
deSu
b-ca
tego
ry
OI G
roup
ing
OI_
ID
(uni
que)
OI D
escr
iptio
nSD
G
Refe
renc
e
Targ
et
Max
or
Min
(2,1)
Uni
t of
mea
sure
Des
crip
tion
of ca
lcul
atio
n m
etho
dolo
gyTa
rget
2
016
Targ
et
201
7Ta
rget
2
018
Targ
et
201
9Ta
rget
2
030
12
34
56
78
910
1112
1314
1516
2803
0000
Sust
aina
ble
econ
omic
de
velo
pmen
t
0312
00Su
stai
nabl
e an
d effi
cien
t avi
atio
n tra
nspo
rt se
ctor
0312
06In
tern
atio
nal
pass
enge
r tra
nspo
rt
0056
8N
umbe
r of
pass
enge
rs
trans
iting
in
tern
atio
nal
airp
orts
0300
00Su
stai
nabl
e ec
onom
ic
deve
lopm
ent
0313
00Su
stai
nabl
e an
d effi
cien
t rai
lway
tra
nspo
rt se
ctor
0313
01Ec
onom
ic a
nd
envi
ronm
enta
lly
effici
ent
inte
rcity
pa
ssen
ger
serv
ices
0153
7
0300
00Su
stai
nabl
e ec
onom
ic
deve
lopm
ent
0313
00Su
stai
nabl
e an
d effi
cien
t rai
lway
tra
nspo
rt se
ctor
0313
02Ec
onom
ic a
nd
envi
ronm
enta
lly
effici
ent
met
ropo
litan
pa
ssen
ger
serv
ices
0153
8
0300
00Su
stai
nabl
e ec
onom
ic
deve
lopm
ent
0313
00Su
stai
nabl
e an
d effi
cien
t rai
lway
tra
nspo
rt se
ctor
0313
03Ec
onom
ic a
nd
envi
ronm
enta
lly
effici
ent b
ulk
freig
ht tr
ansp
ort
serv
ices
0153
9
0300
00Su
stai
nabl
e ec
onom
ic
deve
lopm
ent
0313
00Su
stai
nabl
e an
d effi
cien
t rai
lway
tra
nspo
rt se
ctor
0313
03Ec
onom
ic a
nd
envi
ronm
enta
lly
effici
ent b
ulk
freig
ht tr
ansp
ort
serv
ices
0154
0
0300
00Su
stai
nabl
e ec
onom
ic
deve
lopm
ent
0314
00Effi
cien
t and
su
stai
nabl
e te
leco
mm
unic
atio
ns
sect
or
0314
01Effi
cien
t and
su
stai
nabl
e in
tern
et
conn
ectiv
ity
0057
6Av
erag
e co
ntin
uous
do
wnl
oad
spee
d (m
b/se
cond
)
0300
00Su
stai
nabl
e ec
onom
ic
deve
lopm
ent
0314
00Effi
cien
t and
su
stai
nabl
e te
leco
mm
unic
atio
ns
sect
or
0314
01Effi
cien
t and
su
stai
nabl
e in
tern
et
conn
ectiv
ity
0057
5Av
erag
e co
ntin
uous
up
load
spee
d (m
b/se
cond
)
0300
00Su
stai
nabl
e ec
onom
ic
deve
lopm
ent
0314
00Effi
cien
t and
su
stai
nabl
e te
leco
mm
unic
atio
ns
sect
or
0314
01Effi
cien
t and
su
stai
nabl
e in
tern
et
conn
ectiv
ity
0057
7N
umbe
r of
broa
dban
d su
bscr
iptio
ns p
er
100
resid
ents
0300
00Su
stai
nabl
e ec
onom
ic
deve
lopm
ent
0314
00Effi
cien
t and
su
stai
nabl
e te
leco
mm
unic
atio
ns
sect
or
0314
01Effi
cien
t and
su
stai
nabl
e in
tern
et
conn
ectiv
ity
0057
8N
umbe
r of
fixed
bro
adba
nd
subs
crip
tions
cont
inue
d on
nex
t pag
e

156 Appendix 6
Code
Hig
h-Le
vel O
I G
roup
ing
Code
Leve
l 2 S
ecto
r OI
Gro
upin
gCo
deSu
b-ca
tego
ry
OI G
roup
ing
OI_
ID
(uni
que)
OI D
escr
iptio
nSD
G
Refe
renc
e
Targ
et
Max
or
Min
(2,1)
Uni
t of
mea
sure
Des
crip
tion
of ca
lcul
atio
n m
etho
dolo
gyTa
rget
2
016
Targ
et
201
7Ta
rget
2
018
Targ
et
201
9Ta
rget
2
030
12
34
56
78
910
1112
1314
1516
2803
0000
Sust
aina
ble
econ
omic
de
velo
pmen
t
0314
00Effi
cien
t and
su
stai
nabl
e te
leco
mm
unic
atio
ns
sect
or
0314
01Effi
cien
t and
su
stai
nabl
e in
tern
et
conn
ectiv
ity
0057
9N
umbe
r of
mob
ile b
road
band
su
bscr
iptio
ns
0300
00Su
stai
nabl
e ec
onom
ic
deve
lopm
ent
0314
00Effi
cien
t and
su
stai
nabl
e te
leco
mm
unic
atio
ns
sect
or
0314
02Effi
cien
t and
su
stai
nabl
e vo
ice
tele
phon
y se
rvic
es
0059
1%
of m
unic
ipal
ities
w
ith a
t lea
st 9
5%
of th
eir l
and
area
ac
cess
ible
by
mob
ile te
leph
one
0300
00Su
stai
nabl
e ec
onom
ic
deve
lopm
ent
0314
00Effi
cien
t and
su
stai
nabl
e te
leco
mm
unic
atio
ns
sect
or
0314
02Effi
cien
t and
su
stai
nabl
e vo
ice
tele
phon
y se
rvic
es
0059
2%
of m
unic
ipal
ities
w
ith a
t lea
st 9
9%
of th
eir l
and
area
ac
cess
ible
by
mob
ile te
leph
one
0300
00Su
stai
nabl
e ec
onom
ic
deve
lopm
ent
0315
00Su
stai
nabl
e to
urism
sect
or
0315
00G
ener
al00
599
% c
hang
e in
the
$ eq
uiva
lent
of
dono
r pro
vide
d te
chnc
ial
assis
tanc
e in
to
urism
1%
0300
00Su
stai
nabl
e ec
onom
ic
deve
lopm
ent
0315
00Su
stai
nabl
e to
urism
sect
or
0315
00G
ener
al01
525
0300
00Su
stai
nabl
e ec
onom
ic
deve
lopm
ent
0315
00Su
stai
nabl
e to
urism
sect
or
0315
00G
ener
al01
526
0300
00Su
stai
nabl
e ec
onom
ic
deve
lopm
ent
0315
00Su
stai
nabl
e to
urism
sect
or
0315
00G
ener
al01
527
0300
00Su
stai
nabl
e ec
onom
ic
deve
lopm
ent
0315
00Su
stai
nabl
e to
urism
sect
or
0315
00G
ener
al01
528
0300
00Su
stai
nabl
e ec
onom
ic
deve
lopm
ent
0315
00Su
stai
nabl
e to
urism
sect
or
0315
00G
ener
al01
529
0300
00Su
stai
nabl
e ec
onom
ic
deve
lopm
ent
0315
00Su
stai
nabl
e to
urism
sect
or
0315
01D
omes
tic
Tour
ism00
606
% o
f dom
estic
to
urist
s un
derta
king
ec
o-to
urs
1%
0300
00Su
stai
nabl
e ec
onom
ic
deve
lopm
ent
0315
00Su
stai
nabl
e to
urism
sect
or
0315
01D
omes
tic
Tour
ism00
605
% o
f dom
estic
to
urist
s who
w
ould
reco
mm
end
<ins
ert c
ount
ry
nam
e> a
s a fi
rst
tour
ist d
estin
atio
n to
thei
r frie
nds
1%
cont
inue
d on
nex
t pag
e

An Outcome Classification System with Outcome Indicators 157
Code
Hig
h-Le
vel O
I G
roup
ing
Code
Leve
l 2 S
ecto
r OI
Gro
upin
gCo
deSu
b-ca
tego
ry
OI G
roup
ing
OI_
ID
(uni
que)
OI D
escr
iptio
nSD
G
Refe
renc
e
Targ
et
Max
or
Min
(2,1)
Uni
t of
mea
sure
Des
crip
tion
of ca
lcul
atio
n m
etho
dolo
gyTa
rget
2
016
Targ
et
201
7Ta
rget
2
018
Targ
et
201
9Ta
rget
2
030
12
34
56
78
910
1112
1314
1516
2803
0000
Sust
aina
ble
econ
omic
de
velo
pmen
t
0315
00Su
stai
nabl
e to
urism
sect
or
0315
02In
tern
atio
nal I
n-bo
und
Tour
ism00
611
% C
hang
e in
th
e nu
mbe
r of
tour
ist a
rriva
ls
1%
0300
00Su
stai
nabl
e ec
onom
ic
deve
lopm
ent
0315
00Su
stai
nabl
e to
urism
sect
or
0315
02In
tern
atio
nal I
n-bo
und
Tour
ism00
613
% o
f int
erna
tiona
l to
urist
s un
derta
king
ec
o-to
urs
1%
0300
00Su
stai
nabl
e ec
onom
ic
deve
lopm
ent
0315
00Su
stai
nabl
e to
urism
sect
or
0315
02In
tern
atio
nal I
n-bo
und
Tour
ism00
612
% o
f int
erna
tiona
l to
urist
s who
w
ould
reco
mm
end
<ins
ert c
ount
ry
nam
e> a
s a to
urist
de
stin
atio
n to
th
eir f
riend
s
1%
0300
00Su
stai
nabl
e ec
onom
ic
deve
lopm
ent
0315
00Su
stai
nabl
e to
urism
sect
or
0315
02In
tern
atio
nal I
n-bo
und
Tour
ism00
615
Estim
ated
va
lue
of vi
sitor
sp
endi
ng ($
)
1$
0300
00Su
stai
nabl
e ec
onom
ic
deve
lopm
ent
0315
00Su
stai
nabl
e to
urism
sect
or
0315
02In
tern
atio
nal I
n-bo
und
Tour
ism00
614
Num
ber o
f an
nual
visit
or
arriv
als t
o <i
nser
t co
untry
nam
e>
1Pe
ople
0300
00Su
stai
nabl
e ec
onom
ic
deve
lopm
ent
0316
00Co
mpe
titiv
e la
bor m
arke
t03
1600
Gen
eral
0061
8%
of n
atio
ns w
ith
who
m <
inse
rt co
untry
nam
e>
has e
xecu
ted
a st
rate
gy to
ad
dres
s you
th
unem
ploy
men
t
1%
0300
00Su
stai
nabl
e ec
onom
ic
deve
lopm
ent
0316
00Co
mpe
titiv
e la
bor m
arke
t03
1600
Gen
eral
0062
1G
DP
grow
th ra
te
(rea
l)/Po
pula
tion
grow
th ra
te
1Ra
tio1
0300
00Su
stai
nabl
e ec
onom
ic
deve
lopm
ent
0316
00Co
mpe
titiv
e la
bor m
arke
t03
1600
Gen
eral
0062
0Pe
r cap
ita G
DP
($)
0300
00Su
stai
nabl
e ec
onom
ic
deve
lopm
ent
0316
00Co
mpe
titiv
e la
bor m
arke
t03
1600
Gen
eral
0001
1Pr
ivat
e in
vest
men
t ex
pend
iture
as
a %
of G
DP
1%
0300
00Su
stai
nabl
e ec
onom
ic
deve
lopm
ent
0316
00Co
mpe
titiv
e la
bor m
arke
t03
1600
Gen
eral
0004
5Ra
nkin
g of <
inse
rt co
untry
nam
e>
in th
e G
loba
l Co
mpe
titiv
enes
s In
dex o
f the
W
orld
Eco
nom
ic
Foru
m (W
EF)
cont
inue
d on
nex
t pag
e

158 Appendix 6
Code
Hig
h-Le
vel O
I G
roup
ing
Code
Leve
l 2 S
ecto
r OI
Gro
upin
gCo
deSu
b-ca
tego
ry
OI G
roup
ing
OI_
ID
(uni
que)
OI D
escr
iptio
nSD
G
Refe
renc
e
Targ
et
Max
or
Min
(2,1)
Uni
t of
mea
sure
Des
crip
tion
of ca
lcul
atio
n m
etho
dolo
gyTa
rget
2
016
Targ
et
201
7Ta
rget
2
018
Targ
et
201
9Ta
rget
2
030
12
34
56
78
910
1112
1314
1516
2804
0000
Sust
aina
ble
envi
ronm
enta
l us
e an
d de
velo
pmen
t
0400
00G
ener
al04
0100
0063
6%
cha
nge
in
the
num
ber o
f in
tern
atio
nal
coop
erat
ion
and
capa
city
-bui
ldin
g su
ppor
t pro
ject
s in
des
alin
atio
n
6.a
1%
1
0400
00Su
stai
nabl
e en
viro
nmen
tal
use
and
deve
lopm
ent
0400
00G
ener
al04
0100
0063
9%
cha
nge
in
the
num
ber o
f in
tern
atio
nal
coop
erat
ion
and
capa
city
-bui
ldin
g su
ppor
t pro
ject
s in
recy
clin
g and
re
use
tech
nolo
gies
6.a
1%
1
0400
00Su
stai
nabl
e en
viro
nmen
tal
use
and
deve
lopm
ent
0400
00G
ener
al04
0100
0063
4%
cha
nge
in
the
num
ber o
f in
tern
atio
nal
coop
erat
ion
and
capa
city
-bui
ldin
g su
ppor
t pro
ject
s in
sani
tatio
n
6.a
1%
1
0400
00Su
stai
nabl
e en
viro
nmen
tal
use
and
deve
lopm
ent
0400
00G
ener
al04
0100
0063
3%
cha
nge
in
the
num
ber o
f in
tern
atio
nal
coop
erat
ion
and
capa
city
-bui
ldin
g su
ppor
t pro
ject
s in
the
wat
er se
ctor
6.a
1%
1
0400
00Su
stai
nabl
e en
viro
nmen
tal
use
and
deve
lopm
ent
0400
00G
ener
al04
0100
0063
8%
cha
nge
in
the
num
ber o
f in
tern
atio
nal
coop
erat
ion
and
capa
city
-bui
ldin
g su
ppor
t pro
ject
s in
was
tew
ater
tre
atm
ent
6.a
1%
1
0400
00Su
stai
nabl
e en
viro
nmen
tal
use
and
deve
lopm
ent
0400
00G
ener
al04
0100
0063
7%
cha
nge
in
the
num
ber o
f in
tern
atio
nal
coop
erat
ion
and
capa
city
-bui
ldin
g su
ppor
t pro
ject
s in
wat
er e
ffici
ency
6.a
1%
1
cont
inue
d on
nex
t pag
e

An Outcome Classification System with Outcome Indicators 159
Code
Hig
h-Le
vel O
I G
roup
ing
Code
Leve
l 2 S
ecto
r OI
Gro
upin
gCo
deSu
b-ca
tego
ry
OI G
roup
ing
OI_
ID
(uni
que)
OI D
escr
iptio
nSD
G
Refe
renc
e
Targ
et
Max
or
Min
(2,1)
Uni
t of
mea
sure
Des
crip
tion
of ca
lcul
atio
n m
etho
dolo
gyTa
rget
2
016
Targ
et
201
7Ta
rget
2
018
Targ
et
201
9Ta
rget
2
030
12
34
56
78
910
1112
1314
1516
2804
0000
Sust
aina
ble
envi
ronm
enta
l us
e an
d de
velo
pmen
t
0400
00G
ener
al04
0100
0063
5%
cha
nge
in
the
num
ber o
f in
tern
atio
nal
coop
erat
ion
and
capa
city
-bui
ldin
g su
ppor
t pro
ject
s in
wat
er h
arve
stin
g
6.a
1%
1
0400
00Su
stai
nabl
e en
viro
nmen
tal
use
and
deve
lopm
ent
0400
00G
ener
al04
0100
0064
7%
of h
uman
de
velo
pmen
ts
in d
istin
ctly
id
entifi
ed
natu
ral h
abita
ts
that
pro
vide
s fo
r sym
biot
ic
rela
tions
hips
be
twee
n th
reat
ened
sp
ecie
s and
thei
r hu
man
nei
ghbo
urs
15.c
1%
0400
00Su
stai
nabl
e en
viro
nmen
tal
use
and
deve
lopm
ent
0400
00G
ener
al04
0100
0064
0%
of l
ocal
co
mm
uniti
es
with
equ
ity
stak
es in
wat
er
and
sani
tatio
n m
anag
emen
t se
rvic
es in
thei
r lo
cal a
rea
6.b
1%
99.9
0400
00Su
stai
nabl
e en
viro
nmen
tal
use
and
deve
lopm
ent
0400
00G
ener
al04
0100
0064
4%
of p
eopl
e su
rvey
ed th
at a
re
awar
e of
one
or
mor
e of
the
issue
s fo
r sus
tain
able
de
velo
pmen
t an
d lif
esty
les i
n ha
rmon
y with
na
ture
(the
re m
ust
be a
stan
dard
lis
t use
d ac
ross
al
l cou
ntrie
s)
12.8
1%
0400
00Su
stai
nabl
e en
viro
nmen
tal
use
and
deve
lopm
ent
0400
00G
ener
al04
0100
0064
5%
of p
eopl
e su
rvey
ed th
at
are
awar
e of
one
or
mor
e pu
blic
in
form
atio
n an
d aw
aren
ess
prog
ram
s for
su
stai
nabl
e de
velo
pmen
t an
d lif
esty
les
in h
arm
ony
with
nat
ure
12.8
1%
cont
inue
d on
nex
t pag
e
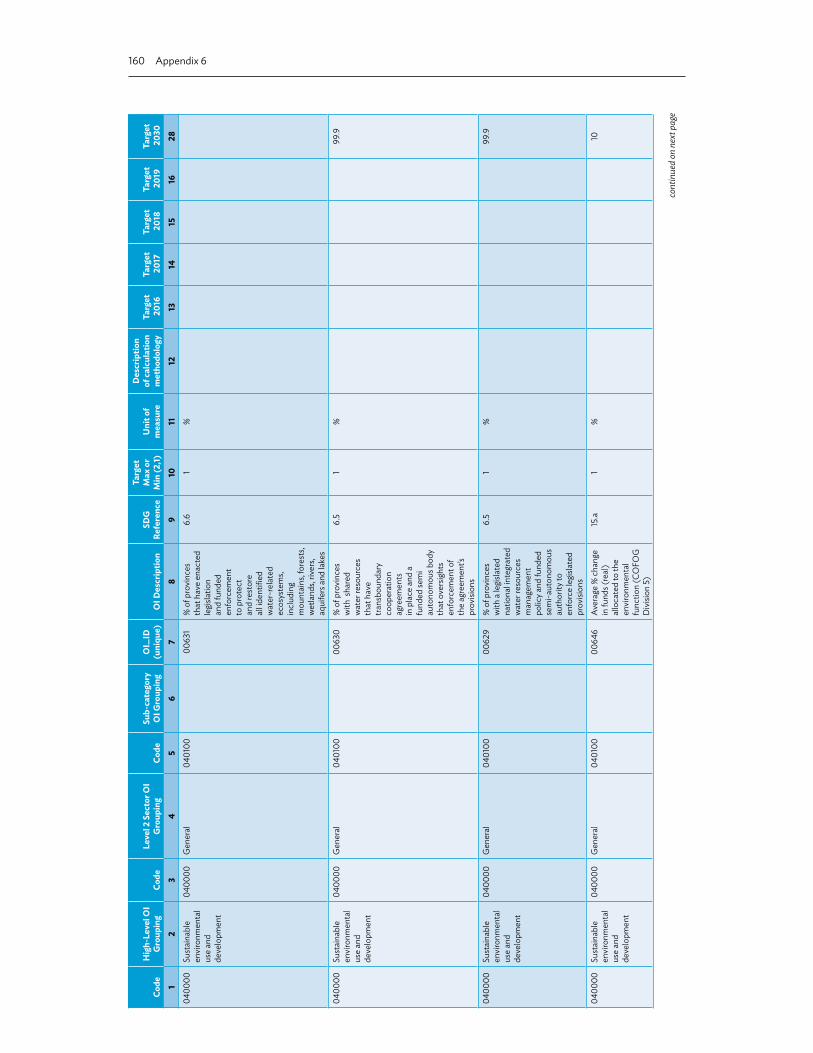
160 Appendix 6
Code
Hig
h-Le
vel O
I G
roup
ing
Code
Leve
l 2 S
ecto
r OI
Gro
upin
gCo
deSu
b-ca
tego
ry
OI G
roup
ing
OI_
ID
(uni
que)
OI D
escr
iptio
nSD
G
Refe
renc
e
Targ
et
Max
or
Min
(2,1)
Uni
t of
mea
sure
Des
crip
tion
of ca
lcul
atio
n m
etho
dolo
gyTa
rget
2
016
Targ
et
201
7Ta
rget
2
018
Targ
et
201
9Ta
rget
2
030
12
34
56
78
910
1112
1314
1516
2804
0000
Sust
aina
ble
envi
ronm
enta
l us
e an
d de
velo
pmen
t
0400
00G
ener
al04
0100
0063
1%
of p
rovi
nces
th
at h
ave
enac
ted
legi
slatio
n an
d fu
nded
en
forc
emen
t to
pro
tect
an
d re
stor
e al
l iden
tified
w
ater
-rel
ated
ec
osys
tem
s, in
clud
ing
mou
ntai
ns, f
ores
ts,
wet
land
s, riv
ers,
aqui
fers
and
lake
s
6.6
1%
0400
00Su
stai
nabl
e en
viro
nmen
tal
use
and
deve
lopm
ent
0400
00G
ener
al04
0100
0063
0%
of p
rovi
nces
w
ith s
hare
d w
ater
reso
urce
s th
at h
ave
trans
boun
dary
co
oper
atio
n ag
reem
ents
in
pla
ce a
nd a
fu
nded
sem
i au
tono
mou
s bod
y th
at o
vers
ight
s en
forc
emen
t of
the
agre
emen
t’s
prov
ision
s
6.5
1%
99.9
0400
00Su
stai
nabl
e en
viro
nmen
tal
use
and
deve
lopm
ent
0400
00G
ener
al04
0100
0062
9%
of p
rovi
nces
w
ith a
legi
slate
d na
tiona
l inte
grat
ed
wat
er re
sour
ces
man
agem
ent
polic
y and
fund
ed
sem
i-aut
onom
ous
auth
ority
to
enfo
rce
legi
slate
d pr
ovisi
ons
6.5
1%
99.9
0400
00Su
stai
nabl
e en
viro
nmen
tal
use
and
deve
lopm
ent
0400
00G
ener
al04
0100
0064
6Av
erag
e %
cha
nge
in fu
nds (
real
) al
loca
ted
to th
e en
viro
nmen
tal
func
tion
(CO
FOG
D
ivisi
on 5
)
15.a
1%
10
cont
inue
d on
nex
t pag
e

An Outcome Classification System with Outcome Indicators 161
Code
Hig
h-Le
vel O
I G
roup
ing
Code
Leve
l 2 S
ecto
r OI
Gro
upin
gCo
deSu
b-ca
tego
ry
OI G
roup
ing
OI_
ID
(uni
que)
OI D
escr
iptio
nSD
G
Refe
renc
e
Targ
et
Max
or
Min
(2,1)
Uni
t of
mea
sure
Des
crip
tion
of ca
lcul
atio
n m
etho
dolo
gyTa
rget
2
016
Targ
et
201
7Ta
rget
2
018
Targ
et
201
9Ta
rget
2
030
12
34
56
78
910
1112
1314
1516
2804
0000
Sust
aina
ble
envi
ronm
enta
l us
e an
d de
velo
pmen
t
0400
00G
ener
al04
0100
0064
3Av
erag
e %
cha
nge
in th
e es
timat
ed
per c
apita
glob
al
food
loss
es in
th
e pr
oduc
tion
and
supp
ly
chai
ns, in
clud
ing
post
harv
est l
osse
s
12.3
2%
-1
0400
00Su
stai
nabl
e en
viro
nmen
tal
use
and
deve
lopm
ent
0400
00G
ener
al04
0100
0064
2Av
erag
e %
cha
nge
in th
e es
timat
ed
per c
apita
glob
al
food
was
te a
t the
co
nsum
er le
vel
12.3
2%
-50
0400
00Su
stai
nabl
e en
viro
nmen
tal
use
and
deve
lopm
ent
0400
00G
ener
al04
0100
0064
1Av
erag
e %
cha
nge
in th
e es
timat
ed
per c
apita
glob
al
food
was
te a
t th
e re
tail l
evel
12.3
2%
-50
0400
00Su
stai
nabl
e en
viro
nmen
tal
use
and
deve
lopm
ent
0400
00G
ener
al04
0100
0064
8N
umbe
r of l
ives
lo
st a
s a re
sult
of
envi
ronm
enta
l po
llutio
n or
de
grad
atio
n
0400
00Su
stai
nabl
e en
viro
nmen
tal
use
and
deve
lopm
ent
0401
00H
ealth
y air
0401
00G
ener
al00
658
% c
hang
e in
tonn
es o
f ch
emic
al w
aste
re
leas
ed to
air
12.4
2%
0400
00Su
stai
nabl
e en
viro
nmen
tal
use
and
deve
lopm
ent
0401
00H
ealth
y air
0401
00G
ener
al00
657
Aver
age
% c
hang
e in
<ai
r qua
lity
- sus
pend
ed
parti
cles
> (u
sing
wha
t mea
sure
(s)
of a
ir qu
ality
) for
ci
ties o
f 500
,000
pe
ople
or m
ore
11.6
2%
-10
0400
00Su
stai
nabl
e en
viro
nmen
tal
use
and
deve
lopm
ent
0401
00H
ealth
y air
0401
00G
ener
al00
660
Aver
age
% c
hang
e in
num
ber o
f da
ys fo
r citi
es
of 5
00,0
00
or m
ore
with
su
spen
ded
parti
cle
read
ing d
ays
exce
edin
g <w
hat
benc
hmar
k?>
12.4
2%
cont
inue
d on
nex
t pag
e

162 Appendix 6
Code
Hig
h-Le
vel O
I G
roup
ing
Code
Leve
l 2 S
ecto
r OI
Gro
upin
gCo
deSu
b-ca
tego
ry
OI G
roup
ing
OI_
ID
(uni
que)
OI D
escr
iptio
nSD
G
Refe
renc
e
Targ
et
Max
or
Min
(2,1)
Uni
t of
mea
sure
Des
crip
tion
of ca
lcul
atio
n m
etho
dolo
gyTa
rget
2
016
Targ
et
201
7Ta
rget
2
018
Targ
et
201
9Ta
rget
2
030
12
34
56
78
910
1112
1314
1516
2804
0000
Sust
aina
ble
envi
ronm
enta
l us
e an
d de
velo
pmen
t
0401
00H
ealth
y air
0401
00G
ener
al00
662
Aver
age
num
ber
of d
ays i
n ci
ties
of 1
milli
on
peop
le o
r mor
e w
here
aver
age
susp
ende
d pa
rticu
late
le
vel e
xcee
ds
90ug
/ncm
0400
00Su
stai
nabl
e en
viro
nmen
tal
use
and
deve
lopm
ent
0401
00H
ealth
y air
0401
00G
ener
al00
659
Envi
ronm
enta
l qu
ality
inde
x 1
%
0400
00Su
stai
nabl
e en
viro
nmen
tal
use
and
deve
lopm
ent
0401
00H
ealth
y air
0401
00G
ener
al00
652
Estim
ated
%
Cha
nge
in
Gre
enho
use
Gas
em
issio
ns
2%
0400
00Su
stai
nabl
e en
viro
nmen
tal
use
and
deve
lopm
ent
0401
00H
ealth
y air
0401
00G
ener
al00
655
Estim
ated
%
chan
ge in
the
num
ber o
f dea
ths
from
air
pollu
tion
and
cont
amin
atio
n
3.9
2%
-10
0400
00Su
stai
nabl
e en
viro
nmen
tal
use
and
deve
lopm
ent
0401
00H
ealth
y air
0401
00G
ener
al00
653
Estim
ated
%
chan
ge in
the
num
ber o
f dea
ths
from
haz
ardo
us
chem
ical
s
3.9
2%
-10
0400
00Su
stai
nabl
e en
viro
nmen
tal
use
and
deve
lopm
ent
0401
00H
ealth
y air
0401
00G
ener
al00
656
Estim
ated
%
chan
ge in
the
num
ber o
f illn
esse
s fro
m
air p
ollu
tion
and
cont
amin
atio
n
3.9
2%
-10
0400
00Su
stai
nabl
e en
viro
nmen
tal
use
and
deve
lopm
ent
0401
00H
ealth
y air
0401
00G
ener
al00
654
Estim
ated
%
chan
ge in
the
num
ber o
f illn
esse
s fro
m
haza
rdou
s ch
emic
als
3.9
2%
-10
0400
00Su
stai
nabl
e en
viro
nmen
tal
use
and
deve
lopm
ent
0401
00H
ealth
y air
0401
00G
ener
al00
661
Num
ber o
f da
ys in
Jaka
rta
whe
re av
erag
e su
spen
ded
parti
cula
te
leve
l exc
eeds
90
ug/n
cm
cont
inue
d on
nex
t pag
e
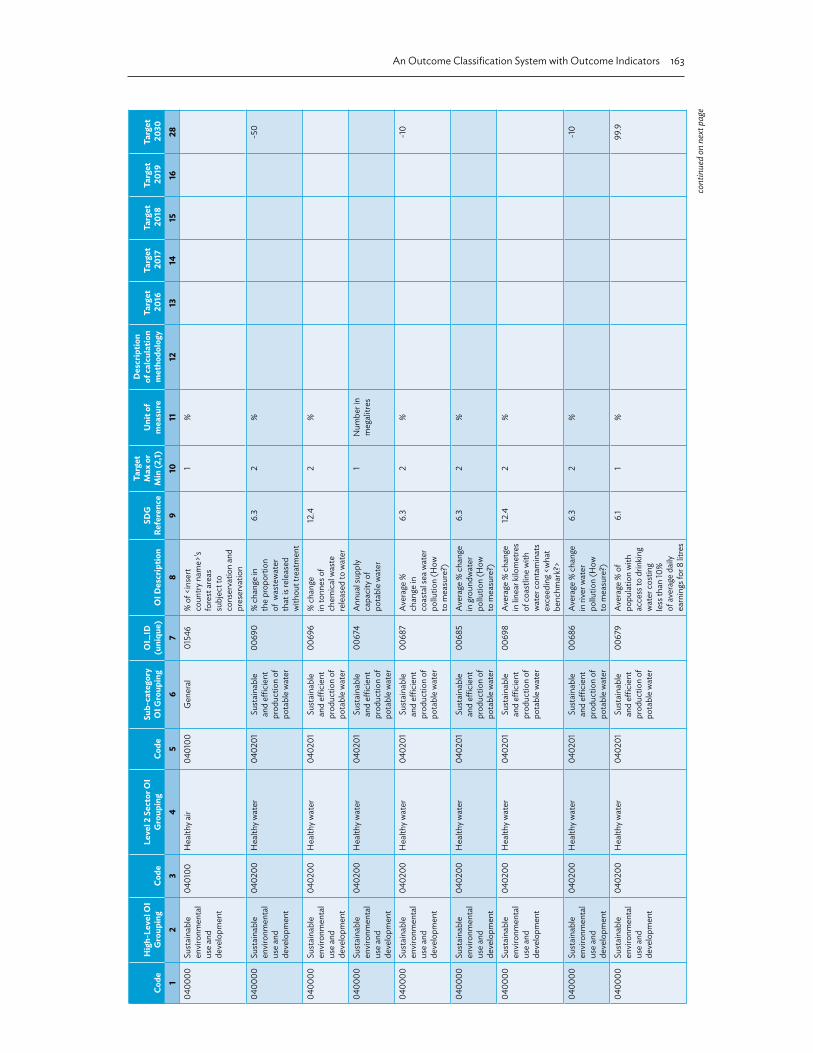
An Outcome Classification System with Outcome Indicators 163
Code
Hig
h-Le
vel O
I G
roup
ing
Code
Leve
l 2 S
ecto
r OI
Gro
upin
gCo
deSu
b-ca
tego
ry
OI G
roup
ing
OI_
ID
(uni
que)
OI D
escr
iptio
nSD
G
Refe
renc
e
Targ
et
Max
or
Min
(2,1)
Uni
t of
mea
sure
Des
crip
tion
of ca
lcul
atio
n m
etho
dolo
gyTa
rget
2
016
Targ
et
201
7Ta
rget
2
018
Targ
et
201
9Ta
rget
2
030
12
34
56
78
910
1112
1314
1516
2804
0000
Sust
aina
ble
envi
ronm
enta
l us
e an
d de
velo
pmen
t
0401
00H
ealth
y air
0401
00G
ener
al01
546
% o
f <in
sert
coun
try n
ame>
’s fo
rest
are
as
subj
ect t
o co
nser
vatio
n an
d pr
eser
vatio
n
1%
0400
00Su
stai
nabl
e en
viro
nmen
tal
use
and
deve
lopm
ent
0402
00H
ealth
y wat
er04
0201
Sust
aina
ble
and
effici
ent
prod
uctio
n of
po
tabl
e w
ater
0069
0%
cha
nge
in
the
prop
ortio
n of
was
tew
ater
th
at is
rele
ased
w
ithou
t tre
atm
ent
6.3
2%
-50
0400
00Su
stai
nabl
e en
viro
nmen
tal
use
and
deve
lopm
ent
0402
00H
ealth
y wat
er04
0201
Sust
aina
ble
and
effici
ent
prod
uctio
n of
po
tabl
e w
ater
0069
6%
cha
nge
in to
nnes
of
chem
ical
was
te
rele
ased
to w
ater
12.4
2%
0400
00Su
stai
nabl
e en
viro
nmen
tal
use
and
deve
lopm
ent
0402
00H
ealth
y wat
er04
0201
Sust
aina
ble
and
effici
ent
prod
uctio
n of
po
tabl
e w
ater
0067
4A
nnua
l sup
ply
capa
city
of
pota
ble
wat
er
1N
umbe
r in
meg
alitr
es
0400
00Su
stai
nabl
e en
viro
nmen
tal
use
and
deve
lopm
ent
0402
00H
ealth
y wat
er04
0201
Sust
aina
ble
and
effici
ent
prod
uctio
n of
po
tabl
e w
ater
0068
7Av
erag
e %
ch
ange
in
coas
tal s
ea w
ater
po
llutio
n (H
ow
to m
easu
re?)
6.3
2%
-10
0400
00Su
stai
nabl
e en
viro
nmen
tal
use
and
deve
lopm
ent
0402
00H
ealth
y wat
er04
0201
Sust
aina
ble
and
effici
ent
prod
uctio
n of
po
tabl
e w
ater
0068
5Av
erag
e %
cha
nge
in gr
ound
wat
er
pollu
tion
(How
to
mea
sure
?)
6.3
2%
0400
00Su
stai
nabl
e en
viro
nmen
tal
use
and
deve
lopm
ent
0402
00H
ealth
y wat
er04
0201
Sust
aina
ble
and
effici
ent
prod
uctio
n of
po
tabl
e w
ater
0069
8Av
erag
e %
cha
nge
in lin
ear k
ilom
etre
s of
coa
stlin
e w
ith
wat
er c
onta
min
ats
exce
edin
g <w
hat
benc
hmar
k?>
12.4
2%
0400
00Su
stai
nabl
e en
viro
nmen
tal
use
and
deve
lopm
ent
0402
00H
ealth
y wat
er04
0201
Sust
aina
ble
and
effici
ent
prod
uctio
n of
po
tabl
e w
ater
0068
6Av
erag
e %
cha
nge
in ri
ver w
ater
po
llutio
n (H
ow
to m
easu
re?)
6.3
2%
-10
0400
00Su
stai
nabl
e en
viro
nmen
tal
use
and
deve
lopm
ent
0402
00H
ealth
y wat
er04
0201
Sust
aina
ble
and
effici
ent
prod
uctio
n of
po
tabl
e w
ater
0067
9Av
erag
e %
of
popu
latio
n w
ith
acce
ss to
drin
king
w
ater
cos
ting
less
than
10%
of
aver
age
daily
ea
rnin
gs fo
r 8 lit
res
6.1
1%
99.9
cont
inue
d on
nex
t pag
e
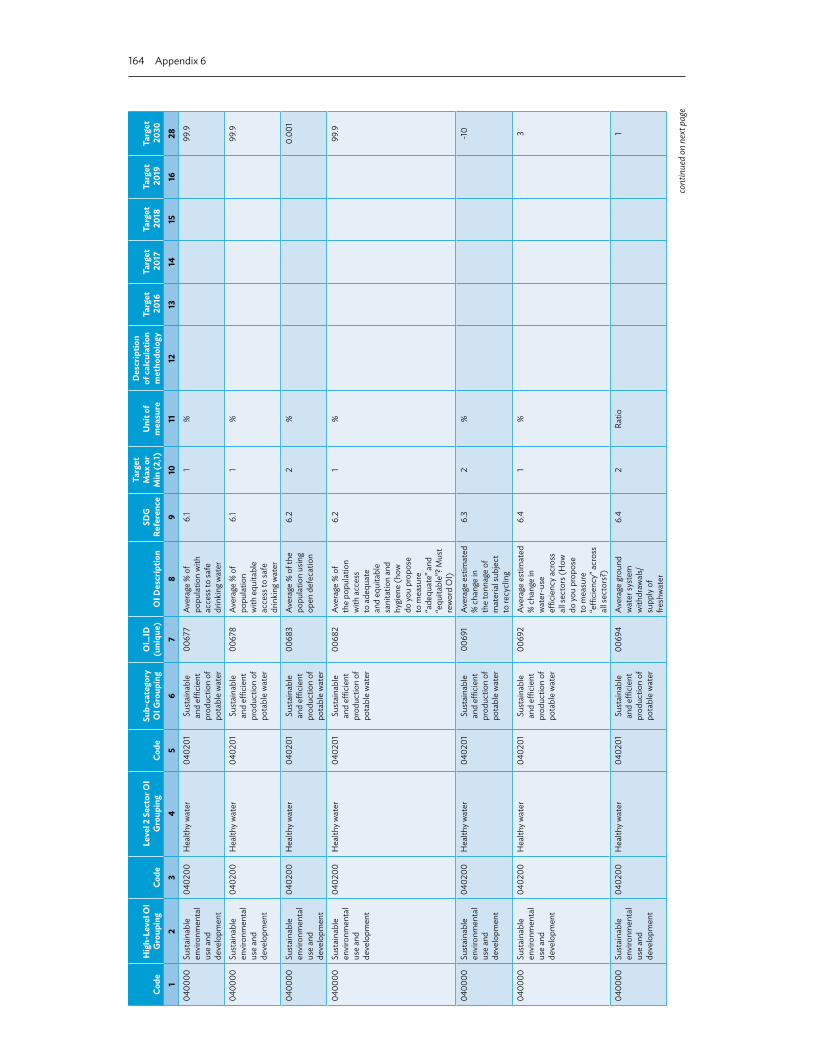
164 Appendix 6
Code
Hig
h-Le
vel O
I G
roup
ing
Code
Leve
l 2 S
ecto
r OI
Gro
upin
gCo
deSu
b-ca
tego
ry
OI G
roup
ing
OI_
ID
(uni
que)
OI D
escr
iptio
nSD
G
Refe
renc
e
Targ
et
Max
or
Min
(2,1)
Uni
t of
mea
sure
Des
crip
tion
of ca
lcul
atio
n m
etho
dolo
gyTa
rget
2
016
Targ
et
201
7Ta
rget
2
018
Targ
et
201
9Ta
rget
2
030
12
34
56
78
910
1112
1314
1516
2804
0000
Sust
aina
ble
envi
ronm
enta
l us
e an
d de
velo
pmen
t
0402
00H
ealth
y wat
er04
0201
Sust
aina
ble
and
effici
ent
prod
uctio
n of
po
tabl
e w
ater
0067
7Av
erag
e %
of
popu
latio
n w
ith
acce
ss to
safe
dr
inki
ng w
ater
6.1
1%
99.9
0400
00Su
stai
nabl
e en
viro
nmen
tal
use
and
deve
lopm
ent
0402
00H
ealth
y wat
er04
0201
Sust
aina
ble
and
effici
ent
prod
uctio
n of
po
tabl
e w
ater
0067
8Av
erag
e %
of
popu
latio
n w
ith e
quita
ble
acce
ss to
safe
dr
inki
ng w
ater
6.1
1%
99.9
0400
00Su
stai
nabl
e en
viro
nmen
tal
use
and
deve
lopm
ent
0402
00H
ealth
y wat
er04
0201
Sust
aina
ble
and
effici
ent
prod
uctio
n of
po
tabl
e w
ater
0068
3Av
erag
e %
of t
he
popu
latio
n us
ing
open
def
ecat
ion
6.2
2%
0.00
1
0400
00Su
stai
nabl
e en
viro
nmen
tal
use
and
deve
lopm
ent
0402
00H
ealth
y wat
er04
0201
Sust
aina
ble
and
effici
ent
prod
uctio
n of
po
tabl
e w
ater
0068
2Av
erag
e %
of
the
popu
latio
n w
ith a
cces
s to
ade
quat
e an
d eq
uita
ble
sani
tatio
n an
d hy
gien
e (h
ow
do yo
u pr
opos
e to
mea
sure
“a
dequ
ate”
and
“e
quita
ble”
? Mus
t re
wor
d O
I)
6.2
1%
99.9
0400
00Su
stai
nabl
e en
viro
nmen
tal
use
and
deve
lopm
ent
0402
00H
ealth
y wat
er04
0201
Sust
aina
ble
and
effici
ent
prod
uctio
n of
po
tabl
e w
ater
0069
1Av
erag
e es
timat
ed
% c
hang
e in
th
e to
nnag
e of
m
ater
ial s
ubje
ct
to re
cycl
ing
6.3
2%
-10
0400
00Su
stai
nabl
e en
viro
nmen
tal
use
and
deve
lopm
ent
0402
00H
ealth
y wat
er04
0201
Sust
aina
ble
and
effici
ent
prod
uctio
n of
po
tabl
e w
ater
0069
2Av
erag
e es
timat
ed
% c
hang
e in
w
ater
-use
effi
cien
cy a
cros
s al
l sec
tors
(How
do
you
prop
ose
to m
easu
re
“effi
cien
cy” a
cros
s al
l sec
tors
?)
6.4
1%
3
0400
00Su
stai
nabl
e en
viro
nmen
tal
use
and
deve
lopm
ent
0402
00H
ealth
y wat
er04
0201
Sust
aina
ble
and
effici
ent
prod
uctio
n of
po
tabl
e w
ater
0069
4Av
erag
e gr
ound
w
ater
syst
em
with
draw
als/
supp
ly o
f fre
shw
ater
6.4
2Ra
tio1
cont
inue
d on
nex
t pag
e

An Outcome Classification System with Outcome Indicators 165
Code
Hig
h-Le
vel O
I G
roup
ing
Code
Leve
l 2 S
ecto
r OI
Gro
upin
gCo
deSu
b-ca
tego
ry
OI G
roup
ing
OI_
ID
(uni
que)
OI D
escr
iptio
nSD
G
Refe
renc
e
Targ
et
Max
or
Min
(2,1)
Uni
t of
mea
sure
Des
crip
tion
of ca
lcul
atio
n m
etho
dolo
gyTa
rget
2
016
Targ
et
201
7Ta
rget
2
018
Targ
et
201
9Ta
rget
2
030
12
34
56
78
910
1112
1314
1516
2804
0000
Sust
aina
ble
envi
ronm
enta
l us
e an
d de
velo
pmen
t
0402
00H
ealth
y wat
er04
0201
Sust
aina
ble
and
effici
ent
prod
uctio
n of
po
tabl
e w
ater
0069
5Av
erag
e nu
mbe
r of
peo
ple
suffe
ring
from
at l
east
one
w
ater
scar
city
ev
ent p
er ye
ar
(how
to d
efine
a
“wat
er sc
arci
ty
even
t”?)
6.4
2N
umbe
r of
peo
ple
0400
00Su
stai
nabl
e en
viro
nmen
tal
use
and
deve
lopm
ent
0402
00H
ealth
y wat
er04
0201
Sust
aina
ble
and
effici
ent
prod
uctio
n of
po
tabl
e w
ater
0069
3Av
erag
e Ri
ver s
yste
m
with
draw
als/
supp
ly o
f fre
shw
ater
6.4
2Ra
tio1
0400
00Su
stai
nabl
e en
viro
nmen
tal
use
and
deve
lopm
ent
0402
00H
ealth
y wat
er04
0201
Sust
aina
ble
and
effici
ent
prod
uctio
n of
po
tabl
e w
ater
0068
9Es
timat
ed %
ch
ange
in th
e cu
bic
met
res
of h
azar
dous
ch
emic
als
and
mat
eria
ls re
leas
ed in
to th
e en
viro
nmen
t
6.3
2%
-10
0400
00Su
stai
nabl
e en
viro
nmen
tal
use
and
deve
lopm
ent
0402
00H
ealth
y wat
er04
0201
Sust
aina
ble
and
effici
ent
prod
uctio
n of
po
tabl
e w
ater
0067
5Es
timat
ed %
ch
ange
in th
e nu
mbe
r of d
eath
s fro
m w
ater
po
llutio
n an
d co
ntam
inat
ion
3.9
2%
-10
0400
00Su
stai
nabl
e en
viro
nmen
tal
use
and
deve
lopm
ent
0402
00H
ealth
y wat
er04
0201
Sust
aina
ble
and
effici
ent
prod
uctio
n of
po
tabl
e w
ater
0067
6Es
timat
ed %
ch
ange
in th
e nu
mbe
r of
illnes
ses f
rom
w
ater
pol
lutio
n an
d co
ntam
inat
ion
3.9
2%
-10
0400
00Su
stai
nabl
e en
viro
nmen
tal
use
and
deve
lopm
ent
0402
00H
ealth
y wat
er04
0201
Sust
aina
ble
and
effici
ent
prod
uctio
n of
po
tabl
e w
ater
0068
8N
umbe
r of
repo
rted
inci
dent
s of
reco
rded
du
mpi
ng o
f w
aste
pro
duct
s
6.3
2N
umbe
r of
inci
dent
s0
0400
00Su
stai
nabl
e en
viro
nmen
tal
use
and
deve
lopm
ent
0402
00H
ealth
y wat
er04
0201
Sust
aina
ble
and
effici
ent
prod
uctio
n of
po
tabl
e w
ater
0155
7%
of <
inse
rt co
untry
nam
e>’s
wat
er c
atch
men
t ar
eas s
ubje
ct
to c
onse
rvat
ion
and
pres
erva
tion
orde
rs
1%
cont
inue
d on
nex
t pag
e

166 Appendix 6
Code
Hig
h-Le
vel O
I G
roup
ing
Code
Leve
l 2 S
ecto
r OI
Gro
upin
gCo
deSu
b-ca
tego
ry
OI G
roup
ing
OI_
ID
(uni
que)
OI D
escr
iptio
nSD
G
Refe
renc
e
Targ
et
Max
or
Min
(2,1)
Uni
t of
mea
sure
Des
crip
tion
of ca
lcul
atio
n m
etho
dolo
gyTa
rget
2
016
Targ
et
201
7Ta
rget
2
018
Targ
et
201
9Ta
rget
2
030
12
34
56
78
910
1112
1314
1516
2804
0000
Sust
aina
ble
envi
ronm
enta
l us
e an
d de
velo
pmen
t
0402
00H
ealth
y wat
er04
0202
Sust
aina
ble
and
effici
ent
use
of o
cean
en
viro
nmen
t
0070
6%
cha
nge
in
the
num
ber o
f ca
ses o
f ille
gal,
unre
gula
ted
or
dest
ruct
ive
fishi
ng
prac
tices
reco
rded
14.4
2%
0400
00Su
stai
nabl
e en
viro
nmen
tal
use
and
deve
lopm
ent
0402
00H
ealth
y wat
er04
0202
Sust
aina
ble
and
effici
ent
use
of o
cean
en
viro
nmen
t
0070
7%
cha
nge
in th
e sq
uare
kilo
met
res
of c
oast
al te
rrito
ry
and
mar
ine
area
s de
clar
ed a
s co
nser
vatio
n ar
eas
14.5
1%
0400
00Su
stai
nabl
e en
viro
nmen
tal
use
and
deve
lopm
ent
0402
00H
ealth
y wat
er04
0202
Sust
aina
ble
and
effici
ent
use
of o
cean
en
viro
nmen
t
0070
8%
of fi
shin
g in
dust
ry in
puts
w
ith su
bsid
ies
appl
ied
in re
latio
n to
fish
, fish
erie
s or
fish
ing
14.6
2%
0400
00Su
stai
nabl
e en
viro
nmen
tal
use
and
deve
lopm
ent
0402
00H
ealth
y wat
er04
0202
Sust
aina
ble
and
effici
ent
use
of o
cean
en
viro
nmen
t
0070
4%
of p
rose
cutio
ns
for m
arin
e en
viro
nmen
t po
llutio
n in
cide
nts
that
resu
lt in
a
succ
essf
ul
conv
ictio
n
14.2
1%
0400
00Su
stai
nabl
e en
viro
nmen
tal
use
and
deve
lopm
ent
0402
00H
ealth
y wat
er04
0202
Sust
aina
ble
and
effici
ent
use
of o
cean
en
viro
nmen
t
0070
5Av
erag
e %
cha
nge
in lin
ear k
ilom
etre
s of
coa
stlin
e w
ith so
lid w
aste
co
ntam
inat
s ex
ceed
ing <
wha
t be
nchm
ark?
>
12.4
2%
0400
00Su
stai
nabl
e en
viro
nmen
tal
use
and
deve
lopm
ent
0402
00H
ealth
y wat
er04
0202
Sust
aina
ble
and
effici
ent
use
of o
cean
en
viro
nmen
t
0069
8Av
erag
e %
cha
nge
in lin
ear k
ilom
etre
s of
coa
stlin
e w
ith
wat
er c
onta
min
ats
exce
edin
g <w
hat
benc
hmar
k?>
12.4
2%
0400
00Su
stai
nabl
e en
viro
nmen
tal
use
and
deve
lopm
ent
0402
00H
ealth
y wat
er04
0202
Sust
aina
ble
and
effici
ent
use
of o
cean
en
viro
nmen
t
0070
3Es
timat
ed av
erag
e %
cha
nge
in
mar
ine
debr
is an
d nu
trien
t pol
lutio
n
14.1
2%
cont
inue
d on
nex
t pag
e

An Outcome Classification System with Outcome Indicators 167
Code
Hig
h-Le
vel O
I G
roup
ing
Code
Leve
l 2 S
ecto
r OI
Gro
upin
gCo
deSu
b-ca
tego
ry
OI G
roup
ing
OI_
ID
(uni
que)
OI D
escr
iptio
nSD
G
Refe
renc
e
Targ
et
Max
or
Min
(2,1)
Uni
t of
mea
sure
Des
crip
tion
of ca
lcul
atio
n m
etho
dolo
gyTa
rget
2
016
Targ
et
201
7Ta
rget
2
018
Targ
et
201
9Ta
rget
2
030
12
34
56
78
910
1112
1314
1516
2804
0000
Sust
aina
ble
envi
ronm
enta
l us
e an
d de
velo
pmen
t
0402
00H
ealth
y wat
er04
0202
Sust
aina
ble
and
effici
ent
use
of o
cean
en
viro
nmen
t
0070
2Es
timat
ed to
nnes
of
pol
lutio
n en
terin
g mar
ine
envi
ronm
ents
fro
m la
nd d
ebris
an
d nu
trien
t ru
n-off
14.1
2To
nnes
0400
00Su
stai
nabl
e en
viro
nmen
tal
use
and
deve
lopm
ent
0402
00H
ealth
y wat
er04
0203
Sust
aina
ble
and
effici
ent
prod
uctio
n of
wat
er fo
r irr
igat
ion
0071
1A
nnua
l sup
ply
capa
city
of w
ater
st
orag
e fa
cilit
ies
for i
rriga
tion
with
99
% p
roba
bilit
y of
del
iver
y (G
igal
itres
)
1G
igal
itres
of
wat
er
0400
00Su
stai
nabl
e en
viro
nmen
tal
use
and
deve
lopm
ent
0402
00H
ealth
y wat
er04
0203
Sust
aina
ble
and
effici
ent
prod
uctio
n of
wat
er fo
r irr
igat
ion
0071
2N
umbe
r of
hect
ares
of l
and
unde
r irri
gatio
n
1N
umbe
r of
hect
ares
0400
00Su
stai
nabl
e en
viro
nmen
tal
use
and
deve
lopm
ent
0402
00H
ealth
y wat
er04
0203
Sust
aina
ble
and
effici
ent
prod
uctio
n of
wat
er fo
r irr
igat
ion
0155
7%
of <
inse
rt co
untry
nam
e>’s
wat
er c
atch
men
t ar
eas s
ubje
ct
to c
onse
rvat
ion
and
pres
erva
tion
orde
rs
1%
0400
00Su
stai
nabl
e en
viro
nmen
tal
use
and
deve
lopm
ent
0402
00H
ealth
y wat
er04
0204
Sust
aina
ble
and
effici
ent
prod
uctio
n of
in
dust
rial w
ater
0071
9%
of b
usin
esse
s th
at e
xper
ienc
e on
e or
mor
e su
pply
in
terru
ptio
ns o
f 4
hour
s or m
ore
2%
0400
00Su
stai
nabl
e en
viro
nmen
tal
use
and
deve
lopm
ent
0402
00H
ealth
y wat
er04
0204
Sust
aina
ble
and
effici
ent
prod
uctio
n of
in
dust
rial w
ater
0071
8A
nnua
l sup
ply
capa
city
of
indu
stria
l w
ater
with
99%
pr
obab
ility
of d
eliv
ery
(Gig
alitr
es)
1G
igal
itres
of
wat
er
0400
00Su
stai
nabl
e en
viro
nmen
tal
use
and
deve
lopm
ent
0402
00H
ealth
y wat
er04
0205
Sust
aina
ble
lake
s and
rive
r sy
stem
s
0073
6%
of d
ays w
here
th
e Ci
taru
m
river
mea
sure
d a
bioc
hem
ical
ox
ygen
dem
and
of
2 pa
rts o
r les
s per
10
0,00
0 (u
sing
the
bod5
met
hod)
cont
inue
d on
nex
t pag
e
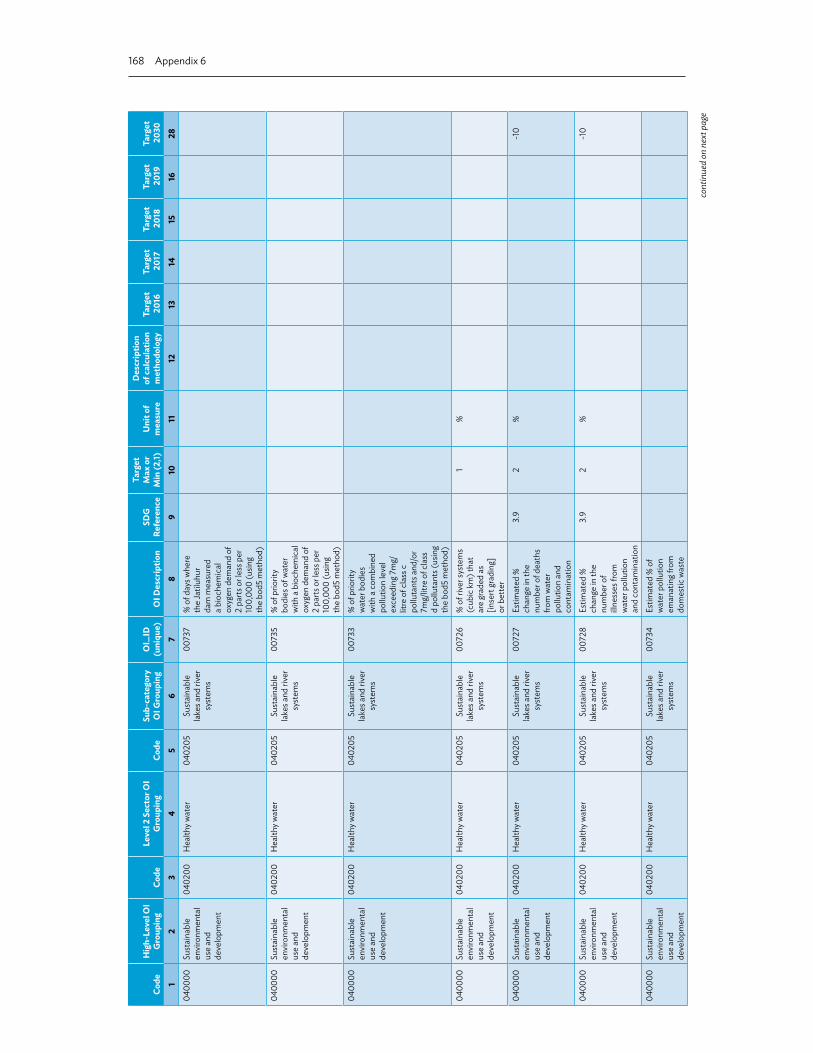
168 Appendix 6
Code
Hig
h-Le
vel O
I G
roup
ing
Code
Leve
l 2 S
ecto
r OI
Gro
upin
gCo
deSu
b-ca
tego
ry
OI G
roup
ing
OI_
ID
(uni
que)
OI D
escr
iptio
nSD
G
Refe
renc
e
Targ
et
Max
or
Min
(2,1)
Uni
t of
mea
sure
Des
crip
tion
of ca
lcul
atio
n m
etho
dolo
gyTa
rget
2
016
Targ
et
201
7Ta
rget
2
018
Targ
et
201
9Ta
rget
2
030
12
34
56
78
910
1112
1314
1516
2804
0000
Sust
aina
ble
envi
ronm
enta
l us
e an
d de
velo
pmen
t
0402
00H
ealth
y wat
er04
0205
Sust
aina
ble
lake
s and
rive
r sy
stem
s
0073
7%
of d
ays w
here
th
e Ja
tiluh
ur
dam
mea
sure
d a
bioc
hem
ical
ox
ygen
dem
and
of
2 pa
rts o
r les
s per
10
0,00
0 (u
sing
the
bod5
met
hod)
0400
00Su
stai
nabl
e en
viro
nmen
tal
use
and
deve
lopm
ent
0402
00H
ealth
y wat
er04
0205
Sust
aina
ble
lake
s and
rive
r sy
stem
s
0073
5%
of p
riorit
y bo
dies
of w
ater
w
ith a
bio
chem
ical
ox
ygen
dem
and
of
2 pa
rts o
r les
s per
10
0,00
0 (u
sing
the
bod5
met
hod)
0400
00Su
stai
nabl
e en
viro
nmen
tal
use
and
deve
lopm
ent
0402
00H
ealth
y wat
er04
0205
Sust
aina
ble
lake
s and
rive
r sy
stem
s
0073
3%
of p
riorit
y w
ater
bod
ies
with
a c
ombi
ned
pollu
tion
leve
l ex
ceed
ing 7
mg/
litre
of c
lass
c
pollu
tant
s and
/or
7mg/
litre
of c
lass
d
pollu
tant
s (us
ing
the
bod5
met
hod)
0400
00Su
stai
nabl
e en
viro
nmen
tal
use
and
deve
lopm
ent
0402
00H
ealth
y wat
er04
0205
Sust
aina
ble
lake
s and
rive
r sy
stem
s
0072
6%
of r
iver
syst
ems
(cub
ic km
) tha
t ar
e gr
aded
as
[inse
rt gr
adin
g]
or b
ette
r
1%
0400
00Su
stai
nabl
e en
viro
nmen
tal
use
and
deve
lopm
ent
0402
00H
ealth
y wat
er04
0205
Sust
aina
ble
lake
s and
rive
r sy
stem
s
0072
7Es
timat
ed %
ch
ange
in th
e nu
mbe
r of d
eath
s fro
m w
ater
po
llutio
n an
d co
ntam
inat
ion
3.9
2%
-10
0400
00Su
stai
nabl
e en
viro
nmen
tal
use
and
deve
lopm
ent
0402
00H
ealth
y wat
er04
0205
Sust
aina
ble
lake
s and
rive
r sy
stem
s
0072
8Es
timat
ed %
ch
ange
in th
e nu
mbe
r of
illnes
ses f
rom
w
ater
pol
lutio
n an
d co
ntam
inat
ion
3.9
2%
-10
0400
00Su
stai
nabl
e en
viro
nmen
tal
use
and
deve
lopm
ent
0402
00H
ealth
y wat
er04
0205
Sust
aina
ble
lake
s and
rive
r sy
stem
s
0073
4Es
timat
ed %
of
wat
er p
ollu
tion
eman
atin
g fro
m
dom
estic
was
te
cont
inue
d on
nex
t pag
e
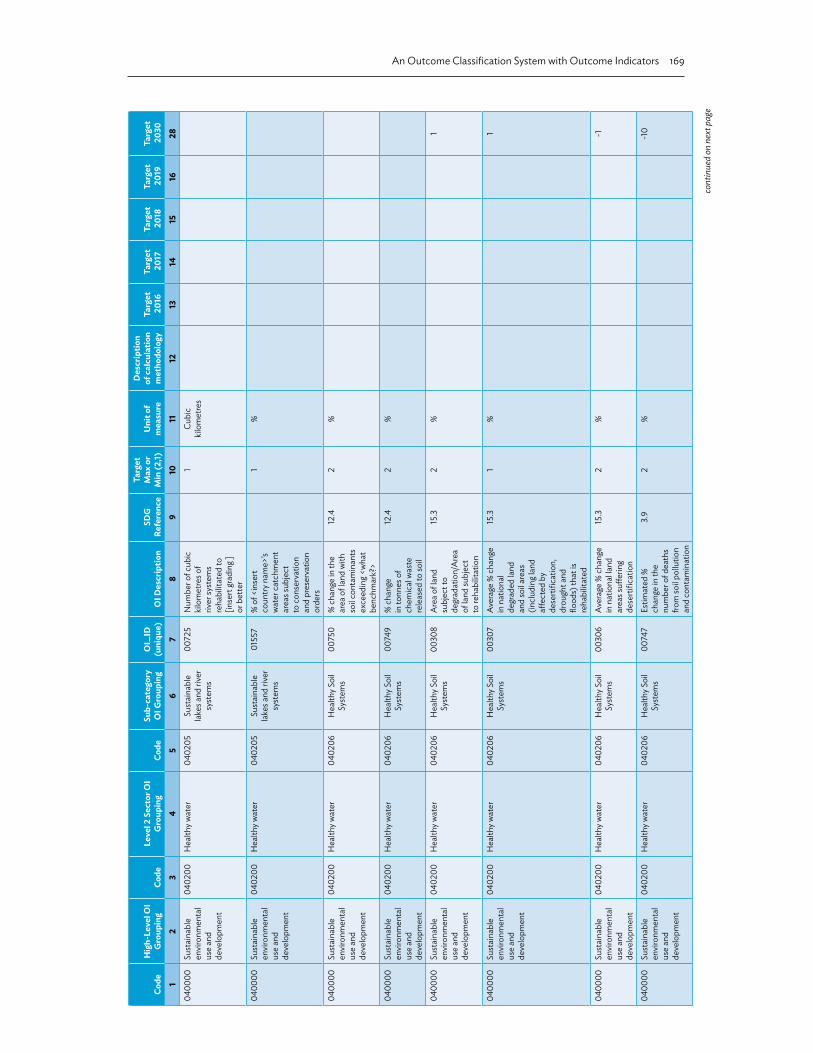
An Outcome Classification System with Outcome Indicators 169
Code
Hig
h-Le
vel O
I G
roup
ing
Code
Leve
l 2 S
ecto
r OI
Gro
upin
gCo
deSu
b-ca
tego
ry
OI G
roup
ing
OI_
ID
(uni
que)
OI D
escr
iptio
nSD
G
Refe
renc
e
Targ
et
Max
or
Min
(2,1)
Uni
t of
mea
sure
Des
crip
tion
of ca
lcul
atio
n m
etho
dolo
gyTa
rget
2
016
Targ
et
201
7Ta
rget
2
018
Targ
et
201
9Ta
rget
2
030
12
34
56
78
910
1112
1314
1516
2804
0000
Sust
aina
ble
envi
ronm
enta
l us
e an
d de
velo
pmen
t
0402
00H
ealth
y wat
er04
0205
Sust
aina
ble
lake
s and
rive
r sy
stem
s
0072
5N
umbe
r of c
ubic
ki
lom
etre
s of
river
syst
ems
reha
bilit
ated
to
[inse
rt gr
adin
g ]
or b
ette
r
1Cu
bic
kilo
met
res
0400
00Su
stai
nabl
e en
viro
nmen
tal
use
and
deve
lopm
ent
0402
00H
ealth
y wat
er04
0205
Sust
aina
ble
lake
s and
rive
r sy
stem
s
0155
7%
of <
inse
rt co
untry
nam
e>’s
wat
er c
atch
men
t ar
eas s
ubje
ct
to c
onse
rvat
ion
and
pres
erva
tion
orde
rs
1%
0400
00Su
stai
nabl
e en
viro
nmen
tal
use
and
deve
lopm
ent
0402
00H
ealth
y wat
er04
0206
Hea
lthy S
oil
Syst
ems
0075
0%
cha
nge
in th
e ar
ea o
f lan
d w
ith
soil c
onta
min
ants
ex
ceed
ing <
wha
t be
nchm
ark?
>
12.4
2%
0400
00Su
stai
nabl
e en
viro
nmen
tal
use
and
deve
lopm
ent
0402
00H
ealth
y wat
er04
0206
Hea
lthy S
oil
Syst
ems
0074
9%
cha
nge
in to
nnes
of
chem
ical
was
te
rele
ased
to so
il
12.4
2%
0400
00Su
stai
nabl
e en
viro
nmen
tal
use
and
deve
lopm
ent
0402
00H
ealth
y wat
er04
0206
Hea
lthy S
oil
Syst
ems
0030
8A
rea
of la
nd
subj
ect t
o de
grad
atio
n/A
rea
of la
nd su
bjec
t to
reha
bilit
atio
n
15.3
2%
1
0400
00Su
stai
nabl
e en
viro
nmen
tal
use
and
deve
lopm
ent
0402
00H
ealth
y wat
er04
0206
Hea
lthy S
oil
Syst
ems
0030
7Av
erag
e %
cha
nge
in n
atio
nal
degr
aded
land
an
d so
il are
as
(incl
udin
g lan
d aff
ecte
d by
de
serti
ficat
ion,
dr
ough
t and
flo
ods)
that
is
reha
bilit
ated
15.3
1%
1
0400
00Su
stai
nabl
e en
viro
nmen
tal
use
and
deve
lopm
ent
0402
00H
ealth
y wat
er04
0206
Hea
lthy S
oil
Syst
ems
0030
6Av
erag
e %
cha
nge
in n
atio
nal la
nd
area
s suff
erin
g de
serti
ficat
ion
15.3
2%
-1
0400
00Su
stai
nabl
e en
viro
nmen
tal
use
and
deve
lopm
ent
0402
00H
ealth
y wat
er04
0206
Hea
lthy S
oil
Syst
ems
0074
7Es
timat
ed %
ch
ange
in th
e nu
mbe
r of d
eath
s fro
m so
il pol
lutio
n an
d co
ntam
inat
ion
3.9
2%
-10
cont
inue
d on
nex
t pag
e

170 Appendix 6
Code
Hig
h-Le
vel O
I G
roup
ing
Code
Leve
l 2 S
ecto
r OI
Gro
upin
gCo
deSu
b-ca
tego
ry
OI G
roup
ing
OI_
ID
(uni
que)
OI D
escr
iptio
nSD
G
Refe
renc
e
Targ
et
Max
or
Min
(2,1)
Uni
t of
mea
sure
Des
crip
tion
of ca
lcul
atio
n m
etho
dolo
gyTa
rget
2
016
Targ
et
201
7Ta
rget
2
018
Targ
et
201
9Ta
rget
2
030
12
34
56
78
910
1112
1314
1516
2804
0000
Sust
aina
ble
envi
ronm
enta
l us
e an
d de
velo
pmen
t
0402
00H
ealth
y wat
er04
0206
Hea
lthy S
oil
Syst
ems
0074
8Es
timat
ed %
ch
ange
in th
e nu
mbe
r of
illnes
ses f
rom
so
il pol
lutio
n an
d co
ntam
inat
ion
3.9
2%
-10
0400
00Su
stai
nabl
e en
viro
nmen
tal
use
and
deve
lopm
ent
0403
00H
ealth
y and
di
vers
e na
tura
l flo
ra a
nd fa
una
0403
00G
ener
al00
760
% o
f dev
elop
men
t pr
opos
als
that
thre
aten
bi
odiv
ersit
y th
at h
ave
envi
ronm
enta
l sa
fegu
ards
im
pose
d on
thei
r de
velo
pmen
t co
nditi
ons
15.5
1%
0400
00Su
stai
nabl
e en
viro
nmen
tal
use
and
deve
lopm
ent
0403
00H
ealth
y and
di
vers
e na
tura
l flo
ra a
nd fa
una
0403
00G
ener
al00
761
% o
f de
velo
pmen
ts
that
bre
ach
one
or m
ore
envi
ronm
enta
l co
nditi
ons
that
resu
lt in
th
e su
cces
sful
pr
osec
utio
n of
the
resp
onsib
le e
ntity
15.5
1%
0400
00Su
stai
nabl
e en
viro
nmen
tal
use
and
deve
lopm
ent
0403
00H
ealth
y and
di
vers
e na
tura
l flo
ra a
nd fa
una
0403
00G
ener
al00
758
% o
f dist
inct
ly
iden
tified
nat
ural
ha
bita
ts o
f <in
sert
coun
try n
ame>
th
at h
ave
suffe
red
degr
adat
ion
to
10%
or m
ore
of
thei
r nat
ural
are
a
15.5
2%
0400
00Su
stai
nabl
e en
viro
nmen
tal
use
and
deve
lopm
ent
0403
00H
ealth
y and
di
vers
e na
tura
l flo
ra a
nd fa
una
0403
00G
ener
al00
013
% o
f inc
iden
ts o
f ille
gal p
oach
ing
and
cros
s bor
der
traffi
ckin
g in
flora
an
d fa
una
that
ar
e su
cces
sful
ly
pros
ecut
ed
15.7
1%
0400
00Su
stai
nabl
e en
viro
nmen
tal
use
and
deve
lopm
ent
0403
00H
ealth
y and
di
vers
e na
tura
l flo
ra a
nd fa
una
0403
00G
ener
al00
759
% o
f unl
awfu
l act
s of
env
ironm
enta
l de
grad
atio
n th
at
resu
lt in
one
or
mor
e pe
rson
s be
ing s
ucce
ssfu
lly
pros
ecut
ed
15.5
1%
cont
inue
d on
nex
t pag
e

An Outcome Classification System with Outcome Indicators 171
Code
Hig
h-Le
vel O
I G
roup
ing
Code
Leve
l 2 S
ecto
r OI
Gro
upin
gCo
deSu
b-ca
tego
ry
OI G
roup
ing
OI_
ID
(uni
que)
OI D
escr
iptio
nSD
G
Refe
renc
e
Targ
et
Max
or
Min
(2,1)
Uni
t of
mea
sure
Des
crip
tion
of ca
lcul
atio
n m
etho
dolo
gyTa
rget
2
016
Targ
et
201
7Ta
rget
2
018
Targ
et
201
9Ta
rget
2
030
12
34
56
78
910
1112
1314
1516
2804
0000
Sust
aina
ble
envi
ronm
enta
l us
e an
d de
velo
pmen
t
0403
00H
ealth
y and
di
vers
e na
tura
l flo
ra a
nd fa
una
0403
00G
ener
al00
763
Num
ber o
f in
cide
nts o
f cro
ss
bord
er tr
affiki
ng
dete
cted
15.7
2In
cide
nt
num
ber
1
0400
00Su
stai
nabl
e en
viro
nmen
tal
use
and
deve
lopm
ent
0403
00H
ealth
y and
di
vers
e na
tura
l flo
ra a
nd fa
una
0403
00G
ener
al00
764
Num
ber o
f in
cide
nts o
f ille
gal
poac
hing
det
ecte
d
15.7
2In
cide
nt
num
ber
1
0400
00Su
stai
nabl
e en
viro
nmen
tal
use
and
deve
lopm
ent
0403
00H
ealth
y and
di
vers
e na
tura
l flo
ra a
nd fa
una
0403
00G
ener
al00
762
Num
ber o
f spe
cies
th
reat
ened
with
ex
tinct
ion
(Wha
t st
anda
rd d
o w
e us
e to
det
erm
ine
whe
n a
spec
ies i
s th
reat
ened
with
ex
tinct
ion?
)
15.5
2nu
mbe
r of
spec
ies
0400
00Su
stai
nabl
e en
viro
nmen
tal
use
and
deve
lopm
ent
0404
00Sa
fe st
orag
e an
d re
cycl
ing o
f w
aste
pro
duct
s an
d m
ater
ials
0404
00G
ener
al00
775
% o
f com
pani
es
liste
d on
the
ISX
th
at h
ave
adop
ted
recy
clin
g pra
ctic
es
in o
ne o
r mor
e of
th
eir p
rodu
ctio
n pr
oces
ses
12.6
1%
0400
00Su
stai
nabl
e en
viro
nmen
tal
use
and
deve
lopm
ent
0404
00Sa
fe st
orag
e an
d re
cycl
ing o
f w
aste
pro
duct
s an
d m
ater
ials
0404
00G
ener
al00
776
% o
f list
ed
com
pani
es
oper
atin
g in
<ins
ert c
ount
ry
nam
e> th
at
inte
grat
e su
stai
nabi
lity
info
rmat
ion
into
th
eir a
nnua
l rep
ort
12.6
1%
0400
00Su
stai
nabl
e en
viro
nmen
tal
use
and
deve
lopm
ent
0404
00Sa
fe st
orag
e an
d re
cycl
ing o
f w
aste
pro
duct
s an
d m
ater
ials
0404
00G
ener
al00
773
Aver
age
% c
hang
e in
nat
iona
l w
aste
gene
rate
d pe
r cap
ita
12.5
2%
-10
0400
00Su
stai
nabl
e en
viro
nmen
tal
use
and
deve
lopm
ent
0404
00Sa
fe st
orag
e an
d re
cycl
ing o
f w
aste
pro
duct
s an
d m
ater
ials
0404
00G
ener
al00
774
Aver
age
% c
hang
e in
was
te ge
nera
ted
that
is su
bjec
t to
recy
clin
g and
re
use
(wha
t is
the
base
line
as a
t 201
5?)
12.5
1%
10
cont
inue
d on
nex
t pag
e

172 Appendix 6
Code
Hig
h-Le
vel O
I G
roup
ing
Code
Leve
l 2 S
ecto
r OI
Gro
upin
gCo
deSu
b-ca
tego
ry
OI G
roup
ing
OI_
ID
(uni
que)
OI D
escr
iptio
nSD
G
Refe
renc
e
Targ
et
Max
or
Min
(2,1)
Uni
t of
mea
sure
Des
crip
tion
of ca
lcul
atio
n m
etho
dolo
gyTa
rget
2
016
Targ
et
201
7Ta
rget
2
018
Targ
et
201
9Ta
rget
2
030
12
34
56
78
910
1112
1314
1516
2804
0000
Sust
aina
ble
envi
ronm
enta
l us
e an
d de
velo
pmen
t
0404
00Sa
fe st
orag
e an
d re
cycl
ing o
f w
aste
pro
duct
s an
d m
ater
ials
0404
00G
ener
al00
772
Chan
ge in
per
ca
pita
tonn
age
of re
cycl
ed liq
uid
was
te a
s a %
of
tota
l ton
nage
solid
w
aste
for c
ities
of
500,
000
or m
ore
11.6
1%
10
0400
00Su
stai
nabl
e en
viro
nmen
tal
use
and
deve
lopm
ent
0404
00Sa
fe st
orag
e an
d re
cycl
ing o
f w
aste
pro
duct
s an
d m
ater
ials
0404
00G
ener
al00
771
Chan
ge in
per
ca
pita
tonn
age
of re
cycl
ed so
lid
was
te a
s a %
of
tota
l ton
nage
solid
w
aste
for c
ities
of
500,
000
or m
ore
11.6
1%
10
0500
00Aff
orda
ble
Hou
sing f
or a
ll <i
nser
t cou
ntry
na
me>
ns
0500
00G
ener
al05
0000
0078
3(A
vera
ge R
ent/
Aver
age
Ann
ual
Inco
me)
11.1
2%
50
0500
00Aff
orda
ble
Hou
sing f
or a
ll <i
nser
t cou
ntry
na
me>
ns
0500
00G
ener
al05
0000
0078
8%
of b
uild
ings
in
spec
ted
that
ar
e fo
und
to b
e fu
lly c
ompl
iant
w
ith fi
re c
ode
0500
00Aff
orda
ble
Hou
sing f
or a
ll <i
nser
t cou
ntry
na
me>
ns
0500
00G
ener
al05
0000
0078
6%
of m
unic
ipal
ities
w
ith u
rban
pla
ns
and
rura
l land
m
anag
emen
t pl
ans t
hat a
re
deve
lope
d in
corp
orat
ing
exte
nsiv
e co
mm
unity
co
nsul
tatio
ns
11.3
1%
99.9
0500
00Aff
orda
ble
Hou
sing f
or a
ll <i
nser
t cou
ntry
na
me>
ns
0500
00G
ener
al05
0000
0078
7%
of p
rovi
nces
w
ith in
depe
nden
t pl
anni
ng
auth
oriti
es
resp
onsib
le
for u
ndet
akin
g co
mm
unity
pl
anni
ng
cons
ulta
tions
an
d pr
ovid
ing
reco
mm
enda
tions
to
dec
ision
-m
aker
s
11.3
1%
99.9
cont
inue
d on
nex
t pag
e

An Outcome Classification System with Outcome Indicators 173
Code
Hig
h-Le
vel O
I G
roup
ing
Code
Leve
l 2 S
ecto
r OI
Gro
upin
gCo
deSu
b-ca
tego
ry
OI G
roup
ing
OI_
ID
(uni
que)
OI D
escr
iptio
nSD
G
Refe
renc
e
Targ
et
Max
or
Min
(2,1)
Uni
t of
mea
sure
Des
crip
tion
of ca
lcul
atio
n m
etho
dolo
gyTa
rget
2
016
Targ
et
201
7Ta
rget
2
018
Targ
et
201
9Ta
rget
2
030
12
34
56
78
910
1112
1314
1516
2805
0000
Affor
dabl
e H
ousin
g for
all
<ins
ert c
ount
ry
nam
e>ns
0500
00G
ener
al05
0000
0078
4Av
erag
e (A
vera
ge
annu
al in
com
e/Av
erag
e co
st p
er
hous
e (m
etre
sq
uare
))
11.1
270
0
0500
00Aff
orda
ble
Hou
sing f
or a
ll <i
nser
t cou
ntry
na
me>
ns
0500
00G
ener
al05
0000
0078
5Av
erag
e %
of
popu
latio
n liv
ing i
n slu
ms o
r hom
eles
s
11.1
2%
10
0500
00Aff
orda
ble
Hou
sing f
or a
ll <i
nser
t cou
ntry
na
me>
ns
0501
00H
ousin
g de
velo
pmen
ts
are
ecol
ogic
ally
su
stai
nabl
e
0501
01H
ousin
g de
velo
pmen
ts
have
el
ectri
ficat
ion
inst
alle
d
0080
3%
of r
ural
hou
ses
with
net
wor
ked
elec
trific
atio
n
1%
0500
00Aff
orda
ble
Hou
sing f
or a
ll <i
nser
t cou
ntry
na
me>
ns
0501
00H
ousin
g de
velo
pmen
ts
are
ecol
ogic
ally
su
stai
nabl
e
0501
01H
ousin
g de
velo
pmen
ts
have
el
ectri
ficat
ion
inst
alle
d
0080
2%
of u
rban
hou
ses
with
net
wor
ked
elec
trific
atio
n
1%
0500
00Aff
orda
ble
Hou
sing f
or a
ll <i
nser
t cou
ntry
na
me>
ns
0502
00Co
mm
unity
de
velo
pmen
ts
are
soci
olog
ical
ly
aest
hetic
0502
00G
ener
al00
814
% o
f citi
es o
f 50
0,00
0 pe
ople
or
mor
e w
ith gr
een
and
publ
ic sp
aces
co
nstit
utin
g 30%
or
mor
e of
tota
l ur
ban
area
11.7
1%
99.9
0500
00Aff
orda
ble
Hou
sing f
or a
ll <i
nser
t cou
ntry
na
me>
ns
0502
00Co
mm
unity
de
velo
pmen
ts
are
soci
olog
ical
ly
aest
hetic
0502
00G
ener
al00
812
% o
f <in
sert
coun
try n
ame>
ns
livin
g in
squa
tter
settl
emen
ts
2%
0500
00Aff
orda
ble
Hou
sing f
or a
ll <i
nser
t cou
ntry
na
me>
ns
0502
00Co
mm
unity
de
velo
pmen
ts
are
soci
olog
ical
ly
aest
hetic
0502
00G
ener
al00
811
% o
f loc
al
gove
rnm
ent a
reas
w
ith sq
uatte
r se
ttlem
ents
2%
0500
00Aff
orda
ble
Hou
sing f
or a
ll <i
nser
t cou
ntry
na
me>
ns
0502
00Co
mm
unity
de
velo
pmen
ts
are
soci
olog
ical
ly
aest
hetic
0502
00G
ener
al00
813
% o
f urb
an
deve
lopm
ent
plan
s req
uirin
g a
min
imum
ratio
of
gree
n sp
ace
to c
omm
erci
al
deve
lopm
ent,
with
un
iver
sal a
cces
s
11.7
1%
99.9
cont
inue
d on
nex
t pag
e

174 Appendix 6
Code
Hig
h-Le
vel O
I G
roup
ing
Code
Leve
l 2 S
ecto
r OI
Gro
upin
gCo
deSu
b-ca
tego
ry
OI G
roup
ing
OI_
ID
(uni
que)
OI D
escr
iptio
nSD
G
Refe
renc
e
Targ
et
Max
or
Min
(2,1)
Uni
t of
mea
sure
Des
crip
tion
of ca
lcul
atio
n m
etho
dolo
gyTa
rget
2
016
Targ
et
201
7Ta
rget
2
018
Targ
et
201
9Ta
rget
2
030
12
34
56
78
910
1112
1314
1516
2805
0000
Affor
dabl
e H
ousin
g for
all
<ins
ert c
ount
ry
nam
e>ns
0502
00Co
mm
unity
de
velo
pmen
ts
are
soci
olog
ical
ly
aest
hetic
0502
00G
ener
al00
815
Aver
age
% o
f gr
een
and
publ
ic
open
spac
es w
ith
a hi
gher
inci
denc
e of
crim
e th
an th
e na
tiona
l ave
rage
11.7
2%
1
0500
00Aff
orda
ble
Hou
sing f
or a
ll <i
nser
t cou
ntry
na
me>
ns
0503
00<I
nser
t cou
ntry
na
me>
n ho
usin
g ha
s pip
ed w
ater
and
se
wag
e se
rvic
es
0503
01U
rban
hou
sing
has p
iped
po
tabl
e w
ater
0082
3%
of r
esid
ents
in
urb
an a
reas
w
ithin
5 m
inut
e w
alk t
o pi
ped
pota
ble
wat
er
1%
0500
00Aff
orda
ble
Hou
sing f
or a
ll <i
nser
t cou
ntry
na
me>
ns
0503
00<I
nser
t cou
ntry
na
me>
n ho
usin
g ha
s pip
ed w
ater
and
se
wag
e se
rvic
es
0503
01U
rban
hou
sing
has p
iped
po
tabl
e w
ater
0082
2%
of u
rban
ho
useh
olds
w
ith p
iped
po
tabl
e w
ater
1%
0500
00Aff
orda
ble
Hou
sing f
or a
ll <i
nser
t cou
ntry
na
me>
ns
0503
00<I
nser
t cou
ntry
na
me>
n ho
usin
g ha
s pip
ed w
ater
and
se
wag
e se
rvic
es
0503
02U
rban
hou
sing
has s
ewag
e se
rvic
es
inst
alle
d
0082
7%
of u
rban
ho
useh
olds
with
se
wag
e se
rvic
es
inst
alle
d
1%
0500
00Aff
orda
ble
Hou
sing f
or a
ll <i
nser
t cou
ntry
na
me>
ns
0503
00<I
nser
t cou
ntry
na
me>
n ho
usin
g ha
s pip
ed w
ater
and
se
wag
e se
rvic
es
0503
03Ru
ral h
ousin
g ha
s rea
dy a
cces
s to
pot
able
wat
er
0083
1%
of r
ural
ho
useh
olds
w
ith p
iped
po
tabl
e w
ater
1%
0500
00Aff
orda
ble
Hou
sing f
or a
ll <i
nser
t cou
ntry
na
me>
ns
0503
00<I
nser
t cou
ntry
na
me>
n ho
usin
g ha
s pip
ed w
ater
and
se
wag
e se
rvic
es
0503
03Ru
ral h
ousin
g ha
s rea
dy a
cces
s to
pot
able
wat
er
0083
2%
of r
ural
resid
ents
w
ithin
5 m
inut
e w
alk t
o pi
ped
pota
ble
wat
er
1%
0500
00Aff
orda
ble
Hou
sing f
or a
ll <i
nser
t cou
ntry
na
me>
ns
0503
00<I
nser
t cou
ntry
na
me>
n ho
usin
g ha
s pip
ed w
ater
and
se
wag
e se
rvic
es
0503
04Ru
ral h
ousin
g ha
s ins
talle
d se
wag
e se
rvic
es
0083
6%
of r
ural
ho
useh
olds
with
se
wag
e se
rvic
es
inst
alle
d
1%
0500
00Aff
orda
ble
Hou
sing f
or a
ll <i
nser
t cou
ntry
na
me>
ns
0504
00U
rban
stre
ets
have
eco
logi
cally
su
stai
nabl
e lig
htin
g
0504
00G
ener
al01
647
0600
00H
ealth
y <i
nser
t cou
ntry
na
me>
ns
0600
00G
ener
al06
0000
0084
7M
ater
nal m
orta
lity
rate
per
1,00
0 liv
e bi
rths
0600
00H
ealth
y <i
nser
t cou
ntry
na
me>
ns
0600
00G
ener
al06
0000
0084
8In
fant
mor
talit
y ra
te p
er 1,
000
live
birth
s
0600
00H
ealth
y <i
nser
t cou
ntry
na
me>
ns
0600
00G
ener
al06
0000
0084
9M
alar
ia m
orbi
dity
ra
te p
er 10
0,00
0
cont
inue
d on
nex
t pag
e

An Outcome Classification System with Outcome Indicators 175
Code
Hig
h-Le
vel O
I G
roup
ing
Code
Leve
l 2 S
ecto
r OI
Gro
upin
gCo
deSu
b-ca
tego
ry
OI G
roup
ing
OI_
ID
(uni
que)
OI D
escr
iptio
nSD
G
Refe
renc
e
Targ
et
Max
or
Min
(2,1)
Uni
t of
mea
sure
Des
crip
tion
of ca
lcul
atio
n m
etho
dolo
gyTa
rget
2
016
Targ
et
201
7Ta
rget
2
018
Targ
et
201
9Ta
rget
2
030
12
34
56
78
910
1112
1314
1516
2806
0000
Hea
lthy
<ins
ert c
ount
ry
nam
e>ns
0600
00G
ener
al06
0000
0085
0Ra
te o
f mal
aria
m
orta
lity p
er
100,
000
0600
00H
ealth
y <i
nser
t cou
ntry
na
me>
ns
0600
00G
ener
al06
0000
0085
1Ra
te o
f tu
berc
ulos
is in
cide
nce
per
100,
000
0600
00H
ealth
y <i
nser
t cou
ntry
na
me>
ns
0600
00G
ener
al06
0000
0085
2Ra
te o
f tu
berc
ulos
is m
orta
lity p
er
100,
000
0600
00H
ealth
y <i
nser
t cou
ntry
na
me>
ns
0601
00H
ighl
y reg
arde
d ho
spita
l fac
ilitie
s06
0100
Gen
eral
0165
5%
of <
inse
rt co
untry
nam
e>ns
w
ho ra
te th
e qu
ality
of h
ospi
tal
serv
ices
as g
ood
or b
ette
r
1%
0600
00H
ealth
y <i
nser
t cou
ntry
na
me>
ns
0601
00H
ighl
y reg
arde
d ho
spita
l fac
ilitie
s06
0100
Gen
eral
0165
6%
of <
inse
rt co
untry
nam
e>ns
w
ho ra
te th
e qu
ality
of h
ospi
tal
faci
litie
s as
good
or b
ette
r
1%
0600
00H
ealth
y <i
nser
t cou
ntry
na
me>
ns
0602
00H
ighl
y reg
arde
d pu
blic
hea
lth se
rvic
es06
0200
Gen
eral
0087
6%
of c
hild
ren
2 ye
ars a
nd u
nder
th
at a
re a
sses
sed
with
stun
ting
2%
0600
00H
ealth
y <i
nser
t cou
ntry
na
me>
ns
0602
00H
ighl
y reg
arde
d pu
blic
hea
lth se
rvic
es06
0200
Gen
eral
0089
5%
of <
inse
rt co
untry
nam
e>ns
th
at p
ract
ice
fam
ily p
lann
ing
3.7
1%
99.9
0600
00H
ealth
y <i
nser
t cou
ntry
na
me>
ns
0602
00H
ighl
y reg
arde
d pu
blic
hea
lth se
rvic
es06
0200
Gen
eral
0089
6%
of <
inse
rt co
untry
nam
e>ns
w
ith a
cces
s to
univ
ersa
l sex
ual
and
repr
oduc
tive
heal
th in
form
atio
n an
d ed
ucat
ion
sche
mes
3.7
1%
99.9
cont
inue
d on
nex
t pag
e

176 Appendix 6
Code
Hig
h-Le
vel O
I G
roup
ing
Code
Leve
l 2 S
ecto
r OI
Gro
upin
gCo
deSu
b-ca
tego
ry
OI G
roup
ing
OI_
ID
(uni
que)
OI D
escr
iptio
nSD
G
Refe
renc
e
Targ
et
Max
or
Min
(2,1)
Uni
t of
mea
sure
Des
crip
tion
of ca
lcul
atio
n m
etho
dolo
gyTa
rget
2
016
Targ
et
201
7Ta
rget
2
018
Targ
et
201
9Ta
rget
2
030
12
34
56
78
910
1112
1314
1516
2806
0000
Hea
lthy
<ins
ert c
ount
ry
nam
e>ns
0602
00H
ighl
y reg
arde
d pu
blic
hea
lth se
rvic
es06
0200
Gen
eral
0090
4%
of m
edic
ines
an
d va
ccin
es th
at
are
subj
ect t
o on
e or
mor
e re
gula
tory
in
terv
entio
ns
that
limit
thei
r im
porta
tion,
in
cont
rave
ntio
n to
the
Doh
a D
ecla
ratio
n on
the
TRIP
S A
gree
men
t an
d Pu
blic
Hea
lth
2%
.01
0600
00H
ealth
y <i
nser
t cou
ntry
na
me>
ns
0602
00H
ighl
y reg
arde
d pu
blic
hea
lth se
rvic
es06
0200
Gen
eral
0001
2%
of p
eopl
e su
fferin
g m
alnu
tritio
n in
any
year
2.2
2%
10
0600
00H
ealth
y <i
nser
t cou
ntry
na
me>
ns
0602
00H
ighl
y reg
arde
d pu
blic
hea
lth se
rvic
es06
0200
Gen
eral
0089
7%
of p
opul
atio
n co
vere
d by
hea
lth
insu
ranc
e
3.8
1%
99.9
0600
00H
ealth
y <i
nser
t cou
ntry
na
me>
ns
0602
00H
ighl
y reg
arde
d pu
blic
hea
lth se
rvic
es06
0200
Gen
eral
0089
8%
of p
opul
atio
n co
vere
d un
der
univ
ersa
l hea
lth
finan
cial
risk
pr
otec
tion
(hea
lth
insu
ranc
e)
3.8
1%
99.9
0600
00H
ealth
y <i
nser
t cou
ntry
na
me>
ns
0602
00H
ighl
y reg
arde
d pu
blic
hea
lth se
rvic
es06
0200
Gen
eral
0090
1%
of p
opul
atio
n w
ith a
cces
s to
ess
entia
l m
edic
ines
and
va
ccin
es
3.8
1%
99.9
0600
00H
ealth
y <i
nser
t cou
ntry
na
me>
ns
0602
00H
ighl
y reg
arde
d pu
blic
hea
lth se
rvic
es06
0200
Gen
eral
0089
9%
of p
opul
atio
n w
ith a
cces
s to
qual
ity e
ssen
tial
heal
th-c
are
serv
ices
[nee
d to
de
fine
“qua
lity”
]
3.8
1%
99.9
0600
00H
ealth
y <i
nser
t cou
ntry
na
me>
ns
0602
00H
ighl
y reg
arde
d pu
blic
hea
lth se
rvic
es06
0200
Gen
eral
0087
9%
of p
regn
ant
wom
en su
fferin
g fro
m o
ne o
r m
ore
nutri
tiona
l de
ficie
ncie
s
2%
0600
00H
ealth
y <i
nser
t cou
ntry
na
me>
ns
0602
00H
ighl
y reg
arde
d pu
blic
hea
lth se
rvic
es06
0200
Gen
eral
0090
5Av
erag
e %
cha
nge
in h
ealth
fina
ncin
g3.
c1
%10
cont
inue
d on
nex
t pag
e

An Outcome Classification System with Outcome Indicators 177
Code
Hig
h-Le
vel O
I G
roup
ing
Code
Leve
l 2 S
ecto
r OI
Gro
upin
gCo
deSu
b-ca
tego
ry
OI G
roup
ing
OI_
ID
(uni
que)
OI D
escr
iptio
nSD
G
Refe
renc
e
Targ
et
Max
or
Min
(2,1)
Uni
t of
mea
sure
Des
crip
tion
of ca
lcul
atio
n m
etho
dolo
gyTa
rget
2
016
Targ
et
201
7Ta
rget
2
018
Targ
et
201
9Ta
rget
2
030
12
34
56
78
910
1112
1314
1516
2806
0000
Hea
lthy
<ins
ert c
ount
ry
nam
e>ns
0602
00H
ighl
y reg
arde
d pu
blic
hea
lth se
rvic
es06
0200
Gen
eral
0090
6Av
erag
e %
ch
ange
in h
ealth
w
orkf
orce
nu
mbe
rs
3.c
1%
10
0600
00H
ealth
y <i
nser
t cou
ntry
na
me>
ns
0602
00H
ighl
y reg
arde
d pu
blic
hea
lth se
rvic
es06
0200
Gen
eral
0090
3Av
erag
e %
ch
ange
in p
ublic
ex
pend
iture
(rea
l) on
Uni
ted
Nat
ions
CO
FOG
cod
e 07
.05
(Hea
lth
Rese
arch
and
D
evel
opm
ent)
3.b
1%
0.1
0600
00H
ealth
y <i
nser
t cou
ntry
na
me>
ns
0602
00H
ighl
y reg
arde
d pu
blic
hea
lth se
rvic
es06
0200
Gen
eral
0088
6Av
erag
e %
cha
nge
in th
e in
cide
nce
of H
IV/A
IDS
3.3
2%
-10
0600
00H
ealth
y <i
nser
t cou
ntry
na
me>
ns
0602
00H
ighl
y reg
arde
d pu
blic
hea
lth se
rvic
es06
0200
Gen
eral
0089
2Av
erag
e %
cha
nge
in th
e in
cide
nce
of c
omm
unic
able
di
seas
es
3.3
2%
-10
0600
00H
ealth
y <i
nser
t cou
ntry
na
me>
ns
0602
00H
ighl
y reg
arde
d pu
blic
hea
lth se
rvic
es06
0200
Gen
eral
0089
0Av
erag
e %
cha
nge
in th
e in
cide
nce
of h
epat
itis
3.3
2%
-10
0600
00H
ealth
y <i
nser
t cou
ntry
na
me>
ns
0602
00H
ighl
y reg
arde
d pu
blic
hea
lth se
rvic
es06
0200
Gen
eral
0088
8Av
erag
e %
cha
nge
in th
e in
cide
nce
of m
alar
ia
3.3
2%
-10
0600
00H
ealth
y <i
nser
t cou
ntry
na
me>
ns
0602
00H
ighl
y reg
arde
d pu
blic
hea
lth se
rvic
es06
0200
Gen
eral
0088
9Av
erag
e %
cha
nge
in th
e in
cide
nce
of
negl
ecte
d tro
pica
l di
seas
es (W
hat
dise
ases
? Thi
s m
ust b
e de
fined
.)
3.3
2%
-10
0600
00H
ealth
y <i
nser
t cou
ntry
na
me>
ns
0602
00H
ighl
y reg
arde
d pu
blic
hea
lth se
rvic
es06
0200
Gen
eral
0089
1Av
erag
e %
cha
nge
in th
e in
cide
nce
of w
ater
-bor
ne
dise
ases
3.3
2%
-10
0600
00H
ealth
y <i
nser
t cou
ntry
na
me>
ns
0602
00H
ighl
y reg
arde
d pu
blic
hea
lth se
rvic
es06
0200
Gen
eral
0088
0Av
erag
e %
of
child
ren
less
th
an 5
year
s old
su
fferin
g fro
m
stun
ted
grow
th
2.2
2%
0600
00H
ealth
y <i
nser
t cou
ntry
na
me>
ns
0602
00H
ighl
y reg
arde
d pu
blic
hea
lth se
rvic
es06
0200
Gen
eral
0088
1Av
erag
e %
of
child
ren
less
th
an 5
year
s ol
d su
fferin
g fro
m w
astin
g
2.2
2%
cont
inue
d on
nex
t pag
e

178 Appendix 6
Code
Hig
h-Le
vel O
I G
roup
ing
Code
Leve
l 2 S
ecto
r OI
Gro
upin
gCo
deSu
b-ca
tego
ry
OI G
roup
ing
OI_
ID
(uni
que)
OI D
escr
iptio
nSD
G
Refe
renc
e
Targ
et
Max
or
Min
(2,1)
Uni
t of
mea
sure
Des
crip
tion
of ca
lcul
atio
n m
etho
dolo
gyTa
rget
2
016
Targ
et
201
7Ta
rget
2
018
Targ
et
201
9Ta
rget
2
030
12
34
56
78
910
1112
1314
1516
2806
0000
Hea
lthy <
inse
rt co
untry
nam
e>
0602
00H
ighl
y reg
arde
d pu
blic
hea
lth se
rvic
es06
0200
Gen
eral
0090
2Av
erag
e %
of
peo
ple
who
rece
ive
vacc
inat
ions
w
here
one
or m
ore
of th
e va
ccin
atio
ns
fails
to va
ccin
ate
3.8
2%
0.1
0600
00H
ealth
y <in
sert
coun
try n
ame>
06
0200
Hig
hly r
egar
ded
publ
ic h
ealth
serv
ices
0602
00G
ener
al00
900
Aver
age
estim
ated
%
of p
eopl
e w
ho ra
te th
e av
aila
ble
esse
ntia
l he
alth
-car
e se
rvic
es a
s goo
d qu
ality
or b
ette
r
3.8
1%
99.9
0600
00H
ealth
y <in
sert
coun
try n
ame>
06
0200
Hig
hly r
egar
ded
publ
ic h
ealth
serv
ices
0602
00G
ener
al00
887
Aver
ge %
cha
nge
in th
e in
cide
nce
of tu
berc
ulos
is
3.3
2%
-10
0600
00H
ealth
y <in
sert
coun
try n
ame>
06
0200
Hig
hly r
egar
ded
publ
ic h
ealth
serv
ices
0602
00G
ener
al00
893
Chan
ge in
pr
emat
ure
mor
talit
y fro
m
nonc
omm
unic
able
di
seas
es
3.4.
12
%-3
3
0600
00H
ealth
y <in
sert
coun
try n
ame>
06
0200
Hig
hly r
egar
ded
publ
ic h
ealth
serv
ices
0602
00G
ener
al00
882
Estim
ated
aver
age
% o
f ado
lesc
ent
girls
suffe
ring
from
one
or
mor
e nu
tritio
nal
defic
ienc
y
2.2
2%
0600
00H
ealth
y <in
sert
coun
try n
ame>
06
0200
Hig
hly r
egar
ded
publ
ic h
ealth
serv
ices
0602
00G
ener
al00
883
Estim
ated
aver
age
% o
f lac
tatin
g w
omen
suffe
ring
from
one
or
mor
e nu
tritio
nal
defic
ienc
y
2.2
2%
0600
00H
ealth
y <in
sert
coun
try n
ame>
06
0200
Hig
hly r
egar
ded
publ
ic h
ealth
serv
ices
0602
00G
ener
al00
884
Estim
ated
aver
age
% o
f old
er p
erso
ns
suffe
ring f
rom
one
or
mor
e nu
tritio
nal
defic
ienc
y (H
ow
do yo
u de
fine
“old
er p
erso
n”
from
one
soci
ety
to a
noth
er?)
2.2
2%
cont
inue
d on
nex
t pag
e
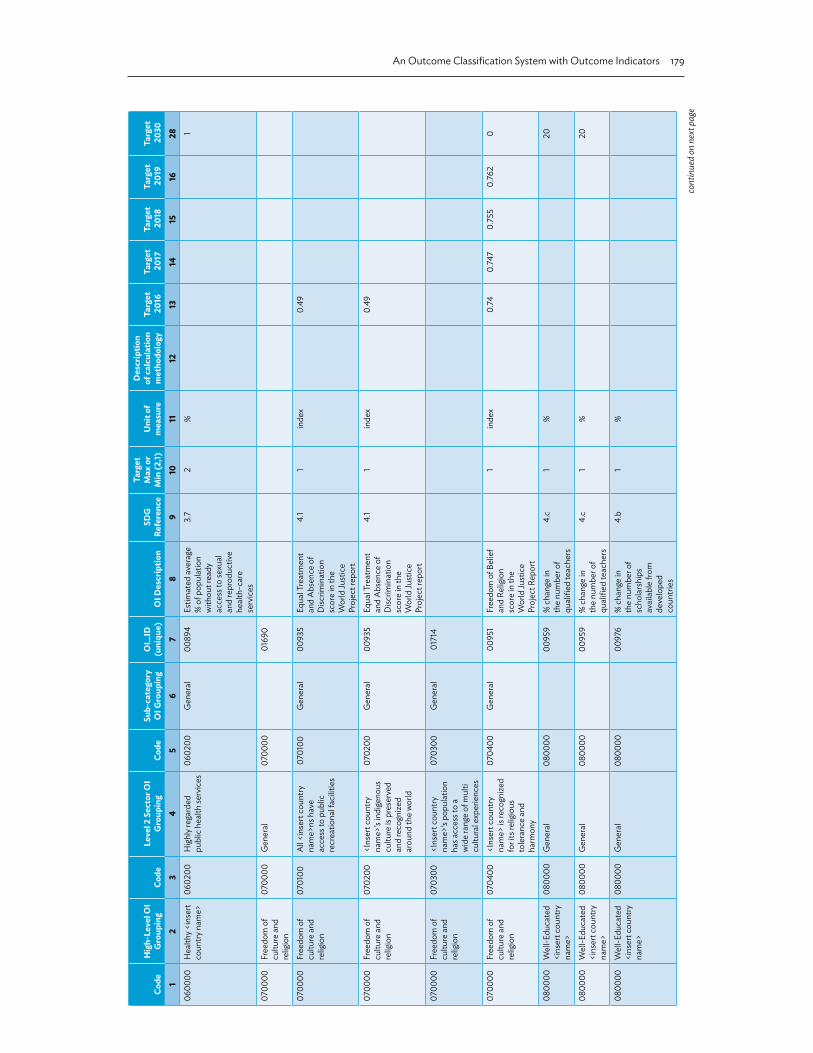
An Outcome Classification System with Outcome Indicators 179
Code
Hig
h-Le
vel O
I G
roup
ing
Code
Leve
l 2 S
ecto
r OI
Gro
upin
gCo
deSu
b-ca
tego
ry
OI G
roup
ing
OI_
ID
(uni
que)
OI D
escr
iptio
nSD
G
Refe
renc
e
Targ
et
Max
or
Min
(2,1)
Uni
t of
mea
sure
Des
crip
tion
of ca
lcul
atio
n m
etho
dolo
gyTa
rget
2
016
Targ
et
201
7Ta
rget
2
018
Targ
et
201
9Ta
rget
2
030
12
34
56
78
910
1112
1314
1516
2806
0000
Hea
lthy <
inse
rt co
untry
nam
e>
0602
00H
ighl
y reg
arde
d pu
blic
hea
lth se
rvic
es06
0200
Gen
eral
0089
4Es
timat
ed av
erag
e %
of p
opul
atio
n w
ithou
t rea
dy
acce
ss to
sexu
al
and
repr
oduc
tive
heal
th-c
are
serv
ices
3.7
2%
1
0700
00Fr
eedo
m o
f cu
lture
and
re
ligio
n
0700
00G
ener
al07
0000
0169
0
0700
00Fr
eedo
m o
f cu
lture
and
re
ligio
n
0701
00A
ll <in
sert
coun
try
nam
e>ns
hav
e ac
cess
to p
ublic
re
crea
tiona
l fac
ilitie
s
0701
00G
ener
al00
935
Equa
l Tre
atm
ent
and
Abs
ence
of
Disc
rimin
atio
n sc
ore
in th
e W
orld
Just
ice
Proj
ect r
epor
t
4.1
1in
dex
0.49
0700
00Fr
eedo
m o
f cu
lture
and
re
ligio
n
0702
00<I
nser
t cou
ntry
na
me>
’s in
dige
nous
cu
lture
is p
rese
rved
an
d re
cogn
ized
arou
nd th
e w
orld
0702
00G
ener
al00
935
Equa
l Tre
atm
ent
and
Abs
ence
of
Disc
rimin
atio
n sc
ore
in th
e W
orld
Just
ice
Proj
ect r
epor
t
4.1
1in
dex
0.49
0700
00Fr
eedo
m o
f cu
lture
and
re
ligio
n
0703
00<I
nser
t cou
ntry
na
me>
’s po
pula
tion
has a
cces
s to
a w
ide
rang
e of
mul
ti cu
ltura
l exp
erie
nces
0703
00G
ener
al01
714
0700
00Fr
eedo
m o
f cu
lture
and
re
ligio
n
0704
00<I
nser
t cou
ntry
na
me>
is re
cogn
ized
for i
ts re
ligio
us
tole
ranc
e an
d ha
rmon
y
0704
00G
ener
al00
951
Free
dom
of B
elie
f an
d Re
ligio
n sc
ore
in th
e W
orld
Just
ice
Proj
ect R
epor
t
1in
dex
0.74
0.74
70.
755
0.76
20
0800
00W
ell-E
duca
ted
<ins
ert c
ount
ry
nam
e>
0800
00G
ener
al08
0000
0095
9%
cha
nge
in
the
num
ber o
f qu
alifi
ed te
ache
rs
4.c
1%
20
0800
00W
ell-E
duca
ted
<ins
ert c
ount
ry
nam
e>
0800
00G
ener
al08
0000
0095
9%
cha
nge
in
the
num
ber o
f qu
alifi
ed te
ache
rs
4.c
1%
20
0800
00W
ell-E
duca
ted
<ins
ert c
ount
ry
nam
e>
0800
00G
ener
al08
0000
0097
6%
cha
nge
in
the
num
ber o
f sc
hola
rshi
ps
avai
labl
e fro
m
deve
lope
d co
untri
es
4.b
1%
cont
inue
d on
nex
t pag
e

180 Appendix 6
Code
Hig
h-Le
vel O
I G
roup
ing
Code
Leve
l 2 S
ecto
r OI
Gro
upin
gCo
deSu
b-ca
tego
ry
OI G
roup
ing
OI_
ID
(uni
que)
OI D
escr
iptio
nSD
G
Refe
renc
e
Targ
et
Max
or
Min
(2,1)
Uni
t of
mea
sure
Des
crip
tion
of ca
lcul
atio
n m
etho
dolo
gyTa
rget
2
016
Targ
et
201
7Ta
rget
2
018
Targ
et
201
9Ta
rget
2
030
12
34
56
78
910
1112
1314
1516
2808
0000
Wel
l-Edu
cate
d <i
nser
t cou
ntry
na
me>
0800
00G
ener
al08
0000
0096
0%
cha
nge
in
the
num
ber o
f te
ache
rs tr
aine
d by
inte
rnat
iona
l do
nor c
oope
ratio
n
4.c
1%
20
0800
00W
ell-E
duca
ted
<ins
ert c
ount
ry
nam
e>
0800
00G
ener
al08
0000
0096
0%
cha
nge
in
the
num
ber o
f te
ache
rs tr
aine
d by
inte
rnat
iona
l do
nor c
oope
ratio
n
4.c
1%
20
0800
00W
ell-E
duca
ted
<ins
ert c
ount
ry
nam
e>
0800
00G
ener
al08
0000
0096
7%
of a
dults
as
sess
ed a
s fu
nctio
nally
lit
erat
e or
bet
ter
1%
0800
00W
ell-E
duca
ted
<ins
ert c
ount
ry
nam
e>
0800
00G
ener
al08
0000
0097
0Av
erag
e %
fem
ale
adul
t lite
racy
(as
mea
sure
d us
ing
wha
t tes
t?)
4.6
1%
60
0800
00W
ell-E
duca
ted
<ins
ert c
ount
ry
nam
e>
0800
00G
ener
al08
0000
0097
1Av
erag
e %
ch
ange
in m
ale
adul
t lite
racy
(as
mea
sure
d us
ing
wha
t tes
t?)
4.6
1%
60
0800
00W
ell-E
duca
ted
<ins
ert c
ount
ry
nam
e>
0800
00G
ener
al08
0000
0097
4Av
erag
e %
fem
ale
adul
t num
erac
y (a
s mea
sure
d us
ing w
hat t
est?
)
4.6
1%
60
0800
00W
ell-E
duca
ted
<ins
ert c
ount
ry
nam
e>
0800
00G
ener
al08
0000
0096
8Av
erag
e %
fem
ale
yout
h lit
erac
y ra
tes (
as m
easu
red
usin
g wha
t tes
t?)
4.6
1%
100
0800
00W
ell-E
duca
ted
<ins
ert c
ount
ry
nam
e>
0800
00G
ener
al08
0000
0097
2Av
erag
e %
fem
ale
yout
h nu
mer
acy
(as m
easu
red
usin
g wha
t tes
t?)
4.6
1%
99.9
0800
00W
ell-E
duca
ted
<ins
ert c
ount
ry
nam
e>
0800
00G
ener
al08
0000
0097
5Av
erag
e %
mal
e ad
ult n
umer
acy
(as m
easu
red
usin
g wha
t tes
t?)
4.6
1%
60
0800
00W
ell-E
duca
ted
<ins
ert c
ount
ry
nam
e>
0800
00G
ener
al08
0000
0096
9Av
erag
e %
mal
e yo
uth
liter
acy
rate
s (as
mea
sure
d us
ing w
hat t
est?
)
4.6
1%
100
cont
inue
d on
nex
t pag
e
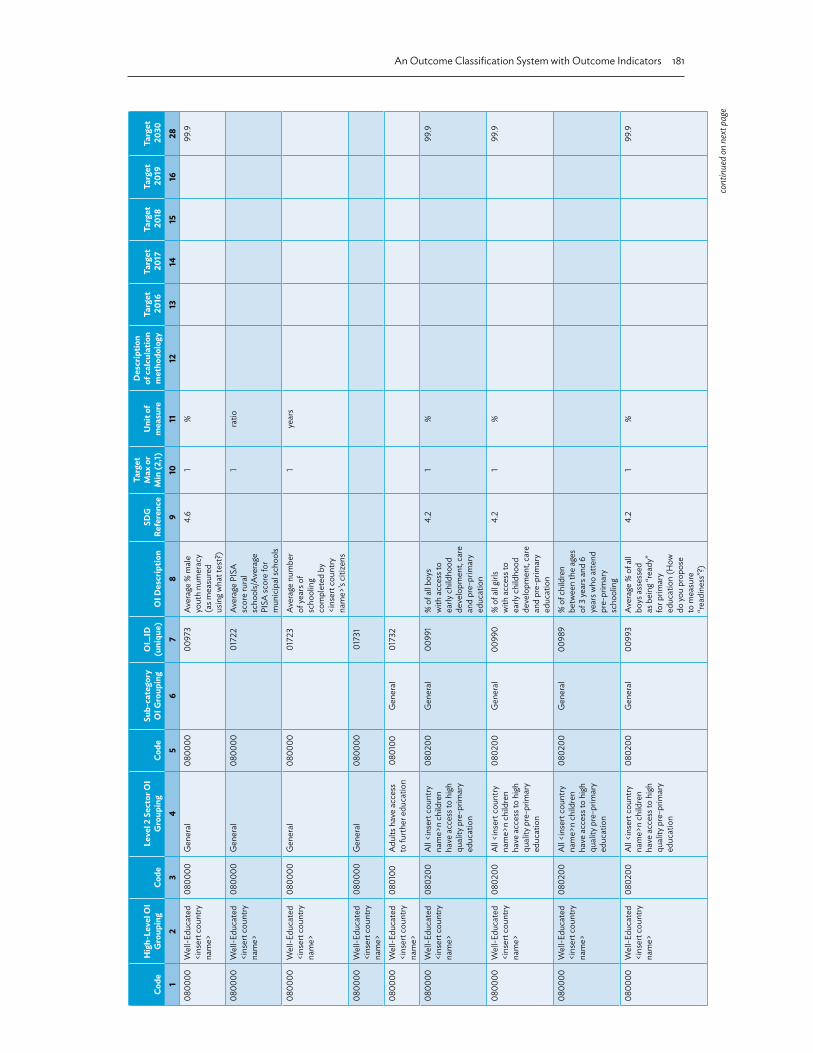
An Outcome Classification System with Outcome Indicators 181
Code
Hig
h-Le
vel O
I G
roup
ing
Code
Leve
l 2 S
ecto
r OI
Gro
upin
gCo
deSu
b-ca
tego
ry
OI G
roup
ing
OI_
ID
(uni
que)
OI D
escr
iptio
nSD
G
Refe
renc
e
Targ
et
Max
or
Min
(2,1)
Uni
t of
mea
sure
Des
crip
tion
of ca
lcul
atio
n m
etho
dolo
gyTa
rget
2
016
Targ
et
201
7Ta
rget
2
018
Targ
et
201
9Ta
rget
2
030
12
34
56
78
910
1112
1314
1516
2808
0000
Wel
l-Edu
cate
d <i
nser
t cou
ntry
na
me>
0800
00G
ener
al08
0000
0097
3Av
erag
e %
mal
e yo
uth
num
erac
y (a
s mea
sure
d us
ing w
hat t
est?
)
4.6
1%
99.9
0800
00W
ell-E
duca
ted
<ins
ert c
ount
ry
nam
e>
0800
00G
ener
al08
0000
0172
2Av
erag
e PI
SA
scor
e ru
ral
scho
ols/
Aver
age
PISA
scor
e fo
r m
unic
ipal
scho
ols
1ra
tio
0800
00W
ell-E
duca
ted
<ins
ert c
ount
ry
nam
e>
0800
00G
ener
al08
0000
0172
3Av
erag
e nu
mbe
r of
year
s of
scho
olin
g co
mpl
eted
by
<ins
ert c
ount
ry
nam
e>’s
citiz
ens
1ye
ars
0800
00W
ell-E
duca
ted
<ins
ert c
ount
ry
nam
e>
0800
00G
ener
al08
0000
0173
1
0800
00W
ell-E
duca
ted
<ins
ert c
ount
ry
nam
e>
0801
00A
dults
hav
e ac
cess
to
furth
er e
duca
tion
0801
00G
ener
al
0173
2
0800
00W
ell-E
duca
ted
<ins
ert c
ount
ry
nam
e>
0802
00A
ll <in
sert
coun
try
nam
e>n
child
ren
have
acc
ess t
o hi
gh
qual
ity p
re-p
rimar
y ed
ucat
ion
0802
00G
ener
al00
991
% o
f all b
oys
with
acc
ess t
o ea
rly c
hild
hood
de
velo
pmen
t, ca
re
and
pre-
prim
ary
educ
atio
n
4.2
1%
99.9
0800
00W
ell-E
duca
ted
<ins
ert c
ount
ry
nam
e>
0802
00A
ll <in
sert
coun
try
nam
e>n
child
ren
have
acc
ess t
o hi
gh
qual
ity p
re-p
rimar
y ed
ucat
ion
0802
00G
ener
al00
990
% o
f all g
irls
with
acc
ess t
o ea
rly c
hild
hood
de
velo
pmen
t, ca
re
and
pre-
prim
ary
educ
atio
n
4.2
1%
99.9
0800
00W
ell-E
duca
ted
<ins
ert c
ount
ry
nam
e>
0802
00A
ll <in
sert
coun
try
nam
e>n
child
ren
have
acc
ess t
o hi
gh
qual
ity p
re-p
rimar
y ed
ucat
ion
0802
00G
ener
al00
989
% o
f chi
ldre
n be
twee
n th
e ag
es
of 3
year
s and
6
year
s who
atte
nd
pre-
prim
ary
scho
olin
g
0800
00W
ell-E
duca
ted
<ins
ert c
ount
ry
nam
e>
0802
00A
ll <in
sert
coun
try
nam
e>n
child
ren
have
acc
ess t
o hi
gh
qual
ity p
re-p
rimar
y ed
ucat
ion
0802
00G
ener
al00
993
Aver
age
% o
f all
boys
ass
esse
d as
bei
ng “r
eady
” fo
r prim
ary
educ
atio
n (H
ow
do yo
u pr
opos
e to
mea
sure
“r
eadi
ness
”?)
4.2
1%
99.9
cont
inue
d on
nex
t pag
e
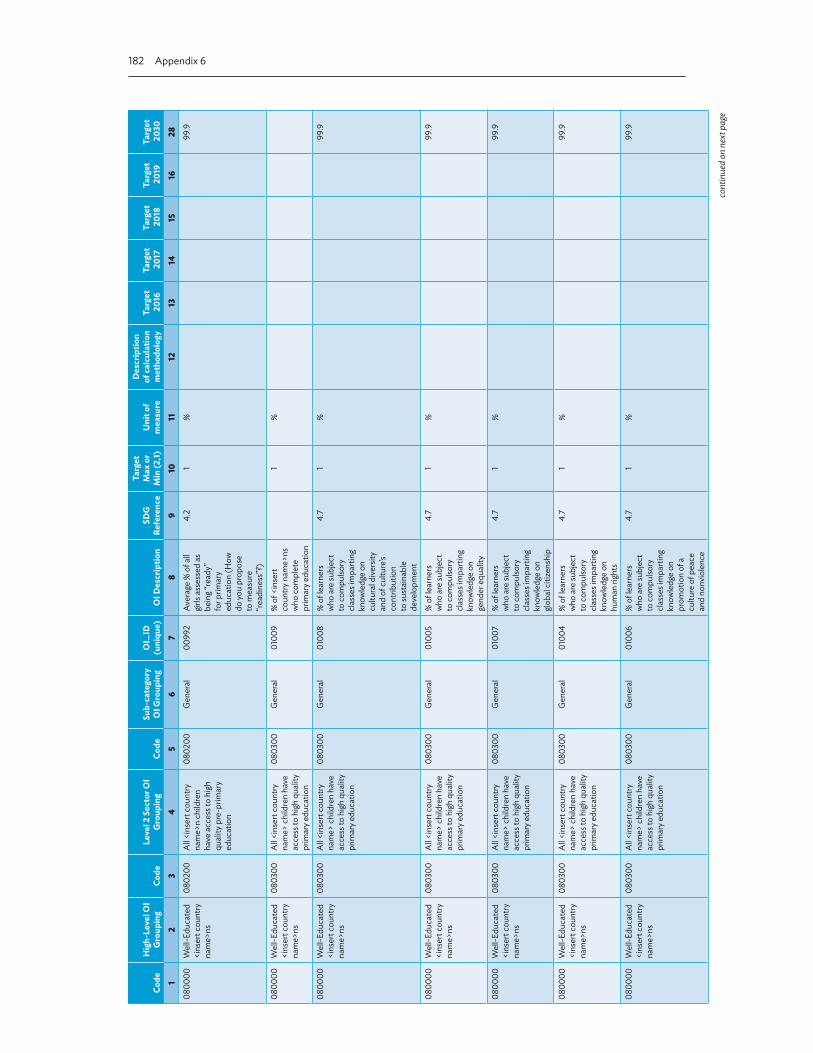
182 Appendix 6
Code
Hig
h-Le
vel O
I G
roup
ing
Code
Leve
l 2 S
ecto
r OI
Gro
upin
gCo
deSu
b-ca
tego
ry
OI G
roup
ing
OI_
ID
(uni
que)
OI D
escr
iptio
nSD
G
Refe
renc
e
Targ
et
Max
or
Min
(2,1)
Uni
t of
mea
sure
Des
crip
tion
of ca
lcul
atio
n m
etho
dolo
gyTa
rget
2
016
Targ
et
201
7Ta
rget
2
018
Targ
et
201
9Ta
rget
2
030
12
34
56
78
910
1112
1314
1516
2808
0000
Wel
l-Edu
cate
d <i
nser
t cou
ntry
na
me>
ns
0802
00A
ll <in
sert
coun
try
nam
e>n
child
ren
have
acc
ess t
o hi
gh
qual
ity p
re-p
rimar
y ed
ucat
ion
0802
00G
ener
al00
992
Aver
age
% o
f all
girls
ass
esse
d as
be
ing “
read
y”
for p
rimar
y ed
ucat
ion
(How
do
you
prop
ose
to m
easu
re
“rea
dine
ss”?
)
4.2
1%
99.9
0800
00W
ell-E
duca
ted
<ins
ert c
ount
ry
nam
e>ns
0803
00A
ll <in
sert
coun
try
nam
e> c
hild
ren
have
ac
cess
to h
igh
qual
ity
prim
ary e
duca
tion
0803
00G
ener
al01
009
% o
f <in
sert
coun
try n
ame>
ns
who
com
plet
e pr
imar
y edu
catio
n
1%
0800
00W
ell-E
duca
ted
<ins
ert c
ount
ry
nam
e>ns
0803
00A
ll <in
sert
coun
try
nam
e> c
hild
ren
have
ac
cess
to h
igh
qual
ity
prim
ary e
duca
tion
0803
00G
ener
al01
008
% o
f lea
rner
s w
ho a
re su
bjec
t to
com
pulso
ry
clas
ses i
mpa
rting
kn
owle
dge
on
cultu
ral d
iver
sity
and
of c
ultu
re’s
cont
ribut
ion
to su
stai
nabl
e de
velo
pmen
t
4.7
1%
99.9
0800
00W
ell-E
duca
ted
<ins
ert c
ount
ry
nam
e>ns
0803
00A
ll <in
sert
coun
try
nam
e> c
hild
ren
have
ac
cess
to h
igh
qual
ity
prim
ary e
duca
tion
0803
00G
ener
al01
005
% o
f lea
rner
s w
ho a
re su
bjec
t to
com
pulso
ry
clas
ses i
mpa
rting
kn
owle
dge
on
gend
er e
qual
ity
4.7
1%
99.9
0800
00W
ell-E
duca
ted
<ins
ert c
ount
ry
nam
e>ns
0803
00A
ll <in
sert
coun
try
nam
e> c
hild
ren
have
ac
cess
to h
igh
qual
ity
prim
ary e
duca
tion
0803
00G
ener
al01
007
% o
f lea
rner
s w
ho a
re su
bjec
t to
com
pulso
ry
clas
ses i
mpa
rting
kn
owle
dge
on
glob
al c
itize
nshi
p
4.7
1%
99.9
0800
00W
ell-E
duca
ted
<ins
ert c
ount
ry
nam
e>ns
0803
00A
ll <in
sert
coun
try
nam
e> c
hild
ren
have
ac
cess
to h
igh
qual
ity
prim
ary e
duca
tion
0803
00G
ener
al01
004
% o
f lea
rner
s w
ho a
re su
bjec
t to
com
pulso
ry
clas
ses i
mpa
rting
kn
owle
dge
on
hum
an ri
ghts
4.7
1%
99.9
0800
00W
ell-E
duca
ted
<ins
ert c
ount
ry
nam
e>ns
0803
00A
ll <in
sert
coun
try
nam
e> c
hild
ren
have
ac
cess
to h
igh
qual
ity
prim
ary e
duca
tion
0803
00G
ener
al01
006
% o
f lea
rner
s w
ho a
re su
bjec
t to
com
pulso
ry
clas
ses i
mpa
rting
kn
owle
dge
on
prom
otio
n of
a
cultu
re o
f pea
ce
and
nonv
iole
nce
4.7
1%
99.9
cont
inue
d on
nex
t pag
e

An Outcome Classification System with Outcome Indicators 183
Code
Hig
h-Le
vel O
I G
roup
ing
Code
Leve
l 2 S
ecto
r OI
Gro
upin
gCo
deSu
b-ca
tego
ry
OI G
roup
ing
OI_
ID
(uni
que)
OI D
escr
iptio
nSD
G
Refe
renc
e
Targ
et
Max
or
Min
(2,1)
Uni
t of
mea
sure
Des
crip
tion
of ca
lcul
atio
n m
etho
dolo
gyTa
rget
2
016
Targ
et
201
7Ta
rget
2
018
Targ
et
201
9Ta
rget
2
030
12
34
56
78
910
1112
1314
1516
2808
0000
Wel
l-Edu
cate
d <i
nser
t cou
ntry
na
me>
ns
0803
00A
ll <in
sert
coun
try
nam
e> c
hild
ren
have
ac
cess
to h
igh
qual
ity
prim
ary e
duca
tion
0803
00G
ener
al01
003
% o
f prim
ary
scho
ol le
arne
rs
who
by t
he e
nd
of ye
ar 7
hav
e be
en su
bjec
t to
com
pulso
ry
clas
ses t
hat
impa
rt kn
owle
dge
on su
stai
nabl
e de
velo
pmen
t
4.7
1%
99.9
0800
00W
ell-E
duca
ted
<ins
ert c
ount
ry
nam
e>ns
0803
00A
ll <in
sert
coun
try
nam
e> c
hild
ren
have
ac
cess
to h
igh
qual
ity
prim
ary e
duca
tion
0803
00G
ener
al01
002
% o
f stu
dent
s tha
t ha
ve a
cces
s to
free
prim
ary e
duca
tion
4.1
1%
99.9
0800
00W
ell-E
duca
ted
<ins
ert c
ount
ry
nam
e>ns
0803
00A
ll <in
sert
coun
try
nam
e> c
hild
ren
have
ac
cess
to h
igh
qual
ity
prim
ary e
duca
tion
0803
00G
ener
al01
001
Aver
age
% o
f boy
s th
at c
ompl
ete
prim
ary e
duca
tion
4.1
1%
99.9
0800
00W
ell-E
duca
ted
<ins
ert c
ount
ry
nam
e>ns
0803
00A
ll <in
sert
coun
try
nam
e> c
hild
ren
have
ac
cess
to h
igh
qual
ity
prim
ary e
duca
tion
0803
00G
ener
al01
000
Aver
age
% o
f girl
s th
at c
ompl
ete
pr
imar
y edu
catio
n
4.1
1%
99.9
0800
00W
ell-E
duca
ted
<ins
ert c
ount
ry
nam
e>ns
0804
00A
ll <in
sert
coun
try
nam
e> c
hild
ren
have
acc
ess t
o hi
gh
qual
ity se
cond
ary
scho
ol e
duca
tion
0804
00G
ener
al01
024
% o
f chi
ldre
n as
sess
ed a
s fu
nctio
nally
illi
tera
te
1%
0800
00W
ell-E
duca
ted
<ins
ert c
ount
ry
nam
e>ns
0804
00A
ll <in
sert
coun
try
nam
e> c
hild
ren
have
acc
ess t
o hi
gh
qual
ity se
cond
ary
scho
ol e
duca
tion
0804
00G
ener
al01
023
% o
f chi
ldre
n co
mpl
etin
g 10
year
s of s
choo
ling
or m
ore
1%
0800
00W
ell-E
duca
ted
<ins
ert c
ount
ry
nam
e>ns
0804
00A
ll <in
sert
coun
try
nam
e> c
hild
ren
have
acc
ess t
o hi
gh
qual
ity se
cond
ary
scho
ol e
duca
tion
0804
00G
ener
al01
019
% o
f <in
sert
coun
try n
ame>
ns
who
com
plet
e el
emen
tary
ed
ucat
ion
1%
0800
00W
ell-E
duca
ted
<ins
ert c
ount
ry
nam
e>ns
0804
00A
ll <in
sert
coun
try
nam
e> c
hild
ren
have
acc
ess t
o hi
gh
qual
ity se
cond
ary
scho
ol e
duca
tion
0804
00G
ener
al01
020
% o
f <in
sert
coun
try n
ame>
ns
who
com
plet
e se
nior
seco
ndar
y ed
ucat
ion
1%
cont
inue
d on
nex
t pag
e

184 Appendix 6
Code
Hig
h-Le
vel O
I G
roup
ing
Code
Leve
l 2 S
ecto
r OI
Gro
upin
gCo
deSu
b-ca
tego
ry
OI G
roup
ing
OI_
ID
(uni
que)
OI D
escr
iptio
nSD
G
Refe
renc
e
Targ
et
Max
or
Min
(2,1)
Uni
t of
mea
sure
Des
crip
tion
of ca
lcul
atio
n m
etho
dolo
gyTa
rget
2
016
Targ
et
201
7Ta
rget
2
018
Targ
et
201
9Ta
rget
2
030
12
34
56
78
910
1112
1314
1516
2808
0000
Wel
l-Edu
cate
d <i
nser
t cou
ntry
na
me>
ns
0804
00A
ll <in
sert
coun
try
nam
e> c
hild
ren
have
acc
ess t
o hi
gh
qual
ity se
cond
ary
scho
ol e
duca
tion
0804
00G
ener
al01
008
% o
f lea
rner
s w
ho a
re su
bjec
t to
com
pulso
ry
clas
ses i
mpa
rting
kn
owle
dge
on
cultu
ral d
iver
sity
and
of c
ultu
re’s
cont
ribut
ion
to su
stai
nabl
e de
velo
pmen
t
4.7
1%
99.9
0800
00W
ell-E
duca
ted
<ins
ert c
ount
ry
nam
e>ns
0804
00A
ll <in
sert
coun
try
nam
e> c
hild
ren
have
acc
ess t
o hi
gh
qual
ity se
cond
ary
scho
ol e
duca
tion
0804
00G
ener
al01
005
% o
f lea
rner
s w
ho a
re su
bjec
t to
com
pulso
ry
clas
ses i
mpa
rting
kn
owle
dge
on
gend
er e
qual
ity
4.7
1%
99.9
0800
00W
ell-E
duca
ted
<ins
ert c
ount
ry
nam
e>ns
0804
00A
ll <in
sert
coun
try
nam
e> c
hild
ren
have
acc
ess t
o hi
gh
qual
ity se
cond
ary
scho
ol e
duca
tion
0804
00G
ener
al01
007
% o
f lea
rner
s w
ho a
re su
bjec
t to
com
pulso
ry
clas
ses i
mpa
rting
kn
owle
dge
on
glob
al c
itize
nshi
p
4.7
1%
99.9
0800
00W
ell-E
duca
ted
<ins
ert c
ount
ry
nam
e>ns
0804
00A
ll <in
sert
coun
try
nam
e> c
hild
ren
have
acc
ess t
o hi
gh
qual
ity se
cond
ary
scho
ol e
duca
tion
0804
00G
ener
al01
004
% o
f lea
rner
s w
ho a
re su
bjec
t to
com
pulso
ry
clas
ses i
mpa
rting
kn
owle
dge
on
hum
an ri
ghts
4.7
1%
99.9
0800
00W
ell-E
duca
ted
<ins
ert c
ount
ry
nam
e>ns
0804
00A
ll <in
sert
coun
try
nam
e> c
hild
ren
have
acc
ess t
o hi
gh
qual
ity se
cond
ary
scho
ol e
duca
tion
0804
00G
ener
al01
006
% o
f lea
rner
s w
ho a
re su
bjec
t to
com
pulso
ry
clas
ses i
mpa
rting
kn
owle
dge
on
prom
otio
n of
a
cultu
re o
f pea
ce
and
nonv
iole
nce
4.7
1%
99.9
0800
00W
ell-E
duca
ted
<ins
ert c
ount
ry
nam
e>ns
0804
00A
ll <in
sert
coun
try
nam
e> c
hild
ren
have
acc
ess t
o hi
gh
qual
ity se
cond
ary
scho
ol e
duca
tion
0804
00G
ener
al01
022
% o
f <in
sert
coun
try n
ame>
ns
that
rece
ive
free
seco
ndar
y ed
ucat
ion
4.1
1%
cont
inue
d on
nex
t pag
e
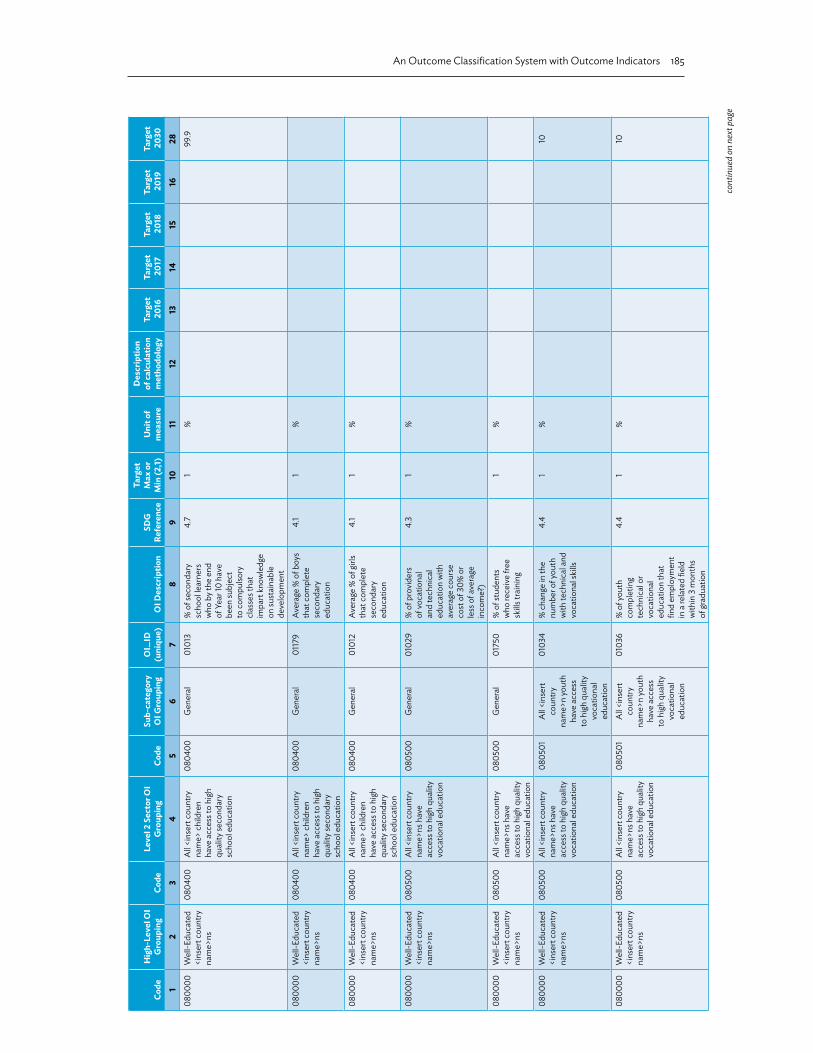
An Outcome Classification System with Outcome Indicators 185
Code
Hig
h-Le
vel O
I G
roup
ing
Code
Leve
l 2 S
ecto
r OI
Gro
upin
gCo
deSu
b-ca
tego
ry
OI G
roup
ing
OI_
ID
(uni
que)
OI D
escr
iptio
nSD
G
Refe
renc
e
Targ
et
Max
or
Min
(2,1)
Uni
t of
mea
sure
Des
crip
tion
of ca
lcul
atio
n m
etho
dolo
gyTa
rget
2
016
Targ
et
201
7Ta
rget
2
018
Targ
et
201
9Ta
rget
2
030
12
34
56
78
910
1112
1314
1516
2808
0000
Wel
l-Edu
cate
d <i
nser
t cou
ntry
na
me>
ns
0804
00A
ll <in
sert
coun
try
nam
e> c
hild
ren
have
acc
ess t
o hi
gh
qual
ity se
cond
ary
scho
ol e
duca
tion
0804
00G
ener
al01
013
% o
f sec
onda
ry
scho
ol le
arne
rs
who
by t
he e
nd
of Y
ear 1
0 ha
ve
been
subj
ect
to c
ompu
lsory
cl
asse
s tha
t im
part
know
ledg
e on
sust
aina
ble
deve
lopm
ent
4.7
1%
99.9
0800
00W
ell-E
duca
ted
<ins
ert c
ount
ry
nam
e>ns
0804
00A
ll <in
sert
coun
try
nam
e> c
hild
ren
have
acc
ess t
o hi
gh
qual
ity se
cond
ary
scho
ol e
duca
tion
0804
00G
ener
al01
179
Aver
age
% o
f boy
s th
at c
ompl
ete
seco
ndar
y ed
ucat
ion
4.1
1%
0800
00W
ell-E
duca
ted
<ins
ert c
ount
ry
nam
e>ns
0804
00A
ll <in
sert
coun
try
nam
e> c
hild
ren
have
acc
ess t
o hi
gh
qual
ity se
cond
ary
scho
ol e
duca
tion
0804
00G
ener
al01
012
Aver
age
% o
f girl
s th
at c
ompl
ete
seco
ndar
y ed
ucat
ion
4.1
1%
0800
00W
ell-E
duca
ted
<ins
ert c
ount
ry
nam
e>ns
0805
00A
ll <in
sert
coun
try
nam
e>ns
hav
e ac
cess
to h
igh
qual
ity
voca
tiona
l edu
catio
n
0805
00G
ener
al01
029
% o
f pro
vide
rs
of vo
catio
nal
and
tech
nica
l ed
ucat
ion
with
av
erag
e co
urse
co
st o
f 30%
or
less
of a
vera
ge
inco
me?
)
4.3
1%
0800
00W
ell-E
duca
ted
<ins
ert c
ount
ry
nam
e>ns
0805
00A
ll <in
sert
coun
try
nam
e>ns
hav
e ac
cess
to h
igh
qual
ity
voca
tiona
l edu
catio
n
0805
00G
ener
al01
750
% o
f stu
dent
s w
ho re
ceiv
e fre
e sk
ills tr
aini
ng
1%
0800
00W
ell-E
duca
ted
<ins
ert c
ount
ry
nam
e>ns
0805
00A
ll <in
sert
coun
try
nam
e>ns
hav
e ac
cess
to h
igh
qual
ity
voca
tiona
l edu
catio
n
0805
01A
ll <in
sert
coun
try
nam
e>n
yout
h ha
ve a
cces
s to
hig
h qu
ality
vo
catio
nal
educ
atio
n
0103
4%
cha
nge
in th
e nu
mbe
r of y
outh
w
ith te
chni
cal a
nd
voca
tiona
l ski
lls
4.4
1%
10
0800
00W
ell-E
duca
ted
<ins
ert c
ount
ry
nam
e>ns
0805
00A
ll <in
sert
coun
try
nam
e>ns
hav
e ac
cess
to h
igh
qual
ity
voca
tiona
l edu
catio
n
0805
01A
ll <in
sert
coun
try
nam
e>n
yout
h ha
ve a
cces
s to
hig
h qu
ality
vo
catio
nal
educ
atio
n
0103
6%
of y
outh
co
mpl
etin
g te
chni
cal o
r vo
catio
nal
educ
atio
n th
at
find
empl
oym
ent
in a
rela
ted
field
w
ithin
3 m
onth
s of
grad
uatio
n
4.4
1%
10
cont
inue
d on
nex
t pag
e

186 Appendix 6
Code
Hig
h-Le
vel O
I G
roup
ing
Code
Leve
l 2 S
ecto
r OI
Gro
upin
gCo
deSu
b-ca
tego
ry
OI G
roup
ing
OI_
ID
(uni
que)
OI D
escr
iptio
nSD
G
Refe
renc
e
Targ
et
Max
or
Min
(2,1)
Uni
t of
mea
sure
Des
crip
tion
of ca
lcul
atio
n m
etho
dolo
gyTa
rget
2
016
Targ
et
201
7Ta
rget
2
018
Targ
et
201
9Ta
rget
2
030
12
34
56
78
910
1112
1314
1516
2808
0000
Wel
l-Edu
cate
d <i
nser
t cou
ntry
na
me>
ns
0805
00A
ll <in
sert
coun
try
nam
e>ns
hav
e ac
cess
to h
igh
qual
ity
voca
tiona
l edu
catio
n
0805
01A
ll <in
sert
coun
try
nam
e>n
yout
h ha
ve a
cces
s to
hig
h qu
ality
vo
catio
nal
educ
atio
n
0103
5%
of y
outh
co
mpl
etin
g te
chni
cal o
r vo
catio
nal
educ
atio
n th
at
find
empl
oym
ent
that
is su
perio
r to
thei
r pre
viou
s em
ploy
men
t prio
r to
und
erta
king
st
udy
4.4
1%
10
0800
00W
ell-E
duca
ted
<ins
ert c
ount
ry
nam
e>ns
0805
00A
ll <in
sert
coun
try
nam
e>ns
hav
e ac
cess
to h
igh
qual
ity
voca
tiona
l edu
catio
n
0805
02A
ll <in
sert
coun
try n
ame>
n ad
ults
hav
e ac
cess
to
high
qua
lity
voca
tiona
l ed
ucat
ion
0104
0%
cha
nge
in th
e nu
mbe
r of a
dults
w
ith te
chni
cal a
nd
voca
tiona
l ski
lls
4.4
1%
10
0800
00W
ell-E
duca
ted
<ins
ert c
ount
ry
nam
e>ns
0805
00A
ll <in
sert
coun
try
nam
e>ns
hav
e ac
cess
to h
igh
qual
ity
voca
tiona
l edu
catio
n
0805
02A
ll <in
sert
coun
try n
ame>
n ad
ults
hav
e ac
cess
to
high
qua
lity
voca
tiona
l ed
ucat
ion
0104
6%
cha
nge
in
the
num
ber o
f sc
hola
rshi
ps
avai
labl
e fro
m
deve
lope
d co
untri
es fo
r en
rollm
ent i
n in
form
atio
n an
d co
mm
unic
atio
ns
tech
nolo
gy
4.b
1%
0800
00W
ell-E
duca
ted
<ins
ert c
ount
ry
nam
e>ns
0805
00A
ll <in
sert
coun
try
nam
e>ns
hav
e ac
cess
to h
igh
qual
ity
voca
tiona
l edu
catio
n
0805
02A
ll <in
sert
coun
try n
ame>
n ad
ults
hav
e ac
cess
to
high
qua
lity
voca
tiona
l ed
ucat
ion
0104
5%
cha
nge
in
the
num
ber o
f sc
hola
rshi
ps
avai
labl
e fro
m
deve
lope
d co
untri
es fo
r en
rollm
ent i
n vo
catio
nal t
rain
ing
4.b
1%
0800
00W
ell-E
duca
ted
<ins
ert c
ount
ry
nam
e>ns
0805
00A
ll <in
sert
coun
try
nam
e>ns
hav
e ac
cess
to h
igh
qual
ity
voca
tiona
l edu
catio
n
0805
02A
ll <in
sert
coun
try n
ame>
n ad
ults
hav
e ac
cess
to
high
qua
lity
voca
tiona
l ed
ucat
ion
0104
1%
of a
dults
co
mpl
etin
g te
chni
cal o
r vo
catio
nal
educ
atio
n th
at
find
empl
oym
ent
in a
rela
ted
field
w
ithin
3 m
onth
s of
grad
uatio
n
4.4
1%
10
cont
inue
d on
nex
t pag
e
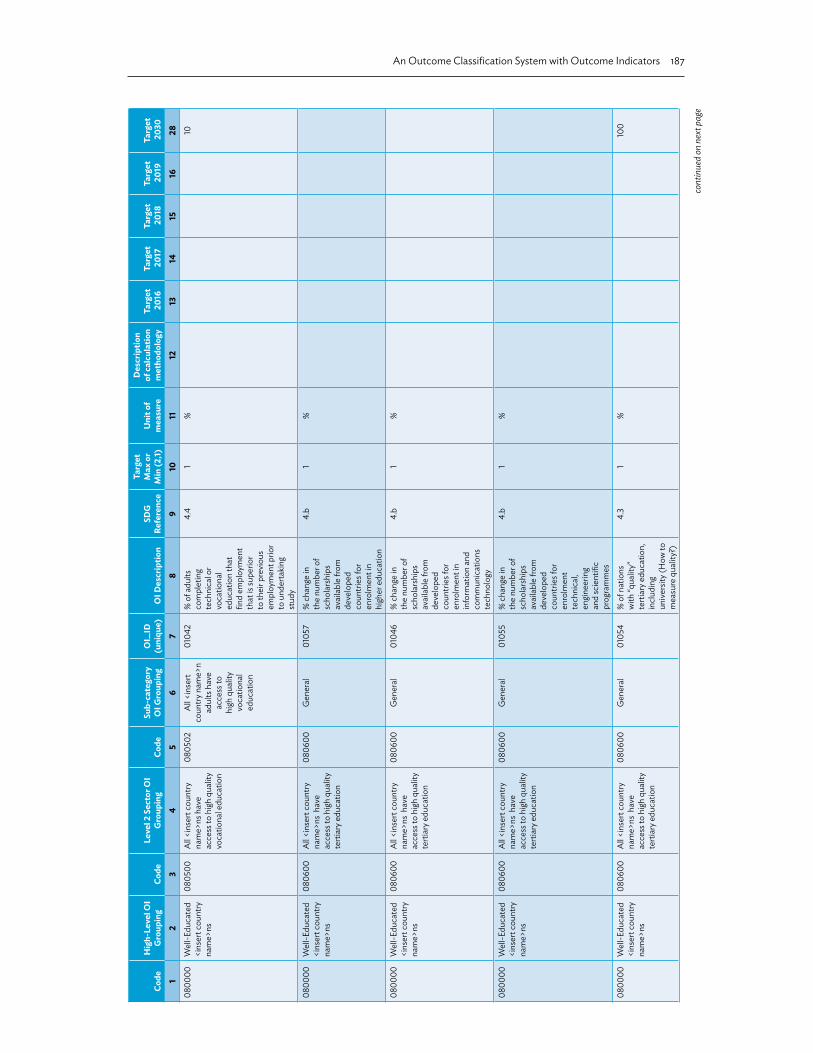
An Outcome Classification System with Outcome Indicators 187
Code
Hig
h-Le
vel O
I G
roup
ing
Code
Leve
l 2 S
ecto
r OI
Gro
upin
gCo
deSu
b-ca
tego
ry
OI G
roup
ing
OI_
ID
(uni
que)
OI D
escr
iptio
nSD
G
Refe
renc
e
Targ
et
Max
or
Min
(2,1)
Uni
t of
mea
sure
Des
crip
tion
of ca
lcul
atio
n m
etho
dolo
gyTa
rget
2
016
Targ
et
201
7Ta
rget
2
018
Targ
et
201
9Ta
rget
2
030
12
34
56
78
910
1112
1314
1516
2808
0000
Wel
l-Edu
cate
d <i
nser
t cou
ntry
na
me>
ns
0805
00A
ll <in
sert
coun
try
nam
e>ns
hav
e ac
cess
to h
igh
qual
ity
voca
tiona
l edu
catio
n
0805
02A
ll <in
sert
coun
try n
ame>
n ad
ults
hav
e ac
cess
to
high
qua
lity
voca
tiona
l ed
ucat
ion
0104
2%
of a
dults
co
mpl
etin
g te
chni
cal o
r vo
catio
nal
educ
atio
n th
at
find
empl
oym
ent
that
is su
perio
r to
thei
r pre
viou
s em
ploy
men
t prio
r to
und
erta
king
st
udy
4.4
1%
10
0800
00W
ell-E
duca
ted
<ins
ert c
ount
ry
nam
e>ns
0806
00A
ll <in
sert
coun
try
nam
e>ns
hav
e ac
cess
to h
igh
qual
ity
terti
ary e
duca
tion
0806
00G
ener
al01
057
% c
hang
e in
th
e nu
mbe
r of
scho
lars
hips
av
aila
ble
from
de
velo
ped
coun
tries
for
enro
lmen
t in
high
er e
duca
tion
4.b
1%
0800
00W
ell-E
duca
ted
<ins
ert c
ount
ry
nam
e>ns
0806
00A
ll <in
sert
coun
try
nam
e>ns
hav
e ac
cess
to h
igh
qual
ity
terti
ary e
duca
tion
0806
00G
ener
al01
046
% c
hang
e in
th
e nu
mbe
r of
scho
lars
hips
av
aila
ble
from
de
velo
ped
coun
tries
for
enro
lmen
t in
info
rmat
ion
and
com
mun
icat
ions
te
chno
logy
4.b
1%
0800
00W
ell-E
duca
ted
<ins
ert c
ount
ry
nam
e>ns
0806
00A
ll <in
sert
coun
try
nam
e>ns
hav
e ac
cess
to h
igh
qual
ity
terti
ary e
duca
tion
0806
00G
ener
al01
055
% c
hang
e in
th
e nu
mbe
r of
scho
lars
hips
av
aila
ble
from
de
velo
ped
coun
tries
for
enro
lmen
t te
chni
cal,
engi
neer
ing
and
scie
ntifi
c pr
ogra
mm
es
4.b
1%
0800
00W
ell-E
duca
ted
<ins
ert c
ount
ry
nam
e>ns
0806
00A
ll <in
sert
coun
try
nam
e>ns
hav
e ac
cess
to h
igh
qual
ity
terti
ary e
duca
tion
0806
00G
ener
al01
054
% o
f nat
ions
w
ith “q
ualit
y”
terti
ary e
duca
tion,
in
clud
ing
univ
ersit
y (H
ow to
m
easu
re q
ualit
y?)
4.3
1%
100
cont
inue
d on
nex
t pag
e

188 Appendix 6
Code
Hig
h-Le
vel O
I G
roup
ing
Code
Leve
l 2 S
ecto
r OI
Gro
upin
gCo
deSu
b-ca
tego
ry
OI G
roup
ing
OI_
ID
(uni
que)
OI D
escr
iptio
nSD
G
Refe
renc
e
Targ
et
Max
or
Min
(2,1)
Uni
t of
mea
sure
Des
crip
tion
of ca
lcul
atio
n m
etho
dolo
gyTa
rget
2
016
Targ
et
201
7Ta
rget
2
018
Targ
et
201
9Ta
rget
2
030
12
34
56
78
910
1112
1314
1516
2808
0000
Wel
l-Edu
cate
d <i
nser
t cou
ntry
na
me>
ns
0806
00A
ll <in
sert
coun
try
nam
e>ns
hav
e ac
cess
to h
igh
qual
ity
terti
ary e
duca
tion
0806
00G
ener
al01
053
% o
f pro
vide
rs o
f te
rtiar
y edu
catio
n w
ith av
erag
e un
it co
st o
f 10%
or
less
of a
vera
ge
inco
me?
)
4.3
1%
100
0800
00W
ell-E
duca
ted
<ins
ert c
ount
ry
nam
e>ns
0807
00<I
nser
t cou
ntry
na
me>
is re
cogn
ized
for i
ts e
duca
tion
rese
arch
0807
00G
ener
al01
781
0900
00Co
mpa
ssio
nate
an
d eq
uita
ble
soci
ety
0900
00G
ener
al09
0000
0107
6%
cha
nge
in
the
prop
ortio
n of
yout
h no
t in
empl
oym
ent,
educ
atio
n or
tra
inin
g
8.6
2%
0900
00Co
mpa
ssio
nate
an
d eq
uita
ble
soci
ety
0900
00G
ener
al09
0000
0107
9%
of c
ount
ries
with
whi
ch <
inse
rt co
untry
nam
e>
has i
mpl
emen
ted
duty
-fre
e an
d qu
ota-
free
mar
ket
acce
ss, c
onsis
tent
w
ith W
orld
Tra
de
Org
aniza
tion
deci
sions
17.12
1%
99.9
0900
00Co
mpa
ssio
nate
an
d eq
uita
ble
soci
ety
0900
00G
ener
al09
0000
0107
5Es
timat
ed
aver
age
varia
nce
in re
mun
erat
ion
with
in
prof
essio
nal a
nd
nonp
rofe
ssio
nal
job
clas
sifica
tions
(%
)
8.5
2%
5
0900
00Co
mpa
ssio
nate
an
d eq
uita
ble
soci
ety
0900
00G
ener
al09
0000
0004
8Fu
ndam
enta
l Ri
ghts
Sco
re in
th
e W
orld
Just
ice
Proj
ect R
ule
of
Law
Inde
x
1in
dex
0.52
0.52
50.
530
0.53
60
0900
00Co
mpa
ssio
nate
an
d eq
uita
ble
soci
ety
0900
00G
ener
al09
0000
0002
1G
INI C
oeffi
cien
t fo
r <in
sert
coun
try n
ame>
0900
00Co
mpa
ssio
nate
an
d eq
uita
ble
soci
ety
0900
00G
ener
al09
0000
0108
1N
umbe
r of l
ives
lo
st a
s a re
sult
of
natu
ral d
isast
ers
cont
inue
d on
nex
t pag
e

An Outcome Classification System with Outcome Indicators 189
Code
Hig
h-Le
vel O
I G
roup
ing
Code
Leve
l 2 S
ecto
r OI
Gro
upin
gCo
deSu
b-ca
tego
ry
OI G
roup
ing
OI_
ID
(uni
que)
OI D
escr
iptio
nSD
G
Refe
renc
e
Targ
et
Max
or
Min
(2,1)
Uni
t of
mea
sure
Des
crip
tion
of ca
lcul
atio
n m
etho
dolo
gyTa
rget
2
016
Targ
et
201
7Ta
rget
2
018
Targ
et
201
9Ta
rget
2
030
12
34
56
78
910
1112
1314
1516
2809
0000
Com
pass
iona
te
and
equi
tabl
e so
ciet
y
0900
00G
ener
al09
0000
0107
8U
nem
ploy
men
t ra
te fo
r w
omen
(%)/
Une
mpl
oym
ent
rate
for m
en (%
)
8.5
2ra
tio o
f w
omen
to
men
0900
00Co
mpa
ssio
nate
an
d eq
uita
ble
soci
ety
0900
00G
ener
al09
0000
0107
7U
nem
ploy
men
t ra
te fo
r you
ng
peop
le (u
nder
26
and
old
er
than
14) (
%)
8.5
2%
5
0900
00Co
mpa
ssio
nate
an
d eq
uita
ble
soci
ety
0900
00G
ener
al09
0000
0178
2%
of p
opul
atio
n ne
edin
g foo
d su
bsid
izatio
n
0900
00Co
mpa
ssio
nate
an
d eq
uita
ble
soci
ety
0900
00G
ener
al09
0000
0178
3Es
timat
ed
% o
f peo
ple
need
ing f
ood
subs
idiza
tion/
Estim
ated
% o
f pe
ople
rece
ivin
g fo
od su
bsid
izatio
n
2ra
tio
0900
00Co
mpa
ssio
nate
an
d eq
uita
ble
soci
ety
0900
00G
ener
al09
0000
0178
4Es
timat
ed %
of
peop
le liv
ing a
t or
belo
w th
e po
very
lin
e th
at h
old
an
<ins
ert c
ount
ry
nam
e>n
Smar
t Ca
rd (K
IP)
1%
0900
00Co
mpa
ssio
nate
an
d eq
uita
ble
soci
ety
0901
00<I
nser
t cou
ntry
na
me>
’s vu
lner
able
sic
k and
disa
bled
ar
e tre
ated
fairl
y w
ith c
ompa
ssio
n
0901
01<i
nser
t cou
ntry
na
me>
ns h
ave
equi
tabl
e ac
cess
to h
ealth
in
sura
nce
0109
0%
of <
inse
rt co
untry
nam
e>ns
w
ho a
re m
embe
rs
of th
e H
ealth
So
cial
Sec
urity
Pr
ogra
m
1%
0900
00Co
mpa
ssio
nate
an
d eq
uita
ble
soci
ety
0901
00<I
nser
t cou
ntry
na
me>
’s vu
lner
able
sic
k and
disa
bled
ar
e tre
ated
fairl
y w
ith c
ompa
ssio
n
0901
01<i
nser
t cou
ntry
na
me>
ns h
ave
equi
tabl
e ac
cess
to h
ealth
in
sura
nce
0109
1%
per
sons
with
di
sabi
litie
s in
scho
ol/%
of
popu
latio
n w
ith
disa
bilit
ies
4.5
1ra
te o
f sc
hool
at
tend
ees t
o po
pula
tion
rate
1
0900
00Co
mpa
ssio
nate
an
d eq
uita
ble
soci
ety
0901
00<I
nser
t cou
ntry
na
me>
’s vu
lner
able
sic
k and
disa
bled
ar
e tre
ated
fairl
y w
ith c
ompa
ssio
n
0901
01<i
nser
t cou
ntry
na
me>
ns h
ave
equi
tabl
e ac
cess
to h
ealth
in
sura
nce
0093
5Eq
ual T
reat
men
t an
d A
bsen
ce o
f D
iscrim
inat
ion
scor
e in
the
Wor
ld Ju
stic
e Pr
ojec
t rep
ort
4.1
1in
dex
0.49
cont
inue
d on
nex
t pag
e

190 Appendix 6
Code
Hig
h-Le
vel O
I G
roup
ing
Code
Leve
l 2 S
ecto
r OI
Gro
upin
gCo
deSu
b-ca
tego
ry
OI G
roup
ing
OI_
ID
(uni
que)
OI D
escr
iptio
nSD
G
Refe
renc
e
Targ
et
Max
or
Min
(2,1)
Uni
t of
mea
sure
Des
crip
tion
of ca
lcul
atio
n m
etho
dolo
gyTa
rget
2
016
Targ
et
201
7Ta
rget
2
018
Targ
et
201
9Ta
rget
2
030
12
34
56
78
910
1112
1314
1516
2809
0000
Com
pass
iona
te
and
equi
tabl
e so
ciet
y
0901
00<I
nser
t cou
ntry
na
me>
’s vu
lner
able
sic
k and
disa
bled
ar
e tre
ated
fairl
y w
ith c
ompa
ssio
n
0901
01<i
nser
t cou
ntry
na
me>
ns h
ave
equi
tabl
e ac
cess
to h
ealth
in
sura
nce
0109
6N
umbe
r of
repo
rted
brea
ches
of
labo
r rig
hts
8.8
2N
umbe
r of
brea
ches
re
porte
d
1
0900
00Co
mpa
ssio
nate
an
d eq
uita
ble
soci
ety
0901
00<I
nser
t cou
ntry
na
me>
’s vu
lner
able
sic
k and
disa
bled
ar
e tre
ated
fairl
y w
ith c
ompa
ssio
n
0901
01<i
nser
t cou
ntry
na
me>
ns h
ave
equi
tabl
e ac
cess
to h
ealth
in
sura
nce
0109
5N
umbe
r of
repo
rted
inci
dent
s of
chi
ld la
bor
in a
ny fo
rm
8.7
2N
umbe
r of
inci
dent
s re
porte
d
0900
00Co
mpa
ssio
nate
an
d eq
uita
ble
soci
ety
0901
00<I
nser
t cou
ntry
na
me>
’s vu
lner
able
sic
k and
disa
bled
ar
e tre
ated
fairl
y w
ith c
ompa
ssio
n
0901
01<i
nser
t cou
ntry
na
me>
ns h
ave
equi
tabl
e ac
cess
to h
ealth
in
sura
nce
0109
3N
umbe
r of
repo
rted
inci
dent
s of
hum
an
traffi
ckin
g
8.7
2N
umbe
r of
inci
dent
s re
porte
d
0900
00Co
mpa
ssio
nate
an
d eq
uita
ble
soci
ety
0901
00<I
nser
t cou
ntry
na
me>
’s vu
lner
able
sic
k and
disa
bled
ar
e tre
ated
fairl
y w
ith c
ompa
ssio
n
0901
01<i
nser
t cou
ntry
na
me>
ns h
ave
equi
tabl
e ac
cess
to h
ealth
in
sura
nce
0109
4N
umbe
r of
repo
rted
inci
dent
s of
recr
uitm
ent
and
use
of
child
sold
iers
8.7
2N
umbe
r of
inci
dent
s re
porte
d
0900
00Co
mpa
ssio
nate
an
d eq
uita
ble
soci
ety
0901
00<I
nser
t cou
ntry
na
me>
’s vu
lner
able
sic
k and
disa
bled
ar
e tre
ated
fairl
y w
ith c
ompa
ssio
n
0901
01<i
nser
t cou
ntry
na
me>
ns h
ave
equi
tabl
e ac
cess
to h
ealth
in
sura
nce
0109
2U
nem
ploy
men
t ra
te fo
r pe
rson
s with
di
sabi
litie
s (%
)
8.5
2%
5
0900
00Co
mpa
ssio
nate
an
d eq
uita
ble
soci
ety
0902
00<I
nser
t cou
ntry
na
me>
’s vu
lner
able
ag
ed p
eopl
e ar
e tre
ated
fairl
y with
co
mpa
ssio
n
0902
00G
ener
al00
935
Equa
l Tre
atm
ent
and
Abs
ence
of
Disc
rimin
atio
n sc
ore
in th
e W
orld
Just
ice
Proj
ect r
epor
t
4.1
1in
dex
0.49
0900
00Co
mpa
ssio
nate
an
d eq
uita
ble
soci
ety
0903
00<I
nser
t cou
ntry
na
me>
’s vu
lner
able
fa
milie
s and
chi
ldre
n ar
e tre
ated
fairl
y w
ith c
ompa
ssio
n
0903
00G
ener
al01
107
Aver
age
% c
hang
e in
the
num
ber
of d
etec
ted
or
repo
rted
case
s of
chi
ld a
buse
, ex
ploi
tatio
n,
traffi
ckin
g,
viol
ence
or t
ortu
re
of c
hild
ren
16.2
2%
-99.
9
0900
00Co
mpa
ssio
nate
an
d eq
uita
ble
soci
ety
0903
00<I
nser
t cou
ntry
na
me>
’s vu
lner
able
fa
milie
s and
chi
ldre
n ar
e tre
ated
fairl
y w
ith c
ompa
ssio
n
0903
00G
ener
al00
935
Equa
l Tre
atm
ent
and
Abs
ence
of
Disc
rimin
atio
n sc
ore
in th
e W
orld
Just
ice
Proj
ect r
epor
t
4.1
1in
dex
0.49
cont
inue
d on
nex
t pag
e

An Outcome Classification System with Outcome Indicators 191
Code
Hig
h-Le
vel O
I G
roup
ing
Code
Leve
l 2 S
ecto
r OI
Gro
upin
gCo
deSu
b-ca
tego
ry
OI G
roup
ing
OI_
ID
(uni
que)
OI D
escr
iptio
nSD
G
Refe
renc
e
Targ
et
Max
or
Min
(2,1)
Uni
t of
mea
sure
Des
crip
tion
of ca
lcul
atio
n m
etho
dolo
gyTa
rget
2
016
Targ
et
201
7Ta
rget
2
018
Targ
et
201
9Ta
rget
2
030
12
34
56
78
910
1112
1314
1516
2809
0000
Com
pass
iona
te
and
equi
tabl
e so
ciet
y
0904
00<I
nser
t cou
ntry
na
me>
’s vu
lner
able
un
empl
oyed
are
tre
ated
fairl
y with
co
mpa
ssio
n
0904
00G
ener
al01
116
% o
f citi
zens
w
ith a
cces
s to
mea
ns-t
este
d so
cial
secu
rity
supp
ort p
aym
ents
1.399
.9
0900
00Co
mpa
ssio
nate
an
d eq
uita
ble
soci
ety
0904
00<I
nser
t cou
ntry
na
me>
’s vu
lner
able
un
empl
oyed
are
tre
ated
fairl
y with
co
mpa
ssio
n
0904
00G
ener
al01
114
% o
f for
mal
w
orke
rs w
ho a
re
mem
bers
of t
he
Wor
kers
Soc
ial
Secu
rity P
rogr
am
1%
0900
00Co
mpa
ssio
nate
an
d eq
uita
ble
soci
ety
0904
00<I
nser
t cou
ntry
na
me>
’s vu
lner
able
un
empl
oyed
are
tre
ated
fairl
y with
co
mpa
ssio
n
0904
00G
ener
al01
115
% o
f inf
orm
al
wor
kers
who
are
m
embe
rs o
f the
W
orke
rs S
ocia
l Se
curit
y Pro
gram
1%
0900
00Co
mpa
ssio
nate
an
d eq
uita
ble
soci
ety
0904
00<I
nser
t cou
ntry
na
me>
’s vu
lner
able
un
empl
oyed
are
tre
ated
fairl
y with
co
mpa
ssio
n
0904
00G
ener
al01
117
Aver
age
% o
f ci
tizen
s cov
ered
by
a m
eans
-tes
ted
inco
me
supp
ort
fram
ewor
k for
di
sadv
anta
ged
and
at-r
isk p
erso
ns
(How
wou
ld yo
u lik
e to
cal
cula
te
the
aver
age?
W
eigh
ted
by n
atio
nal
popu
latio
ns o
r jus
t a
stra
ight
aver
age
acro
ss n
atio
ns?)
1.399
.9
0900
00Co
mpa
ssio
nate
an
d eq
uita
ble
soci
ety
0904
00<I
nser
t cou
ntry
na
me>
’s vu
lner
able
un
empl
oyed
are
tre
ated
fairl
y with
co
mpa
ssio
n
0904
00G
ener
al00
935
Equa
l Tre
atm
ent
and
Abs
ence
of
Disc
rimin
atio
n sc
ore
in th
e W
orld
Just
ice
Proj
ect r
epor
t
4.1
1in
dex
0.49
0900
00Co
mpa
ssio
nate
an
d eq
uita
ble
soci
ety
0905
00<I
nser
t cou
ntry
na
me>
ns a
re n
ot
disc
rimin
ated
ag
ains
t on
the
basis
of
thei
r sex
, rac
e or
et
hnic
grou
ping
0905
00G
ener
al01
142
% c
hang
e in
re
porte
d ca
ses
of fe
mal
e ge
nita
l m
utila
tion
5.3
2%
-99.
9
cont
inue
d on
nex
t pag
e
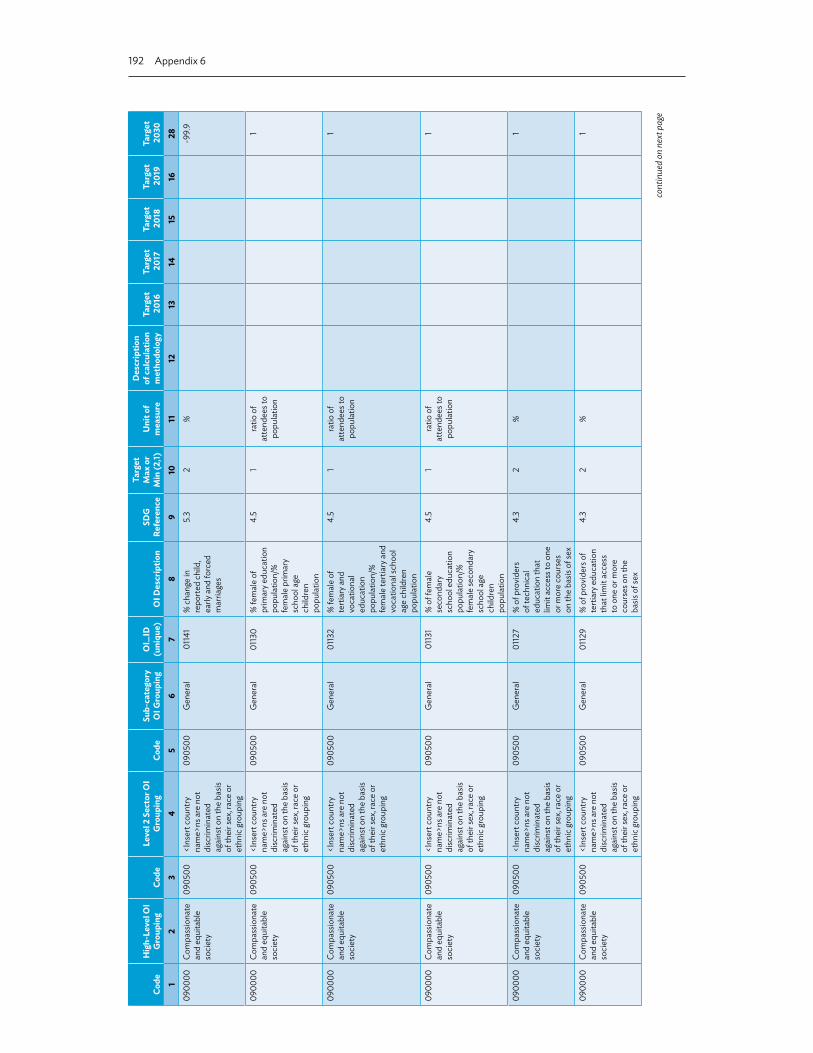
192 Appendix 6
Code
Hig
h-Le
vel O
I G
roup
ing
Code
Leve
l 2 S
ecto
r OI
Gro
upin
gCo
deSu
b-ca
tego
ry
OI G
roup
ing
OI_
ID
(uni
que)
OI D
escr
iptio
nSD
G
Refe
renc
e
Targ
et
Max
or
Min
(2,1)
Uni
t of
mea
sure
Des
crip
tion
of ca
lcul
atio
n m
etho
dolo
gyTa
rget
2
016
Targ
et
201
7Ta
rget
2
018
Targ
et
201
9Ta
rget
2
030
12
34
56
78
910
1112
1314
1516
2809
0000
Com
pass
iona
te
and
equi
tabl
e so
ciet
y
0905
00<I
nser
t cou
ntry
na
me>
ns a
re n
ot
disc
rimin
ated
ag
ains
t on
the
basis
of
thei
r sex
, rac
e or
et
hnic
grou
ping
0905
00G
ener
al01
141
% c
hang
e in
re
porte
d ch
ild,
early
and
forc
ed
mar
riage
s
5.3
2%
-99.
9
0900
00Co
mpa
ssio
nate
an
d eq
uita
ble
soci
ety
0905
00<I
nser
t cou
ntry
na
me>
ns a
re n
ot
disc
rimin
ated
ag
ains
t on
the
basis
of
thei
r sex
, rac
e or
et
hnic
grou
ping
0905
00G
ener
al01
130
% fe
mal
e of
pr
imar
y edu
catio
n po
pula
tion/
%
fem
ale
prim
ary
scho
ol a
ge
child
ren
popu
latio
n
4.5
1ra
tio o
f at
tend
ees t
o po
pula
tion
1
0900
00Co
mpa
ssio
nate
an
d eq
uita
ble
soci
ety
0905
00<I
nser
t cou
ntry
na
me>
ns a
re n
ot
disc
rimin
ated
ag
ains
t on
the
basis
of
thei
r sex
, rac
e or
et
hnic
grou
ping
0905
00G
ener
al01
132
% fe
mal
e of
te
rtiar
y and
vo
catio
nal
educ
atio
n po
pula
tion/
%
fem
ale
terti
ary a
nd
voca
tiona
l sch
ool
age
child
ren
popu
latio
n
4.5
1ra
tio o
f at
tend
ees t
o po
pula
tion
1
0900
00Co
mpa
ssio
nate
an
d eq
uita
ble
soci
ety
0905
00<I
nser
t cou
ntry
na
me>
ns a
re n
ot
disc
rimin
ated
ag
ains
t on
the
basis
of
thei
r sex
, rac
e or
et
hnic
grou
ping
0905
00G
ener
al01
131
% o
f fem
ale
seco
ndar
y sc
hool
edu
catio
n po
pula
tion/
%
fem
ale
seco
ndar
y sc
hool
age
ch
ildre
n po
pula
tion
4.5
1ra
tio o
f at
tend
ees t
o po
pula
tion
1
0900
00Co
mpa
ssio
nate
an
d eq
uita
ble
soci
ety
0905
00<I
nser
t cou
ntry
na
me>
ns a
re n
ot
disc
rimin
ated
ag
ains
t on
the
basis
of
thei
r sex
, rac
e or
et
hnic
grou
ping
0905
00G
ener
al01
127
% o
f pro
vide
rs
of te
chni
cal
educ
atio
n th
at
limit
acce
ss to
one
or
mor
e co
urse
s on
the
basis
of s
ex
4.3
2%
1
0900
00Co
mpa
ssio
nate
an
d eq
uita
ble
soci
ety
0905
00<I
nser
t cou
ntry
na
me>
ns a
re n
ot
disc
rimin
ated
ag
ains
t on
the
basis
of
thei
r sex
, rac
e or
et
hnic
grou
ping
0905
00G
ener
al01
129
% o
f pro
vide
rs o
f te
rtiar
y edu
catio
n th
at lim
it ac
cess
to
one
or m
ore
cour
ses o
n th
e ba
sis o
f sex
4.3
2%
1
cont
inue
d on
nex
t pag
e

An Outcome Classification System with Outcome Indicators 193
Code
Hig
h-Le
vel O
I G
roup
ing
Code
Leve
l 2 S
ecto
r OI
Gro
upin
gCo
deSu
b-ca
tego
ry
OI G
roup
ing
OI_
ID
(uni
que)
OI D
escr
iptio
nSD
G
Refe
renc
e
Targ
et
Max
or
Min
(2,1)
Uni
t of
mea
sure
Des
crip
tion
of ca
lcul
atio
n m
etho
dolo
gyTa
rget
2
016
Targ
et
201
7Ta
rget
2
018
Targ
et
201
9Ta
rget
2
030
12
34
56
78
910
1112
1314
1516
2809
0000
Com
pass
iona
te
and
equi
tabl
e so
ciet
y
0905
00<I
nser
t cou
ntry
na
me>
ns a
re n
ot
disc
rimin
ated
ag
ains
t on
the
basis
of
thei
r sex
, rac
e or
et
hnic
grou
ping
0905
00G
ener
al01
128
% o
f pro
vide
rs
of vo
catio
nal
educ
atio
n th
at
limit
acce
ss to
one
or
mor
e co
urse
s on
the
basis
of s
ex
4.3
2%
1
0900
00Co
mpa
ssio
nate
an
d eq
uita
ble
soci
ety
0905
00<I
nser
t cou
ntry
na
me>
ns a
re n
ot
disc
rimin
ated
ag
ains
t on
the
basis
of
thei
r sex
, rac
e or
et
hnic
grou
ping
0905
00G
ener
al01
143
% o
f reg
ulat
ory
inst
rum
ents
and
go
vern
men
t pr
actic
es
that
con
tain
m
echa
nism
s tha
t pr
even
t wom
en’s
full a
nd e
ffect
ive
parti
cipa
tion
and
equa
l op
portu
nitie
s fo
r lea
ders
hip
at a
ll lev
els o
f de
cisio
n-m
akin
g in
polit
ical
, eco
nom
ic
and
publ
ic lif
e
5.5
2%
0
0900
00Co
mpa
ssio
nate
an
d eq
uita
ble
soci
ety
0905
00<I
nser
t cou
ntry
na
me>
ns a
re n
ot
disc
rimin
ated
ag
ains
t on
the
basis
of
thei
r sex
, rac
e or
et
hnic
grou
ping
0905
00G
ener
al01
144
% o
f reg
ulat
ory
inst
rum
ents
that
ha
ve le
gisla
tive
or
inst
itutio
nalis
ed
bloc
king
m
echa
nism
s tha
t pr
even
t uni
vers
al
acce
ss to
sexu
al
and
repr
oduc
tive
heal
th a
nd
repr
oduc
tive
right
s as a
gree
d in
ac
cord
ance
with
th
e Pr
ogra
mm
e of
Act
ion
of th
e In
tern
atio
nal
Conf
eren
ce o
n Po
pula
tion
and
Dev
elop
men
t an
d th
e Be
ijing
Plat
form
for
Act
ion
and
the
outc
ome
docu
men
ts o
f th
eir r
evie
w
conf
eren
ces
5.6
2%
0
cont
inue
d on
nex
t pag
e

194 Appendix 6
Code
Hig
h-Le
vel O
I G
roup
ing
Code
Leve
l 2 S
ecto
r OI
Gro
upin
gCo
deSu
b-ca
tego
ry
OI G
roup
ing
OI_
ID
(uni
que)
OI D
escr
iptio
nSD
G
Refe
renc
e
Targ
et
Max
or
Min
(2,1)
Uni
t of
mea
sure
Des
crip
tion
of ca
lcul
atio
n m
etho
dolo
gyTa
rget
2
016
Targ
et
201
7Ta
rget
2
018
Targ
et
201
9Ta
rget
2
030
12
34
56
78
910
1112
1314
1516
2809
0000
Com
pass
iona
te
and
equi
tabl
e so
ciet
y
0905
00<I
nser
t cou
ntry
na
me>
ns a
re n
ot
disc
rimin
ated
ag
ains
t on
the
basis
of
thei
r sex
, rac
e or
et
hnic
grou
ping
0905
00G
ener
al01
145
% o
f reg
ulat
ory
inst
rum
ents
with
on
e or
mor
e le
gal
or in
stitu
tiona
lised
im
pedi
men
ts
to e
qual
righ
ts
to e
cono
mic
re
sour
ces,
owne
rshi
p an
d co
ntro
l ove
r la
nd a
nd o
ther
fo
rms o
f pro
perty
, fin
anci
al se
rvic
es,
inhe
ritan
ce a
nd
natu
ral r
esou
rces
5.a
2%
0
0900
00Co
mpa
ssio
nate
an
d eq
uita
ble
soci
ety
0905
00<I
nser
t cou
ntry
na
me>
ns a
re n
ot
disc
rimin
ated
ag
ains
t on
the
basis
of
thei
r sex
, rac
e or
et
hnic
grou
ping
0905
00G
ener
al01
126
% p
erso
ns w
ith
indi
geno
us
back
grou
nd
in sc
hool
/% o
f po
pula
tion
that
is
indi
geno
us
(How
to d
efine
in
dige
nous
or
mixe
d?)
4.5
1ra
tio o
f at
tend
ees t
o po
pula
tion
1
0900
00Co
mpa
ssio
nate
an
d eq
uita
ble
soci
ety
0905
00<I
nser
t cou
ntry
na
me>
ns a
re n
ot
disc
rimin
ated
ag
ains
t on
the
basis
of
thei
r sex
, rac
e or
et
hnic
grou
ping
0905
00G
ener
al01
140
Aver
age
% c
hang
e in
repo
rted
sexu
al
and
othe
r typ
es o
f ex
ploi
tatio
n of
girls
5.2
2%
-99.
9
0900
00Co
mpa
ssio
nate
an
d eq
uita
ble
soci
ety
0905
00<I
nser
t cou
ntry
na
me>
ns a
re n
ot
disc
rimin
ated
ag
ains
t on
the
basis
of
thei
r sex
, rac
e or
et
hnic
grou
ping
0905
00G
ener
al01
139
Aver
age
% c
hang
e in
repo
rted
sexu
al
and
othe
r typ
es
of e
xplo
itatio
n of
wom
en
5.2
2%
-99.
9
0900
00Co
mpa
ssio
nate
an
d eq
uita
ble
soci
ety
0905
00<I
nser
t cou
ntry
na
me>
ns a
re n
ot
disc
rimin
ated
ag
ains
t on
the
basis
of
thei
r sex
, rac
e or
et
hnic
grou
ping
0905
00G
ener
al01
138
Aver
age
% c
hang
e in
repo
rted
traffi
ckin
g of g
irls
5.2
2%
-99.
9
0900
00Co
mpa
ssio
nate
an
d eq
uita
ble
soci
ety
0905
00<I
nser
t cou
ntry
na
me>
ns a
re n
ot
disc
rimin
ated
ag
ains
t on
the
basis
of
thei
r sex
, rac
e or
et
hnic
grou
ping
0905
00G
ener
al01
137
Aver
age
% c
hang
e in
repo
rted
traffi
ckin
g of
wom
en
5.2
2%
-99.
9
cont
inue
d on
nex
t pag
e

An Outcome Classification System with Outcome Indicators 195
Code
Hig
h-Le
vel O
I G
roup
ing
Code
Leve
l 2 S
ecto
r OI
Gro
upin
gCo
deSu
b-ca
tego
ry
OI G
roup
ing
OI_
ID
(uni
que)
OI D
escr
iptio
nSD
G
Refe
renc
e
Targ
et
Max
or
Min
(2,1)
Uni
t of
mea
sure
Des
crip
tion
of ca
lcul
atio
n m
etho
dolo
gyTa
rget
2
016
Targ
et
201
7Ta
rget
2
018
Targ
et
201
9Ta
rget
2
030
12
34
56
78
910
1112
1314
1516
2809
0000
Com
pass
iona
te
and
equi
tabl
e so
ciet
y
0905
00<I
nser
t cou
ntry
na
me>
ns a
re n
ot
disc
rimin
ated
ag
ains
t on
the
basis
of
thei
r sex
, rac
e or
et
hnic
grou
ping
0905
00G
ener
al01
136
Aver
age
%
chan
ge in
re
porte
d vi
olen
ce
agai
nst g
irls
5.2
2%
-99.
9
0900
00Co
mpa
ssio
nate
an
d eq
uita
ble
soci
ety
0905
00<I
nser
t cou
ntry
na
me>
ns a
re n
ot
disc
rimin
ated
ag
ains
t on
the
basis
of
thei
r sex
, rac
e or
et
hnic
grou
ping
0905
00G
ener
al01
135
Aver
age
% c
hang
e in
repo
rted
viol
ence
aga
inst
w
omen
5.2
2%
-99.
9
0900
00Co
mpa
ssio
nate
an
d eq
uita
ble
soci
ety
0905
00<I
nser
t cou
ntry
na
me>
ns a
re n
ot
disc
rimin
ated
ag
ains
t on
the
basis
of
thei
r sex
, rac
e or
et
hnic
grou
ping
0905
00G
ener
al01
134
Aver
age
% c
hang
e in
the
num
ber
of c
ompl
aint
s of
disc
rimin
atio
n ag
ains
t girl
s
5.1
2%
-99.
9
0900
00Co
mpa
ssio
nate
an
d eq
uita
ble
soci
ety
0905
00<I
nser
t cou
ntry
na
me>
ns a
re n
ot
disc
rimin
ated
ag
ains
t on
the
basis
of
thei
r sex
, rac
e or
et
hnic
grou
ping
0905
00G
ener
al01
133
Aver
age
% c
hang
e in
the
num
ber
of c
ompl
aint
s of
disc
rimin
atio
n ag
ains
t wom
en
5.1
2%
-99.
9
0900
00Co
mpa
ssio
nate
an
d eq
uita
ble
soci
ety
0905
00<I
nser
t cou
ntry
na
me>
ns a
re n
ot
disc
rimin
ated
ag
ains
t on
the
basis
of
thei
r sex
, rac
e or
et
hnic
grou
ping
0905
00G
ener
al01
146
Aver
age
% o
f w
omen
and
gi
rls a
nd th
ose
in vu
lner
able
sit
uatio
ns
with
acc
ess
to e
quita
ble
sani
tatio
n (H
ow
do yo
u pr
opos
e to
mea
sure
“e
quita
ble”
? W
hat c
onst
itute
s “v
ulne
rabl
e”?)
6.2
1%
99.9
0900
00Co
mpa
ssio
nate
an
d eq
uita
ble
soci
ety
0905
00<I
nser
t cou
ntry
na
me>
ns a
re n
ot
disc
rimin
ated
ag
ains
t on
the
basis
of
thei
r sex
, rac
e or
et
hnic
grou
ping
0905
00G
ener
al00
935
Equa
l Tre
atm
ent
and
Abs
ence
of
Disc
rimin
atio
n sc
ore
in th
e W
orld
Just
ice
Proj
ect r
epor
t
4.1
1in
dex
0.49
cont
inue
d on
nex
t pag
e

196 Appendix 6
Code
Hig
h-Le
vel O
I G
roup
ing
Code
Leve
l 2 S
ecto
r OI
Gro
upin
gCo
deSu
b-ca
tego
ry
OI G
roup
ing
OI_
ID
(uni
que)
OI D
escr
iptio
nSD
G
Refe
renc
e
Targ
et
Max
or
Min
(2,1)
Uni
t of
mea
sure
Des
crip
tion
of ca
lcul
atio
n m
etho
dolo
gyTa
rget
2
016
Targ
et
201
7Ta
rget
2
018
Targ
et
201
9Ta
rget
2
030
12
34
56
78
910
1112
1314
1516
2809
0000
Com
pass
iona
te
and
equi
tabl
e so
ciet
y
0905
00<I
nser
t cou
ntry
na
me>
ns a
re n
ot
disc
rimin
ated
ag
ains
t on
the
basis
of
thei
r sex
, rac
e or
et
hnic
grou
ping
0905
00G
ener
al01
809
% o
f par
liam
ent
sittin
g mem
bers
th
at a
re fe
mal
e
1%
0900
00Co
mpa
ssio
nate
an
d eq
uita
ble
soci
ety
0905
00<I
nser
t cou
ntry
na
me>
ns a
re n
ot
disc
rimin
ated
ag
ains
t on
the
basis
of
thei
r sex
, rac
e or
et
hnic
grou
ping
0905
00G
ener
al01
810
% o
f jud
icia
ry
that
are
fem
ale
1%
0900
00Co
mpa
ssio
nate
an
d eq
uita
ble
soci
ety
0906
00Su
rviv
ors o
f ca
tast
roph
ic e
vent
s ar
e tre
ated
fairl
y w
ith c
ompa
ssio
n
0906
00G
ener
al01
154
% c
hang
e in
the
num
ber o
f peo
ple
disp
lace
d by
na
tura
l disa
ster
s
11.5
2%
-99.
9
0900
00Co
mpa
ssio
nate
an
d eq
uita
ble
soci
ety
0906
00Su
rviv
ors o
f ca
tast
roph
ic e
vent
s ar
e tre
ated
fairl
y w
ith c
ompa
ssio
n
0906
00G
ener
al01
153
Aver
age
% c
hang
e in
the
num
ber o
f de
aths
cau
sed
by
natu
ral d
isast
ers
11.5
2%
-10
0900
00Co
mpa
ssio
nate
an
d eq
uita
ble
soci
ety
0906
00Su
rviv
ors o
f ca
tast
roph
ic e
vent
s ar
e tre
ated
fairl
y w
ith c
ompa
ssio
n
0906
00G
ener
al01
156
Aver
age
% c
hang
e in
the
ratio
(v
alue
of d
irect
ec
onom
ic lo
sses
ca
used
by n
atur
al
disa
ster
s/gr
oss
dom
estic
pro
duct
) ca
used
by n
atur
al
disa
ster
s
11.5
2%
0900
00Co
mpa
ssio
nate
an
d eq
uita
ble
soci
ety
0906
00Su
rviv
ors o
f ca
tast
roph
ic e
vent
s ar
e tre
ated
fairl
y w
ith c
ompa
ssio
n
0906
00G
ener
al01
155
Aver
age
% c
hang
e in
the
valu
e of
di
rect
eco
nom
ic
loss
es c
ause
d by
na
tura
l disa
ster
s
11.5
2%
10
0900
00Co
mpa
ssio
nate
an
d eq
uita
ble
soci
ety
0906
00Su
rviv
ors o
f ca
tast
roph
ic e
vent
s ar
e tre
ated
fairl
y w
ith c
ompa
ssio
n
0906
00G
ener
al01
157
Insu
ranc
e pa
yout
s for
na
tura
l disa
ster
s/In
sura
nce
clai
ms
1$
payo
ut ra
te
GD
P =
gros
s dom
estic
pro
duct
, OI =
out
com
e in
dica
tors
, PIS
A -
Prog
ram
me
for I
nter
natio
nal S
tude
nt A
sses
smen
t, SD
G R
efer
ence
: Ref
ers t
o th
e pa
ragr
aph
num
bers
of t
he su
stai
nabl
e de
velo
pmen
t goa
ls an
d ta
rget
s list
ed in
the
“Dra
ft ou
tcom
e do
cum
ent o
f the
Uni
ted
Nat
ions
sum
mit
for t
he a
dopt
ion
of th
e po
st-2
015 d
evel
opm
ent a
gend
a” is
sued
on
12 A
ugus
t 201
5.So
urce
: Aut
hor.

APPENDIX 7
Criteria for Assessing Results-Based Budgeting Management Proposals
No. Assessment Aspect Criteria for Assessment1 The results-based budgeting
management (RBBM) logical framework specified for the national budgeting system
Planning logic differentiates between Final Outcomes, Intermediate Outcomes, Organizational Outcomes, Final Outputs, Intermediate Outputs, Internal Outputs, Outcome Indicators, Output Indicators (Service Delivery Standards). Clear linkages are defined and manuals and guidelines are clear.
2 Outcome classification framework An outcomes classification framework has been developed that facilitates inter-temporally stable outcome descriptions and inter-temporally stable outcome indicator definitions that may be used for sector planning. A framework aligned with the classification of functions of government (COFOG) system is ideal. Changes in government policy may be reflected in changes to outcome indicator targets, not by redesign of the outcomes framework. An example is shown in Appendix 6.
3 Outcome descriptions and/or definitions
There should be a separate outcome description for each client population level variable to be targeted. Outcome descriptions should be brief and succinct, reflecting the aspirational subject.
4 Outcome indicator descriptions Outcome Indicators should reflect the outcome description to which it relates. Outcome Indicators may be proxy indicators or direct indicators. Each outcome indicator should be expressed for only one variable. All other potential variables should be expressed as fixed numbers around which the variable may oscillate. No directional verbs or qualitative adjectives should describe the indicator. No target should be included in the description. All outcome indicators should express their aims in minimum or maximum targets.
5 Output classification framework (See Appendix 3 for an example of output type descriptions).
There are outputs across ministries that are similar in nature and may be described in the same way and with the same performance indicator (performance indicator) descriptions (although targets may differ and some wording variations may occur). Outputs are classified as Final Outputs, Intermediate Outputs, or Internal Outputs for costing purposes. A database coding system can be constructed to report on similar output types.
continued on next page

198 Appendix 7
No. Assessment Aspect Criteria for Assessment6 Output descriptions and/or definitions y Include an object (or subject) such as “Advisory
Services,” “Regulatory Services,” or “Hospital Services;” y Include a verb such as “Supply of…,” or “Provision of …;” y Not be worded as an objective statement
(i.e., words such as “increasing,” “decreasing,” “improving,” “enhancing,” imply creating a change to a state-of-being, have no place in an Output Description, only in an Outcome description);
y Not include directional movements referring to statistical measures (i.e., as per previous condition, these belong in Outcome statements, not Output descriptions);
y Be brief, requiring approximately four or five words to describe the good or service.
y To facilitate grouping of similar Outputs (e.g., different types of policy advice), the Agency Outputs should not be narrowly defined.
y Wherever possible, Outputs should be aggregated into a limited number of Outputs that are crosscutting Programs or Activities.
y If funding for a Sub-Output constitutes 10% or more of the total budget for the Agency, it should be a major determinant of the Agency Output description.
y The description should � Describe in simple language the products or services
(avoid the use of adjectives and superlatives); � Should help the Government, Parliament, and
the public understand the nature of the goods or services for which public funding is being provided;
� Should have a clearly identifiable “customer” (targeted client or community group);a
� May include goods and services to be delivered through outsourced arrangements (reflected in the purchasing Agency’s Outputs, not the provider’s);
� Suggest how the Output would be measured in quantity, quality, and timeliness; and
� Reflect a core deliverable Output, or business line, of the Agency and will typically comprise a grouping of Program/Activity Outputs undertaken with a common Outcome in mind.
� Should be within the Agency’s control; and � May be an aggregation of Sub-Outputs that are
similar in nature and able to be described by a common set of Performance Indicators .
continued on next page
Table continued

Criteria for Assessing Results-Based Budgeting Management Proposals 199
No. Assessment Aspect Criteria for Assessment7 Output performance
indicator descriptionsOutput Performance Indicators are service delivery standards. An Output performance indicator “Set” consists of four “Classes” of Performance Indicators, including quantity, quality, timeliness, and cost. A performance indicator Set should incorporate at least one performance indicator from each Class. They should clearly reflect the output description to which they relate. Each Output performance indicator should be expressed for only one variable. All other potential variables should be expressed as fixed numbers around which the variable may oscillate. No directional verbs or qualitative adjectives should be included in the performance indicator description. No target should be included in the performance indicator description. All Performance Indicators should express their aims in minimum or maximum targets. performance indicator descriptions should be written such that, they1. Are not expressed as an objective statement (i.e.,
Do not include in the description superlatives or references to directional change, such as “Increase in...,” “Decrease in…,” “High-quality…”);
2. Refer to only one variable;3. Refer to only one class of indicator (either:
quantity, or quality, or timeliness, or financial/cost, never a combination of one or more);
4. Be a simple description of what is being measured, nothing more;
5. Never include the target in the description;6. Facilitate the calculation of averages and
variances over long periods of time;7. Facilitate the expression of the target
as a single, numerical value;8. Result in the expression of the target as a maximum
or minimum target, never as a fixed number; and9. Do not result in biased statistical measurements
when actual results are compared against targets.8 Quality assurance The central agencies ensure quality of the specification
of outcome descriptions, outcome indicators, output descriptions and output performance indicator definitions and targets to ensure that no new outcomes, outputs, or their associated indicators are created unnecessarily and without conforming to the formal classification criteria and guidelines. A centralized processing and approvals system is established through which new outcome descriptions and output descriptions must be processed prior to incorporation into formal budget processes.
continued on next page
Table continued

200 Appendix 6 200 Appendix 7
Table continued
No. Assessment Aspect Criteria for Assessment9 Database management A centralized database is maintained that formalizes
the outcomes, outputs, and their associated indicators in a relational database that emulates the RBBM logical framework consistent with the business model. The database elements are tightly controlled through a centralized process that links with the quality assurance function. No new elements can be incorporated without strict adherence to the quality assurance approvals process.
10 Analytical reports (including budget documents)
Budget reports incorporate performance data for multiple years, including the estimated outturn for the last budget year against the target, the actual outturn for the 2 years prior to the last budget year and forecast for the coming budget year and 2 years forward.Analytical reports clearly explain divergences of performance from target, explaining why over or underperformance in outcome indicators may or may not have been due to government interventions, and why over or underperformance in delivering outputs was due to management action planning or unforeseen circumstances.Budget documents should only report on final outputs delivered to clients external to the Agency and should not include discussion of intermediate or internal outputs. Discussion outcomes should be in relation to Final Outcome and Intermediate Outcomes but should exclude discussion or Organizational Outcomes.
11 Output costingb Output costing should reflect the current state of the accounting system in government. Where cash accounting is used, output costing can only be related to budget allocations and operating costs. Where accrual accounting is in use, output costing should include depreciation of capital, a capital use charge, and an allocation of debt interest cost. The cost of all overheads (internal outputs) should be allocated across final outputs. All intermediate output costs should be allocated to the final outputs to which they contribute.
12. Coverage of formal manuals and guidelinesc
Formal manual and guidelines should incorporate all of the advice above plus provide work examples, particularly for output costing.
RBBM = results-based budgeting management.a Note that a client group can be identified with more than one Agency Output, and an Agency Output may impact on more than one outcome
indicator and more than one segment of the population. However, we should always attempt to identify our primary target population and our first order OIs during the planning process. These should be stable over the term of the Output’s delivery: 1 to 100 years, although additional statistical correlations with population segments and OIs may be identified and established along the journey.
b This aspect of RBBM was not assessed.c This aspect was assessed as part of criteria 1.Source: Author.
APPENDIX 8Documents Consulted for Country Cases
Australia
Agency Resourcing 2005–2006, including Appropriation (Parliamentary Departments) Bill (No. 1) 2005–2006 Appropriation Bill (No. 1), 2005–2006 Appropriation Bill (No. 2) 2005–2006
Budget Measures, 2005–2006Budget Strategy and Outlook, 2005–2006Department of Agriculture Annual Report, 2013–2014Department of Education Annual Report, 2013–2014Department of Education, Training, and Youth Affairs Annual Report, 1999–2000Department of Finance Annual Report. 2013–2014Department of Finance Annual Report. Guide to Preparing the 2015–16 Portfolio Budget StatementsDepartment of Finance Annual Report. Guidelines for the Preparation of Portfolio Budget Statements,
2001–2002Department of Finance Annual Report. Outcome Statements Policy and Approvals Process, June 2009Department of Finance Annual Report. Performance Information and Indicators Guide, October 2010Department of Finance and Administration. The Outcomes and Outputs Framework Guidance Document,
November 2000Department of Health Annual Report, 2013–2014, Volume 1Department of Health Annual Report, 2013–2014, Volume 2Department of Prime Minister and Cabinet Annual Report, 2013–2014 Portfolio Budget Statements, 2005–2006. Agriculture, Fisheries and Forestry Portfolio Budget Initiatives
and Explanations of Appropriations Specified by Outcomes and Outputs by Agency Budget Related Paper No. 1.1
Portfolio Budget Statements, 2013–2014. Department of Infrastructure and TransportPortfolio Budget Statements, 2014–2015. Budget Related Paper No. 1.1 Agriculture Portfolio: Budget
Initiatives and Explanations of Appropriations Specified by Outcomes and Programmes by AgencyPortfolio Budget Statements User Guidelines, 2001–2002Portfolio Budget Statements User Guidelines, 2015–2016. Education and Training PortfolioPortfolio Budget Statements User Guidelines, 2015–2016. Finance PortfolioPortfolio Budget Statements User Guidelines, 2005–2006. Treasury PortfolioPortfolio Budget Statements User Guidelines, 2015–2016. Treasury PortfolioPublic Governance, Performance and Accountability, Act 2013

202 Appendix 8
The Treasury Annual Report, 2003–2004The Treasury Annual Report, 2012–2013The Treasury Annual Report, 2013–2014User Guide to the Portfolio Budget Statements, 2005–2006
CanadaDepartment of Finance Canada, Departmental Performance Report, 2003–2004Department of Finance Canada, Departmental Performance Report for the period ending 31 March
2007Department of Finance Canada, Departmental Performance Report, 2008–2009Department of Finance Canada, Departmental Performance Report, 2009–2010Department of Finance Canada, Departmental Performance Report, 2010–2011Department of Finance Canada, Departmental Performance Report, 2011–2012Department of Finance Canada, Departmental Performance Report, 2012–2013Department of Finance Canada, Departmental Performance Report, 2013–2014Department of Finance Canada, Report on Plans and Priorities, 2015–2016Environment Canada. Departmental Performance Report, 2006–2007. Her Majesty the Queen in Right of
Canada, represented by the Minister of the EnvironmentEnvironment Canada. 2008–2009. Estimates Part III – Departmental Performance Report. Her Majesty
the Queen in Right of Canada, represented by the Minister of the EnvironmentEnvironment Canada. 2009–2010. Estimates Part III – Departmental Performance Report. Her Majesty the
Queen in Right of Canada, represented by the Minister of the EnvironmentEnvironment Canada. 2010–2011. Estimates Part III – Departmental Performance Report. Her Majesty the
Queen in Right of Canada, represented by the Minister of the EnvironmentEnvironment Canada. Departmental Performance Report, 2012–2013. Her Majesty the Queen in Right of
Canada, represented by the Minister of the Environment, 2013Environment Canada. 2013–2014. Estimates Part III – Departmental Performance Report. Her Majesty the
Queen in Right of Canada, represented by the Minister of the EnvironmentEnvironment Canada. 2015–2016. Report on Plans and Priorities. Her Majesty the Queen in Right of
Canada, represented by the Minister of the EnvironmentGovernment of Canada. 2010. Canada’s Economic Action Plan Year 2, Budget 2010. Her Majesty the
Queen in Right of Canada Government of Canada. 2014. Strong Leadership – A Balanced Budget, Low Tax Plan for Jobs, Growth and
Security. Her Majesty the Queen in Right of CanadaInfrastructure Canada. Departmental Performance Report, 2006–2007Infrastructure Canada. Departmental Performance Report, 2007–2008Infrastructure Canada. Departmental Performance Report, 2008–2009Infrastructure Canada. Departmental Performance Report, 2009–2010Infrastructure Canada. Departmental Performance Report, 2010–2011Infrastructure Canada. Departmental Performance Report, 2011–2012

Documents Consulted for Country Cases 203
Infrastructure Canada. Departmental Performance Report, 2012–2013Office of the Auditor General of Canada. Examining Public Spending Estimates Review: A Guide for
Parliamentarians, 2012Royal Canadian Mounted Police Departmental Performance Report for the period ending 31 March 2007Royal Canadian Mounted Police Departmental Performance Report for the period ending 31 March, 2008Royal Canadian Mounted Police Departmental Performance Report, 2008–2009Royal Canadian Mounted Police Departmental Performance Report, 2009–2010Royal Canadian Mounted Police Departmental Performance Report, 2013–2014Treasury Board of Canada. A Manager’s Guide to Operating BudgetsTreasury Board of Canada. 2015–2016 Estimates Parts I and II: The Government Expenditure Plan and
Main Estimates. Her Majesty the Queen in Right of Canada, as represented by the President of the Treasury Board, 2016
Treasury Board of Canada Secretariat. Companion Guide: The Development of Results-Based Management and Accountability Frameworks for Horizontal Initiatives, June 2002
Treasury Board of Canada Secretariat. Departmental Performance Report, 2003–2004Treasury Board of Canada Secretariat. 2006–2007 Departmental Performance ReportTreasury Board of Canada Secretariat. 2008–2009 Departmental Performance ReportTreasury Board of Canada Secretariat. 2009–2010 Departmental Performance ReportTreasury Board of Canada Secretariat. 2010–2011 Departmental Performance ReportTreasury Board of Canada Secretariat. 2011–2012 Departmental Performance ReportTreasury Board of Canada Secretariat. Departmental Performance Report, 2013–2014Treasury Board of Canada Secretariat. Descriptors for Government of Canada Outcome Areas, 23 February
2015. http://www.tbs-sct.gc.ca/ppg-cpr/descript-eng.aspx Treasury Board of Canada Secretariat. Directive on the Evaluation Function, 2009Treasury Board of Canada Secretariat. Results for Canadians – A Management Framework for the
Government of Canada, 2000Treasury Board of Canada Secretariat. Strategic Framework, 2004Treasury Board of Canada Secretariat. Whole of Government Framework, 2005
IndonesiaAnnual Plan 2014 AgricultureAnnual Plan 2014 DefenseAnnual Plan 2014 EducationAnnual Plan 2014 Environment and ForestryAnnual Plan 2014 FinanceAnnual Plan 2014 HealthAnnual Plan 2014 IndustryAnnual Plan 2014 Law, Justice, and Human RightsAnnual Plan 2014 Marine and FisheriesAnnual Plan 2014 Public Works and Housing

204 Appendix 8
Annual Plan 2015 AgricultureAnnual Plan 2015 EducationAnnual Plan 2015 Environment and ForestryAnnual Plan 2015 FinanceAnnual Plan 2015 HealthAnnual Plan 2015 IndustryAnnual Plan 2015 Law, Justice, and Human RightsAnnual Plan 2015 Marine and FisheriesAnnual Plan 2015 Public Works and HousingAnnual Plan 2016 AgricultureAnnual Plan 2016 EducationAnnual Plan 2016 Environment and ForestryAnnual Plan 2016 FinanceAnnual Plan 2016 HealthAnnual Plan 2016 IndustryAnnual Plan 2016 Law, Justice, and Human RightsAnnual Plan 2016 Marine and FisheriesAnnual Plan 2016 Public Works and HousingBudget 2014 AgricultureBudget 2014 BappenasBudget 2014 EducationBudget 2014 Environment and ForestryBudget 2014 FinanceBudget 2014 HealthBudget 2014 IndustryBudget 2014 Law, Justice, and Human RightsBudget 2014 Marine and FisheriesBudget 2014 Public Works and HousingBudget 2015 AgricultureBudget 2015 BappenasBudget 2015 EducationBudget 2015 Environment and ForestryBudget 2015 FinanceBudget 2015 HealthBudget 2015 IndustryBudget 2015 Law, Justice, and Human RightsBudget 2015 Marine and FisheriesBudget 2015 Public Works and Housing

Documents Consulted for Country Cases 205
MalaysiaBudget 2010Budget 2011Budget 2016Development Expenditure Budget, 2007Development Expenditure Budget, 2009Economic Transformation Program, 2013Government Transformation Program, 2011, 2012, 2013, 2014Ministry of Education Annual Reports, 2013, 2014Ministry of Finance. Estimated Federal Expenditure, 2011Ministry of Finance. Estimated Federal Expenditure, 2014Ministry of Finance. Estimated Federal Expenditure, 2016Ministry of Health Annual Reports, 2004, 2008, 2010, 2012Ministry of Science and Technology Monthly Performance Report, October 2013Ministry of Science and Technology Monthly Performance Report, November 2013Operating Expenditure Budget, 2007Operating Expenditure Budget, 2009
New Zealand
Beca and Covec. Infrastructure Performance Indicator Framework Development. Prepared for the National Infrastructure Unit, The Treasury. March 2013
A.-L. Cook. Managing for Outcomes in the New Zealand Public Management System. New Zealand Treasury Working Paper 04/15. September 2004
Economic Development and Infrastructure Sector – Information Supporting the Estimates 2013/2014. B.5a Vol. 1, Ministry of Transport
Economic Development and Infrastructure Sector – The Estimates of Appropriations 2015/2016. B.5 Vol. 1, Vote Transport
Education and Science Sector – Information Supporting the Estimates 2013/2014. B.5a Vol. 2, Vote Education
Education and Science Sector – Information Supporting the Estimates 2013/2014. B.5a Vol. 2, Vote Education Review Office
Education and Science Sector – Information Supporting the Estimates 2013/2014. B.5a Vol. 2, Vote Tertiary Education
Finance and Government Administration Sector – Information Supporting the Estimates 2013/2014. B.5a Vol.5, Statements of Forecast Service Performance, 2013–Ministry of Foreign Affairs and Trade Annual Report 2013/2014
Ministry of Health Annual Report for the year ended 30 June 2014New Zealand Transport Agency Annual Report for the year ended 30 June 2014New Zealand Transport Agency Statement of Intent, 2015–2019

206 Appendix 8
New Zealand Government. 2015 Budget Policy StatementState Services Commission Annual Report, 2015State Services Commission, Planning, and Managing for Results – Guidance for Crown Entities [archived]
Developed by the Treasury and the State Services Commission. In consultation with the Department of the Prime Minister and Cabinet. September 2005
State Services Commission. Getting Better at Managing for Outcomes: A Tool to Help Organizations Consider their Progress in Results-Based Management and Identify Development Objectives. June 2005
State Services Commission. Performance Measurement Advice and Examples on How to Develop Effective Frameworks. Developed by the State Services Commission and The Treasury, 2008
State Services Commission, the Treasury and the Department of the Prime Minister and Cabinet. Performance Improvement Framework. 2014
Statement of Forecast Service Performance – Department of Corrections, 2005/2006Statement of Forecast Service Performance – Department of Corrections, 2006/2007Statement of Performance – Department of Corrections, 2015/2016Statement of Performance Expectations New Zealand Fire Service, 2015/2016Statement of Service Performance, Ministry of Justice, New Zealand, 2011/2012Statement of Service Performance, Prime Minister and Cabinet, 2013/2014 Strategic Intentions 2015–2019: Department of CorrectionsThe Treasury. Budget Process Guide for Departments and Ministerial Offices, 2005The Treasury. Crown Entities Act 2004 Statement of Intent Minimum Content Requirements and
Expectations, 2014The Treasury. Putting It Together: An Explanatory Guide to New Zealand’s State Sector Financial
Management System Version 1.1. September 2011The Treasury Annual Report, 2013/2014The Treasury Annual Report, 2014/2015The Treasury Statement of Intent, 2013–2018The Treasury Statement of Intent, July 2015–June 2019
Philippines2014 General Appropriations Act: Agriculture2014 General Appropriations Act: Budget and Management2014 General Appropriations Act: Defense2014 General Appropriations Act: Education2014 General Appropriations Act: Environment2014 General Appropriations Act: Health2014 General Appropriations Act: Justice2014 General Appropriations Act: National Economic and Development Authority2014 General Appropriations Act: Public Works and Highways

Documents Consulted for Country Cases 207
2014 General Appropriations Act: Social Welfare and Development2014 General Appropriations Act: Tourism2014 General Appropriations Act: Trade and Industry2014 General Appropriations Act: Transportation and Communication2015 National Expenditure Program (NEP) Budget Book: Agriculture2015 NEP Budget Book: Budget and Management2015 NEP Budget Book: Defense2015 NEP Budget Book: Education2015 NEP Budget Book: Environment2015 NEP Budget Book: Health2015 NEP Budget Book: Judiciary2015 NEP Budget Book: National Economic and Development Authority2015 NEP Budget Book: Social Welfare and Development2015 NEP Budget Book: Tourism2015 NEP Budget Book: Trade and Industry2015 NEP Budget Book: Transportation and Communication2016 NEP Budget Book: Agriculture2016 NEP Budget Book: Budget and Management2016 NEP Budget Book: Defense2016 NEP Budget Book: Education2016 NEP Budget Book: Environment and Natural Resources2016 NEP Budget Book: Finance2016 NEP Budget Book: Health2016 NEP Budget Book: Justice2016 NEP Budget Book: National Economic and Development Authority2016 NEP Budget Book Public Works and Highways2016 NEP Budget Book: Social Welfare and Development2016 NEP Budget Book: Tourism2016 NEP Budget Book: Trade and Industry2016 NEP Budget Book: Transportation and CommunicationBudget 2008 Organizational Performance Indicator Framework (OPIF) Budget Book: AgricultureBudget 2008 OPIF Budget Book: Budget and ManagementBudget 2008 OPIF Budget Book: DefenseBudget 2008 OPIF Budget Book: EducationBudget 2008 OPIF Budget Book: EnvironmentBudget 2008 OPIF Budget Book: HealthBudget 2008 OPIF Budget Book: Judiciary

208 Appendix 8
Budget 2008 OPIF Budget Book: National Economic and Development AuthorityBudget 2008 OPIF Budget Book: Social Welfare and DevelopmentBudget 2008 OPIF Budget Book: TourismBudget 2008 OPIF Budget Book: Trade and IndustryBudget 2008 OPIF Budget Book: Transportation and CommerceBudget 2011 OPIF Budget Book: AgricultureBudget 2011 OPIF Budget Book: Budget and ManagementBudget 2011 OPIF Budget Book: DefenseBudget 2011 OPIF Budget Book: EducationBudget 2011 OPIF Budget Book: EnvironmentBudget 2011 OPIF Budget Book: HealthBudget 2011 OPIF Budget Book: JudiciaryBudget 2011 OPIF Budget Book: National Economic and Development AuthorityBudget 2011 OPIF Budget Book: Social Welfare and DevelopmentBudget 2011 OPIF Budget Book: TourismBudget 2011 OPIF Budget Book: Trade and IndustryBudget 2011 OPIF Budget Book: Transportation and CommunicationsBudget 2012 OPIF Budget Book: AgricultureBudget 2012 OPIF Budget Book: Budget and ManagementBudget 2012 OPIF Budget Book: DefenseBudget 2012 OPIF Budget Book: EducationBudget 2012 OPIF Budget Book: EnvironmentBudget 2012 OPIF Budget Book: HealthBudget 2012 OPIF Budget Book: JusticeBudget 2012 OPIF Budget Book: National Economic and Development AuthorityBudget 2012 OPIF Budget Book: Social Welfare and DevelopmentBudget 2012 OPIF Budget Book: TourismBudget 2012 OPIF Budget Book: Trade and IndustryBudget 2012 OPIF Budget Book: Transportation and CommunicationsBudget 2012 Department of Budget and ManagementBudget 2012 National Economic and Development AuthorityDepartment of Budget and Management. 2012. OPIF Reference Guide: Organizational Performance
Indicator Framework: A Guide to Results-Based Budgeting in the Philippines. Manila: Department of Budget and Management.
Medium-Term Development Plan, 2004–2010Philippine Development Plan, 2011–2016

Documents Consulted for Country Cases 209
Singapore
Annual Report 2014 Ministry of HealthAttorney General’s Chambers Administrative Expenditure Estimates, 2008Auditor General’s Office Administrative Expenditure Estimates, 2008J. R. Blöndal. 2006. Budgeting in Singapore. OECD Journal on Budgeting. 6 (1).Financial Year 2005 Budget BookFinancial Year 2006 Budget BookFinancial Year 2007 Budget BookFinancial Year 2015 Analysis of Revenue and ExpenditureFinancial Year 2015 Budget Household BookletFinancial Year 2015 Budget in Brief BookHealth Promotions Board Annual Report, 2013/2014Inland Revenue Authority of Singapore Annual Report, 2014/2015Land Transport Authority Annual Report, 2014/2015Ministry of Defence Annex, 2015Ministry of Education Administrative Expenditure Estimates, 2008Ministry of Education Annex, 2015Ministry of Environment and Water Resources Annex, 2015Ministry of Finance Annex, 2015Ministry of Health Report of the Director of Medical Services, 2014Ministry of Social and Families, 2015Public Utilities Board, 2010/2011Public Utilities Board, 2014/2015The Singapore Public Sector Outcomes Review, 2010The Singapore Public Sector Outcomes Review, 2012The Singapore Public Sector Outcomes Review, 2014Urban Redevelopment Authority Annual Report, 2014/2015
United Kingdom
Cabinet Office. Autumn Performance Report, 2008Civil Service Human Resources. Civil Service Competency Framework, 2012–2017Criminal Justice System Public Service Agreement, 2004Department for Environment. Food And Rural Affairs Public Service Agreement, 2004Department for Culture Media and Sport Input and Impact Indicators, 2015Department for Education. Performance Indicators in Primary Schools: A Comparison of Performance
on Entry to School and the Progress Made in the First Year in England and Four Other Jurisdictions Research Report. June 2014
Department of Health. Framework Agreement between the Department of Health and NHS England, 2014

210 Appendix 8
Department of Health. Public Service Agreement, 2004Department for Transport Annual Report and Accounts, 2013–2014Department for Transport Public Service Agreement, 2004Department for Work and Pensions Public Service Agreement, 2004The Health and Safety Executive Annual Report and Accounts, 2013/2014HM Treasury. 2004 Spending Review of Public Service Agreements, 2005–2008. July 2004HM Treasury. Annual Report and Accounts, 2013–2014HM Treasury. Autumn Performance Report Progress Report on HM Treasury Public Service Agreement
Targets. December 2007HM Treasury. Budget 2015. Crown. 2015HM Treasury. Business Plan, 2011-2015. November 2010HM Treasury. Business Plan and Annexes, 2012–2015. 31 May 2012HM Treasury. Input Impact Indicators, 2012HM Treasury. Input Impact Indicators, 2013HM Treasury. Public Service Agreement, 2004HM Treasury. Simplifying and Streamlining Statutory Annual Report and AccountsHM Revenue and Customs Public Service Agreement, 2004Home Office Public Service Agreement, 2004Ministry of Defence Public Service Agreement, 2004Target Metrics for HM Passports, 2013–2014
References
Abramo, C. W. 2002. Access to Information—A Long Way to Go. Public Sector Transparency and Accountability: Making it Happen. Paris: OECD Publishing. http://dx.doi.org/10.1787/9789264176287-en
ADB. 2013. Results-Based Management Framework in the Philippines: A Guidebook. Manila.
Athanasopoulou, A. et al. 2013. Evaluation in Government. London: National Audit Office.
Auditor-General of New Zealand. 2008. Discussion Paper—The Auditor-General’s Observations on the Quality of Performance Reporting. Wellington: Office of the Auditor-General.
Australian National Audit Office (ANAO). 2007. Application of the Outcomes and Outputs Framework. Canberra: Commonwealth of Australia.
Carlin, T. 2002. Performance and Transparency: Are Australia’s “Leading Edge” Systems Really Working? In OECD/OAS Public Sector Transparency and Accountability: Making it Happen. Paris: OECD Publishing.
Commonwealth Department of Finance. 2014. Commonwealth Performance Framework: Concept Paper. Canberra: Commonwealth of Australia.
______. 2014b. Enhanced Commonwealth Performance Framework: Discussion Paper. Canberra: Commonwealth of Australia.
Cook, A. 2004. Managing for Outcomes in the New Zealand Public Management System. Wellington: New Zealand Treasury.
Curristine, T. et al. 2015. Malaysia Technical Assistance Report—Strengthening Outcome- Based Budgeting. IMF Country Report No. 15/266. Washington, DC: International Monetary Fund.
Department of Budget and Management. 2012. OPIF Reference Guide: Organizational Performance Indicator Framework: A Guide to Results-Based Budgeting in the Philippines. Manila: Department of Budget and Management.
Department of Finance and Administration. 2000. The Outcomes and Outputs Framework Guidance Document. Canberra: Commonwealth of Australia.
Diamond, J. and K. Pokar. 2005. Introducing Financial Management Information Systems in Developing Countries. IMF Working Paper No. WP/05/196. Washington, DC: International Monetary Fund.
Dormer, R. and D. Gill. 2009. Managing for Performance in New Zealand’s Public Service—A Loosely Coupled Framework? Wellington: Victoria University.
European Commission Directorate-General for Agriculture and Rural Development. 2001. A Framework for Indicators for the Economic and Social Dimensions of Sustainable Agriculture and Rural Development. Brussels: European Commission.
European Communities. 2007. Manual on Sources and Methods for the Compilation of COFOG Statistics: Classification of the Functions of Government (COFOG). Luxembourg: European Union.
French, D. et al. 2009. Performance Frameworks and Board Reporting I: A Review by the Performance Measurement Practice. London: National Audit Office.

212 References
Global Expert Team (PSP-GET). 2010. Final Report Program Budgeting in Malaysia: Implementing the Outcomes-Based Approach in Malaysia. Washington, DC: World Bank.
Guthrie, J., O. Olson, and C. Humphrey. 1999. Debating Development in New Public Financial Management: The Limits of Global Theorising and Some New Ways Forward. Financial Accountability and Management. 15 (3) and (4). pp. 0267–4424.
Hagen, J. 1968. Program Budgeting CSE Report Number 7. Los Angeles: Center for the Study of Evaluation, UCLA Graduate School of Management.
Harris, L. 2005. UK Public Sector Reform and the “Performance Agenda” in UK Local Government—HRM Challenges and Dilemmas. Personnel Review. 34 (6). pp. 681−696.
Hawke, L. 2007. Performance Budgeting in Australia. OECD Journal on Budgeting. 7(3).
HM Treasury, Cabinet Office, National Audit Office, Audit Commission, and Office for National Statistics. 2008. Choosing the Right Fabric: A Framework for Performance Information. London: United Kingdom Government.
Holmes, M. and A. Evans. 2003. A Review of Experience in Implementing Medium-Term Expenditure Frameworks in a PRSP Context: A Synthesis of Eight Country Studies. London: Overseas Development Institute.
International Monetary Fund (IMF). 2014. Malaysia: Selected Issues. IMF Country Report No. 14/82. Washington, DC: IMF.
Jones, L. and D. Kettl. 2003. Assessing Public Management Reform in an International Context. International Public Management Review Journal. International Public Management Network.
Kibblewhite, A. and C. Ussher. 2002. New Zealand Treasury Outcome-Focused Management in New Zealand. OECD Journal on Budgeting. Paris: OECD.
Lim, S. P. 2000. Towards Good Governance: Promoting Operational Efficiency and Accountability. Paper presented at the NUS−World Bank Institute East Asia Urban and City Management Course. Held at <<place?>> on 1−14 May.
MacKay, K. 2011. The Australian Government’s Performance Framework. Evaluation Capacity Development Working Paper No. 25. Washington, DC: World Bank.
———. 2011. The Performance Framework of the Australian Government, 1987 to 2011. OECD Journal on Budgeting. (3). <<no pages?>>
Matheson, A., G. Scanlan, and R. Tanner. 1996. Strategic Management in Government: Extending the Reform Model in New Zealand. State Services Commission, New Zealand. Paper presented by Ross Tanner, Deputy State Services Commissioner, to the OECD’s Public Management Service. Paris.
Mucciarone, M. and J. Neilson. 2011. Performance Reporting in the Malaysian Government. Asian Academy of Management Journal of Accounting and Finance. 7(2). pp. 35–77.
National Audit Office. 2011. Performance Frameworks and Board Reporting II. London: UK National Audit Office.
_____. 2013. Evaluation in Government. London: UK National Audit Office.
Novick, D. 1996. Origin and History of Program Budgeting. Santa Monica, California: Rand Corporation.
Office of Program Policy Analysis and Government Accountability. 1997. A Report on Performance-Based Budgeting in Context: History and Comparison. Tallahassee: Florida State Legislature.

References 213
Organization for Economic Co-operation and Development (OECD). 2009. Classification of the Functions of Government (COFOG). Government at a Glance 2009. Paris: OECD Publishing. http://dx.doi.org/10.1787/9789264061651-37-en
Panchamia, N. and P. Thomas. 2010. Civil Service Reform in the Real World—Patterns of Success in UK Civil Service Reform. London: Institute for Government.
Perrin, B. 2007. Moving from Outputs to Outcomes: Practical Advice from Governments around the World. In Breul and Moravitz, eds. Integrating Performance and Budgets: The Budget Office of Tomorrow (IBM Center for the Business of Government). <<PLACE?>>: Rowman & Littlefield Publishers, Inc.
Pretorius, C. and N. Pretorius. 2009. Review of Public Financial Management Reform Literature. London: Department for International Development.
Public Service Commission. 2009. A Guide for Performance Practitioners: Organisational Performance Management—Bringing the Business Together. Brisbane: The State of Queensland (Public Service Commission).
Robinson, T. R. 2007. Presentation at the Conference on Performance-Based Budgeting, Warsaw, Poland, sponsored by the European Social Fund Operational Program—Human Capital. 7−9 November.
Schick, A. 1998. Why Most Developing Countries Should Not Try New Zealand Reforms. The World Bank Research Observer. Washington, DC: World Bank.
_____. 2001. Reflections on the New Zealand Model, Treasury. Wellington. http://www.treasury.govt.nz/academiclinkages/schick/schick-rnzm01.pdf
Scott, G., P. Bushnell, and N. Sallee. 1990. Reform of the Core Public Sector: New Zealand Experience. Governance. (3). pp. 138–167.
Treasury Board of Canada Secretariat. Whole-of-Government Framework. http://www.tbs-sct.gc.ca/ppg-cpr/frame-cadre-eng.aspx
University of Sydney. Family Medicine Research Centre. http://sydney.edu.au/medicine/fmrc/classifications/

IMPLEMENTING RESULTS-BASED BUDGET MANAGEMENT FRAMEWORKSAN ASSESSMENT OF PROGRESSIN SELECTED COUNTRIESDECEMBER 2017
ASIAN DEVELOPMENT BANK
ASIAN DEVELOPMENT BANK6 ADB Avenue, Mandaluyong City1550 Metro Manila, Philippineswww.adb.org
Implementing Results-Based Budget Management Frameworks An Assessment of Progress in Selected Countries
The use by governments of a results-based budgeting expenditure framework is well established around the world as a concept. However, its implementation as an analytical tool and policy driver is highly dependent on relationships that must be modelled with statistics. In this regard, there would appear to be significant gaps between concept and implementation. In order for governments to obtain clarity with respect to policy effectiveness and the assessment of bureaucratic effectiveness, a robust statistical framework must be developed to define outputs and outcome indicators. This publication examines a select group of countries that have led the foray into results-based budgeting and identifies weaknesses in their implementation from a statistical analysis perspective. It suggests some guidelines for the development of output descriptions, output indicators and outcome indicators, and provides a potential system for classifying output linkages to outcome groups and outcome indicators that might be easily identified through the classification of the functions of government (COFOG) expenditure classification system used today by most countries around the world.
About the Asian Development Bank
ADB’s vision is an Asia and Pacific region free of poverty. Its mission is to help its developing member countries reduce poverty and improve the quality of life of their people. Despite the region’s many successes, it remains home to a large share of the world’s poor. ADB is committed to reducing poverty through inclusive economic growth, environmentally sustainable growth, and regional integration.
Based in Manila, ADB is owned by 67 members, including 48 from the region. Its main instruments for helping its developing member countries are policy dialogue, loans, equity investments, guarantees, grants, and technical assistance.