AN APPROACH TO EVALUATING ALTERNATIVES FOR … · AN APPROACH TO EVALUATING ALTERNATIVES FOR WIND...
13
South African Journal of Industrial Engineering December 2016 Vol 27(4), pp 153-165 153 AN APPROACH TO EVALUATING ALTERNATIVES FOR WIND POWER PLANT LOCATIONS A.U. Rehman 1 * ARTICLE INFO Article details Submitted by authors 20 Apr 2016 Accepted for publication 1 Sep 2016 Available online 6 Dec 2016 Contact details * Corresponding author [email protected] Author affiliations 1 Department of Industrial Engineering, College of Engineering, King Saud University, Riyadh, Saudi Arabia DOI http://dx.doi.org/10.7166/27-4-1545 ABSTRACT Multi-criteria decision approaches are preferred for achieving multi- dimensional sustainable renewable energy goals. A more critical issue faced by the wind power industry is the selection of a location to tap prospective energy, which needs to be evaluated on multiple measures. In this paper, the aim is to assess and rank alternative wind power plant locations in Saudi Arabia. The approach presented here takes multiple criteria into consideration, such as wind speed, wind availability, site advantages, terrain details, risk and uncertainty, technology used, third party support, projected demand, types of customers, and government policies. A comparative analysis of feasible alternatives that satisfy all multi- criteria objectives is carried out. The results obtained are subjected to sensitivity analysis. Concepts such as ‘threshold values’ and ‘attribute weights’ make the approach more sensitive. OPSOMMING Multikriteria besluitnemingsbenaderings word verkies om multi- dimensionele, volhoubare en hernubare energie doelstellings te bereik. ʼn Belangrike kwessie vir die windkragindustrie is die identifisering van ʼn geskikte ligging wat onderhewig is aan verskeie kriteria. Hierdie artikel assesseer en rangskik verskeie potensiële windkragopwekking liggings in Saoedi-Arabië. Die voorgestelde benadering neem meervoudige kriteria, onder andere wind spoed en wind beskikbaarheid, ligging voordele, terrein detail, risiko en onsekerheid, die tegnologie wat gebruik word, derdeparty ondersteuning, geprojekteerde vraag, die tipe kliënte en regeringsbeleide, in ag. ʼn Vergelykende analise van uitvoerbare alternatiewe wat aan al die kriteria doelstellings voldoen is uitgevoer. Die daaropvolgende resultate is dan aan ʼn sensitiwiteitsanalise onderwerp. Konsepte soos drempelwaardes en eienskapgewigte maak die benadering meer sensitief. 1 INTRODUCTION According to various published reports and expert opinions, it is evident that fossil fuels have an increasingly negative impact at a global level. Considering present global developments, sustainable renewable energy options play a vital role; and so choosing these options is being encouraged globally [1]. Common sources of renewable energy include solar energy, wind energy, and ocean energy. It is evident from the published literature that renewable energy is a focus of planning, implementation, and development activities in local and global energy programmes [2, 3]. Decision- making in the renewable energy sector is very complex and difficult (see Figure 1), where multiple criteria and their respective objectives have to be considered in the decision analysis [4]. Researchers and practitioners have adopted multi-criteria decision analysis in a number of industrial applications — for example the fuzzy approach in manufacturing technology investment decisions [5]; the fuzzy analytical hierarchy approach [6] for evaluating energy plans; and the analytical hierarchy approach [7] to justify non-financial decisions about manufacturing. Similarly, researchers
Transcript of AN APPROACH TO EVALUATING ALTERNATIVES FOR … · AN APPROACH TO EVALUATING ALTERNATIVES FOR WIND...

South African Journal of Industrial Engineering December 2016 Vol 27(4), pp 153-165
153
AN APPROACH TO EVALUATING ALTERNATIVES FOR WIND POWER PLANT LOCATIONS
A.U. Rehman1*
ARTICLE INFO
Article details Submitted by authors 20 Apr 2016 Accepted for publication 1 Sep 2016 Available online 6 Dec 2016 Contact details * Corresponding author [email protected] Author affiliations 1 Department of Industrial
Engineering, College of Engineering, King Saud University, Riyadh, Saudi Arabia
DOI http://dx.doi.org/10.7166/27-4-1545
ABSTRACT
Multi-criteria decision approaches are preferred for achieving multi-dimensional sustainable renewable energy goals. A more critical issue faced by the wind power industry is the selection of a location to tap prospective energy, which needs to be evaluated on multiple measures. In this paper, the aim is to assess and rank alternative wind power plant locations in Saudi Arabia. The approach presented here takes multiple criteria into consideration, such as wind speed, wind availability, site advantages, terrain details, risk and uncertainty, technology used, third party support, projected demand, types of customers, and government policies. A comparative analysis of feasible alternatives that satisfy all multi-criteria objectives is carried out. The results obtained are subjected to sensitivity analysis. Concepts such as ‘threshold values’ and ‘attribute weights’ make the approach more sensitive.
OPSOMMING
Multikriteria besluitnemingsbenaderings word verkies om multi-dimensionele, volhoubare en hernubare energie doelstellings te bereik. ʼn Belangrike kwessie vir die windkragindustrie is die identifisering van ʼn geskikte ligging wat onderhewig is aan verskeie kriteria. Hierdie artikel assesseer en rangskik verskeie potensiële windkragopwekking liggings in Saoedi-Arabië. Die voorgestelde benadering neem meervoudige kriteria, onder andere wind spoed en wind beskikbaarheid, ligging voordele, terrein detail, risiko en onsekerheid, die tegnologie wat gebruik word, derdeparty ondersteuning, geprojekteerde vraag, die tipe kliënte en regeringsbeleide, in ag. ʼn Vergelykende analise van uitvoerbare alternatiewe wat aan al die kriteria doelstellings voldoen is uitgevoer. Die daaropvolgende resultate is dan aan ʼn sensitiwiteitsanalise onderwerp. Konsepte soos drempelwaardes en eienskapgewigte maak die benadering meer sensitief.
1 INTRODUCTION
According to various published reports and expert opinions, it is evident that fossil fuels have an increasingly negative impact at a global level. Considering present global developments, sustainable renewable energy options play a vital role; and so choosing these options is being encouraged globally [1]. Common sources of renewable energy include solar energy, wind energy, and ocean energy. It is evident from the published literature that renewable energy is a focus of planning, implementation, and development activities in local and global energy programmes [2, 3]. Decision-making in the renewable energy sector is very complex and difficult (see Figure 1), where multiple criteria and their respective objectives have to be considered in the decision analysis [4]. Researchers and practitioners have adopted multi-criteria decision analysis in a number of industrial applications — for example the fuzzy approach in manufacturing technology investment decisions [5]; the fuzzy analytical hierarchy approach [6] for evaluating energy plans; and the analytical hierarchy approach [7] to justify non-financial decisions about manufacturing. Similarly, researchers

154
Figure 1: Sustainable renewable energy sector control factors [1]
have adopted multi-criteria decision approaches [8] in the evaluation of water resource alternatives in addition to energy systems. A more critical issue faced by the top management is the selection of a location to tap prospective wind energy that needs to be evaluated on multiple measures. Decision-makers may have to say ‘yes’ or ‘no’ to a particular option, and justify their decision. To do this, they have to conduct a comparative analysis of the alternatives. The purpose of the current study is to make decisions about the location of future wind energy generation facilities using a multi-criteria decision-making model. Hence, in this paper, an attempt is made to present an approach to assessing and ranking alternative wind power plant locations for a Saudi Arabian power generation company. A decision tree is developed for strategic selection of a wind power plant location. In order to overcome the challenge of ranking alternative locations, the ‘elimination and choice translating’ approach, based on concord and disconcord indices, is proposed. The adopted approach uses indifference preference analysis, which is based on the concordance index and on threshold values.
2 LITERATURE REVIEW
Multi-criteria decision-making (MCDM) approaches are currently gaining popularity in energy demand management. These approaches can handle both qualitative and quantitative criteria. It is evident that one has to evaluate the problems raised by conflicting and multiple objectives. It is also evident that experts have great difficulty in intuitively combining information in appropriate ways. Because of the limitations of such an intuitive decision-making process, discrete multi-criteria approaches are needed to help determine the worth of multi-attribute alternatives [6]. The first step in the application of any multi-criteria decision-making approach is the elimination of all dominant alternatives; and the final step is to select only one non-dominant alternative. A concise review of the most favoured multi-criteria decision-making approaches is presented below. Analytic hierarchy process (AHP): A multi-criteria decision-making approach introduced by Saaty [9]. The approach needs a decision tree with the goal at the top level, criteria and sub-criteria on the middle levels, and the alternatives at the bottom. In AHP, the experts and decision-makers do pair-wise comparisons and select the best alternative according to the highest rank between alternatives. The drawback of the approach is its unidirectional relationship characteristic that cannot handle the complexity of many problems. Analytic network process (ANP): The ANP methodology is a general form of the AHP, and was also introduced by Saaty [10]. ANP partly overcomes the drawback of AHP, and deals with the problem as a network of complex relationships between alternatives and criteria where all the elements are connected. To understand uses of ANP, refer to Pablo et al. [11]. The preference ranking organisation method for enrichment evaluation (PROMETHEE): This method uses positive and negative outranking flows to rank the alternatives. Both flows do not usually produce the same rankings. Subsequently, the approach considers the net outranking flow to perform a pair-wise comparison of alternatives in order to rank them against a number of criteria [12].

155
The elimination and choice translating reality (ELECTRE): The ELECTRE approach is focused on the dominance relationships between alternatives. It is based on the outranking relationships, and uses thresholds of indifference and preference to do pair-wise comparisons between alternatives [13]. Decision-makers prefer the ELECTRE approach over the other approaches due to its ability to incorporate the fuzzy nature of decision-making. The technique for order preference by similarity to ideal solutions (TOPSIS): The basic concept of the TOPSIS approach is to select an alternative that is the shortest distance from the negative ideal solution [14]. The approach demarcates the positive ideal and negative ideal solutions. The Euclidean distance approach is used to evaluate the relative closeness of the alternatives to the ideal solution. In general, multi-criteria decision-making approaches have the following basic steps [15]: (a) formulate the decision tree using alternatives, criteria, and sub-criteria; (b) determine the relative importance of the criteria and the impacts of the alternatives on these criteria; (c) process the numerical values to determine a ranking of each alternative, then apply value judgment about acceptable tradeoffs and evaluation; and (d) calculate the final ranking and make a decision. Researchers in the area of energy planning have discussed and compared multi-criteria decision-making methods, and presented their applications and expected outcomes [16]. It is evident that multi-criteria decision-making applications are preferred in the selection of power plant locations [17] and renewable energy [18], and in energy transportation planning [19-20]. Özkan et al. [21] make use of a hybrid multi-criteria approach for selection among energy storage alternatives. Arce et al. [22] published a review on the use of multi-criteria analysis in the evaluation of sustainable energy options. Wanderer and Herle [23] used a web-based multi-criteria approach for solar plant location preferences. Similarly, a gray grade approach [22], an analytical hierarchy approach [24], and a fuzzy approach [25] are used in rural area energy planning. Sola and de Miranda Mota [26] presented the multi-criteria PROMETHEE and Geometrical Analysis for Interactive decision Aid (GAIA) approaches particularly for industrial energy management. The graph theory approach is used to evaluate and select energy technologies [27]. Researchers have presented various applications of multi-criteria approaches as case studies. For example, Zhang et al. [28] evaluated clean energy alternatives in China; Ümran Şengül et al. [29] used an approach based on the similarity index to rank energy supply alternatives in Turkey; Tahri et al. [30] evaluated solar farm locations in Morocco; and Sharma et al. [31] made use of the fuzzy decision approach to select energy resources in India. From the literature it is evident that most approaches with multi-objective performance criteria need a systematic analysis at multiple decision levels, from tactical to operational. In order to overcome this challenge, the elimination and choice translating approach based on concord and disconcord indices is proposed. Details of the case in point, and the steps of the approach, are presented in the next section.
3 PROBLEM DEFINITION
In the light of global environmental requirements, a power industry in Saudi Arabia is interested in making use of a sustainable renewable wind energy option for power generation. The company generates and transmits power to major customers in Saudi Arabia and other Gulf countries. A critical issue that has been flagged is the selection of a location to tap prospective wind energy that needs to be evaluated on multiple measures. Five alternative locations were identified by the top management. It was evident that multiple criteria needed to be considered in selecting the best location. There might be multiple alternative solutions, resulting in exactly the same state of affairs. A decision tree that has multiple criteria is proposed to resolve this (see Figure 2). In the decision tree, the first level has a statement of the objective. The subsequent levels have criteria, and the last level represents the alternative options. The criteria that are eventually suggested to evaluate the power station are grouped into wind availability, site advantages, topography details, technology used, risk and uncertainty, third party support, and government policies. Seventeen criteria in all are suggested to evaluate wind-energy power plant locations (see Figure 2).

156
Figure 2: The proposed hierarchical decision model for to evaluation of wind farm plant locations
Power grid loss
Supply cost
Developm
ent scheme for
region
Cultural environmental
concerns
Criteria G
roup of criteria
Uncertainty of land and geological suitability
Evaluation of wind farm power plant location alternatives
Wind availability
Site advantages
Topography details
Technology used
Risk and uncertainty
Third party support
Governm
ent policies
Mean w
ind speed
Mean w
ind power density
Environmental issues
Acceptability to nearby population
Power dem
and by nearby population
Type of terrain
Technology cost
Natural/technical risk barriers
as aviation telecomm
unication conflicts
Threats of theft and damage
Proximity to electric pow
er supply
Transportation facility
Tip-speed ratio
WFL1: Alternative ‘a’ WFL5: Alternative ‘e’ WFL4: Alternative ‘d’ WFL2: Alternative ‘b’ WFL3: Alternative ‘c’
Wind farm location (WFL) alternatives
157
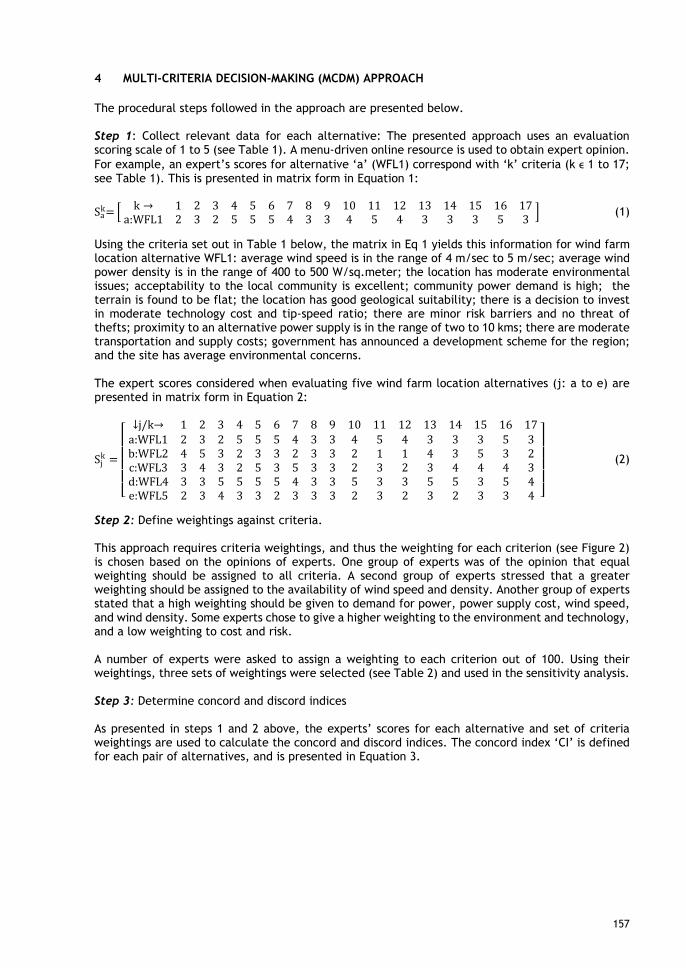
4 MULTI-CRITERIA DECISION-MAKING (MCDM) APPROACH
The procedural steps followed in the approach are presented below. Step 1: Collect relevant data for each alternative: The presented approach uses an evaluation scoring scale of 1 to 5 (see Table 1). A menu-driven online resource is used to obtain expert opinion. For example, an expert’s scores for alternative ‘a’ (WFL1) correspond with ‘k’ criteria (k ϵ 1 to 17; see Table 1). This is presented in matrix form in Equation 1:
Sak= � k → 1 2 3 4 5 6 7 8 9 10 11 12 13 14 15 16 17
a:WFL1 2 3 2 5 5 5 4 3 3 4 5 4 3 3 3 5 3 � (1)
Using the criteria set out in Table 1 below, the matrix in Eq 1 yields this information for wind farm location alternative WFL1: average wind speed is in the range of 4 m/sec to 5 m/sec; average wind power density is in the range of 400 to 500 W/sq.meter; the location has moderate environmental issues; acceptability to the local community is excellent; community power demand is high; the terrain is found to be flat; the location has good geological suitability; there is a decision to invest in moderate technology cost and tip-speed ratio; there are minor risk barriers and no threat of thefts; proximity to an alternative power supply is in the range of two to 10 kms; there are moderate transportation and supply costs; government has announced a development scheme for the region; and the site has average environmental concerns. The expert scores considered when evaluating five wind farm location alternatives (j: a to e) are presented in matrix form in Equation 2:
Sjk =
⎣⎢⎢⎢⎢⎡
↓j/k→ 1 2 3 4 5 6 7 8 9 10 11 12 13 14 15 16 17a:WFL1 2 3 2 5 5 5 4 3 3 4 5 4 3 3 3 5 3b:WFL2 4 5 3 2 3 3 2 3 3 2 1 1 4 3 5 3 2c:WFL3 3 4 3 2 5 3 5 3 3 2 3 2 3 4 4 4 3d:WFL4 3 3 5 5 5 5 4 3 3 5 3 3 5 5 3 5 4e:WFL5 2 3 4 3 3 2 3 3 3 2 3 2 3 2 3 3 4
⎦⎥⎥⎥⎥⎤
(2)
Step 2: Define weightings against criteria. This approach requires criteria weightings, and thus the weighting for each criterion (see Figure 2) is chosen based on the opinions of experts. One group of experts was of the opinion that equal weighting should be assigned to all criteria. A second group of experts stressed that a greater weighting should be assigned to the availability of wind speed and density. Another group of experts stated that a high weighting should be given to demand for power, power supply cost, wind speed, and wind density. Some experts chose to give a higher weighting to the environment and technology, and a low weighting to cost and risk. A number of experts were asked to assign a weighting to each criterion out of 100. Using their weightings, three sets of weightings were selected (see Table 2) and used in the sensitivity analysis. Step 3: Determine concord and discord indices As presented in steps 1 and 2 above, the experts’ scores for each alternative and set of criteria weightings are used to calculate the concord and discord indices. The concord index ‘CI’ is defined for each pair of alternatives, and is presented in Equation 3.

158 Table 1: Criteria evaluation scale
1 to 5 scale to evaluate each criterion Grouping of criteria Criteria (k ϵ 1 to 17) 1 2 3 4 5 Wind availability 1. Average wind speed < 4 m/s 4 – 5 m/s 5 – 6 m/s 6 – 7 m/s > 7 m/s
2. Average wind power density < 300 W/m2 300–400 W/m2 400 – 500 W/m2 500 – 600 W/m2 > 600 W/m2 Site advantages 3. Environmental issues Extensive Moderate Average Minor None
4. Acceptability Poor Marginal Satisfactory Good Excellent 5. Power demand Low Moderate High
Topography details 6. Type of terrain Rugged Complex Moderate Rolling Flat 7. Geological suitability Poor Marginal Satisfactory Good Excellent
Technology used 8. Technology cost High Moderate Low 9.Tip-speed ratio High Moderate Low
Risk and uncertainty 10. Threats of theft and damage Extensive Moderate Average Minor None 11. Natural/technical risk barriers Extensive Moderate None
Third party support 12. Proximity to electric power supply > 40 Km 20 – 40 Km 10 – 20 Km 2 – 10 Km < 2 Km 13. Transportation facility Poor Marginal Upgradable Good Excellent 14. Power grid loss Poor Marginal Satisfactory Good Excellent 15. Supply cost High Moderate Low
Government policies 16. Development scheme for region None Moderate High 17. Cultural environmental concerns Extensive Moderate Average Minor None
Note: For example, at a given wind farm location, if the average wind speed is found to be less than 4 m/s, then the location is assigned a minimum score of 1. Similarly, if the average wind speed is found to be more than 7 m/s, then that location is assigned a maximum score of 5.

159
Table 2: Criteria weightings
Criteria (k ϵ 1 to 17) Criteria weighting (Wk) out of 100
Set 1 Set 2 Set 3
1. Average wind speed m/s 60 90 90 2. Average wind power density W/m2 60 90 90 3. Environmental issues 60 90 60 4. Acceptability 60 50 60 5. Power demand 60 60 90 6. Type of terrain 60 60 60 7. Geological suitability 60 50 60 8. Technology cost 60 30 90 9. Tip-speed ratio 60 60 60 10. Threats of theft and damage 60 60 25 11. Natural/technical risk barriers 60 60 30 12. Proximity to electric power supply 60 60 25 13. Transportation facility 60 60 25 14. Power grid loss 60 90 25 15. Supply cost 60 60 90 16. Development scheme for region 60 25 70 17. Cultural environmental concerns 60 25 70
Total weighting (W) 1020 1020 1020
CI =
⎣⎢⎢⎢⎢⎡
↓j→ a:WFL1 b:WFL2 c:WFL3a:WFL1 * CIab CIacb:WFL2 CIba * CIbcc:WFL3 CIca CIcb *d:WFL4 CIda CIdb CIdce:WFL5 CIea CIeb CIec
d:WFL4 e:WFL5CIad CIaeCIbd CIbeCIcd CIce
* CIdeCIed *
⎦⎥⎥⎥⎥⎤
(3)
The value of each CI element in Equation 3 above is obtained using equations (4) to (6) below:
W = ∑ Wk
17k=1 (4)
⎣⎢⎢⎢⎢⎢⎢⎢⎢⎢⎢⎢⎡ {CIabk = 1 if Sak ≥ Sbk} {CIabk = 0 if Sak < Sbk}
{CIack = 1 if Sak ≥ Sck} {CIack = 0 if Sak < Sck} {CIadk = 1 if Sak ≥ Sdk} {CIadk = 0 if Sak < Sdk} {CIaek = 1 if Sak ≥ Sek} {CIaek = 0 if Sak < Sek} {CIbck = 1 if Sbk ≥ Sck} {CIbck = 0 if Sbk < Sck} {CIbdk = 1 if Sbk ≥ Sdk} {CIbdk = 0 if Sbk < Sdk} {CIbek = 1 if Sbk ≥ Sek} {CIbek = 0 if Sbk < Sek} {CIcdk = 1 if Sck ≥ Sdk} {CIcdk = 0 if Sck < Sdk} {CIcek = 1 if Sck ≥ Sek} {CIcek = 0 if Sck < Sek} {CIdek = 1 if Sdk ≥ Sek} {CIdek = 0 if Sdk < Sek}
{CIbak = 1 if Sbk ≥ Sak} {CIbak = 0 if Sbk < Sak} {CIcak = 1 if Sck ≥ Sak} {CIcak = 0 if Sck < Sak} {CIdak = 1 if Sdk ≥ Sak} {CIdak = 0 if Sdk < Sak} {CIeak = 1 if Sek ≥ Sak} {CIeak = 0 if Sek < Sak} {CIcbk = 1 if Sck ≥ Sbk} {CIcbk = 0 if Sck < Sbk}{CIdbk = 1 if Sdk ≥ Sbk} {CIdbk = 0 if Sdk < Sbk} {CIebk = 1 if Sek ≥ Sbk} {CIebk = 0 if Sek < Sbk} {CIdck = 1 if Sdk ≥ Sck} {CIdck = 0 if Sdk < Sck} {CIeck = 1 if Sek ≥ Sck} {CIeck = 0 if Sek < Sck} {CIedk = 1 if Sek ≥ Sdk} {CIedk = 0 if Sek < Sdk} ⎦
⎥⎥⎥⎥⎥⎥⎥⎥⎥⎥⎥⎤
(5)
⎣⎢⎢⎢⎢⎢⎢⎡{CIab= 1
W ∑ WkCIabk }m
k=1 {CIba= 1− CIab}
{CIad= 1
W ∑ WkCIadk }m
k=1 {CIda= 1 − CIad}
{CIbc=1
W ∑ WkCIbck }m
k=1 {CIcb= 1 − CIbc}
{CIbe=1
W ∑ WkCIbek }m
k=1 {CIeb= 1− CIbe}
{CIce=1
W ∑ WkCIcek }m
k=1 {CIec= 1 − CIce}
{CIac=1
W ∑ WkCIackm
k=1 } {CIca= 1− CIac}
{CIae=1
W ∑ WkCIaekm
k=1 } {CIea= 1− CIae}
{CIbd= 1
W ∑ WkCIbdk }m
k=1 {CIdb= 1 − CIbd}
{CIcd= 1
W ∑ WkCIcdk }m
k=1 {CIdc= 1 − CIcd}
{CIde=1
W ∑ WkCIdek }m
k=1 {CIed= 1− CIde}⎦⎥⎥⎥⎥⎥⎥⎤
(6)
In Equations (3) to (6) above, Sak implies alternative ‘a’ scores for each criterion k; CIabk is the concord index after comparing alternative ‘a’ with ‘b’ for a criterion ‘k’; CIab implies an aggregate concord index after comparing alternative ‘a’ with ‘b’ for all criteria (k ϵ 1 to 17); and Wk represents the set of criteria weightings defined by the decision-maker (see Table 2). Thus concord indices are obtained
160
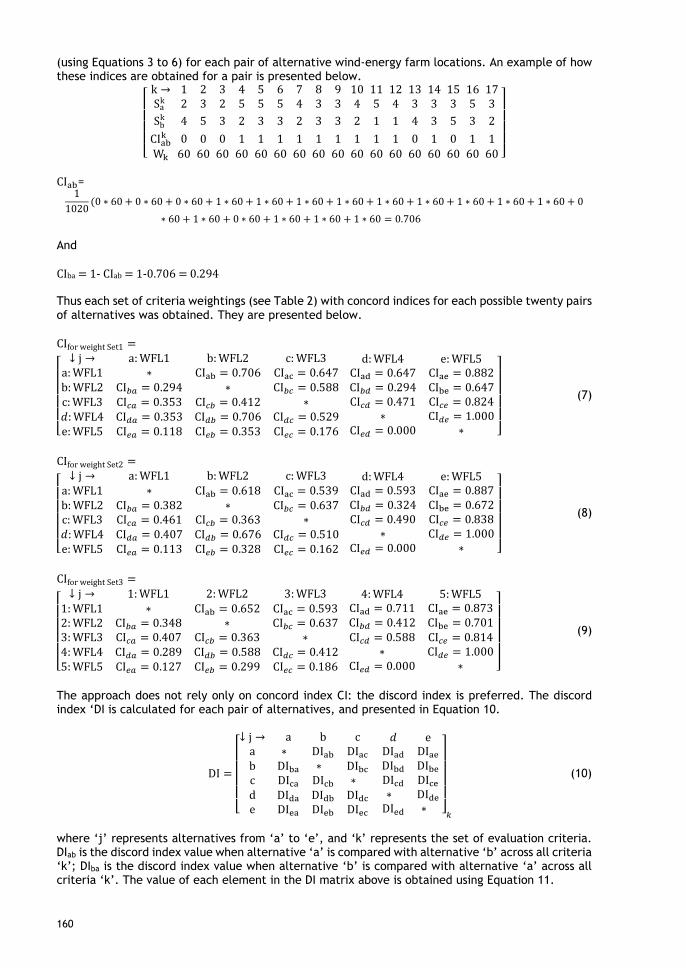
(using Equations 3 to 6) for each pair of alternative wind-energy farm locations. An example of how these indices are obtained for a pair is presented below.
⎣⎢⎢⎢⎢⎡
k → 1 2 3 4 5 6 7 8 9 10 11 12 13 14 15 16 17Sa
k 2 3 2 5 5 5 4 3 3 4 5 4 3 3 3 5 3Sb
k 4 5 3 2 3 3 2 3 3 2 1 1 4 3 5 3 2CIabk 0 0 0 1 1 1 1 1 1 1 1 1 0 1 0 1 1Wk 60 60 60 60 60 60 60 60 60 60 60 60 60 60 60 60 60
⎦⎥⎥⎥⎥⎤
CIab=
11020
(0 ∗ 60 + 0 ∗ 60 + 0 ∗ 60 + 1 ∗ 60 + 1 ∗ 60 + 1 ∗ 60 + 1 ∗ 60 + 1 ∗ 60 + 1 ∗ 60 + 1 ∗ 60 + 1 ∗ 60 + 1 ∗ 60 + 0∗ 60 + 1 ∗ 60 + 0 ∗ 60 + 1 ∗ 60 + 1 ∗ 60 + 1 ∗ 60 = 0.706
And CIba = 1- CIab = 1-0.706 = 0.294 Thus each set of criteria weightings (see Table 2) with concord indices for each possible twenty pairs of alternatives was obtained. They are presented below. CIfor weight Set1 =
⎣⎢⎢⎢⎢⎡↓ j → a: WFL1 b: WFL2 c: WFL3
a: WFL1 ∗ CIab = 0.706 CIac = 0.647b: WFL2 CI𝑏𝑏𝑏𝑏 = 0.294 ∗ CI𝑏𝑏𝑏𝑏 = 0.588c: WFL3 CI𝑏𝑏𝑏𝑏 = 0.353 CI𝑏𝑏𝑏𝑏 = 0.412 ∗𝑑𝑑: WFL4 CI𝑑𝑑𝑏𝑏 = 0.353 CI𝑑𝑑𝑏𝑏 = 0.706 CI𝑑𝑑𝑏𝑏 = 0.529e: WFL5 CI𝑒𝑒𝑏𝑏 = 0.118 CI𝑒𝑒𝑏𝑏 = 0.353 CI𝑒𝑒𝑏𝑏 = 0.176
d: WFL4 e: WFL5CIad = 0.647 CIae = 0.882CI𝑏𝑏𝑑𝑑 = 0.294 CIbe = 0.647CI𝑏𝑏𝑑𝑑 = 0.471 CI𝑏𝑏𝑒𝑒 = 0.824
∗ CI𝑑𝑑𝑒𝑒 = 1.000CI𝑒𝑒𝑑𝑑 = 0.000 ∗
⎦⎥⎥⎥⎥⎤
(7)
CIfor weight Set2 =
⎣⎢⎢⎢⎢⎡↓ j → a: WFL1 b: WFL2 c: WFL3
a: WFL1 ∗ CIab = 0.618 CIac = 0.539b: WFL2 CI𝑏𝑏𝑏𝑏 = 0.382 ∗ CI𝑏𝑏𝑏𝑏 = 0.637c: WFL3 CI𝑏𝑏𝑏𝑏 = 0.461 CI𝑏𝑏𝑏𝑏 = 0.363 ∗𝑑𝑑: WFL4 CI𝑑𝑑𝑏𝑏 = 0.407 CI𝑑𝑑𝑏𝑏 = 0.676 CI𝑑𝑑𝑏𝑏 = 0.510e: WFL5 CI𝑒𝑒𝑏𝑏 = 0.113 CI𝑒𝑒𝑏𝑏 = 0.328 CI𝑒𝑒𝑏𝑏 = 0.162
d: WFL4 e: WFL5CIad = 0.593 CIae = 0.887CI𝑏𝑏𝑑𝑑 = 0.324 CIbe = 0.672CI𝑏𝑏𝑑𝑑 = 0.490 CI𝑏𝑏𝑒𝑒 = 0.838
∗ CI𝑑𝑑𝑒𝑒 = 1.000CI𝑒𝑒𝑑𝑑 = 0.000 ∗
⎦⎥⎥⎥⎥⎤
(8)
CIfor weight Set3 =
⎣⎢⎢⎢⎢⎡↓ j → 1: WFL1 2: WFL2 3: WFL3
1: WFL1 ∗ CIab = 0.652 CIac = 0.5932: WFL2 CI𝑏𝑏𝑏𝑏 = 0.348 ∗ CI𝑏𝑏𝑏𝑏 = 0.6373: WFL3 CI𝑏𝑏𝑏𝑏 = 0.407 CI𝑏𝑏𝑏𝑏 = 0.363 ∗4: WFL4 CI𝑑𝑑𝑏𝑏 = 0.289 CI𝑑𝑑𝑏𝑏 = 0.588 CI𝑑𝑑𝑏𝑏 = 0.4125: WFL5 CI𝑒𝑒𝑏𝑏 = 0.127 CI𝑒𝑒𝑏𝑏 = 0.299 CI𝑒𝑒𝑏𝑏 = 0.186
4: WFL4 5: WFL5CIad = 0.711 CIae = 0.873CI𝑏𝑏𝑑𝑑 = 0.412 CIbe = 0.701CI𝑏𝑏𝑑𝑑 = 0.588 CI𝑏𝑏𝑒𝑒 = 0.814
∗ CI𝑑𝑑𝑒𝑒 = 1.000CI𝑒𝑒𝑑𝑑 = 0.000 ∗
⎦⎥⎥⎥⎥⎤
(9)
The approach does not rely only on concord index CI: the discord index is preferred. The discord index ‘DI is calculated for each pair of alternatives, and presented in Equation 10.
DI =
⎣⎢⎢⎢⎢⎡↓ j → a b c
a ∗ DIab DIacb DIba ∗ DIbcc DIca DIcb ∗d DIda DIdb DIdce DIea DIeb DIec
𝑑𝑑 eDIad DIaeDIbd DIbeDIcd DIce∗ DIde
DIed ∗
⎦⎥⎥⎥⎥⎤
𝑘𝑘
(10)
where ‘j’ represents alternatives from ‘a’ to ‘e’, and ‘k’ represents the set of evaluation criteria. DIab is the discord index value when alternative ‘a’ is compared with alternative ‘b’ across all criteria ‘k’; DIba is the discord index value when alternative ‘b’ is compared with alternative ‘a’ across all criteria ‘k’. The value of each element in the DI matrix above is obtained using Equation 11.

161
⎣⎢⎢⎢⎢⎡DIab=Max �𝑆𝑆𝑎𝑎
𝑘𝑘− 𝑆𝑆𝑏𝑏𝑘𝑘
𝑀𝑀𝑏𝑏𝑀𝑀 𝑆𝑆𝑘𝑘� for k ∈ 1 to m and DIba= 1 − DIab
⋮⋮
DIae=Max �𝑆𝑆𝑎𝑎𝑘𝑘− 𝑆𝑆𝑏𝑏
𝑘𝑘 𝑀𝑀𝑏𝑏𝑀𝑀 𝑆𝑆𝑘𝑘
� for k ∈ 1 to m and DIae= 1− DIae⎦⎥⎥⎥⎥⎤
(11)
In the equation above, for a given performance criterion ‘k’, Max Sk represents the maximum criterion score among all the alternatives. Thus, for each pair of alternatives, the discord index DI is calculated and the maximum value is assigned to that pair of alternatives. For example,
⎣⎢⎢⎢⎢⎢⎢⎢⎢⎡
Sjk↓j/k→ 1 2 3 4 5 6 7 8 9 10 11 12 13 14 15 16 17
a:WFL1 2 3 2 5 5 5 4 3 3 4 5 4 3 3 3 5 3b:WFL2 4 5 3 2 3 3 2 3 3 2 1 1 4 3 5 3 2c:WFL3 3 4 3 2 5 3 5 3 3 2 3 2 3 4 4 4 3d:WFL4 3 3 5 5 5 5 4 3 3 5 3 3 5 5 3 5 4e:WFL5 2 3 4 3 3 2 3 3 3 2 3 2 3 2 3 3 4
Sk = max ( Sjk) 4 5 5 5 5 5 5 3 3 5 5 4 5 5 5 5 4
Sak- Sb
k Max Sk -0.5 -0.4 -0.2 0.6 0.4 0.4 0.4 0 0 0.4 0.8 0.75 -0.2 0 -0.4 0.4 0.25
⎦⎥⎥⎥⎥⎥⎥⎥⎥⎤
DIab = max{ Sak- Sb
k Max Sk } = 0.8 𝑎𝑎𝑎𝑎𝑑𝑑 DIba = 1 − 0.8 = 0.2, thus DIs are obtained for each pair. The
obtained values of DI are presented in Equation 12 below:
DI =
⎣⎢⎢⎢⎢⎡↓ j → a b c
a ∗ 0.8 0.6b 0.2 ∗ 0.25c 0.4 0.75 ∗d 0.6 0.6 0.8e 0.4 0.5 0.6
𝑑𝑑 e0.4 0.60.4 0.50.2 0.4∗ 0.60.4 ∗
⎦⎥⎥⎥⎥⎤
(12)
Step 4: Set threshold value Next, the decision-maker has to set the threshold values (Ө and Ø). They are used to draw the outranking relationship graph. These values are used to decide the preference relationship for a given pair of alternatives. These pairs of alternatives exhibit performance scores Sak 𝑎𝑎𝑎𝑎𝑑𝑑 Sbk for a given criterion ‘k’. The three preference relationships are drawn using threshold values (Ө and Ø) as follows:
• If Sak − Sbk > Ө, then alternative ‘a’ is strongly preferred over alternative ‘b’. In other words ‘a is better than b’.
• If Ө < 𝑆𝑆ak − Sbk ≤ Ø, then alternative ‘a’ is not preferred over alternative ‘b’; that is, ‘b is better than a’.
• If �Sak − Sbk � ≤ Ø, then alternatives ‘a’ and ‘b’ are ‘equally preferred’. In other words, ‘a is at least as good as b’ or ‘a is not worse than b’.
These relationships were drawn for all criteria and then synthesised to obtain the outranking relationship. For threshold coefficient values, see Table 3. These multiple values are used further for the sensitivity analysis.
Table 3: Threshold coefficient values adopted in the study
Parameters Levels Values Threshold value Ө 4 0.8, 0.7, 0.6 & 0.5 Threshold value Ø 4 0.2, 0.3, 0.4 & 0.5

162
Step 5: Set outranking relationship and draw kernel graph Given two alternatives, ‘a’ and ‘b’, the outranking relationship between them is drawn using the concord index CIab, the discord index DIab, and the threshold values (Ө and Ø), because if CIab ≥ Ө and DIab ≤ Ø , then alternative ‘a’ is preferred over alternative ‘b’; that is, ‘a’ outranks ‘b’. This preference is highlighted graphically in a kernel graph, in which the choice of alternative ‘a’ over alternative ‘b’ is represented by an arrow ‘→’ from ‘a’ to ‘b’. Such outranking relationships are drawn for all pairs of alternatives for preset threshold values. For example, for a selected set of threshold values (Ө = 0.6 and Ø = 0.4), using matrix of CI (see Equation 7) and DI matrix (see Equation 10), the outranking relationship graph kernel is drawn. It can be concluded that the pairs that satisfy the condition CI ≥ 0.6 are (WFL1, WFL2), (WFL1, WFL3), (WFL1, WFL4) (WFL1, WFL5), (WFL2, WFL5), (WFL3, WFL5), (WFL4, WFL2), and (WFL4, WFL5); and the pairs that satisfy the condition DI ≤ 0.4 are (WFL1, WFL4), (WFL2, WFL1), (WFL2, WFL3), (WFL2, WFL4), (WFL3, WFL1), (WFL3, WFL4), (WFL3, WFL5), (WFL5, WFL1), and (WFL5, WFL4). Now, to draw the outranking relationship kernel graph, pairs of alternatives that satisfy both CI ≥ 0.60 and DI ≤ 0.40 are selected. In the above case, for the pairs (WFL1, WFL4) and (WFL3, WFL5), the concord index is more than 0.8 and the discord index is less than 0.40; so only two pairs satisfy. The outranking relationship kernel graph is drawn between these alternatives, as shown in Figure 3. The preference of alternative WFL3 over alternative WFL5 is represented by an arrow → from WFL3 to WFL5. And the preference of alternative WFL1 over alternative WFL4 is also represented by an arrow → from WFL1 to WFL4. From this graph, it is said that the alternatives WFL4 and WFL5 are the least preferred among the alternatives. In the same way, if decision-makers change the preference threshold values Ө to 0.5 and Ø to 0.5, the outranking relationship kernel graph is drawn between these alternatives (see Figure 4). From this graph, it is said that WFL2 is preferred over WFL3 and WFL5, while WFL1 is preferred over WFL4. WFL4 and WFL5 thus seem to be the worst choices.
Figure 3: Outranking relationship kernel graph for threshold values
Ө = 0.60 and Ø = 0.40
Figure 4: Outranking relationship kernel graph for threshold values
Ө = 0.5 and Ø = 0.5
In order to test the effect of uncertainties in the threshold values on the outranking performance of each alternative, a sensitivity analysis is performed; its details are presented in the next subsection.
4.1 Sensitivity analysis
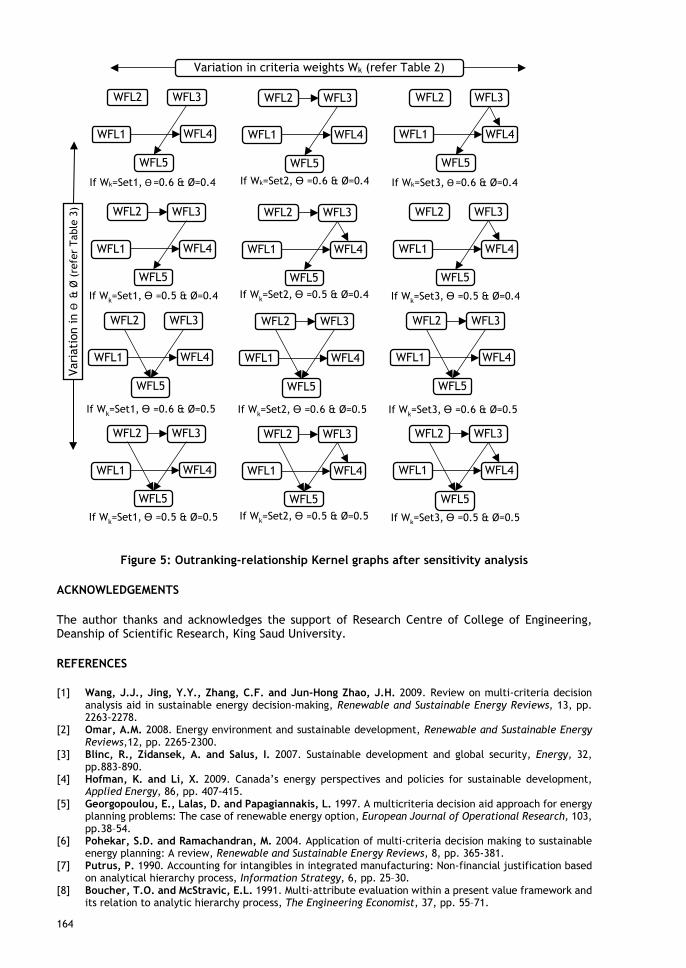
A sensitivity analysis [32-33] helps to study deviations in the outcome parameters of any model due to deviations in input parameter values. One needs to establish the effect of a variation in input variables on output variables. A sensitivity analysis can help the decision-maker to determine which parameters are the key drivers. Here, a sensitivity analysis is done to evaluate alternative wind farm locations according to variations in attribute and sub-criteria weights and threshold coefficients. Variations in input parameter threshold coefficient values (see Table 3) and three sets of attribute weights (see Table 2) are used for the sensitivity analysis. Since too much data was gathered after the sensitivity analysis, the sample final outranking relationship kernel graph obtained for selected pairs of threshold values and corresponding attribute weight sets are presented in Figure 5. Based on the kernel graph, the overall preference order of alternatives corresponding with the obtained changes in threshold values and sets of attribute weights is presented in Table 4.
WFL2 WFL3
WFL5
WFL4 WFL1
WFL2 WFL3
WFL5
WFL4 WFL1

163
Table 4: Preference order of alternative wind farm locations based on kernel graph
Overall preference order WFL1 WFL2 WFL3 WFL4 WFL5
1 1 2 3 4 From Figure 5, one notes that threshold values and attribute weights are sensitive to changes in the outranking relationship graph. The obtained ranking order of alternatives that correspond to changes in threshold values and sets of attribute weights is presented in Table 4. From Table 4, after the sensitivity analysis, it is evident that wind farm location WFL5 is found to be the least preferred other alternatives, while WFL1 and WFL2 are preferred options for the decision-maker over WFL3 and WFL4.
5 CONCLUSION
Renewable energies cater for varying global energy demand conditions. But there is risk in changing from an old energy system setup to any new one without prior evaluation. Mostly, in such cases, the alternatives need to be evaluated on multiple performance parameters. As presented in this paper, the Saudi Arabian power energy planners were interested in assessing and ranking wind power plant alternative locations to satisfy the dynamic competitive energy requirements. They identified suitable alternatives. Minimising cost was the priority in any decision analysis. The approach presented here was to show that any assessment of these alternatives needs to take multiple performance criteria into account. The decision managers had wind speed, wind availability, site advantage, terrain details, risk and uncertainty, technology used, third party support, projected demand, type of customers, and government policies as evaluating criteria (see Figure 2). Using the interactive tool, an alternative detail qualitative and quantitative data collection corresponding with multiple-attributes was done. The results obtained were further subjected to sensitivity analysis. From the sensitivity analysis it is clear that if, management wishes to set equal weighting for all criteria, WFL2 is the superior choice over the other four locations, and WFL4 and WFL5 are the worst choices. But, when a) high and equal weighting is set to available wind speed, area wind density, and surrounding environmental concerns, b) least and equal weighting is set to investment cost and government policies, and c) average weighting is set to loss, threats/risk associated, power demand, and supply cost, the selection order is found to be WFL1, WFL2, WFL4, WFL3, WFL5. Similarly, when a) high and equal weighting is set to available wind speed, area wind density, investment cost, power demand, and supply cost, b) least and equal weighting is set to loss, threats/risk associated, and c) average weighting is set to government policies and technology used, the ranking order is found to be WFL2, WFL1, WFL3, WFL4, WFL5. Thus, by assessing alternative wind farm locations, decision-makers proposed to select either WFL1 or WFL2. It is evident that the proposed MCDM approach is preferable because it needs very few controlling factors, compared with other existing multi-criteria approaches. The approach is also easy to understand and is less biased in the decision-making process. The approach is characterised by thresholds and outranking relationships. The thresholds are defined by the decision-makers. The approach also generates a system of binary outranking relationships among the alternatives: the alternative is preferred if, and only if, both the concordance and discordance conditions are satisfied. This approach’s major advantage is that it takes into account uncertainty and fuzziness. One disadvantage is that, due to the way preferences are incorporated, the lowest performances under certain criteria are not displayed. Another interesting challenge might be the development of a model to incorporate real-time criteria. In future, one could also verify the consistency of decisions using other multi-criteria approaches.
164
Figure 5: Outranking-relationship Kernel graphs after sensitivity analysis
ACKNOWLEDGEMENTS
The author thanks and acknowledges the support of Research Centre of College of Engineering, Deanship of Scientific Research, King Saud University.
REFERENCES
[1] Wang, J.J., Jing, Y.Y., Zhang, C.F. and Jun-Hong Zhao, J.H. 2009. Review on multi-criteria decision analysis aid in sustainable energy decision-making, Renewable and Sustainable Energy Reviews, 13, pp. 2263-2278.
[2] Omar, A.M. 2008. Energy environment and sustainable development, Renewable and Sustainable Energy Reviews,12, pp. 2265-2300.
[3] Blinc, R., Zidansek, A. and Salus, I. 2007. Sustainable development and global security, Energy, 32, pp.883-890.
[4] Hofman, K. and Li, X. 2009. Canada’s energy perspectives and policies for sustainable development, Applied Energy, 86, pp. 407-415.
[5] Georgopoulou, E., Lalas, D. and Papagiannakis, L. 1997. A multicriteria decision aid approach for energy planning problems: The case of renewable energy option, European Journal of Operational Research, 103, pp.38–54.
[6] Pohekar, S.D. and Ramachandran, M. 2004. Application of multi-criteria decision making to sustainable energy planning: A review, Renewable and Sustainable Energy Reviews, 8, pp. 365-381.
[7] Putrus, P. 1990. Accounting for intangibles in integrated manufacturing: Non-financial justification based on analytical hierarchy process, Information Strategy, 6, pp. 25–30.
[8] Boucher, T.O. and McStravic, E.L. 1991. Multi-attribute evaluation within a present value framework and its relation to analytic hierarchy process, The Engineering Economist, 37, pp. 55–71.
Variation in criteria weights Wk (refer Table 2) Va
riat
ion
in Ө
& Ø
(re
fer
Tabl
e 3)
WFL2 WFL3
WFL5
WFL4 WFL1
If Wk=Set1, Ө =0.6 & Ø=0.4
WFL2 WFL3
WFL5
WFL4 WFL1
WFL2 WFL3
WFL5
WFL4 WFL1
If Wk=Set3, Ө =0.6 & Ø=0.4 If Wk=Set2, Ө =0.6 & Ø=0.4
WFL2 WFL3
WFL5
WFL4 WFL1
If Wk=Set1, Ө =0.5 & Ø=0.4
WFL2 WFL3
WFL5
WFL4 WFL1
WFL2 WFL3
WFL5
WFL4 WFL1
If Wk=Set3, Ө =0.5 & Ø=0.4 If Wk=Set2, Ө =0.5 & Ø=0.4
WFL2 WFL3
WFL5
WFL4 WFL1
If Wk=Set1, Ө =0.6 & Ø=0.5
WFL2 WFL3
WFL5
WFL4 WFL1
WFL2 WFL3
WFL5
WFL4 WFL1
If Wk=Set3, Ө =0.6 & Ø=0.5 If Wk=Set2, Ө =0.6 & Ø=0.5
WFL2 WFL3
WFL5
WFL4 WFL1
If Wk=Set1, Ө =0.5 & Ø=0.5
WFL2 WFL3
WFL5
WFL4 WFL1
WFL2 WFL3
WFL5
WFL4 WFL1
If Wk=Set3, Ө =0.5 & Ø=0.5 If Wk=Set2, Ө =0.5 & Ø=0.5

165
[9] Saaty, T.L. 1980. The analytic hierarchy process. New York: McGraw-Hill. [10] Saaty, T.L. 1996. Decision-making with dependence and feedback: The analytic network process.
Pittsburgh: RSW Publications. [11] Aragonés-Beltrán, P., Chaparro-González, F., Pastor-Ferrando, J.-P. and Pla-Rubio, A. 2014. An AHP
(Analytic Hierarchy Process)/ANP (Analytic Network Process)-based multi-criteria decision approach for the selection of solar-thermal power plant investment projects, Energy, 66, pp. 222-238.
[12] Oberschmidt, J., Geldermann, J., Ludwig, J. and Schmehl, M., 2010. Modified PROMETHEE approach for assessing energy technologies, International Journal of Energy Sector Management, 4(2), pp. 183-212.
[13] Beccali, M., Cellura, M. and Mistretta, M. 2003. Decision-making in energy planning: Application of the Electre method at regional level for the diffusion of renewable energy technology, Renewable Energy, 28(13), pp. 2063-2087.
[14] Wang, J.J., Jing, Y.Y., Zhang, C.F., Shi, G.H. and Zhang, X.T. 2008. A fuzzy multi-criteria decision-making model for trigeneration system, Energy Policy, 36(10), pp. 3823-3832.
[15] Greening L.A. and Bernow, S. 2004. Design of coordinated energy and environmental policies: Use of multi-criteria decision-making, Energy Policy, 32, pp. 721–735.
[16] Ozelkan, E.C. and Duckstein, L. 1996. Analyzing water resources alternatives and handling criteria by multicriterion decision techniques, Journal of Environmental Management, 48, pp. 69–96.
[17] Raju, K.S. and Pillai, C.R.S. 1999. Multicriterion decision making in performance evaluation of irrigation projects, European Journal of Operational Research, 112(3), pp. 479–88.
[18] Afgan, N.H. and Carvalho, M.G. 2000. Sustainable assessment method for energy systems. Boston: Kluwer Academic Publishers.
[19] Afgan, N.H., Carvalho, M.G. and Hovanov, N.V. 2000. Sustainability assessment of renewable energy systems, Energy Policy, 28, pp. 603–612.
[20] Afgan, N.H., Gobaisi, D., Carvalho, M.G. and Cumo, M. 1998. Sustainable energy management, Renewable and Sustainable Energy Reviews, 2, pp. 235–286.
[21] Özkan, B., Kaya, İ., Cebeci, U. and Başlıgil, H. 2015. A hybrid multicriteria decision making methodology based on type-2 fuzzy sets for selection among energy storage alternatives, International Journal of Computational Intelligence Systems, 8(5), pp. 914-927.
[22] Arce, M.E., Saavedra, Á., Míguez, J.L. and Granada, E. 2015. The use of grey-based methods in multi-criteria decision analysis for the evaluation of sustainable energy systems: A review, Renewable and Sustainable Energy Reviews, 47, pp. 924-932.
[23] Wanderer, T. and Herle, S. 2015. Creating a spatial multi-criteria decision support system for energy related integrated environmental impact assessment, Environmental Impact Assessment Review, 52, pp. 2-8.
[24] Rojas-Zerpa, J.C. and Yusta, J.M. 2015. Application of multicriteria decision methods for electric supply planning in rural and remote areas, Renewable and Sustainable Energy Reviews, 52, pp. 557-571.
[25] Suganthi, L., Iniyan, S. and Samuel, A.A. 2015. Applications of fuzzy logic in renewable energy systems: A review, Renewable and Sustainable Energy Reviews, 48, pp. 585-607.
[26] Sola, A.V.H. and de Miranda Mota, C.M. 2015. Multicriteria decision models in industrial energy management systems. In Decision models in engineering and management. Springer International Publishing Switzerland, pp. 179-195.
[27] Lanjewar, P., Rao, R., Kale, A., Taler, J. and Ocłoń, P. 2016. Evaluation and selection of energy technologies using an integrated graph theory and analytic hierarchy process methods, Decision Science Letters, 5(2), pp. 237-348.
[28] Ling, Z., Zhou, P., Newton, S., Fang, J.-X., Zhou, D.-Q. and Zhang, L.-P. 2015. Evaluating clean energy alternatives for Jiangsu, China: An improved multi-criteria decision making method, Energy, 90, pp. 953-964,
[29] Şengül, Ü., Eren, M., Eslamian Shiraz, S., Gezder, V. and Şengül, A.B. 2015. Fuzzy TOPSIS method for ranking renewable energy supply systems in Turkey, Renewable Energy, 75, pp. 617-625.
[30] Meryem, T., Hakdaoui, M. and Maanan, M. 2015. The evaluation of solar farm locations applying geographic information system and multi-criteria decision-making methods: Case study in southern Morocco, Renewable and Sustainable Energy Reviews, 51, pp. 1354-1362.
[31] Sharma, D., Vaish, R. and Azad, S. 2015. Selection of India’s energy resources: A fuzzy decision making approach, Energy Systems, 6(3), pp. 439-453.
[32] Saltelli, A., Tarantola S., Campolongo F. and Ratto, M. 2004. Sensitivity analysis in practice: A guide to assessing scientific models. New York: Wiley.
[33] Zhu, J. 2014. Sensitivity analysis. In Quantitative models for performance evaluation and benchmarking. Springer International Publishing Switzerland, pp. 207-244.