An Application Kit for Multi-Residue Screening of ... · or Q-TOF with a Pesticide Personal...
26
An Application Kit for Multi-Residue Screening of Pesticides using LC/TOF or Q-TOF with a Pesticide Personal Compound Database Abstract An application kit for pesticide screening has been developed for the Agilent time-of- flight (TOF) and quadrupole time-of-flight (Q-TOF) mass spectrometers using a data- base with almost 1600 entries. It can be quickly and easily used for both food and environmental samples where the ability to detect and identify a large number of pes- ticides is necessary. The system allows the user to create custom databases contain- ing retention times of compounds of interest for targeted analysis. Screening with this database thus provides both targeted and non-targeted pesticide detection. A test mix for both positive ion and negative ion modes is provided to demonstrate the function- ality of the kit. An example of a general method for pesticide screening is given along with an example of a spinach extraction using the Agilent SampliQ extraction and dis- persive SPE kits for complete food analysis. Authors Jerry Zweigenbaum and Peter Stone Agilent Technologies, Inc. 2850 Centerville Road Wilmington, DE 19808 USA Application Note Food Safety and Environmental
Transcript of An Application Kit for Multi-Residue Screening of ... · or Q-TOF with a Pesticide Personal...

An Application Kit for Multi-ResidueScreening of Pesticides using LC/TOFor Q-TOF with a Pesticide PersonalCompound Database
Abstract
An application kit for pesticide screening has been developed for the Agilent time-of-
flight (TOF) and quadrupole time-of-flight (Q-TOF) mass spectrometers using a data-
base with almost 1600 entries. It can be quickly and easily used for both food and
environmental samples where the ability to detect and identify a large number of pes-
ticides is necessary. The system allows the user to create custom databases contain-
ing retention times of compounds of interest for targeted analysis. Screening with this
database thus provides both targeted and non-targeted pesticide detection. A test mix
for both positive ion and negative ion modes is provided to demonstrate the function-
ality of the kit. An example of a general method for pesticide screening is given along
with an example of a spinach extraction using the Agilent SampliQ extraction and dis-
persive SPE kits for complete food analysis.
Authors
Jerry Zweigenbaum and Peter Stone
Agilent Technologies, Inc.
2850 Centerville Road
Wilmington, DE 19808
USA
Application Note
Food Safety and Environmental

2
Introduction
Because over 1000 pesticides have been in use over the last
century and new pesticides are being developed, there is a
great need to perform both targeted and non-targeted screen-
ing in food and the environment. The Agilent time-of-flight
(TOF) mass spectrometers provide both high mass resolution
and mass accuracy that allow comparison of the measured
mass to the exact mass of an ionized compound. In addition,
the tandem hybrid quadrupole time-of-flight (Q-TOF) mass
spectrometer provides the capability of both screening and
confirming compounds in one instrument.[1] Both liquid chro-
matography (LC) combined with TOF MS and Q-TOF MS pro-
vide a robust and sensitive means to perform this type of
screening at levels required by the international community.
Because TOF is a pulsing instrument the resulting data is
always full spectra, which allows the screening of compounds
that are sought (targeted) and those that may not be expect-
ed (non-targeted).[2] In contrast LC/MS/MS with a triple
quadrupole in its most sensitive mode, multi-reaction moni-
toring (MRM), provides targeted screening and confirmation
only.[3]
Recently Agilent has introduced the Pesticide Personal
Compound Database (PCD) consisting of 1600 compounds
and pesticides. With PCD the analyst can use the pesticide
database as is for non-targeted screening or create custom
databases from the read-only supplied database. The custom
database can be edited by changing entries, adding, and
deleting entries. In addition, a powerful feature of updating
retention times allows the users’ custom database to be mod-
ified with retention times from the users’ chromatographic
conditions.[4] The analyst can create as many custom data-
bases with LC-dependent retention times as needed. This
allows easy targeted (compounds verified with standards run
with specific conditions) and non-target analysis (compounds
in the database that have not been verified). The ability to
detect and identify compounds not being sought in food and
environmental samples can be very important. However, this
ability must not be confused with affirmation that compounds
not detected are not present. This can only be done by valida-
tion studies showing that the specific LC/MS method
employed on specific matrices can detect the compounds
reported as not present at the levels of concern. As an exam-
ple, the pesticide database contains compounds not
amenable to LC/MS such as hexachlorobenzene. These are
included for the added information of the user. In addition,
confirmation of positives would always require standards run
with chromatographic conditions that would provide indica-
tive retention times and additional structural information that
can be obtained from fragments generated by MS/MS. Even
with these analytical considerations, screening for a large list
of pesticides as enabled by the LC/TOF or Q-TOF with the
Agilent Pesticide PCD can be very valuable in detecting and
identifying compounds that should not be present.
Experimental
Reagents and ChemicalsPesticide standards were from a variety of sources: Sigma,
Ultra-Scientific, ChemService, and Dr. Ehrenstorfer. For trace
analysis the highest purity mobile phases are recommended.
B&J LC/MS grade acetonitrile and methanol are used here.
Buffers should be prepared from the highest quality chemi-
cals such as GFS doubly distilled acetic acid, formic acid and
ammonium hydroxide. If solid ammonium acetate and ammo-
nium formate is used it should be prepared in a concentrated
solution and then any particulates removed with 0.2-µm fil-
ters. Agilent Pesticide Test Mix, p/n 5190-0469 acid and base
diluted separately as instructed to 10 ppb in 10% acetoni-
trile/90% water. An Agilent SampliQ QuEChERS AOAC
Extraction kit, p/n 5982-5755. Agilent SampliQ QuEChERS
AOAC Dispersive SPE kits for Highly Pigment Fruits and
Vegetables, p/n 5982-5321 (2 mL) and p/n 5982-5356 (15 mL).
LC/MS methods are given in the Appendices:Appendix I, LC/MS/MS Conditions for Test Mix Positive and
Negative Ion Samples.
Appendix II. Agilent 1200 Series SL LC Parameters.
Appendix III, Agilent 1290 Infinity LC Parameters.
Spinach sample preparation• Weigh 15 g (±0.1 g) of homogenized spinach sample.
• Spike standards or IS solution if necessary.
• Vortex 30 s.
• Add 15 mL of 1% acetic acid in acetonitrile.
• Add 1 bag of extraction kit (p/n 5982-5982-5755) buffered
QuEChERS extraction tubes, AOAC Method 2007.01 with 6
g MgSO4, 1.5 g NaAcetate.
• Cap and hand shake vigorously for 1 min.
• Centrifuge at 4000 rpm for 5 min.
• Transfer 1 mL or 8 mL of the upper layer to the dispersive
SPE kit (p/n 5982-5321 or p/n 5982-5356) for highly pig-
mented fruits and vegetables.
• Vortex 1 min.
• Centrifuge 2-mL tubes at 13000 rpm for 2 min, or 15-mL
tubes at 4000 rpm for 5 min.

3
• Transfer 200 µL of the upper layer to the autosampler vial.
• Add 800 µL of water or appropriate standard spiking
solution.
• Vortex 1 min, and prepare for LC/MS/MS analysis.
Results and Discussion
Fast and easy startup with Agilent test mixTo facilitate fast startup for pesticide screening, a positive and
negative ion compound test mix is included with the Agilent
Application Kit. This type of screening depends on obtaining
accurate mass results and the TOF or Q-TOF should be operat-
ed with appropriate reference ions so that the best results
will be obtained. Each of these test mixtures are prepared
with a final injection concentration at 10 ppb, the accepted
limit for pesticides worldwide. The extracted ion chro-
matogram (EIC) for each of the pesticides in the positive ion
mix is shown in Figure 1. A method is provided with the kit
that will allow the user to repeat this analysis. This method is
an acquisition only method. Similar results demonstrate that
the system is working properly. There are also two methods
provided for work list automation data analysis that will gen-
erate the summary report of a database search of the
Pesticide PCD. One method is the MFE_pesticide and this
uses the “find compounds by molecular feature extraction
(MFE)” algorithm in MassHunter Qualitative Analysis, a pow-
erful data mining tool. This unique data mining program
searches the data for all ions that can be associated with a
real chromatographic peak and that may represent a "fea-
ture" of a molecule. This excludes reference ions and con-
stant background ions and "spikes" that do not represent real
compounds in the data file. MFE will create a compound list
of all peaks in the data file that it has determined to represent
real molecules. This algorithm is fast and generates good
results with appropriate settings. The resulting report is
shown in Table 1 for the positive test mix. This mixture con-
tains only the compounds highlighted in the report. Please
note that the database search screen does not confirm the
presence of compounds and that compounds listed in the
results does not indicate that they are conclusively present.
Compounds listed could be from the blank, carry over or other
sources.
×105
Counts vs. acquisition time (min)
0.5 1 1.5 2 2.5 3 3.5 4 4.5 5 5.5 6 6.5 7 7.5 8 8.5 9 9.5 10 10.5 11 11.5
0
0.2
0.4
0.6
0.8
1
1.2
1.4
1.6
1.8
2
2.2
2.4
2.6
3.4568.127
7.803
11.492
5.8616.578
4.531
10.428
6.740
9.919
11.4804.601
8.821
1 1
.
7
35
Figure 1. Extracted ion chromatogram of the positive ion test mix .

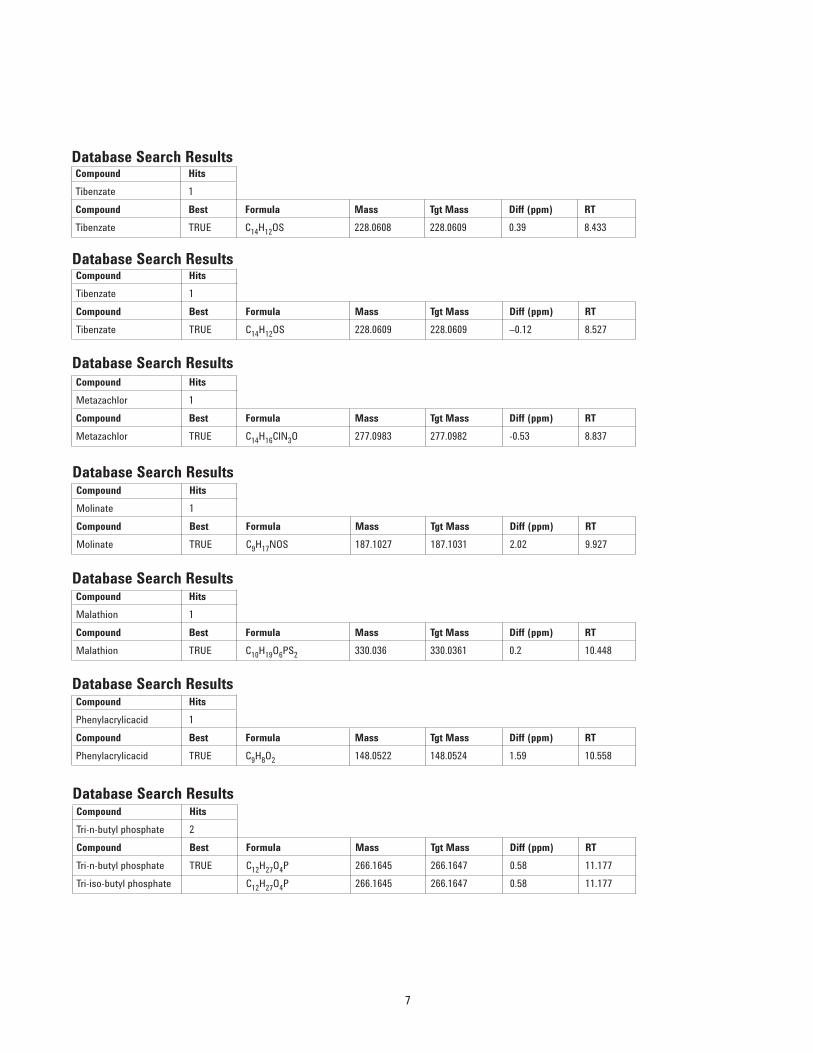
Compound Label RT Mass Name DB Formula DB Diff (ppm)
Cpd 19: Aminocarb 3.472 208.1213 Aminocarb C11H16N2O2 –0.44
Cpd 40: Imazapyr 4.543 261.1113 Imazapyr C13H15N3O3 –0.03
Cpd 41: Thiabendazole 4.612 201.036 Thiabendazole C10H7N3S 0.2
Cpd 52: Ethiofencarb sulfoxide 5.176 241.0777 Ethiofencarb sulfoxide C11H15NO3S –1.91
Cpd 62: Dimethoate 5.866 228.9998 Dimethoate C5H12NO3PS2 –0.75
Cpd 65: Imazalil 6.549 296.0488 Imazalil C14H14Cl2N2O –1.58
Cpd 66: Imazalil 6.579 296.0485 Imazalil C14H14Cl2N2O –0.65
Cpd 68: Metoxuron 6.746 228.0666 Metoxuron C10H13ClN2O2 –0.09
Cpd 85: Carbofuran 7.805 221.1054 Carbofuran C12H15NO3 –1.05
Cpd 88: Atrazine 8.138 215.094 Atrazine C8H14ClN5 –0.92
Cpd 89: DEET 8.2 191.1309 DEET C12H17NO 0.53
Cpd 90: Tibenzate 8.323 228.0607 Tibenzate C14H12OS 1
Cpd 91: Metosulam 8.33 417.0069 Metosulam C14H13Cl2N5O4S –0.98
Cpd 92: Fluoroglycofen 8.33 419.0033 Fluoroglycofen C16H9ClF3NO7 –3.28
Cpd 93: Tibenzate 8.433 228.0608 Tibenzate C14H12OS 0.39
Cpd 97: Tibenzate 8.527 228.0609 Tibenzate C14H12OS –0.12
Cpd 99: Metazachlor 8.837 277.0983 Metazachlor C14H16ClN3O –0.53
Cpd 107: Molinate 9.927 187.1027 Molinate C9H17NOS 2.02
Cpd 111: Malathion 10.448 330.036 Malathion C10H19O6PS2 0.2
Cpd 113: Phenylacrylicacid 10.558 148.0522 Phenylacrylicacid C9H8O2 1.59
Cpd 121: Tri-n-butyl phosphate 11.177 266.1645 Tri-n-butyl phosphate C12H27O4P 0.58
Cpd 123: Tri-n-butyl phosphate 11.272 266.1646 Tri-n-butyl phosphate C12H27O4P 0.32
Cpd 125: Pyraclostrobin 11.477 387.0989 Pyraclostrobin C19H18ClN3O4 –0.9
Cpd 127: Diazinon 11.497 304.1012 Diazinon C12H21N2O3PS –0.56
4
Table 1. Find Compounds by Molecular Feature Extractor with Pesticide Database Search Report for Positive Ion Test Mix
Data File TestMix_pos_1.d Sample Name Test_Mix_pos_1
Sample Type Sample Position P1-F2
Instrument Name CAS6530_1 User Name
Acq Method Test_Mix_Pos.m Acquired Time 6/1/2009 3:28:51 PM
IRM Calibration Status Success DA Method MFE_Pesticide.m
Comment
Compound Table
Database Search Results
Compound Hits
Aminocarb 1
Compound Best Formula Mass Tgt Mass Diff (ppm) RT
Aminocarb TRUE C11H16N2O2 208.1213 208.1212 –0.44 3.472

Compound Hits
Thiabendazole 1
Compound Best Formula Mass Tgt Mass Diff (ppm) RT
Thiabendazole TRUE C10H7N3S 201.036 201.0361 0.2 4.612
5
Database Search ResultsCompound Hits
Imazapyr 1
Compound Best Formula Mass Tgt Mass Diff (ppm) RT
Imazapyr TRUE C13H15N3O3 261.1113 261.1113 –0.03 4.543
Database Search Results
Database Search ResultsCompound Hits
Ethiofencarb sulfoxide 1
Compound Best Formula Mass Tgt Mass Diff (ppm) RT
Thiabendazole TRUE C10H7N3S 201.036 201.0361 0.2 4.612
Database Search ResultsCompound Hits
Ethiofencarb sulfoxide 2
Compound Best Formula Mass Tgt Mass Diff (ppm) RT
Ethiofencarb sulfoxide TRUE C11H15NO3S 241.0777 241.0773 –1.91 5.176
Methiocarb sulfoxide FALSE C11H15NO3S 241.0777 241.0773 –1.91 5.176
Database Search ResultsCompound Hits
Dimethoate 1
Compound Best Formula Mass Tgt Mass Diff (ppm) RT
Dimethoate TRUE C5H12N03PS2 228.9996 228.9996 –0.75 5.866
Database Search ResultsCompound Hits
Imazalil 1
Compound Best Formula Mass Tgt Mass Diff (ppm) RT
Imazalil TRUE C14H14Cl2N2O 296.0488 296.0483 –1.58 6.549
Database Search ResultsCompound Hits
Imazalil 1
Compound Best Formula Mass Tgt Mass Diff (ppm) RT
Imazalil TRUE C14H14Cl2N2O 296.0485 296.0483 –0.65 6.579

6
Database Search ResultsCompound Hits
Metoxuron 1
Compound Best Formula Mass Tgt Mass Diff (ppm) RT
Metoxuron TRUE C10H13ClN2O2 228.0666 228.0666 –0.09 6.746
Database Search ResultsCompound Hits
Carbofuran 1
Compound Best Formula Mass Tgt Mass Diff (ppm) RT
Carbofuran TRUE C12H15NO3 221.1054 221.1052 –1.05 7.805
Database Search ResultsCompound Hits
Atrazine 1
Compound Best Formula Mass Tgt Mass Diff (ppm) RT
Atrazine TRUE C8H14ClN5 215.094 215.0938 –0.92 8.138
Database Search ResultsCompound Hits
Tibenzate 1
Compound Best Formula Mass Tgt Mass Diff (ppm) RT
Tibenzate TRUE C14H12OS 228.0607 228.0609 1 8.323
Database Search ResultsCompound Hits
Metosulam 1
Compound Best Formula Mass Tgt Mass Diff (ppm) RT
Metosulam TRUE C14H13Cl2N5O4S 417.0069 417.0065 –0.98 8.33
Database Search ResultsCompound Hits
Fluoroglycofen 1
Compound Best Formula Mass Tgt Mass Diff (ppm) RT
Fluoroglycofen TRUE C16H9ClF3NO7 419.0033 419.002 –3.28 8.33
Database Search ResultsCompound Hits
DEET 1
Compound Best Formula Mass Tgt Mass Diff (ppm) RT
DEET TRUE C12H17NO 191.1309 191.131 0.53 8.2
7
Database Search ResultsCompound Hits
Tri-n-butyl phosphate 2
Compound Best Formula Mass Tgt Mass Diff (ppm) RT
Tri-n-butyl phosphate TRUE C12H27O4P 266.1645 266.1647 0.58 11.177
Tri-iso-butyl phosphate C12H27O4P 266.1645 266.1647 0.58 11.177
Database Search ResultsCompound Hits
Tibenzate 1
Compound Best Formula Mass Tgt Mass Diff (ppm) RT
Tibenzate TRUE C14H12OS 228.0608 228.0609 0.39 8.433
Database Search ResultsCompound Hits
Tibenzate 1
Compound Best Formula Mass Tgt Mass Diff (ppm) RT
Tibenzate TRUE C14H12OS 228.0609 228.0609 –0.12 8.527
Database Search ResultsCompound Hits
Metazachlor 1
Compound Best Formula Mass Tgt Mass Diff (ppm) RT
Metazachlor TRUE C14H16ClN3O 277.0983 277.0982 -0.53 8.837
Database Search ResultsCompound Hits
Malathion 1
Compound Best Formula Mass Tgt Mass Diff (ppm) RT
Malathion TRUE C10H19O6PS2 330.036 330.0361 0.2 10.448
Database Search ResultsCompound Hits
Phenylacrylicacid 1
Compound Best Formula Mass Tgt Mass Diff (ppm) RT
Phenylacrylicacid TRUE C9H8O2 148.0522 148.0524 1.59 10.558
Database Search ResultsCompound Hits
Molinate 1
Compound Best Formula Mass Tgt Mass Diff (ppm) RT
Molinate TRUE C9H17NOS 187.1027 187.1031 2.02 9.927

8
Database Search ResultsCompound Hits
Pyraclostrobin 1
Compound Best Formula Mass Tgt Mass Diff (ppm) RT
Pyraclostrobin TRUE C19H18ClN3O4 387.0989 387.0986 –0.9 11.477
Database Search ResultsCompound Hits
Diazinon 1
Compound Best Formula Mass Tgt Mass Diff (ppm) RT
Diazinon TRUE C12H21N2O3PS 304.1012 304.1011 –0.56 11.497
Database Search ResultsCompound Hits
Tri-n-butyl phosphate 2
Compound Best Formula Mass Tgt Mass Diff (ppm) RT
Tri-n-butyl phosphate TRUE C12H27O4P 266.1646 266.1647 0.32 11.272
Tri-iso-butyl phosphate C12H27O4P 266.1646 266.1647 0.32 11.272
The second method is Find_formula_pesticide. This method
uses the “find by formula” algorithm of MassHunter
Qualitative Analysis. This algorithm searches the data for the
ions specified for each molecule in the database. For the sup-
plied database this would entail generating extracted ion
chromato-grams for each entry times each adduct (1600 for
H+, 1600 for Na+, etc.). This is thorough but slower. However,
if these searches are done automatically in a worklist, the
processing time is reasonable. The analyst must determine
what is the best fit-for-purpose procedure. Note that automat-
ic database searching can be done during the worklist acqui-
sition or after. Using the “worklist run” parameter of
MassHunter acquisition, acquisition and data analysis can be
selected, or data analysis only after the data has been collect-
ed. The data analysis methods can be added to the worklist by
adding the column "Override DAMethod" to the MassHunter
worklist and inserting the method to be used. (The qualitative
analysis methods can be saved to the name of the acquisition
method eliminating the need to add the "Override" column.
(However, keeping acquisition methods and data analysis
methods separate provides more flexibility.) All methods can
be customized to meet the needs of a particular analysis.

9
×106
0
0.2
0.4
0.6
0.8
1
1.2
1.4
1.6
1.8
2
2.2
2.4
2.6
2.8
3
3.2
3.4
3.6
3.8
4
4.2
4.4
4.6
10.7138.934
7.496
11.267
9.629
11.526
1 1
Counts vs. acquisition time (min)
0.5 1 1.5 2 2.5 3 3.5 4 4.5 5 5.5 6 6.5 7 7.5 8 8.5 9 9.5 10 10.5 11 11.5
Figure 2. Extracted ion chromatogram of the negative ion test mix.
Figure 2 shows the chromatogram of the negative ion com-
pound test mix. Table 2 shows the results automatically gen-
erated for the negative ion mixture using the MFE_pesticide
method. The report is generated using "Find and Identify"
selection of compound automation and the 1600-compound
pesticide database, pesticides.mtl, is searched. The worklist
automation uses the "Compound automation and report"
selection. To obtain the report shown, the
"CompoundReportwithIdentificationHits.xltx" template of the
"Common Reporting Options" in the General Navigation bar
of MassHunter Qualitative analysis must be selected. This is
important because as shown in the compound list of Table 2,
the wrong isomer, dinoprop, is listed. This is the first isomer
found in the database. The selected report template then lists
the results of each database hit and the three isomers in the
database are shown under this heading in the report. If the
data were analyzed with the "Find by Formula" algorithm, the
report would include all the isomers in the database in the
main body of the report. If a retention time that matched the
compound were in a custom database, only that isomer
would be reported (targeted analysis). (Note that for the find
by formula method to work within a worklist the Worklist
Actions of the method should separately list "Compound
Automation without report" and then "Generate Compound
Report.")
The compound actually present is dinoseb and if this were a
non-targeted analysis the analyst would need to confirm
which one was present.

10
Table 2. Find compounds by Molecular Feature Extractor with Pesticide Database Search Report for Negative Ion Test Mix
Data File Test_mix_neg_01.d Sample Name Test Mix Neg 1
Sample Type Sample Position P1-F1
Instrument Name CAS6530_1 User Name
Acq Method Test_mix_neg.m Acquired Time 6/1/2009 1:33:54 PM
IRM Calibration Status Success DA Method MFE_Pesticide.m
Comment
Compound Table
Compound Label RT Mass Name DB Formula DB Diff (ppm)
Cpd 12: Bentazone 7.491 240.0573 Bentazone C10H12N2O3S –1.69
Cpd 15: Dibutyl succinate 7.904 230.1517 Dibutyl succinate C12H22O4 0.5
Cpd 24: 2,4-D Methyl ester 8.768 233.9847 2,4-D Methyl ester C9H8Cl2O3 1.7
Cpd 26: 2,4,5-T 8.934 253.9306 2,4,5-T C8H5Cl3O3 –0.72
Cpd 32: Silvex 9.623 267.9465 Silvex C9H7Cl3O3 –1.6
Cpd 37: Citronellal hydrate 10.219 172.1465 Citronellal hydrate C10H20O2 –1.25
Cpd 39: Citronellal hydrate 10.37 172.1464 Citronellal hydrate C10H20O2 –0.47
Cpd 41: Acifluorfen 10.716 360.9967 Acifluorfen C14H7ClF3NO5 –0.55
Cpd 42: Citronellal hydrate 10.736 172.1466 Citronellal hydrate C10H20O2 –1.37
Cpd 51: Alantolactone 11.249 232.1462 Alantolactone C15H20O2 0.35
Cpd 52: Dinoprop (see below) 11.267 240.075 Dinoprop C10H12N2O5 –1.72
Cpd 56: Hexaflumuron 11.53 459.982 Hexaflumuron C16H8Cl2F6N2O3 –0.76
Database Search ResultsCompound HitsBentazone 1
Compound Best Formula Mass Tgt Mass Diff (ppm) RT
Bentazone TRUE C10H12N2O3S 240.0573 240.0569 –1.69 7.491
Database Search ResultsCompound Hits
Dibutyl succinate 1
Compound Best Formula Mass Tgt Mass Diff (ppm) RT
Dibutyl succinate TRUE C12H22O4 230.1517 230.1518 0.5 7.904

11
Database Search ResultsCompound Hits
2,4,5-T 2
Compound Best Formula Mass Tgt Mass Diff (ppm) RT
2,4,5-T TRUE C8H5Cl3O3 253.9306 253.9304 –0.72 8.934
Tricamba C8H5Cl3O3 253.9306 253.9304 –0.72 8.934
Database Search ResultsCompound Hits
Silvex 1
Compound Best Formula Mass Tgt Mass Diff (ppm) RT
Silvex TRUE C9H7Cl3O3 267.9465 267.9461 –1.6 9.623
Database Search ResultsCompound Hits
Citronellal hydrate 1
Compound Best Formula Mass Tgt Mass Diff (ppm) RT
Citronellal hydrate TRUE C10H20O2 172.1465 172.1463 –1.25 10.219
Database Search ResultsCompound Hits
Citronellal hydrate 1
Compound Best Formula Mass Tgt Mass Diff (ppm) RT
Citronellal hydrate TRUE C10H20O2 172.1464 172.1463 –0.47 10.37
Database Search ResultsCompound Hits
Acifluorfen 1
Compound Best Formula Mass Tgt Mass Diff (ppm) RT
Acifluorfen TRUE C14H7ClF3NO5 360.9967 360.9965 –0.55 10.716
Database Search ResultsCompound Hits
Citronellal hydrate 1
Compound Best Formula Mass Tgt Mass Diff (ppm) RT
Citronellal hydrate TRUE C10H20O2 172.1466 172.1463 –1.37 10.736
Database Search ResultsCompound Hits
Alantolactone 1
Compound Best Formula Mass Tgt Mass Diff (ppm) RT
Alantolactone TRUE C15H20O2 232.1462 232.1463 0.35 11.249

12
Customized databases with user added retentiontimesOne of the powerful benefits of the supplied database is that
it can be saved to a user customized database. To create a
read-write customizable database, the user selects the "File"
menu item and the "New Database." The software then
allows selection of an existing database and then the naming
of a new database. A description can also be given. When
"Create" is selected the database with the new name con-
tains all the entries of the selected database. In this way mul-
tiple custom databases can be created. The technical note on
the Pesticide PCD [4] shows how the user can run standards
with unique chromatographic conditions and easily update
retention times in their custom database. This is shown in
Figures 3 and 4 for the positive and negative ion test mix
respectively.
Database Search Results (Note that the following are isomers with the same formula even though the
compound present is listed as "FALSE.")
Compound Hits
Dinoprop 3
Compound Best Formula Mass Tgt Mass Diff (ppm) RT
Dinoprop TRUE C10H12N2O5 240.075 240.0746 –1.72 11.267
Dinoseb FALSE C10H12N2O5 240.075 240.0746 –1.72 11.267
Dinoterb C10H12N2O5 240.075 240.0746 –1.72 11.267
Database Search ResultsCompound Hits
Hexaflumuron 1
Compound Best Formula Mass Tgt Mass Diff (ppm) RT
Hexaflumuron TRUE C16H8Cl2F6N2O3 459.982 459.9816 –0.76 11.53
Figure 3. Pesticide Personal Compound Database (now with Library –PCDL, not shown) customized with retention times from positive ion test mix.

13
Figure 4. Pesticide Personal Compound Database (PCDL) customized with retention times for negative ion test mix.
If the analysis were for targeted compounds where retention
times are known, dinoseb would be chromatographically sep-
arated from the other isomers. It is a simple exercise to take
the results of the test mix, create a custom database from the
provided pesticide database and update retention times. This
would now create a targeted analysis. Either data analysis
method can be modified for a targeted and non-targeted
analysis by selecting "mass and retention time (optional)" for
the search criteria. Targeted only analysis would be performed
if "mass and retention time (required)" was checked. A report
for a targeted and non-targeted analysis of the negative test
mix with the method Find_by Formula and a custom database
with the retention time for dinoseb would only list that com-
pound. In this result, only dinoseb is reported because it is the
compound in the custom database that matches the retention
time. Even with retention times, identified compounds in the
database must be confirmed. Both screening and confirma-
tion can be done with the LC/Q-TOF.

14
Table 3. Find compounds by Formula with Pesticide Database Search Report for Negative ion Test Mix
Data File Test_mix_neg_01.d Sample Name Test Mix Neg 1
Sample Type Sample Position P1-F1
Instrument Name CAS6530_1 User Name
Acq Method Test_mix_neg.m Acquired Time 6/1/2009 1:33:54 PM
IRM Calibration Status Success DA Method find_by_formula_pesticids.m
Comment
Compound TableCompound Label RT Mass Abund Name Formula Tgt Mass DB Diff (ppm)
Cpd 1: Dichloromethoxybenzene 5.583 175.9796 9712 Dichloromethoxybenzene C7H6Cl2O 175.9796 0.11
Cpd 2: Bentazone 7.492 240.0573 108523 Bentazone C10H12N2O3S 240.0569 1.69
Cpd 3: Dibutyl succinate 7.904 230.1517 7790 Dibutyl succinate C12H22O4 230.1518 –0.5
Cpd 6: Dichloroprop 8.764 233.9845 33463 Dichloroprop C9H8Cl2O3 233.985 –2.39
Cpd 7: Disugran 8.764 233.9845 33463 Disugran C9H8Cl2O3 233.985 –2.39
Cpd 4: Dichlorophenol 2,4- 8.764 161.9633 6051 Dichlorophenol 2,4- C6H4Cl2O 161.9639 –3.59
Cpd 5: 2,4-D Methyl ester 8.764 233.9845 33463 2,4-D Methyl ester C9H8Cl2O3 233.985 –2.39
Cpd 9: Tricamba 8.941 253.9306 15646 Tricamba C8H5Cl3O3 253.9304 0.75
Cpd 8: 2,4,5-T 8.941 253.9306 15646 2,4,5-T C8H5Cl3O3 253.9304 0.75
Cpd 10: Trichlorophenol, 2,4,6- 9.613 195.9245 5877 Trichlorophenol, 2,4,6- C6H3Cl3O 195.9249 –2.12
Cpd 11: Silvex 9.624 267.9468 18804 Silvex C9H7Cl3O3 267.9461 2.64
Cpd 14: Acifluorfen 10.708 360.9966 18261 Acifluorfen C14H7ClF3NO5 360.9965 0.43
Cpd 13: Nitrofluorfen 10.708 317.0062 10928 Nitrofluorfen C13H7ClF3NO3 317.0067 –1.41
Cpd 12: Azinphos-methyl 10.708 317.0061 9536 Azinphos-methyl C10H12N3O3PS2 317.0058 1
Cpd 15: Citronellal hydrate 10.732 172.1466 132453 Citronellal hydrate C10H20O2 172.1463 1.39
Cpd 16: Alantolactone 11.251 232.1462 10414 Alantolactone C15H20O2 232.1463 –0.54
Cpd 20: Ethiofencarb sulfoxide 11.262 241.078 23056 Ethiofencarb sulfoxide C11H15NO3S 241.0773 2.86
Cpd 21: Methiocarb sulfoxide 11.262 241.078 23056 Methiocarb sulfoxide C11H15NO3S 241.0773 2.86
Cpd 19: Dinoprop 11.262 240.0752 249379 Dinoprop C10H12N2O5 240.0746 2.22
Cpd 17: Dinoseb 11.262 240.0752 249379 Dinoseb C10H12N2O5 240.0746 2.22
Cpd 18: Dinoterb 11.262 240.0752 249379 Dinoterb C10H12N2O5 240.0746 2.22
Cpd 22: Hexaflumuron 11.533 459.9823 19824 Hexaflumuron C16H8Cl2F6N2O3 459.9816 1.44

15
The power of Q-TOF for screening and confirmationAs an example of the power of this technique, a strawberry
extract was spiked and analyzed using an Agilent 1200 Series
SL LC with an Agilent 6520 Q-TOF. The extracted ion chro-
matogram of the over 100 pesticides spiked into this sample
is shown in Figure 5. A pesticide screen with a Q-TOF is the
same as with a TOF. However, LC/Q-TOF MS offers the highly
selective MS/MS with accurate mass measurement that pro-
vides a workflow for both screening and confirmation. [1]
Screening hundreds of target and non-target pesti-cides using the Agilent 1200 Series SL with 6230 TOF
A standard of over 200 pesticides is run in a similar fashion
and the EIC generated from the pesticides detected in a “find
compounds by molecular feature” extractor with database
search is shown in Figure 4. This method employs the Agilent
1200 Series SL and the Agilent 6230 TOF with Jet Stream
Technology. This is the preferred configuration as it provides
additional sensitivity to meet the demanding needs of multi-
residue analysis. The method for this analysis is also provided
×106
0
0.1
0.2
0.3
0.4
0.5
0.6
0.7
0.8
0.9
1
1.1
1.2
1.3 Cpd 323: Tribufos: +ESI ECC Scan Frag=150.0V SeqR_16-r003.d
15.212
Cpd 323: Tribufos
Counts vs. acquisition time (min)
1 2 3 4 5 6 7 8 9 10 11 12 13 14 15 16
Figure 5. Extracted compound chromatogram (from compounds found by MFE) of 200 pesticides using the Agilent 1200 Series SL LC with the Agilent 6230 TOF.
with the Agilent Pesticide Screen Application Kit for TOF and
Q-TOF.
The highest quality results are obtained with good chromato-
graphic and mass spectral resolution. The ability to detect
and identify thousands of compounds lies in both these para-
meters and accurate mass measurement. However, for any
given real food sample only a few pesticides will be found.
This may not be the case for environmental samples but the
possibility of no more than 10 to 20 per site would be realistic.
Given this reality, the need to be able to validate that hun-
dreds of compounds can be detected in a fast analysis would
provide this capability. Figure 6 shows a 3-minute run of over
100 pesticides using the new Agilent 1290 Infinity LC con-
nected to the new Agilent 6540 Q-TOF. Given the chromato-
graphic resolution achieved and the mass spectral resolution
obtained, this analysis is reasonable for screening pesticides
in food and environmental samples. The quality of the mass
spectral data is shown in Figure 7 and this was collected at
rate of 10 spectra per second.

16
×105
0
0.1
0.2
0.3
0.4
0.5
0.6
0.7
0.8
0.9
1
1.1
1.2
1.3
1.4
1.5
1.6
1.7
1.8
1.9
2
0.649
Counts vs. acquisition time (min)
0.1 0.2 0.3 0.4 0.5 0.6 0.7 0.8 0.9 1 1.1 1.2 1.3 1.4 1.5 1.6 1.7 1.8 1.9 2 2.1 2.2 2.3 2.4 2.5 2.6 2.7 2.8 2.9 3
Figure 6. Extracted compound chromatogram of 100 pesticides in 3 min using the new Agilent 1290 Infinity LC with the new Agilent 6540 Q-TOF.
×104
0
0.1
0.2
0.3
0.4
0.5
0.6
0.7
0.8
0.9
1
1.1
1.2
1.3
1.4
1.5
1.6
1.7
1.8
1.9
2
2.1
2.2
2.3294.1366
296.1337
295.1396
Counts vs. mass-to-charge (m/z)
294 294.25 294.5 294.75 295 295.25 295.5 295.75 296 296.25 296.5 296.75 297 297.25 297.5 297.75
CH3
Cl
CH3
CH3N
N
N
OH
CH3
Cl
CH3
CH3N
N
N
OH
Figure 7. Example mass spectrum from data on 3 min run with Agilent 1290 Infinity LC and Agilent 6540 Q-TOF. Note the mass resolution at 10 spectra per second.
m/z Abund Abund % Charge Sat Width Rea
294.1366 21636 100 1 – 0.0095 31044
295.1396 3591 16.6 1 – 0.0101 29122
296.1337 6601 30.51 1 – 0.01 29608

Compound Label RT Mass Name DB Formula DB Diff (ppm) Hits (DB)
Cpd 12: Methamidophos 2.053 141.0012 Methamidophos C2H8NO2PS 0.96 1
Cpd 15: Acephate 2.467 183.0115 Acephate C4H10NO3PS 2.24 1
Cpd 18: Acephate 2.632 183.0119 Acephate C4H10NO3PS –0.02 1
Cpd 24: Pymetrozine 3.242 217.0967 Pymetrozine C10H11N5O –1.54 1
Cpd 25: Pymetrozine 3.361 217.0965 Pymetrozine C10H11N5O –0.5
Cpd 29: Carbendazim 4.259 191.0695 Carbendazim C9H9N3O2 0.06 1
Cpd 35: Thiabendazole 4.633 201.0359 Thiabendazole C10H7N3S 0.81 1
Cpd 44: Imidacloprid 5.564 255.0527 Imidacloprid C9H10ClN5O2 –1.43 1
Cpd 51: Imazalil 6.587 296.0489 Imazalil C14H14Cl2N2O –1.92 1
Cpd 54: Dicyclanil 7.172 190.0968 Dicyclanil C8H10N6 –0.77 1
Cpd 55: Thiophanate-methyl 7.426 342.0463 Thiophanate-methyl C12H14N4O4S2 –1.97 1
Cpd 86: Propoxur 7.621 209.1053 Propoxur C11H15NO3 –0.35 1
Cpd 87: Pyrocatechol 7.621 110.0368 Pyrocatechol C6H6O2 –0.59 1
Cpd 89: Norethynodrel 7.631 298.192 Norethynodrel C20H26O2 4.2 1
Cpd 91: Carbaryl 7.994 201.079 Carbaryl C12H11NO2 –0.07 7
Cpd 92: Naphthol, 1- 7.995 144.0575 Naphthol, 1- C10H8O 0.01 1
Cpd 97: Ethoprop 9.908 242.0569 Ethoprop C8H19O2PS2 –2 1
Cpd 99: Penconazole 10.219 283.0649 Penconazole C13H15Cl2N3 –2.26 1
Cpd 101: Cyprodinil 10.482 225.1268 Cyprodinil C14H15N3 –0.68 1
Cpd 105: Kresoxim methyl 10.924 313.132 Kresoxim methyl C18H19NO4 –1.93 1
17
Extraction to analysis with SampliQ extractionand SPE KitsFinally, as an example of a complete analysis a spinach sam-
ple was spiked with pesticides at the 10-ppb level and
extracted using the SampliQ QuEChERS Kit p/n 5982-5755.
Then the Agilent SampliQ QuEChERS AOAC Dispersive SPE
kit for highly pigmented fruits and vegetables, p/n 5982-5356
(15 mL), was used for clean-up. In addition, a reagent blank
was prepared and run using an Agilent 1200 Series SL/6530
LC/Q-TOF and the standard screened with “find by molecular
feature extractor” and the Pesticide database (not customized).
The resulting mass list from the reagent blank was placed in
the MFE settings by exporting the mass list to a .csv file,
selecting "exclude these masses" under "Filter Mass", and
using the exported .csv file as the database. In this way all
the ions in the reagent blank will be removed from standards
and samples processed with this method. The spiking solu-
tion (neat standard) was analyzed using the same acquisition
method and the Worklist Automation. The results are given in
Table 4 and represent the pesticides in the standard. It should
be noted that if background removal is performed, the mass
list should be searched by the database to make sure that
compounds of concern will not be excluded. The .csv file is
editable in Excel and masses can be removed from the exclu-
sion list if necessary (for example, if pesticides are found in
the blank).
Table 4. Neat Pesticide Standard for Spinach Extract
Data File 2ppb neat std .d Sample Name 2ppb neat in 20:80 ACN/H2O
Sample Type Sample Position P1-F1
Instrument Name CAS6530_1 User Name Jaz
Acq Method MFE_Compound_report.m Acquired Time 7/10/2009 12:43:56 PM
IRM Calibration Status Success DA Method MFE_Pesticide_report.m
Comment
Compound Table

18
Figure 8 shows the extracted compound chromatogram from
the “Molecular Feature Extractor” of the spinach extract.
Even with the clean-up procedure and background ions
removed, this is a complex sample. Table 5 shows the data-
base search result for the spinach extract and all compounds
detected in the standards were detected in the extract. If this
were an analysis done for targeted and non-targeted analysis,
all non-target positives (those without matching retention
times) should be examined in MassHunter Qualitative
Analysis before further analysis.
Figure 8. Extracted compound chromatogram of spinach sample with over 1200 compound features found .

19
Table 5. Results of Spinach Screen using Molecular Feature Extractor
Data File Spinach AOAC 10ppb.d Sample Name Spinach AOAC 10 ppb (2 ppb in sample)
Sample Type Sample Position P1-A4
Instrument Name CAS6530_1 User Name Jaz
Acq Method MFE_Compound_report.m Acquired Time 7/10/2009 12:40:59 PM
IRM Calibration Status Some Ions Missed DA Method MFE_Pesticide_report.m
Comment
Compound TableCompound Label RT Mass Name DB Formula DB Diff (ppm)
Cpd 36: Methamidophos 2.042 141.001 Methamidophos C2H8NO2PS 2.37
Cpd 42: Carbofuran-3-OH-7-phenol 2.226 180.0786 Carbofuran-3-OH-7-phenol C10H12O3 0.12
Cpd 44: Metolcarb 2.233 165.0789 Metolcarb C9H11NO2 0.43
Cpd 74: Acephate 2.614 183.0116 Acephate C4H10NO3PS 1.72
Cpd 94: Decarbofuran 3.127 207.0896 Decarbofuran C11H13NO3 –0.45
Cpd 97: Quinacetol sulfate 3.14 187.0631 Quinacetol sulfate C11H9NO2 1.39
Cpd 103: 3,5-Xylyl methylcarbamate 3.197 179.0945 3,5-Xylyl methylcarbamate C10H13NO2 0.78
Cpd 119: Carbofuran, - 3 hydroxy 3.323 237.1003 Carbofuran, - 3 hydroxy C12H15NO4 –0.88
Cpd 121: Pymetrozine 3.36 217.0963 Pymetrozine C10H11N5O 0.44
Cpd 136: Propoxur 3.445 209.1053 Propoxur C11H15NO3 –0.42
Cpd 140: 3,5-Xylyl methylcarbamate 3.471 179.0953 3,5-Xylyl methylcarbamate C10H13NO2 –3.52
Cpd 161: 8-Hydroxyquinoline 3.59 145.0526 8-Hydroxyquinoline C9H7NO 0.82
Cpd 198: Metalaxyl 3.805 279.1478 Metalaxyl C15H21NO4 –2.52
Cpd 207: Phenyl isocyanate 3.817 119.0373 Phenyl isocyanate C7H5NO –1.32
Cpd 221: Aspidinol 3.946 224.1049 Aspidinol C12H16O4 –0.24
Cpd 284: Phenoxyacetic acid 4.155 152.0472 Phenoxyacetic acid C8H8O3 1.13
Cpd 303: Dimethyl phthalate 4.188 194.0579 Dimethyl phthalate C10H10O4 0.28
Cpd 310: Trinexapac 4.21 224.0685 Trinexapac C11H12O5 0.08
Cpd 316: Carbendazim 4.254 191.0695 Carbendazim C9H9N3O2 –0.21
Cpd 323: Geraniol 4.282 154.1357 Geraniol C10H18O 0.55
Cpd 338: Dimethyl phthalate 4.316 194.0579 Dimethyl phthalate C10H10O4 –0.1
Cpd 368: Propoxur 4.372 209.1054 Propoxur C11H15NO3 –1.02
Cpd 386: Aldicarb 4.443 190.0776 Aldicarb C7H14N2O2S –0.09
Cpd 455: Phenoxyacetic acid 4.617 152.0474 Phenoxyacetic acid C8H8O3 –0.33
Cpd 461: Thiabendazole 4.628 201.0362 Thiabendazole C10H7N3S –0.66
Cpd 492: Butopyronoxyl 4.723 226.1207 Butopyronoxyl C12H18O4 –0.65
Cpd 584: Tiocarbazil 4.904 279.167 Tiocarbazil C16H25NOS –4.82

20
Compound Label RT Mass Name DB Formula DB Diff (ppm)
Cpd 587: Kresoxim methyl 4.905 313.132 Kresoxim methyl C18H19NO4 –1.89
Cpd 641: Pyrethrin I 5.022 328.2041 Pyrethrin I C21H28O3 –0.8
Cpd 642: Allethrin 5.022 302.1884 Allethrin C19H26O3 –0.79
Cpd 644: Spiromesifen 5.022 370.2148 Spiromesifen C23H30O4 –1.01
Cpd 720: Phosfon 5.19 396.1312 Phosfon C19H32Cl3P –1.33
Cpd 721: Santonin 5.197 246.1259 Santonin C15H18O3 –1.43
Cpd 740: Dimethyl phthalate 5.255 194.0576 Dimethyl phthalate C10H10O4 1.68
Cpd 743: Metaldehyde 5.265 176.1044 Metaldehyde C8H16O4 2.75
Cpd 804: Phosfon 5.439 396.1301 Phosfon C19H32Cl3P 1.47
Cpd 816: Allethrin 5.454 302.1882 Allethrin C19H26O3 –0.08
Cpd 830: Buthiobate 5.498 372.1696 Buthiobate C21H28N2S2 –0.67
Cpd 858: Imidacloprid 5.57 255.0527 Imidacloprid C9H10ClN5O2 –1.47
Cpd 976: Kresoxim methyl 6.15 313.1321 Kresoxim methyl C18H19NO4 –2.14
Cpd 1047: Kresoxim methyl 6.366 313.132 Kresoxim methyl C18H19NO4 –1.78
Cpd 1063: Alantolactone 6.463 232.1463 Alantolactone C15H20O2 0.23
Cpd 1075: Santonin 6.521 246.1258 Santonin C15H18O3 –0.98
Cpd 1089: Imazalil 6.595 296.049 Imazalil C14H14Cl2N2O –2.29
Cpd 1124: Salbuterol 6.838 239.1522 Salbuterol C13H21NO3 –0.34
Cpd 1144: Butopyronoxyl 6.93 226.1206 Butopyronoxyl C12H18O4 –0.52
Cpd 1212: Cinmethylin 7.152 274.1937 Cinmethylin C18H26O2 –1.56
Cpd 1242: Dicyclanil 7.22 190.0968 Dicyclanil C8H10N6 –0.54
Cpd 1274: Thiophanate-methyl 7.419 342.0457 Thiophanate-methyl C12H14N4O4S2 –0.24
Cpd 1331: Bisphenol A 7.596 228.1141 Bisphenol A C15H16O2 4.06
Cpd 1335: Propoxur 7.614 209.1052 Propoxur C11H15NO3 –0.1
Cpd 1337: Pyrocatechol 7.615 110.0369 Pyrocatechol C6H6O2 –1.11
Cpd 1348: Cinmethylin 7.7 274.1933 Cinmethylin C18H26O2 –0.16
Cpd 1357: Bisphenol A 7.778 228.1147 Bisphenol A C15H16O2 1.28
Cpd 1394: Naphthol, 1- 7.996 144.0574 Naphthol, 1- C10H8O 0.69
Cpd 1395: Carbaryl 7.996 201.0791 Carbaryl C12H11NO2 –0.39
Cpd 1410: Spinosyn B 8.128 717.4462 Spinosyn B C40H63NO10 –1.38
Cpd 1429: Spinosyn A 8.278 731.4619 Spinosyn A C41H65NO10 –1.43
Cpd 1438: Spiroxamine 8.364 297.2675 Spiroxamine C18H35NO2 –2.27
Cpd 1477: Spinosyn D 8.621 745.4775 Spinosyn D C42H67NO10 –1.29
Cpd 1494: Embelin 8.752 294.1838 Embelin C17H26O4 –2.25
Cpd 1501: Cinmethylin 8.797 274.1935 Cinmethylin C18H26O2 –0.9
Cpd 1506: Santonin 8.81 246.1261 Santonin C15H18O3 –2.01
Cpd 1526: Cinmethylin 8.908 274.1935 Cinmethylin C18H26O2 –0.82
Cpd 1574: Cinmethylin 9.184 274.1936 Cinmethylin C18H26O2 –1.21
Cpd 1578: Bromophos 9.22 363.8501 Bromophos C8H8BrCl2O3PS –2.55
Cpd 1604: Bromophos 9.279 363.8502 Bromophos C8H8BrCl2O3PS –2.57
Cpd 1715: Imazethapyr 9.883 289.1417 Imazethapyr C15H19N3O3 3.08

21
Compound Label RT Mass Name DB Formula DB Diff (ppm)
Cpd 1728: Ethoprop 9.911 242.0566 Ethoprop C8H19O2PS2 –0.93
Cpd 1746: Imazethapyr 10.027 289.1419 Imazethapyr C15H19N3O3 2.59
Cpd 1782: Penconazole 10.224 283.0649 Penconazole C13H15Cl2N3 –1.99
Cpd 1797: Cinmethylin 10.325 274.1931 Cinmethylin C18H26O2 0.68
Cpd 1829: Cyprodinil 10.49 225.1271 Cyprodinil C14H15N3 –2.07
Cpd 1833: Chenodeoxycholic acid 10.526 392.291 Chenodeoxycholic acid C24H40O4 4.36
Cpd 1838: Embelin 10.541 294.1837 Embelin C17H26O4 –2.12
Cpd 1885: Chenodeoxycholic acid 10.749 392.2909 Chenodeoxycholic acid C24H40O4 4.45
Cpd 1908: Cinmethylin 10.852 274.1936 Cinmethylin C18H26O2 –1.24
Cpd 1927: Kresoxim methyl 10.933 313.1321 Kresoxim methyl C18H19NO4 –2.18
Cpd 1933: Cinmethylin 10.967 274.1934 Cinmethylin C18H26O2 –0.53
Cpd 1951: Cinmethylin 11.089 274.1939 Cinmethylin C18H26O2 –2.13
Cpd 1978: Carbofuranphenol 11.235 164.0841 Carbofuranphenol C10H12O2 –2.38
Cpd 2017: Spiroxamine 11.536 297.2666 Spiroxamine C18H35NO2 0.5
Cpd 2044: Spiroxamine 11.731 297.2663 Spiroxamine C18H35NO2 1.49
Cpd 2054: Spiroxamine 11.846 297.2673 Spiroxamine C18H35NO2 –1.65
Cpd 2062: Spiroxamine 11.955 297.2672 Spiroxamine C18H35NO2 –1.26
Cpd 2096: Etacelasil 12.24 316.1098 Etacelasil C11H25ClO6Si 3.42
Cpd 2205: Spiroxamine 12.797 297.267 Spiroxamine C18H35NO2 –0.58
Cpd 2206: Ivermectin B1b 12.806 860.488 Ivermectin B1b C47H72O14 4.9
Cpd 2253: Ivermectin B1b 13.128 860.4891 Ivermectin B1b C47H72O14 3.61
Cpd 2314: Ivermectin B1b 13.372 860.4896 Ivermectin B1b C47H72O14 3.04
Cpd 2474: Ivermectin B1b 14.122 860.4906 Ivermectin B1b C47H72O14 1.85

22
Conclusions
The Agilent TOF and Q-TOF Pesticide Application Kit has been
developed to provide comprehensive screening of pesticides
for both targeted and non-targeted compounds. The database
includes almost 1600 compounds and gives the user great
flexibility in its use.
The kit offers:
• Fast and easy startup of complex analyses
• A comprehensive pesticide database of almost
1600 compounds including:
• Chemical structures, formulas and exact masses
• Direct Chemical Internet links to PUBCHEM and
Chemspider
• IUPAC Names
• The ability to create spectral libraries
• Completely customizable additions/deletions and
retention time additions for chromatographic condi-
tions developed by the user
• Results can be searched directly from the PCDL software
• Results can be data-mined with powerful searching tools
such as, the Molecular Feature Extractor and Find by
Formula
• Searches of the database can be partially or completely
automated using MassHunter Qualitative Analysis and the
MassHunter Acquisition Worklist
References
1. Agilent Technologies publication 5990-3935EN, “Q-TOF
LC/MS Screening and Confirming of Non-Targeted
Pesticides in a Strawberry Extract.”
2. Agilent Technologies publication 5989-5496EN,
“Automated Screening of 600 Pesticides in Food by
LC/TOF MS Using a Molecular-Feature Database
Search.”
3. Agilent Technologies publication 5990-4253EN, “Multi-
Residue Pesticide Analysis with Dynamic Multiple
Reaction Monitoring and Triple Quadrupole LC/MS/MS.”
4. Agilent Technologies publication 5990-3976EN,
“Pesticide Personal Compound Database for Screening
and Identification.”
For More Information
For more information on our products and services, visit our
Web site at www.agilent.com/chem.

23
Agilent 1200 Series SL LC Parameters
Column: Agilent ZORBAX Eclipse Plus C18,
2.1 mm × 100 mm, 1.8 µm Agilent
p/n 959764-902
Column temperature: 35 °C
Injection volume: 5
Autosampler temperature: Ambient
Needle wash: 5 s with methanol
Mobile phase: A = 5 mM acetic acid in water
B = 100% acetonitrile
Flow rate: 0.3 mL/min
Gradient: 5% B at t = 0 to 95% B at t = 12 min
Stop time: 12 min
Post time: 3 min
Agilent 6530 Q-TOF Parameters
Jet Stream Conditions
Gas temperature: 250 °C
Gas flow: 7 L/min
Nebulizer: 40 psi
Sheath gas temperature: 325 °C
Sheath gas flow: 11 L/min
Capillary + ion: 3500 V
Nozzle voltage: 0 V
Capillary – ion: 2500 V
Nozzle voltage: 1500 V
Acquisition Mode: MS1
Min Range 100 m/z
Max Range 1100 m/z
Scan Rate 1.4 per s
Reference Masses: Positive ion
121.050873 (M+H+ for purine)
922.009798 (M+H+ for HP-921)
Reference Masses: Negative ion
119.0362 (M–H– for purine)
980.016375 (M+C2H3O2– for HP-921
acetate adduct)
Appendix I
LC/MS/MS Conditions for Test mix Positive and Negative Ion Samples

24
Appendix II
Agilent 1200 Series SL LC Parameters
Agilent 1200 Series LC Parameters
Column: Agilent ZORBAX Eclipse Plus C18,
2.1 mm × 100 mm, 1.8 µm Agilent
p/n 959764-902
Column temperature: 55 ºC
Injection volume: 5.0 µL
Autosampler temperature: 6 ºC
Needle wash: Flushport (MeOH:H2O 75:25), 5 s
Mobile phase: A = H2O w/5 mM ammonium formate +
0.01% formic acid
B = 5 mM ammonium formate + 0.01%
formic acid in 95:5 acetonitrile:water
Flow rate: 0.3 mL/min
Gradient pump time table
Time Flow Pressure Solv ratio B
0.5 No change 600 6
14 No change 600 95
17 No change 600 95
Stop time 17 min
Post time 3 min
Agilent 6230 TOF Parameters
Jet Stream Conditions
Drying gas temperature: 225 °C
Drying gas flow (nitrogen): 9 L/min
Nebulizer gas pressure (nitrogen): 25 psig
Capillary voltage: 4500 V
Sheath gas temperature: 350 °C
Sheath gas flow: 11 L/min
Nozzle voltage: 500 V
Acquisition Mode MS1
Min Range 25 m/z
Max Range 3200 m/z
Scan Rate 3
Reference Masses: Positive ion
121.050873 (M+H+ for purine)
922.009798 (M+H+ for HP-921)

25
Appendix III
Agilent 1290 Infinity LC Parameters
Column: Agilent ZORBAX Eclipse Plus C18 HD,
2.1 mm × 100 mm, 1.8 µm Agilent
p/n
Column temperature: 60 ºC
Injection volume: 5.0 µL
Autosampler temperature: 6 ºC
Needle wash: Flushport (MeOH:H2O 75:25) 5 s
Mobile phase: A = H2O w/5 mM ammonium formate +
0.01% formic acid
B = 5 mM ammonium formate + 0.01%
formic acid in 95:5 acetonitrile:water
LC flow rate: 1.0 mL/min
Gradient pump time table
Time Flow Pressure Solv ratio B
0.15 No change 600 6
2.1 No change 600 95
3 No change 600 95
Stop time 3 min
Post time 1 min
6540 Q-TOF Parameters
Jet stream conditions
Drying gas temperature: 325 ºC
Drying gas flow (nitrogen): 8 L/min
Nebulizer gas pressure (nitrogen): 60 psig
Capillary voltage: 4000 V
Sheath gas temperature: 350 ºC
Sheath gas flow: 12 L/min
Nozzle voltage: 500
Acquisition Mode: MS1
Min Range 100 m/z
Max Range 1000 m/z
Scan Rate 10 per s
Reference Masses: Positive ion
121.050873 (M+H+ for purine)
922.009798 (M+H+ for HP-921)

www.agilent.com/chem
Agilent shall not be liable for errors contained herein or
for incidental or consequential damages in connection
with the furnishing, performance, or use of this material.
Information, descriptions, and specifications in this
publication are subject to change without notice.
© Agilent Technologies, Inc., 2009
Printed in the USA
August 5, 2009
5990-4251EN