An Analysis of the Potential Economic Impact of Huanglongbing on the California Citrus Industry
23
An Analysis of the Potential Economic Impact of Huanglongbing on the California Citrus Industry Samantha L. Durborow M.S. student, Agricultural Sciences, Texas A&M University-Commerce [email protected] Jose A. Lopez Assistant Professor, Agricultural Sciences, Texas A&M University-Commerce [email protected] Selected Paper prepared for presentation at the Southern Agricultural Economics Association Annual Meeting, Orlando, FL, February 3-5, 2013 Copyright 2013 by Samantha Durborow and Jose Lopez. All rights reserved. Readers may make verbatim copies of this document for non-commercial purposes by any means, provided that this copyright notice appears on all such copies.
Transcript of An Analysis of the Potential Economic Impact of Huanglongbing on the California Citrus Industry

An Analysis of the Potential Economic Impact of Huanglongbing on the California Citrus Industry
Samantha L. Durborow M.S. student, Agricultural Sciences, Texas A&M University-Commerce
Jose A. Lopez Assistant Professor, Agricultural Sciences, Texas A&M University-Commerce
[email protected] Selected Paper prepared for presentation at the Southern Agricultural Economics Association
Annual Meeting, Orlando, FL, February 3-5, 2013
Copyright 2013 by Samantha Durborow and Jose Lopez. All rights reserved. Readers may make verbatim copies of this document for non-commercial purposes by any means, provided that this copyright notice appears on all such copies.
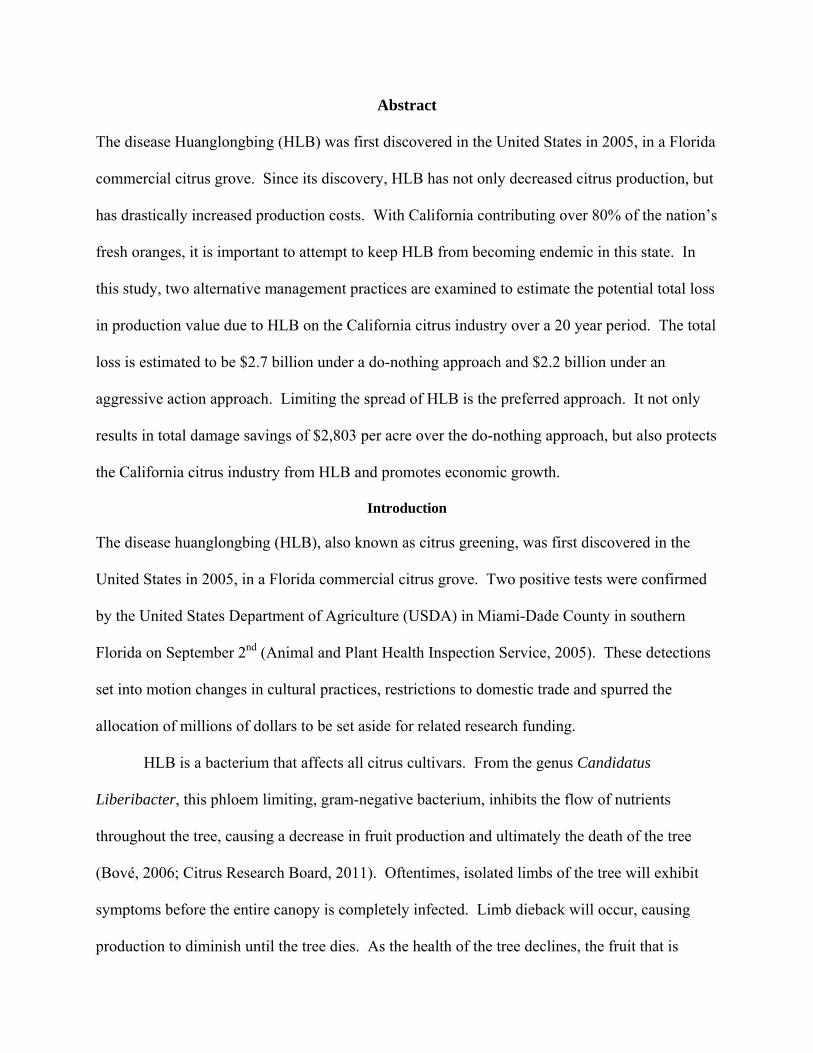
Abstract
The disease Huanglongbing (HLB) was first discovered in the United States in 2005, in a Florida
commercial citrus grove. Since its discovery, HLB has not only decreased citrus production, but
has drastically increased production costs. With California contributing over 80% of the nation’s
fresh oranges, it is important to attempt to keep HLB from becoming endemic in this state. In
this study, two alternative management practices are examined to estimate the potential total loss
in production value due to HLB on the California citrus industry over a 20 year period. The total
loss is estimated to be $2.7 billion under a do-nothing approach and $2.2 billion under an
aggressive action approach. Limiting the spread of HLB is the preferred approach. It not only
results in total damage savings of $2,803 per acre over the do-nothing approach, but also protects
the California citrus industry from HLB and promotes economic growth.
Introduction
The disease huanglongbing (HLB), also known as citrus greening, was first discovered in the
United States in 2005, in a Florida commercial citrus grove. Two positive tests were confirmed
by the United States Department of Agriculture (USDA) in Miami-Dade County in southern
Florida on September 2nd (Animal and Plant Health Inspection Service, 2005). These detections
set into motion changes in cultural practices, restrictions to domestic trade and spurred the
allocation of millions of dollars to be set aside for related research funding.
HLB is a bacterium that affects all citrus cultivars. From the genus Candidatus
Liberibacter, this phloem limiting, gram-negative bacterium, inhibits the flow of nutrients
throughout the tree, causing a decrease in fruit production and ultimately the death of the tree
(Bové, 2006; Citrus Research Board, 2011). Oftentimes, isolated limbs of the tree will exhibit
symptoms before the entire canopy is completely infected. Limb dieback will occur, causing
production to diminish until the tree dies. As the health of the tree declines, the fruit that is

produced will be bitter, misshapen, remain green and small, in addition to an increase in early
fruit abscission (USDA, 2011). Ultimately, the fruit produced is undesirable and unmarketable.
Within five to eight years of becoming infected, the tree will no longer be economically
productive (National Research Council, 2010). In most cases where growers are attempting to
limit the spread of HLB, the infected trees will be removed before they ever reach the point of
being considered unproductive. There is no cure for this disease, so prevention is important.
Symptoms may not present themselves in infected trees for up to two years. This potential for
delayed symptom expression adds to the threat of this disease. If an infected tree is present in an
orchard and is not known to harbor HLB, the ability of the bacteria to spread is enhanced.
HLB has been generally found to be transferred from tree to tree through three different
means: the Asian citrus psyllid (ACP), the African citrus psyllid, and contaminated budwood
propagation. Without any of these transmission methods present, the spread of HLB is limited.
While the African citrus psyllid is considered a vector pest of HLB, it is not currently found in
the United States and therefore is not a current concern in California. In Florida where HLB is
endemic, regulations have been put into place to minimize the transfer of HLB through
propagation. Nursery stock may only come from trees that test negative for the bacteria and are
grown in screened nursery buildings. The Asian citrus psyllid, on the other hand, is found in the
United States and has been a major concern in Florida and California, the top citrus producing
states.
The Asian citrus psyllid (Diaphorina citri) is the main vector of HLB transmission.
Since its introduction to the United States in 1998, ACP has been found in ten states, including
Alabama, Arizona, California, Florida, Georgia, Hawaii, Louisiana, Mississippi, South Carolina,

and Texas. Acting in the capacity of a vector of HLB, this species of psyllid has the potential to
spread the disease anywhere the psyllid is detected.
The first detection of ACP in California was made in 2008 (Blake, 2008). California
supplies the United States with over 80% of its fresh oranges and is the country’s largest exporter
of fresh citrus. While Florida has a larger amount of acreage dedicated to citrus than California,
in 2009 California contributed 45% of the industry’s nearly $2.9 billion value of production
(USDA, 2011a).
Alternative Management Approaches
In order to have a better understanding of the economic impact of HLB in California, two
different scenarios are explored. These scenarios consider the potential economic impact of
reduced yields and increased costs associated with HLB management, or lack thereof. In the
first scenario, HLB is introduced into California and no changes are made in an attempt to limit
the spread of the disease. HLB is projected to spread rapidly throughout the state under this
scenario. This will be referred to as the pessimistic approach and it tracks the revenue
repercussions as yields decline over time. In the second scenario, HLB is introduced into
California and there is a statewide attempt to minimize its spread. Like the pessimistic approach,
this optimistic approach will track the reduced revenue from production as yields decline, in
addition to the costs associated with attempting to minimize the spread of HLB.
ACP is currently found only in southern regions of California. It is possible that ACP
may be eradicated from the state. While this is possible, it is not probable, as reintroduction is
very likely to happen since ACP is found in Mexico and Arizona, which border California. In
order to analyze how HLB may impact the orange production in California, this study assumes
that ACP spreads through the state, as was seen in Florida, and becomes a naturalized species.

ACP naturalization means that once HLB is introduced, it has the potential to spread through the
entire state. This assumption will be the same for both the pessimistic approach and the
optimistic approach.
If farmers were to make no changes in cultural practices after an introduction of HLB, the
disease would ultimately reduce yields as it spreads through the state. It would be difficult to
keep production levels high enough to be economically productive. Attempting to replant would
be difficult, as new trees are extremely susceptible to infection and would probably die prior to
producing any fruit. Therefore, this approach assumes no replanting attempts.
Due to the importance of the entire citrus industry in California, a do-nothing strategy
would most likely be rejected by the majority of growers, although some may adopt this
approach. However, assessing the loss in production value under a worst case scenario allows
for comparisons to be made with a do-something strategy or optimistic approach. This
comparison provides an estimate of the additional damage that could be avoided by adopting
modified cultural practices.
Although in some instances, no widespread attempts to limit the incidence of HLB are
made, it is not the norm. Through modifying cultural practices, the rate of spread of HLB can be
kept below 1% (Morris and Muraro, 2008; Roistacher, 1996). With many different options
available to growers, it is likely that the rate of spread will fluctuate somewhat, depending on the
intensity of the control program being implemented. With an aggressive HLB control strategy in
place, yields can remain stable enough to keep the industry afloat.
With ACP populations established throughout the state, under this optimistic approach, if
HLB is discovered it will be expected that immediate attempts to limit the spread of the disease
will take place. This includes the beginning of conducting HLB field surveys and increasing

pesticide applications in an attempt to minimize ACP population levels throughout the state. As
HLB spreads throughout California, costs associated with diseased tree removal and
replacement, in addition to decreased yields will be realized. While the intensity of attempting to
limit HLB spread will vary between individual growers, the optimistic approach assumes that all
growers in the state will be taking an active approach.
Scouting is required in order to assess the number of HLB incidences. Since HLB is not
endemic in California, there are no values that can be attributed to HLB scouting costs. To
estimate scouting costs, this study assumes that the costs are going to be similar as the ones seen
in Florida. To account for the disparity between the monetary value of labor in Florida and
California, an adjustment is made by evaluating the differences in minimum wage between the
two states. In Florida, Morris and Muraro (2008) report that scouting costs range from $14 to
$35 per acre. With 4 inspections per year, the annual cost of scouting ranges from $70 to $140
per acre. In 2011, the minimum wage in Florida and California was $7.25 and $8.00 per hour
respectively (United States Department of Labor, 2012). Applying the percentage difference
between the two wage rates to the established range in Florida’s scouting costs, which range
from $14.00 to $35.00 per acre, California’s scouting costs are estimated to range from $15.45 to
$38.62 per acre. When scouting is conducted four times per year, scouting costs are estimated to
average $108.88 per year per acre.
Controlling ACP populations is an integral part of HLB management due to its vector
capabilities. The number of insecticide applications and what type of product used can create a
wide disparity in the costs. The purchase and application costs of three additional foliar
insecticide applications per year and one soil application of aldicarb (a systemic insecticide) are
going to make up the costs related to ACP Control. Morris et al. (2008) recommend three foliar

applications and one soil application per year. Since there is a large variation in the number of
applications producers make, the value used in this study can be considered a baseline, as costs
can go up or down from there. An average cost of $317.59 per acre for controlling ACP is used
in the optimistic approach. Additional pesticide applications and scouting will increase
production costs by an estimated cost of $427.47 per acre each year.
Once trees are identified through scouting, immediate removal should take place. Costs
associated with tree removal include uprooting the tree, disposing of the tree, ground preparation
for replanting and the direct cost of the replacement tree. The number of trees planted per acre
can vary, but will be held constant at an average of 121 trees per acre. Removed trees will be
replaced with new plantings the year after their removal. Removal and ground preparation costs,
are estimated at an average of $13.34 per removed tree (Irey et al., 2008; Morris and Muraro,
2008; O’Connell et al., 2009). The current cost of replacement trees in California is estimated at
$10.50 per tree (O’Connell et al., 2009). As the demand for nursery stock increases and the costs
associated with nursery stock production increase, it is expected that the price for replacement
trees will increase. Since the introduction of HLB in Florida, the cost of replacement trees in
Florida has doubled (National Research Council, 2010). This study assumes that the cost of
replacing trees in California will follow a similar trend. Therefore, an estimated value of $21.00
per replacement tree is used. It has been shown that under consistent and stringent management
practices for HLB, an average increase in tree removal of 2.3% is possible (Morris et al., 2008).
Pessimistic Approach Model
Under the pessimistic approach, the present value of the simulated losses in production value
over the T year period considered is computed as
(1) ∑ 1 ,

where the total loss during year t ( is equal to the expected value of production with no HLB
minus the estimated value of production with HLB. The total value of production with HLB is
dependent upon the rate of spread of HLB. Under the pessimistic approach, the present value of
the total loss in production per acre over a 20 year period is estimated by running a Monte Carlo
simulation 10,000 times.
Determining the rate of spread of a pest and or disease is a challenge. Different
environmental factors can be attributed to how rapidly and how successful an invasive species or
pathogen can be, in addition to the number of original pest introduction sites. Management
practices play an important role in the dispersion of HLB over time. Aggressive management
practices may allow contaminated groves to stay economically viable.
Following the model proposed by Bassanezi and Bassanezi (2008), initial HLB disease
severity can change how fast HLB may progress through a tree. The proportion of HLB severity
in an individual tree (s) is approximated by
(2) ,
where so is the initial proportion of symptom expression and r is the rate at which HLB moves
through the tree in year t (Bassanezi and Bassanezi, 2008). HLB is estimated to progress through
young trees (r = 3.68) at such fast rates that the tree may never become productive. The
increased rate of spread in young trees makes replanting nearly impossible when no control
measures are in place. This is due to the fact that the new trees will most likely die prior to
producing any fruit, as they are highly likely to become infected shortly after planting. Values
for the initial proportion of symptom expression (so) suggested by Bassanezi and Bassanezi
(2008) range from 0.2 to 0.025 depending on the age of the tree. Bassanezi and Bassanezi

(2008) use values for the rate at which HLB moves through the tree (r) suggested range from
3.68 down to 0.69 depending on the age of the tree.
A two-year-old tree is estimated to be completely infected in less than two years, whereas
a 10-year-old tree may take up to 10 years. Throughout the time between initial infection and
complete infection the tree may remain productive. An infected tree’s production will decline as
it reaches 100% infection. From there, it may still continue to produce fruit until the tree dies,
although fruit quality will most likely be degraded.
Through the information that can be gleaned by observing HLB spread in individual
trees, an assessment of the spread through a group of trees can be made. The incidence of
symptomatic trees (y) in year t can be estimated using the Gompertz function proposed by
Bassanezi and Bassanezi (2008),
(3) ,
where yo is the portion of symptomatic trees when HLB symptoms first present themselves and R
is the rate of disease incidence progress through a grove each year. Bassanezi and Bassanezi
(2008) use R values ranging from 1.3 for trees between 0 and 2 years old down to 0.244 for trees
older than 10 years.
Total disease severity (TD) can be estimated as
(4) ,
where y is the incidence of symptomatic trees and s is the portion of the canopy exhibiting
symptoms of HLB (Bassanezi and Bassanezi, 2008). This equation combines the proportion of
HLB severity in individual trees (st) and the incidence of symptomatic trees (yt) and can be used
to estimate the overall severity of HLB in a grove for any number of years (t) after an HLB
introduction. Once the total disease severity (TD) is calculated for any given year, it is used in a

negative exponential model to approximate relative yield (Bassanezi and Bassanezi, 2008;
Gottwald et al., 2010). That is, relative yield (RYt) is equal to
(5) . .
The relative yield function above is used to compare HLB yields with yields from healthy trees
(Bassanezi and Bassanezi, 2008). The amount of time between full infection and tree necrosis is
not addressed. By the time relative yield reaches such low levels, it is likely that producers will
no longer be harvesting the crop that is present, as returns to growers will no longer cover to cost
of production and/or harvesting.
The age of the tree plays a critical role in the rate of disease spread. There are currently
around 180,000 bearing acres of oranges in California (USDA, 2011a). Of these 180,000 acres,
approximately 86% are over 10 years old and 9% fall into the age category of 6 to 10 years old
(California Agricultural Statistics Service, 1999; 2002; USDA, 2006; 2008; 2010; 2011a;
Computed by Author). Bassanezi and Bassanezi’s (2008) model assumes that the entire grove is
in the same age bracket. Since the orange trees in California are not all in the same age bracket,
this study accounts for the variability in the age of trees by using a stochastic simulation model
for each of the two different approaches. A stochastic simulation model is used because it takes
into account different parameters from each age group that determine the rate of spread of HLB
and estimates the total expected damage of HLB over time.
Using the rates of spread of HLB through the different age groups presented by Bassanezi
and Bassanezi (2008), each parameter can be simulated using PERT distributions. These include
values for the proportion of symptom expression in individual trees (so), annual rates of HLB
progress in individual trees (r), and the annual rate of HLB incidence progress through a block of
oranges (R). This allows for the consideration of a range of possible values for the parameter,

rather than a stagnant value. With the majority of trees in California being 10 years or older, the
minimum and most likely values in the PERT distribution are appropriately estimated by the
parameter values reported by Bassanezi and Bassanezi (2008) for trees greater than 10 years old.
Optimistic Approach Model
Under the optimistic approach, the present value of the total loss in production per acre over a 20
year period is estimated by running a Monte Carlo simulation 10,000 times by
(6) ∑ 1 ,
where Dt is the sum of the total loss in production value per acre plus the additional costs
associated with limiting HLB spread per acre (ACt). In the optimistic approach, immediate
changes will be made to limit HLB spread upon initial detection. This is accompanied with costs
that are dependent upon the rate of spread of HLB which is estimated using Bassanezi and
Bassanezi (2008) total disease severity model (TD). Under the optimistic approach, additional
costs are per acre (ACt) in year t as a result of HLB. This is estimated as
(7) ∆ ,
where ∆FC is the immediate per acre increase in fixed production costs (increased pesticide
application and scouting costs), RTt is the cost associated with the diseased tree removal in year t
(actual tree removal costs and loss in production incurred as a result of diseased tree removal),
which depends on the rate of spread of HLB, and PTt is the total per acre cost of replanting trees
in year t that were removed the previous year.
The number of trees removed each year is dependent upon the rate of HLB spread in year
t. This rate of HLB spread (Rt) is estimated using a PERT distribution. The values assumed in
the PERT distribution for the annual rate of HLB spread are different in the optimistic approach,
than what were used under the pessimistic approach. This is because it is assumed under the

optimistic approach that orange growers attempt to keep the HLB spread rate as small as
possible. The optimistic values for the annual spread rate are estimated to be 0.010, 0.023, and
0.032 for the minimum, most likely, and maximum values respectively.
Morris and Muraro (2008) and Roistacher (1996) have documented that the rate of spread
can be kept at 0.010, therefore this will be the minimum value. Morris et al. (2008) and Morris
and Muraro (2008) report that the rate of spread of HLB in Florida under attempts to limit it,
have been observed to average 0.023, therefore this value was adopted for the most likely value
in the PERT distribution assumed for the annual rate of spread. The National Research Council
(2010) reports the rate of spread as high as 0.04. A lower value for the maximum rate of spread
of HLB than the 4% reported was assumed under the optimistic approach due to the fact the 4%
came from studies where mixed management practices were adopted by growers and a uniform
attempt at controlling the rate of spread of HLB was not made.
Estimated Prices, Yields, and Utilization
Under both the optimistic and pessimistic approach, the prices for both fresh and processed
oranges for each year are estimated using price ranges from year 2001 to year 2008 and are
incorporated in the simulation. The processed-orange price ranges from $0.23 to $1.52 per 75-
pound carton while the fresh-orange price ranges from $9.26 to $18.01 per 75-pound carton
(USDA, 2003; 2004; 2005; 2006a; 2007a; 2008a; 2009; 2010a). Based on the 1992-2011 annual
fresh orange prices in California, the fresh orange price is assumed to be normally distributed
with a mean of $12.73 and a standard deviation of $1.16 from year 1 to year 20 in the simulation
analysis. Similarly, based on the 1992-2011 annual processed orange prices in California, the
processed orange price was assumed to be normally distributed with a mean of $0.76 and a

standard deviation of $0.25 from year 1 to year 20. These price values are incorporated into the
simulation analysis by using normal distributions, as the average annual prices seen for all
oranges in California between 1992 and 2011 were relatively stable.
To account for the variability in what percentage of the harvested crop goes to processing
and what remains as fresh fruit under both approaches, a range of values for the percent that are
processed is considered. In the last 10 years (period 2000-2011), the average minimum value for
the percentage of oranges that are processed is approximately 13.0% and the average maximum
value is approximately 29.1% (USDA, 1994; 1995; 1996; 1997; 1998; 1999; 2000; 2001; 2002;
2003; 2004; 2005; 2006a; 2007a; 2008a; 2009; 2010a; 2011a). This study uses a uniform
distribution to consider potential values for the percent-processed rate between 0.130 and 0.291.
Results
If HLB is allowed to spread throughout California without any attempts to limit its spread (the
pessimistic scenario) for a period of 20 years, today’s total loss in production value, on average
is estimated to be $2.7 billion. However, if California orange growers take aggressive actions
attempting to limit the spread of HLB (the optimistic scenario), today’s total damages over the
20-year period considered are on average estimated to be $2.2 billion. When comparing the loss
in production value between the pessimistic and optimistic approaches over a 20 year period,
damages under the pessimistic approach are much higher (Table 1). Under the pessimistic
approach it takes longer to see the reduction in yields. Under the optimistic approach yield loss
is immediate and increases in production costs are realized right away.
The estimated loss in production amounts to a 33% and a 27% loss in production value
under the pessimistic approach and optimistic approach, respectively, when compared to the
simulated average value of healthy production. When compared directly to today’s value of the

past 20 years of production, this is equivalent to an estimated 19% and 15% reduction in the
present value over the next 20 years if HLB were to be detected in 2012 for the pessimistic and
optimistic approaches, respectively. If the amount of acreage was held constant at 180,000 over
the past 20 years, as was done in the projected twenty years included in the simulation of the
total loss under both approaches, an estimated 26% and 21% decrease in production value under
the pessimistic and optimistic approach, respectively, is estimated.
Conclusion
With California contributing over 80% of the nation’s fresh oranges, it is important to attempt to
keep HLB from becoming endemic in the state. Quantifying the potential economic impact of
HLB under different management approaches is essential in developing the most appropriate
mitigation actions to take if HLB is discovered in California. In 2009 California contributed
45% of the United States citrus industry’s nearly $2.9 billion production value (USDA, 2011a).
As California’s 15th ranked commodity in terms of production value, orange production was
worth an estimated $722 million in 2010 (USDA, 2011b). Employing around 26,000 people in
the state (Wunderlich, 2010), the citrus industry in California is worth protecting from the spread
of diseases.
The main objective of this study was to approximate the total loss in the value of orange
production in California under a pessimistic and an optimistic scenario. Two management
strategies were presented, allowing for a comparison in the estimated total damage costs related
to the presence of HLB. One scenario estimated the costs associated with a do-nothing
approach, referred to as a pessimistic approach, while the second scenario included costs related
to attempting to minimize the potential damage caused by HLB, and is referred to as an

optimistic approach. Monte Carlo simulations were employed to estimate the total damage of
HLB in California under both approaches.
When comparing the loss in production value between the pessimistic and optimistic
approaches over a 20 year period, damages under the pessimistic approach are much higher. The
average total annual damages estimated under the pessimistic approach is $14,938 per acre
(Figure 1), while under the optimistic approach it is $12,135 per acre (Figure 2). This is a
difference of $2,803 per acre over the 20 years that are projected. Under the pessimistic
approach it takes longer to see the reduction in yields. Under the optimistic approach yield loss
is immediate and increases in production costs are realized right away. The difference in the
yield loss is related to the fact that under the pessimistic approach, trees are left to continue to
produce until they die, while under the optimistic approach, trees are removed immediately upon
disease detection.
Under the optimistic approach, an increase in pesticide applications is assumed. Not only
is this costly to growers, it is can be detrimental to the biological balance in the citrus groves.
Pesticides do not discriminate against pests when applied. Not only are the target pest
populations decreased, in this case ACP, but the beneficial insect populations are affected as
well. The increased cost of production under the optimistic approach could possibly lead to a
decrease in orange acreage kept in production, if HLB is detected in California. Although this
may be the case, attempting to limit the spread of HLB is still considered to be an optimistic
approach, as it is currently the only known method that can keep the citrus industry productive.
Although production costs are increased, the total damage caused by HLB is significantly less
under the optimistic approach than in the pessimistic approach. This is with an estimated just

over a half a billion dollars saved in production value alone, over the 20 years included in the
simulation of the total damage caused by HLB, when compared to the pessimistic approach.
Being able to keep orange production from declining to levels seen under the pessimistic
approach is beneficial to the citrus industry. Under the pessimistic approach, production is
estimated to be decreased by over 50% after 11 years following an HLB introduction. The loss
of production is felt by more people than just the famers that grow the oranges. As production
declines, packing houses do not run, box makers do not sell their products, shipping companies
do not operate, etc. An issue arises with who is bearing the increased cost in production. Under
the optimistic approach, the grower is absorbing the additional costs of production. This could
potentially lead to less orange acreage being kept in production. Attempting to limit the spread
of HLB is the superior choice when only considering the pessimistic and optimistic approaches,
although alternative management options should be further explored. Not only is less money lost
as a result of HLB, but the citrus industry in California may not survive if growers as a whole do
not attempt to limit the spread of HLB immediately upon detection.

References
Animal and Plant Health Inspection Service (APHIS). U.S. Department of Agriculture and
Florida Department of Agriculture Confirm Detection of Citrus Greening, September 2,
2005. Internet site:
http://www.aphis.usda.gov/newsroom/content/2005/09/greening_ppq.shtml. (Accessed
April 18, 2011).
Bassanezi, R.B. and R.C. Bassanezi. “An Approach to Model the Impact of Huanglongbing on
Citrus Yield.” Proceedings from the International Research Conference on
Huanglongbing, December 2008, pp. 301-304.
Bassanezi, R., L. Montesion, M. Gasparoto, A. Filho, and L. Amorim. “Yield Loss Caused By
Huanglongbing in Different Sweet Orange Cultivars in Sao Paulo, Brazil.” European
Journal of Plant Pathology 130(2011):577-586.
Blake, C. “California Citrus Industry Braces for Impact of Asian Citrus Psyllid.” Western Farm
Press, October 07, 2008. Internet site: http://westernfarmpress.com/orchard-
crops/california-citrus-industry-braces-impact-asian-citrus-psyllid (Accessed December
7, 2011).
Bové, J.M. “Huanglongbing: A Destructive, Newly Emerging, Century Old Disease of Citrus.”
Journal of Plant Pathology 88(March 2006):7-37.
California Agricultural Statistics Service. 1998 California Citrus Acreage Report. Sacramento,
California, Released May 12, 1999.
California Agricultural Statistics Service. 2002 California Citrus Acreage Report. Sacramento,
California, Released November 25, 2002.

Citrus Research Board (CRB). ACP: Carrying Asian Citrus Psyllid: A Death Sentence for
California Citrus. Internet Site: http://www.citrusresearch.baremetal.com/acp.
(Accessed April 4, 2011).
Gottwald, T.R., M.S. Irey, T. Gast, S.R. Parnell, E.L. Taylor, and M.E. Hilf. “Spatio-temporal
Analysis of an HLB Epidemic in Florida and Implications for Spread.” Proceedings, 17th
Conference IOCV, Insect-Transmitted Procaryotes, 2010.
Irey, M.S., T. Gast, and J. Snively. “Economic Impact of Managing Huanglongbing in Groves at
Southern Gardens Citrus.” International Workshop of Huanglongbing and the Asian
Citrus Psyllid, 2008.
Morris, A. and R. Muraro. Economic Evaluation of Citrus Greening Management and Control
Strategies. Food and Resource Economics Department, Florida Cooperative Extension
Service, Institute of Food and Agricultural Services, University of Florida, Gainesville,
FL, EDIS Document FE712, June 2008.
Morris, R. A., R. P. Muraro, and T. H. Spreen. “Invasive Diseases and Fruit Tree Production:
Economic Tradeoffs of Citrus Greening Control on Florida’s Citrus Industry.” Paper
presented at the Southern Agricultural Economics Association Annual Meeting, Dallas,
Texas, February 2-6, 2008.
National Research Council. Strategic Planning for the Florida Citrus Industry Addressing Citrus
Greening Disease. Washington, DC: The National Academies Press. 2010.
O’Connell, N. V., C. E. Kallsen, K. M. Klonsky, and R. L. De Moura. 2009 Sample Costs to
Establish an Orange Orchard and Produce Oranges. Davis, California: University of
California Cooperative Extension, OR-VS-09, 2009.

Roistacher, C.N. “The Economics of Living with Citrus Diseases: Huanglongbing (Greening) in
Thailand.” Thirteenth IOCV Conference- Procaryotes and Blight. 1996, pp. 279-285.
United State Department of Agriculture - National Agricultural Statistics Services, Citrus Fruits
1994 Summary. Publication Fr Nt 3-1 (94), 1994.
United State Department of Agriculture - National Agricultural Statistics Services, Citrus Fruits
1995 Summary. Publication Fr Nt 3-1 (95), 1995.
United State Department of Agriculture - National Agricultural Statistics Services, Citrus Fruits
1996 Summary. Publication Fr Nt 3-1 (96), 1996.
United State Department of Agriculture - National Agricultural Statistics Services, Citrus Fruits
1997 Summary. Publication Fr Nt 7 (97), 1997.
United State Department of Agriculture - National Agricultural Statistics Services, Citrus Fruits
1998 Summary. Publication Fr Nt 7 (98), 1998.
United State Department of Agriculture - National Agricultural Statistics Services, Citrus Fruits
1999 Summary. Publication Fr Nt 7 (99), 1999.
United State Department of Agriculture - National Agricultural Statistics Services, Citrus Fruits
2000 Summary. Publication Fr Nt 7 (00), 2000.
United State Department of Agriculture - National Agricultural Statistics Services, Citrus Fruits
2001 Summary. Publication Fr Nt 7 (01), 2001.
United State Department of Agriculture - Animal and Plant Health Inspection Service. Citrus
Greening: Questions and Answers. March 2007.
United State Department of Agriculture. Pest Alert: Get the Facts on Citrus Greening
(Huanglongbing) U.S. Department of Agriculture- Animal and Plant Health Inspection
Service. Program Aid No. 1851, June 2011.
United State Department of Agriculture - National Agricultural Statistics Services, Citrus Fruits
2002 Summary. Publication Fr Nt 7 (02), 2002.
United State Department of Agriculture - National Agricultural Statistics Services. Citrus Fruits
2003 Summary. Publication Fr Nt 7 (03), 2003.
United State Department of Agriculture - National Agricultural Statistics Services. Citrus Fruits
2004 Summary. Publication Fr Nt 7 (04)a, 2004.
United State Department of Agriculture - National Agricultural Statistics Services, Citrus Fruits
2005 Summary. Publication Fr Nt 7 (05), 2005.
United State Department of Agriculture - National Agricultural Statistics Services. 2005
California Citrus Acreage Report. Sacramento, California: California Department of
Food and Agriculture, Released July 3, 2006.
United State Department of Agriculture - National Agricultural Statistics Services. Citrus Fruits
2006 Summary. Publication Fr Nt 7 (06), 2006a.
United State Department of Agriculture - National Agricultural Statistics Services. Citrus Fruits
2007 Summary. Publication Fr Nt 7 (07), 2007a.
United State Department of Agriculture - National Agricultural Statistics Services. 2008
California Citrus Acreage Report. Sacramento, California: California Department of
Food and Agriculture, Released November 21, 2008.
United State Department of Agriculture - National Agricultural Statistics Services, Citrus Fruits
2008 Summary. Publication Fr Nt 7 (08), 2008a.
United State Department of Agriculture - National Agricultural Statistics Services. Citrus Fruits
2009 Summary. Publication Fr Nt 7 (09), 2009.

United State Department of Agriculture - National Agricultural Statistics Services. 2010
California Citrus Acreage Report. Sacramento, California: California Department of
Food and Agriculture, Released July 15, 2010.
United State Department of Agriculture - National Agricultural Statistics Services. Citrus Fruits
2010 Summary. Publication Fr Nt 7 (10), 2010a.
United State Department of Agriculture - National Agricultural Statistics Services, Citrus Fruits
2011 Summary. ISSN: 1948-9048, 2011a.
United State Department of Agriculture - National Agricultural Statistics Service. California
Agricultural Statistics, Crop Year 2010. California: United States Department of
Agriculture, National Agricultural Statistics Service, 2011b.
United States Department of Labor - Wage and Hour Division. Internet site:
http://www.dol.gov/whd/state/stateMinWageHis.htm (Accessed February 8, 2012).
Wunderlich, Gene. Huanglongbing and the Asian Citrus Psyllid Threaten California’s Citrus
Industry. California State Senate Republican Caucus, Briefing Report, April 14, 2010.

Figure 1. Distribution of the Per Acre Loss in Production Value Under the Pessimistic Approach
Figure 2. Distribution of the Per Acre Total Damage Under the Optimistic Approach

Table 1. Comparison of the Average Total Damages and Differences in Average Production Losses Per Acre Under the Optimistic and
Pessimistic Approaches
Optimistic Approach Pessimistic Approach Difference
Year Average Total
Damage Average Increased Production Costs
Average Production Loss Average Total Damage
Production Loss Total Damage
1 $504.94 $445.57 $59.37 $0.32 $59.05 $504.62 2 $596.53 $480.78 $115.75 $2.18 $113.57 $594.35 3 $635.02 $466.77 $168.24 $9.27 $158.98 $625.75 4 $670.27 $452.99 $217.28 $28.76 $188.52 $641.51 5 $703.70 $439.75 $263.95 $70.95 $193.00 $632.75 6 $734.44 $427.11 $307.33 $146.65 $160.68 $587.79 7 $713.65 $414.61 $299.04 $262.88 $36.16 $450.77 8 $692.04 $402.59 $289.45 $415.54 $126.09 $276.50 9 $671.50 $390.78 $280.72 $592.61 $311.89 $78.89 10 $651.28 $379.24 $272.04 $772.69 $500.66 $121.41 11 $632.52 $368.14 $264.38 $942.97 $678.59 $310.45 12 $614.73 $357.62 $257.11 $1,086.17 $829.06 $471.44 13 $596.98 $347.23 $249.75 $1,195.64 $945.89 $598.66 14 $579.34 $337.06 $242.28 $1,280.16 $1,037.88 $700.82 15 $562.44 $327.24 $235.19 $1,329.09 $1,093.89 $766.65 16 $546.02 $317.64 $228.38 $1,361.71 $1,133.33 $815.69 17 $530.05 $308.40 $221.65 $1,371.76 $1,150.12 $841.71 18 $515.09 $299.53 $215.56 $1,368.53 $1,152.97 $853.44 19 $499.39 $290.73 $208.66 $1,358.45 $1,149.79 $859.05 20 $484.72 $282.27 $202.45 $1,341.59 $1,139.13 $856.86
Total $12,134.64 $7,536.07 $4,598.57 $14,937.91 $12,159.24 $11,589.13