AMPLE HAPTER Microsoft Reporting Services · PDF file · 2015-11-06• Visual...
39
Teo Lachev MANNING Microsoft Reporting Services IN ACTION S AMPLE C HAPTER
Transcript of AMPLE HAPTER Microsoft Reporting Services · PDF file · 2015-11-06• Visual...

Teo Lachev
M A N N I N G
MicrosoftReportingServicesIN ACTION
S A M P L E C H A P T E R

Microsoft Reporting Services in Actionby Teo Lachev
Chapter 1
Copyright 2004 Manning Publications
vii
brief contents
1 Introducing Microsoft Reporting Services 1
2 Report authoring basics 39
3 Working with data 63
4 Designing reports 102
5 Using expressions and functions 142
6 Using custom code 183
7 Managing the Reporting Services environment 215
8 Securing Reporting Services 260
9 On-demand report delivery 299
10 Reporting for Windows Forms applications 337
11 Reporting for web-based applications 377
12 Reporting for OLAP applications 416
13 Enterprise reporting 456
14 Subscribed report delivery 483
15 Extending Reporting Services 517
16 Performance and scalability 566

1
C H A P T E R 1
Introducing Microsoft Reporting Services1.1 What is RS? 21.2 RS at a glance 61.3 RS architecture 111.4 Understanding Report Processing 171.5 Delivering reports 20
1.6 What is the report lifecycle? 221.7 RS in action 231.8 Evaluating RS 331.9 Summary 351.10 Resources 35
So much information, so little time ... the character “Poison Ivy” would likely say ifthe Batman saga was taking place in today’s enterprise.
We all know that the dot.com boom is history and so are the lavish IT budgets.In the doldrums of the economic recovery, organizations tend to spend their moneyon streamlining internal processes to gain a competitive advantage. According toMicrosoft, today’s information workers spend as much as 80 percent of their timegathering information, with only 20 percent left to analyze it and make a decision. Inmany organizations, such requests consume significant IT and development resources.Too often, Excel spreadsheets are the prevalent reporting tools today and manual dataentry or “pencil-pushing” is among the top reasons for inaccurate data and wrongdecisions. Aware of these issues, Microsoft initiated the Microsoft SQL Server 2000Reporting Services project at the beginning of the new millennium, with a bold visionto “enable employees at all levels of an organization to realize the promise of BusinessIntelligence to promote better decision making.”
This chapter provides a panoramic view of Reporting Services (RS). Throughout therest of this book I will use the terms Reporting Services and RS interchangeably. You will see

2 CHAPTER 1 INTRODUCING MICROSOFT REPORTING SERVICES
• Why RS is such a compelling choice for enterprise reporting
• The main parts of the RS architecture
• The report-generation process and report lifecycle
• The steps for creating your first RS report
1.1 WHAT IS RS?
Regardless of the alphabet soup of terms and acronyms that are popping up like daisiesalmost every day and that have probably become a part of your IT vocabulary—termssuch as BI (business intelligence), OLAP (online analytical processing), data mining,DSSs (decision support systems), EISs (executive information systems), digital dash-boards, enterprise portals, and enterprise data buses—the purpose of enterprise report-ing is to simply “get out” what was “put in.” Therefore, for many applications,reporting represents the last, and often most important, stage of the IT pipeline.
To clarify the last point, let’s consider a typical scenario that RS can address effec-tively. Let’s say that an organization has built a web portal for submitting ordersonline. As the business grows, the same organization may need to implement a report-ing infrastructure to analyze sales data and understand its business, for example, tofind out the top-selling products, customer demographics, and so forth. To accom-plish this goal, the organization could leverage RS.
We use the term report to refer to the web-based or saved-to-file counterpart of astandard paper-oriented report. For example, an organization may want to give its cus-tomers an option to generate various reports online—an Order History report, forinstance. Web reporting has traditionally been difficult to implement. Even more dif-ficult has been exporting reports to different file formats. RS solve both problems ele-gantly, for two reasons. First, out-of-the-box RS is web-enabled. Second, most popularexport formats are natively supported.
1.1.1 Why do we need RS?
Ironically, despite the important role that reporting plays in today’s enterprise, creatingand distributing reports have been traditionally painstaking and laborious chores. Tounderstand why we need RS, let’s analyze the reporting problem space.
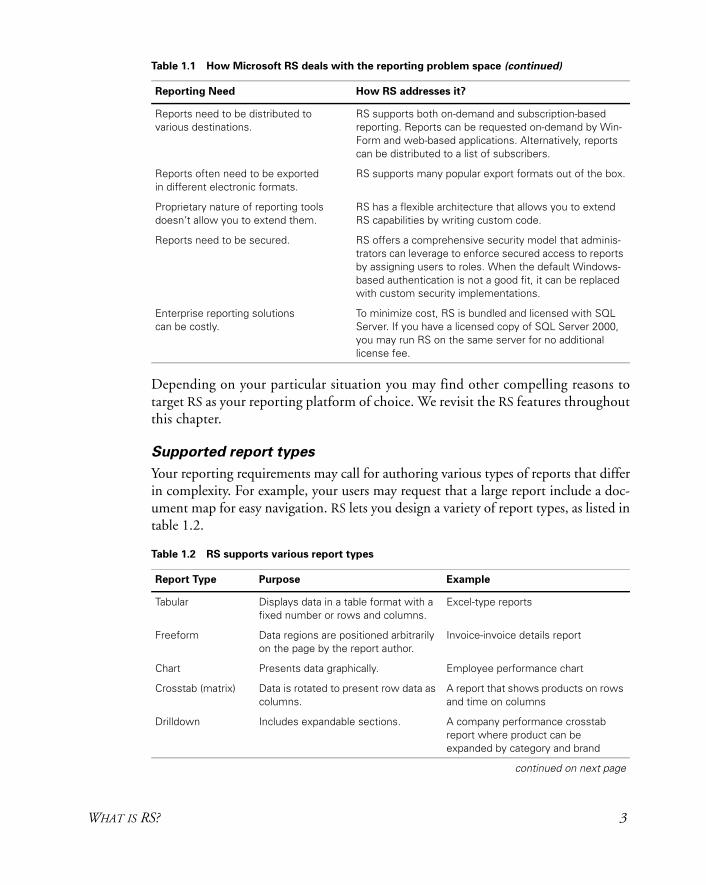
Table 1.1 lists some of the most pressing issues surrounding the reporting arenaand how RS addresses them.
Table 1.1 How Microsoft RS deals with the reporting problem space
Reporting Need How RS addresses it?
Report authoring can be labor intensive. By using the powerful Report Designer, you can author reports as easily as you can with Microsoft Access.
Centralized report management is needed.
RS enables you to save your reports in a single report repository.
continued on next page
WHAT IS RS? 3
Depending on your particular situation you may find other compelling reasons totarget RS as your reporting platform of choice. We revisit the RS features throughoutthis chapter.
Supported report types
Your reporting requirements may call for authoring various types of reports that differin complexity. For example, your users may request that a large report include a doc-ument map for easy navigation. RS lets you design a variety of report types, as listed intable 1.2.
Reports need to be distributed to various destinations.
RS supports both on-demand and subscription-based reporting. Reports can be requested on-demand by Win-Form and web-based applications. Alternatively, reports can be distributed to a list of subscribers.
Reports often need to be exported in different electronic formats.
RS supports many popular export formats out of the box.
Proprietary nature of reporting tools doesn’t allow you to extend them.
RS has a flexible architecture that allows you to extend RS capabilities by writing custom code.
Reports need to be secured. RS offers a comprehensive security model that adminis-trators can leverage to enforce secured access to reports by assigning users to roles. When the default Windows-based authentication is not a good fit, it can be replaced with custom security implementations.
Enterprise reporting solutions can be costly.
To minimize cost, RS is bundled and licensed with SQL Server. If you have a licensed copy of SQL Server 2000, you may run RS on the same server for no additional license fee.
Table 1.2 RS supports various report types
Report Type Purpose Example
Tabular Displays data in a table format with a fixed number or rows and columns.
Excel-type reports
Freeform Data regions are positioned arbitrarily on the page by the report author.
Invoice-invoice details report
Chart Presents data graphically. Employee performance chart
Crosstab (matrix) Data is rotated to present row data as columns.
A report that shows products on rows and time on columns
Drilldown Includes expandable sections. A company performance crosstab report where product can be expanded by category and brand
continued on next page
Table 1.1 How Microsoft RS deals with the reporting problem space (continued)
Reporting Need How RS addresses it?

4 CHAPTER 1 INTRODUCING MICROSOFT REPORTING SERVICES
Although most popular reporting tools support many of the report types shown intable 1.2, RS makes the report-authoring process as easy as working with MicrosoftAccess reporting functionality. For example, report authors can drag and drop items todefine the report’s appearance.
Now that we understand what RS is, let’s see how it fits in the Microsoft BI vision.
1.1.2 How is RS implemented?
Microsoft released version 1.0 of RS at the beginning of 2004 as an add-on toMicrosoft SQL Server 2000. At a very high level, RS can be defined as a server-basedplatform for authoring, managing, and distributing reports. We discuss the RS archi-tecture in more detail in a moment. For now, note that RS is integrated with andrequires several other Microsoft products, including:
• Windows 2000 or above as a server operating system
• Microsoft SQL Server 2000 (with Service Pack 3a) and above
• Internet Information Server (IIS) 5.0 or above
• .NET Framework 1.1
• Visual Studio .NET 2003 for report authoring and testing
For more information about installing RS, please refer to appendix A.
RS editions
To address different user needs, RS is available in several editions, as you can see bylooking at table 1.3.
Drillthrough Generated from clicking on a hyper-link.
Customer Order History with hyper-links on the order identifier to show the order details report
Interactive Includes interactive features, such as document maps, hyperlinks, visible-on-demand sections, and so forth.
Adobe Acrobat–type reports with doc-ument maps on the left side
Table 1.2 RS supports various report types (continued)
Report Type Purpose Example
Table 1.3 RS supports editions to meet various reporting needs
Edition Choose when…
Standard You need to install RS on a single computer. The Standard edition doesn’t support clustered deployment to load-balance multiple RS instances.
Enterprise You need all RS features, including load balancing.
Developer You have to integrate RS with client applications or extend its capabilities by writing .NET code. The Developer edition supports the same feature set as the Enterprise edition, but it is for use as a test and development system, not as a production server.
Evaluation You need to evaluate RS. The Evaluation edition expires after 120 days.

WHAT IS RS? 5
For more information about how the RS editions differ, refer to the product documen-tation or the “Reporting Services Features Comparison” section in the RS official web-site at http://microsoft.com/sql/reporting/productinfo/features.asp.
For information about RS licensing requirements, visit the “How to LicenseReporting Services” page at http://www.microsoft.com/sql/reporting/howtobuy/howtolicensers.asp.
1.1.3 RS and the Microsoft BI platform
RS is positioned as an integral part of Microsoft’s business intelligence (BI) platform.This platform is a multiproduct offering whose goal is to address the most commondata management and analysis challenges that many organizations face every day, suchas analyzing vast volumes of data, trend discovery, data management, and of course,comprehensive reporting.
During the RS official launch presentation on January 27, 2004, Paul Flessner,Microsoft senior vice president of Enterprise Services, outlined the place of RS in theMicrosoft BI platform offering, as shown in figure 1.1.
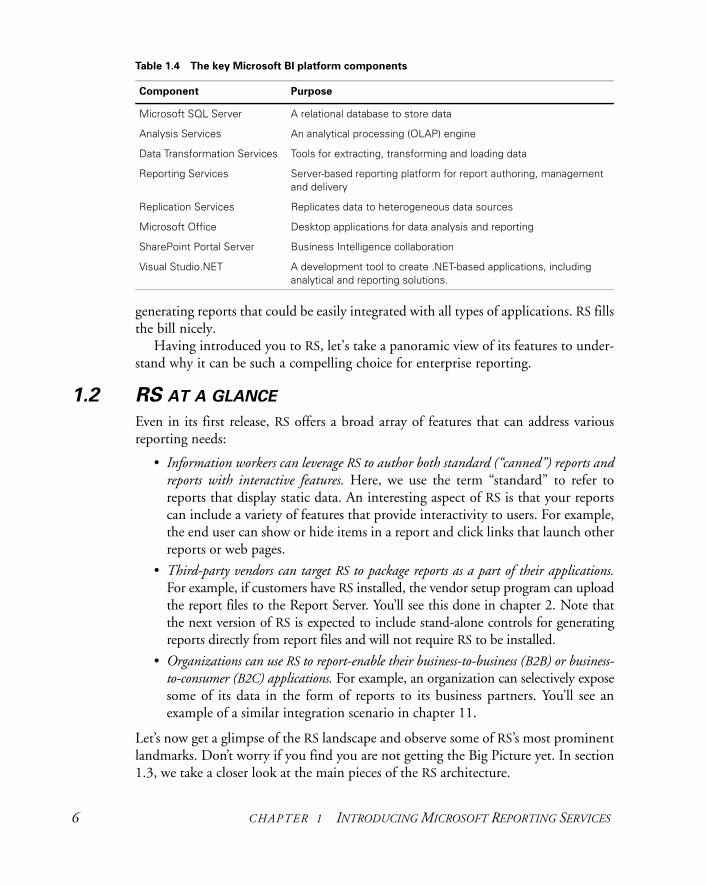
Table 1.4 outlines the purpose of the major building blocks within the MicrosoftBI platform.
Most of you have probably used more than one of these products in the past tosolve your data management and analysis needs. Indeed, most of them have beenaround for a while. What was missing was a product for authoring, managing, and
Figure 1.1 The Microsoft BI platform consists of several products layered on top
of the SQL Server database engine and addresses various data management and
reporting needs.
6 CHAPTER 1 INTRODUCING MICROSOFT REPORTING SERVICES
generating reports that could be easily integrated with all types of applications. RS fillsthe bill nicely.
Having introduced you to RS, let’s take a panoramic view of its features to under-stand why it can be such a compelling choice for enterprise reporting.
1.2 RS AT A GLANCE
Even in its first release, RS offers a broad array of features that can address variousreporting needs:
• Information workers can leverage RS to author both standard (“canned”) reports andreports with interactive features. Here, we use the term “standard” to refer toreports that display static data. An interesting aspect of RS is that your reportscan include a variety of features that provide interactivity to users. For example,the end user can show or hide items in a report and click links that launch otherreports or web pages.
• Third-party vendors can target RS to package reports as a part of their applications.For example, if customers have RS installed, the vendor setup program can uploadthe report files to the Report Server. You’ll see this done in chapter 2. Note thatthe next version of RS is expected to include stand-alone controls for generatingreports directly from report files and will not require RS to be installed.
• Organizations can use RS to report-enable their business-to-business (B2B) or business-to-consumer (B2C) applications. For example, an organization can selectively exposesome of its data in the form of reports to its business partners. You’ll see anexample of a similar integration scenario in chapter 11.
Let’s now get a glimpse of the RS landscape and observe some of RS’s most prominentlandmarks. Don’t worry if you find you are not getting the Big Picture yet. In section1.3, we take a closer look at the main pieces of the RS architecture.
Table 1.4 The key Microsoft BI platform components
Component Purpose
Microsoft SQL Server A relational database to store data
Analysis Services An analytical processing (OLAP) engine
Data Transformation Services Tools for extracting, transforming and loading data
Reporting Services Server-based reporting platform for report authoring, management and delivery
Replication Services Replicates data to heterogeneous data sources
Microsoft Office Desktop applications for data analysis and reporting
SharePoint Portal Server Business Intelligence collaboration
Visual Studio.NET A development tool to create .NET-based applications, including analytical and reporting solutions.

RS AT A GLANCE 7
1.2.1 Authoring features
As a report author, with RS you have several choices for creating reports. We discusseach of these options in detail in chapter 2. For now, we’d like to introduce you to theReport Designer; this will likely be the option that you will use most of the time forreport authoring.
Introducing the Report Designer
Using the Report Designer graphical environment, you can create reports of differenttypes, such as crosstab drilldown reports, like the one shown in figure 1.2.
RS doesn’t restrict your report-authoring options to static paper-oriented reports.Instead, you can make your reports more versatile and easy to use by adding interactivefeatures, such as expandable sections, hyperlinks, and document maps. Given its tightintegration with the Visual Studio. NET integrated development environment (IDE),the Report Designer provides you with access to all report design features as well asteam development features, such as source code management.
About the Report Definition Language
At this point, you may be wondering what an RS-based report file looks like and howit is stored. RS saves the report as an Extensible Markup Language (XML) file that isdescribed in a Report Definition Language schema.
Figure 1.2 With RS you can create various types of reports, including drilldown crosstab
reports like this one.

8 CHAPTER 1 INTRODUCING MICROSOFT REPORTING SERVICES
DEFINITION A report definition contains report data retrieval and layout information.The report definition is described in an XML schema, called the ReportDefinition Language (RDL).
Saving reports as XML-based report definition files offers two main advantages:
• It makes the report format open and extensible. Using the XML-based RDL formatis beneficial for achieving interoperability among applications and vendors.Microsoft is working with other industry leaders to promote RDL as an XML-based standard for report definitions. Visit the RS official website (check theResources section for the link) for a list of Microsoft RS partners.
• It makes the report portable. For example, you can easily save the report to a fileand upload it to another Report Server. In chapter 2 you’ll see how a third-partyreporting tool leverages this feature for ad-hoc reporting.
If you use the Report Designer to create your report, its definition will be automat-ically generated for you. However, just as you don’t have to use Visual Studio .NETto write .NET applications, you can write the report definition using an editor ofyour choice, such as Notepad, or generate it programmatically (as you will see inchapter 2). Of course, the Report Designer makes authoring reports a whole lot eas-ier. Third-party tools will most likely emerge at some point to provide alternativeRDL editors.
1.2.2 Management features
RS facilitates report management by storing reports and their related items in a centralreport catalog. To deploy and manage a report, you need to upload it to the report cat-alog. When this happens, it becomes a managed report.
DEFINITIONS Throughout the rest of this book we will use the terms report catalog andreport repository interchangeably to refer to the RS Configuration Database.For more information about this database, refer to section 1.3.2.
A managed report is a report that is uploaded to the report catalog.
For .NET developers, the term “managed” has nothing to do with .NET managedcode, although the pattern is the same. While .NET managed code runs under thesupervision of the .NET Common Language Runtime (CLR), a managed report is gen-erated under the control of the Report Server.
You may wonder what really happens when a report is uploaded to the report cat-alog. At publishing time, the Report Server parses the report definition (RDL), gen-erates a .NET assembly, and stores the assembly in the Report Configuration Databasefor the report. The RDL file is never used again. When the report is processed, theassembly is loaded and executed by the Report Server.
A report can include other items, such as images and data source–related informa-tion. These report-related items are also stored in the report catalog. Finally, the reportcatalog captures additional information, called metadata, associated with reports. For

RS AT A GLANCE 9
example, just as you can organize physical files in folders, RS allows you to organizereports in folders.
DEFINITION The report metadata describes additional configuration information associat-ed with a report, such as security permissions, the parent folder, and so forth.
RS offers centralized report management that administrators will appreciate. To sim-plify the administration of the report catalog, RS comes with a tool called the ReportManager. The Report Manager is implemented as a web-based application, and assuch it is easily accessible. This tool empowers you to manage just about any aspect ofthe report repository, including
• Report information and metadata, such as the folder structure and report properties
• Data sources from which the report will draw data
• Report parameters (for parameterized reports)
• Security
1.2.3 Delivery features
Reports hosted under RS can be delivered using on-demand (“pulled”) delivery or sub-scribed (“pushed”) delivery. The more common scenario is on-demand delivery, wherethe user requests the report explicitly. As a report author, you don’t have to do anythingspecial to web-enable your report because RS does this for you once it is uploaded tothe report catalog.
The “pushed” delivery option alone can justify implementing RS. This option givesend users the ability to subscribe to reports, so reports will be sent to them when a cer-tain event is triggered—when a timing event triggers, for instance, for report subscrip-tions based on a schedule. As another example, a financial institution could allow itscustomers to opt in and subscribe to certain reports of interest, such as a monthly bankstatement. Then, at the end of the month, the bank statement report could be gener-ated and sent to users via e-mail.
We’ll discuss the report-delivery process in more detail in section 1.5.
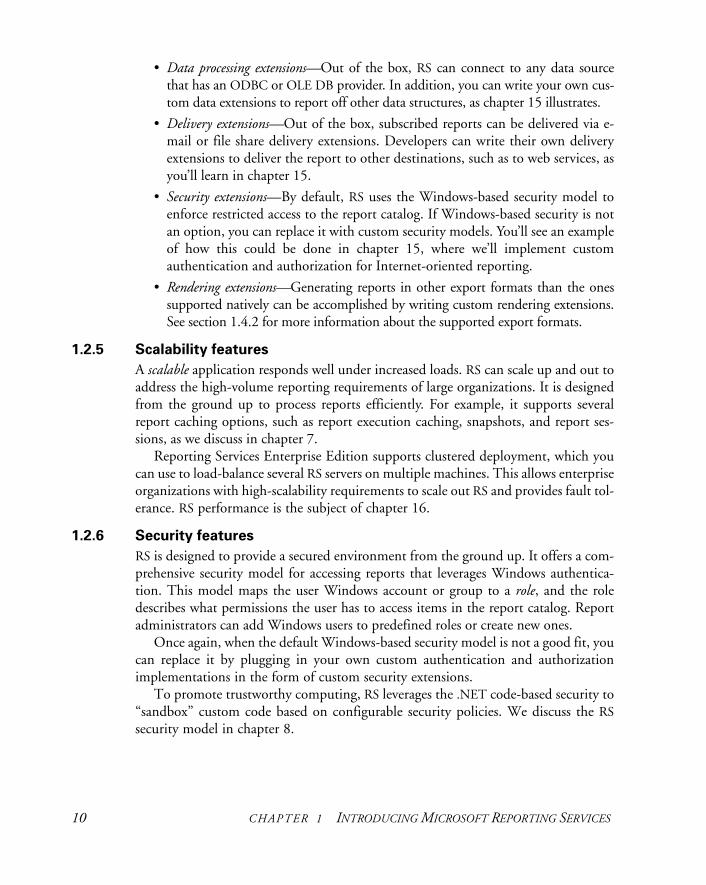
1.2.4 Extensibility features
An important characteristic of every enterprise-oriented product, such as RS, is that ithas to be easily extendable. Simply put, extensibility relates to the system’s ability toaccommodate new features that are built out of old ones. One of the things I like mostabout RS is the extensibility features it includes by virtue of its open and flexible archi-tecture. Developers can easily extend RS by writing .NET code in their preferred .NETlanguage. Specifically, you can extend RS in the following areas:
• Custom .NET code—.NET developers can enhance reports programmaticallyby writing .NET custom code. Chapter 6 demonstrates how you can add fore-casting features to your reports by using prepackaged code in the form of.NET assemblies.
10 CHAPTER 1 INTRODUCING MICROSOFT REPORTING SERVICES
• Data processing extensions—Out of the box, RS can connect to any data sourcethat has an ODBC or OLE DB provider. In addition, you can write your own cus-tom data extensions to report off other data structures, as chapter 15 illustrates.
• Delivery extensions—Out of the box, subscribed reports can be delivered via e-mail or file share delivery extensions. Developers can write their own deliveryextensions to deliver the report to other destinations, such as to web services, asyou’ll learn in chapter 15.
• Security extensions—By default, RS uses the Windows-based security model toenforce restricted access to the report catalog. If Windows-based security is notan option, you can replace it with custom security models. You’ll see an exampleof how this could be done in chapter 15, where we’ll implement customauthentication and authorization for Internet-oriented reporting.
• Rendering extensions—Generating reports in other export formats than the onessupported natively can be accomplished by writing custom rendering extensions.See section 1.4.2 for more information about the supported export formats.
1.2.5 Scalability features
A scalable application responds well under increased loads. RS can scale up and out toaddress the high-volume reporting requirements of large organizations. It is designedfrom the ground up to process reports efficiently. For example, it supports severalreport caching options, such as report execution caching, snapshots, and report ses-sions, as we discuss in chapter 7.
Reporting Services Enterprise Edition supports clustered deployment, which youcan use to load-balance several RS servers on multiple machines. This allows enterpriseorganizations with high-scalability requirements to scale out RS and provides fault tol-erance. RS performance is the subject of chapter 16.
1.2.6 Security features
RS is designed to provide a secured environment from the ground up. It offers a com-prehensive security model for accessing reports that leverages Windows authentica-tion. This model maps the user Windows account or group to a role, and the roledescribes what permissions the user has to access items in the report catalog. Reportadministrators can add Windows users to predefined roles or create new ones.
Once again, when the default Windows-based security model is not a good fit, youcan replace it by plugging in your own custom authentication and authorizationimplementations in the form of custom security extensions.
To promote trustworthy computing, RS leverages the .NET code-based security to“sandbox” custom code based on configurable security policies. We discuss the RSsecurity model in chapter 8.
RS ARCHITECTURE 11
1.2.7 Deployment features
Because it is server-based, RS has zero deployment requirements for integrating withclient applications. For this reason, any type of client applications can target RS, notonly .NET-based applications. Because you can access RS through the two most pop-ular web protocols, HTTP-GET and Simple Object Access Protocol (SOAP), any web-capable application can be integrated with RS, regardless of the targeted platform anddevelopment language.
DEFINITIONS The Hypertext Transfer Protocol (HTTP), on which the Internet is based,comes in two flavors: HTTP-GET and HTTP-POST. While HTTP-GET pass-es request parameters as a part of the URL, HTTP-POST passes them asname/value pairs inside the actual message.
Simple Object Access Protocol (SOAP) is a lightweight XML-based proto-col, layered on top of HTTP, for exchanging structured and type informa-tion on the Web. In recent years, SOAP has become the industry-standardprotocol for communicating with web services.
Integrating your applications with RS requires a good grasp of its architecture. Thenext section outlines the major RS building blocks.
1.3 RS ARCHITECTURE
An important feature of the RS architecture is that it is service-oriented as opposed to object-oriented. Don Box, a Microsoft prominent architect working on the next-generation webservices, outlines the following four characteristics of a service-oriented architecture:
• Boundaries are explicit. Cross-application communication uses explicit messag-ing rather than implicit method call invocation.
• Services are autonomous. The lifetime of a service-oriented application is notcontrolled by its clients.
• Services share schema and contract, not class. Service-oriented applications adver-tise their functionality to the outside world using XML-based schemas.
• Service compatibility is determined based on policies. By using policies, service-oriented applications indicate which conditions must be true in order for theservice to function properly.
You may have used object-oriented reporting tools in the past in which the report con-sumer instantiates an object instance of the report provider. A characteristic of thismodel is that both the report consumer and the report provider instances share thesame process space. For example, to render a Microsoft Access report, you need toinstantiate an object of type Access.Application. Then, you use OLE automa-tion to instruct Access to open the report database and render the report.
12 CHAPTER 1 INTRODUCING MICROSOFT REPORTING SERVICES
You will probably agree that as useful and widespread as the object-oriented modelis, it is subject to some well-known shortcomings. For example, both the consumerand provider are usually installed on the same machine. As a consequence, the reportshosted by the report provider are not easily accessible by geographically dispersed cli-ents. For instance, only COM-capable clients can interface with Microsoft Access.
A second shortcoming involves application interdependencies. Object-orientedapplications are typically deployed as a unit. All Microsoft Access clients, for example,need to have the Access type library installed locally in order to establish a reference to it.
To address these shortcomings, RS departs radically from the object-oriented par-adigm. In terms of reporting, the RS service-oriented architecture offers two distinctadvantages: (1) Administrators can centralize the report storage and management inone place, and (2) it promotes application interoperability—report consumers canrequest reports over standard web protocols, such as HTTP-GET and SOAP.
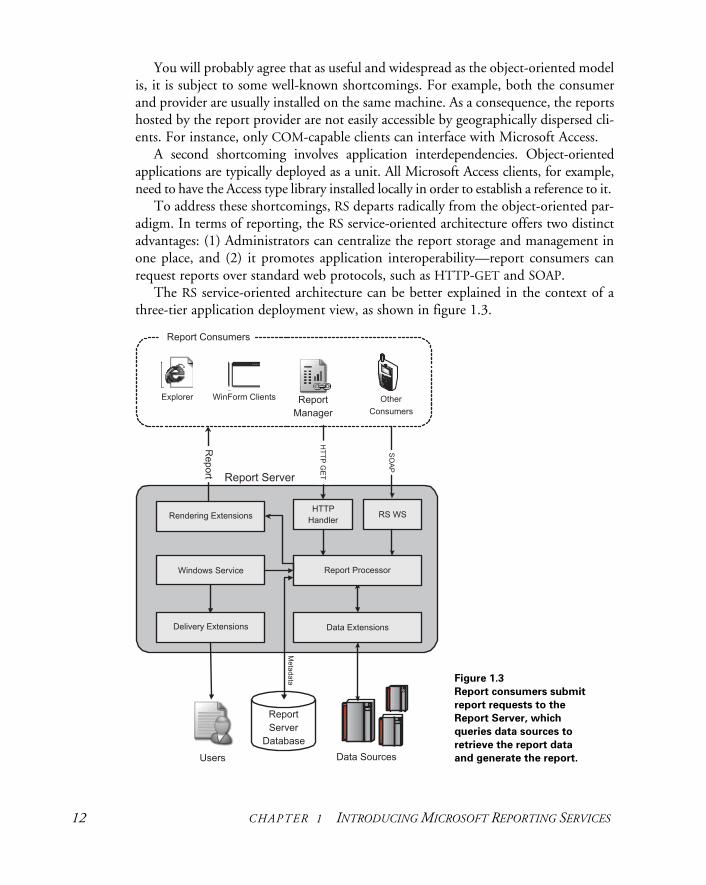
The RS service-oriented architecture can be better explained in the context of athree-tier application deployment view, as shown in figure 1.3.
Figure 1.3
Report consumers submit
report requests to the
Report Server, which
queries data sources to
retrieve the report data
and generate the report.
RS ARCHITECTURE 13
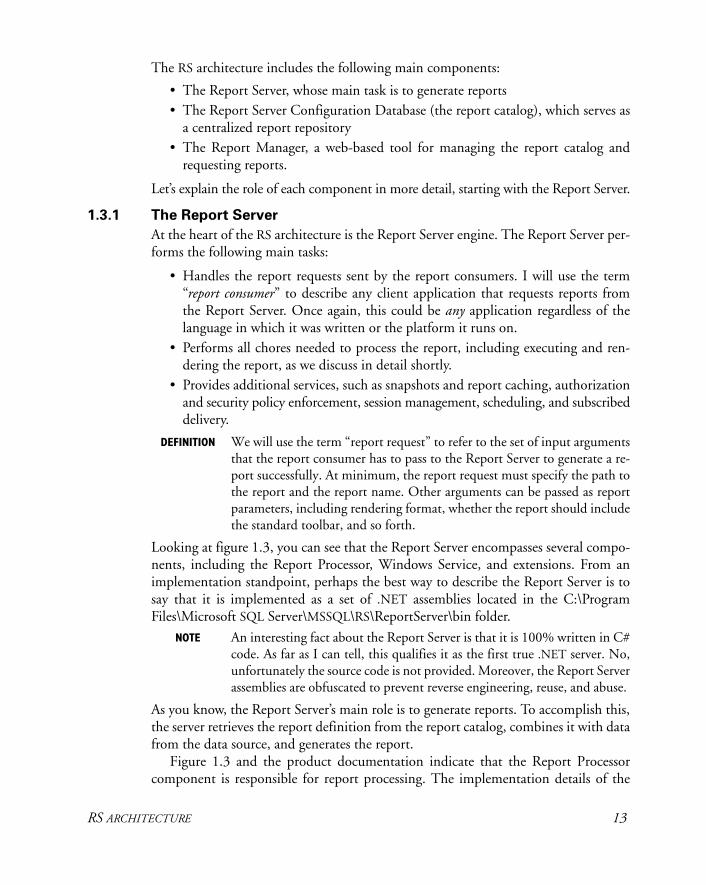
The RS architecture includes the following main components:
• The Report Server, whose main task is to generate reports • The Report Server Configuration Database (the report catalog), which serves as
a centralized report repository• The Report Manager, a web-based tool for managing the report catalog and
requesting reports.
Let’s explain the role of each component in more detail, starting with the Report Server.
1.3.1 The Report Server
At the heart of the RS architecture is the Report Server engine. The Report Server per-forms the following main tasks:
• Handles the report requests sent by the report consumers. I will use the term“report consumer” to describe any client application that requests reports fromthe Report Server. Once again, this could be any application regardless of thelanguage in which it was written or the platform it runs on.
• Performs all chores needed to process the report, including executing and ren-dering the report, as we discuss in detail shortly.
• Provides additional services, such as snapshots and report caching, authorizationand security policy enforcement, session management, scheduling, and subscribeddelivery.
DEFINITION We will use the term “report request” to refer to the set of input argumentsthat the report consumer has to pass to the Report Server to generate a re-port successfully. At minimum, the report request must specify the path tothe report and the report name. Other arguments can be passed as reportparameters, including rendering format, whether the report should includethe standard toolbar, and so forth.
Looking at figure 1.3, you can see that the Report Server encompasses several compo-nents, including the Report Processor, Windows Service, and extensions. From animplementation standpoint, perhaps the best way to describe the Report Server is tosay that it is implemented as a set of .NET assemblies located in the C:\ProgramFiles\Microsoft SQL Server\MSSQL\RS\ReportServer\bin folder.
NOTE An interesting fact about the Report Server is that it is 100% written in C#code. As far as I can tell, this qualifies it as the first true .NET server. No,unfortunately the source code is not provided. Moreover, the Report Serverassemblies are obfuscated to prevent reverse engineering, reuse, and abuse.
As you know, the Report Server’s main role is to generate reports. To accomplish this,the server retrieves the report definition from the report catalog, combines it with datafrom the data source, and generates the report.
Figure 1.3 and the product documentation indicate that the Report Processorcomponent is responsible for report processing. The implementation details of the
14 CHAPTER 1 INTRODUCING MICROSOFT REPORTING SERVICES
processor are not disclosed at the time of this writing, but most likely the majority ofits functionality is encapsulated in the Microsoft.ReportingServices.Processing.dllassembly. For the remainder of this book we use the terms Report Processor and ReportServer interchangeably.
Section 1.4 explains the purpose of each of the Report Server components andshows how they relate to report processing.
From an integration standpoint, perhaps the most important observation that youneed to draw from figure 1.3 is that the Report Server has two web-based communi-cation façades that expose its functionality to external clients: HTTP Handler, whichaccepts URL-based report requests submitted via HTTP-GET, and the Web service(shown in figure 1.3 as RS WS), which handles SOAP requests. You will see how thesefaçades impact the report-delivery process in section 1.5.
1.3.2 The Report Server database
When you install RS, the setup program creates the Report Server database. This data-base is implemented as two physical SQL Server 2000 databases: The Reporting Ser-vices Configuration Database, ReportServer, hosts the report catalog and metadata. Inthis section, we’ll take a closer look at each.
The Reporting Services Configuration Database
The Reporting Services Configuration Database, ReportServer, hosts the report cata-log and metadata. As we mentioned earlier, in order for a report to be available to theend users, its report definition file must be uploaded (published) to the catalog.
If you open this database in the SQL Server Enterprise Manager, you will be ableto deduce the purpose of most of its tables. For example, the Report Server Configu-ration Database keeps the catalog items in the Catalog table, the data source informa-tion in the Data-Source table, and so forth. Note that querying the report catalogdirectly is discouraged by Microsoft. Instead, the recommended way to access thereport catalog is through the Report Server APIs. Microsoft also discourages you frommaking data changes directly to the catalog. The reason behind this is that Microsoftmay change the catalog schema in the future but will maintain backward compatibilitythrough the Report Server API.
As you may recall, RS can be deployed in a load-balanced cluster environment. In thisdeployment model, the Report Server database is shared among all nodes of the cluster.
The Reporting Services Temporary Database
The RS setup program also creates a second database, ReportServerTempDB, which isused by RS for caching purposes. For example, once the report is executed, the ReportServer saves a copy of the report in the ReportServerTempDB database.
DEFINITION Report caching describes the Report Server feature of keeping the report in-termediate format in the Report Server database for a certain duration.
We’ll return to the topic of report caching in chapter 7.

RS ARCHITECTURE 15
The Adventure Works 2000 sample database
Finally, if you install the RS samples, the setup program installs a sample databasecalled AdventureWorks2000. This database is also used by other Microsoft products,such as Commerce Server and Notification Services.
The AdventureWorks2000 database includes a much more “realistic” sales order-ing database model than the SQL Server sample databases, Northwind or Pubs. Youwill quickly realize this by surveying the data held in the more than 60 tables. We’llwork with this sample database in section 1.7, where you’ll have a chance to create areport using RS.
1.3.3 The Report Manager
Implemented as an ASP.NET web application, the Report Manager performs two maintasks: report management and requests for reports. You can think of the Report Man-ager as an application façade that communicates with the Report Server via the ReportServer APIs. From the Report Server perspective, the Report Manager is no differentthan any other client application.
Report management
Users familiar with SharePoint Portal Server will find the Report Manager similar tothis product both in terms of user interface and purpose. As you can with SharePoint,you can use the Report Manager to create folders, upload resources, manage subscrip-tions, and set up security.
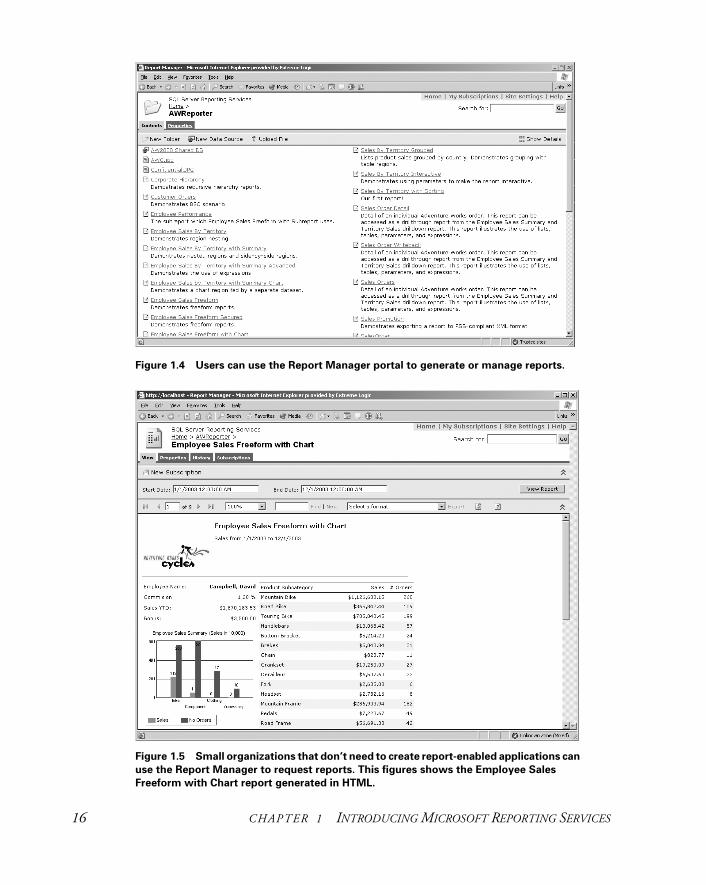
For example, figure 1.4 shows that I used the Report Manager to navigate to afolder AWReporter and to retrieve a list of the catalog items under this folder. You canclick on a report link to run a report or access and change the report properties.
In case you’re wondering where the items shown in figure 1.4 come from, we willcreate them in the next few chapters when we discuss the report-authoring process.
Keep in mind that in RS you work with virtual folders. Neither the folders nor thereport definition files actually exist in a file system. Instead, they exist in the ReportServer Database as metadata, but they appear as folders and items when you access theReport Server through the Report Manager.
Requesting reports
Sometimes, building a reporting application might be overkill. Or small companiesmight not have the IT resources to do so quickly or simply cannot afford the effort. Insuch cases, the Report Manager can be used as a reporting tool. Users can navigate tothe Report Manager portal and request reports on the spot, as figure 1.5 shows.
Even better, users can use the handy toolbar, which the Report Server generatesautomatically, to perform various report-related tasks, including specifying parametervalues for reports that take parameters (more on this in chapter 3), paging, zooming,and exporting the report to different formats.
16 CHAPTER 1 INTRODUCING MICROSOFT REPORTING SERVICES
Figure 1.4 Users can use the Report Manager portal to generate or manage reports.
Figure 1.5 Small organizations that don’t need to create report-enabled applications can
use the Report Manager to request reports. This figures shows the Employee Sales
Freeform with Chart report generated in HTML.

UNDERSTANDING REPORT PROCESSING 17
Now that we’ve had a 100-foot view tour of the major building blocks of RS, let’s peekunder its hood to see how it processes, renders, and delivers reports.
1.4 UNDERSTANDING REPORT PROCESSING
Report processing encompasses all activities performed by the Report Server to gener-ate a report. To understand how the Report Server processes a report, let’s see whathappens when the report is requested on demand.
Figure 1.6 depicts what happens when a report hosted under the Report Server isrequested by a report consumer. First, the consumer submits (1) a report request tothe Report Server.
Once the report request is intercepted by the Report Server, it is forwarded (2) tothe Report Processor. The Report Processor parses the request and retrieves (3) thereport definition and metadata from the Report Server Database. The Report Proces-sor checks whether the user is authorized to access this report. If so, the Report Pro-cessor processes the report, which involves two stages: execution and rendering.
Let’s get more insight into each of these stages, starting with the execution stage.
Figure 1.6
You can integrate your
applications with RS by
using the two web
communication façades:
HTTP Handler and the RS
Web service.
18 CHAPTER 1 INTRODUCING MICROSOFT REPORTING SERVICES
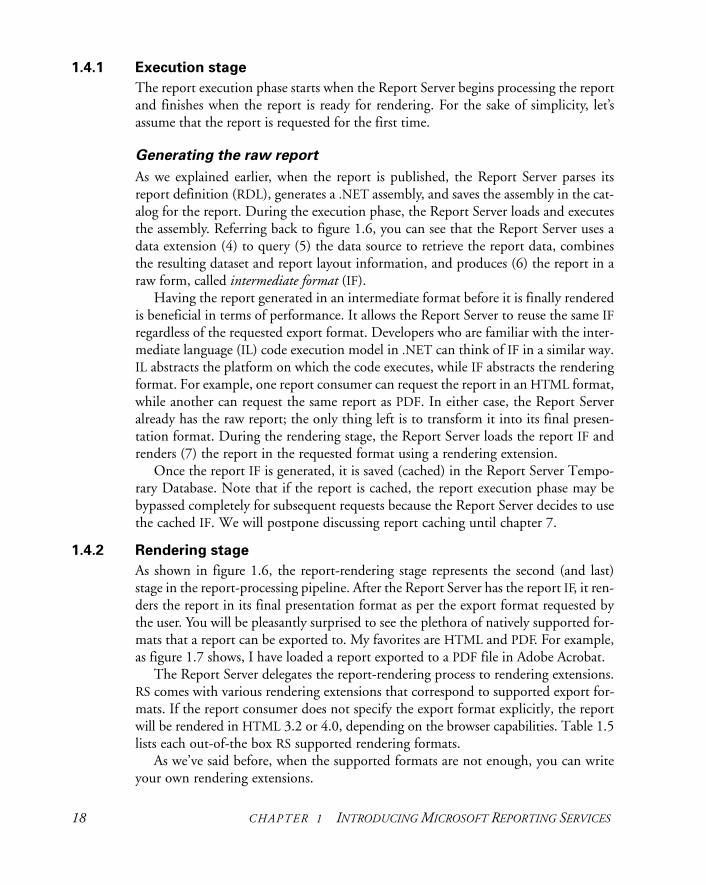
1.4.1 Execution stage
The report execution phase starts when the Report Server begins processing the reportand finishes when the report is ready for rendering. For the sake of simplicity, let’sassume that the report is requested for the first time.
Generating the raw report
As we explained earlier, when the report is published, the Report Server parses itsreport definition (RDL), generates a .NET assembly, and saves the assembly in the cat-alog for the report. During the execution phase, the Report Server loads and executesthe assembly. Referring back to figure 1.6, you can see that the Report Server uses adata extension (4) to query (5) the data source to retrieve the report data, combinesthe resulting dataset and report layout information, and produces (6) the report in araw form, called intermediate format (IF).
Having the report generated in an intermediate format before it is finally renderedis beneficial in terms of performance. It allows the Report Server to reuse the same IFregardless of the requested export format. Developers who are familiar with the inter-mediate language (IL) code execution model in .NET can think of IF in a similar way.IL abstracts the platform on which the code executes, while IF abstracts the renderingformat. For example, one report consumer can request the report in an HTML format,while another can request the same report as PDF. In either case, the Report Serveralready has the raw report; the only thing left is to transform it into its final presen-tation format. During the rendering stage, the Report Server loads the report IF andrenders (7) the report in the requested format using a rendering extension.
Once the report IF is generated, it is saved (cached) in the Report Server Tempo-rary Database. Note that if the report is cached, the report execution phase may bebypassed completely for subsequent requests because the Report Server decides to usethe cached IF. We will postpone discussing report caching until chapter 7.
1.4.2 Rendering stage
As shown in figure 1.6, the report-rendering stage represents the second (and last)stage in the report-processing pipeline. After the Report Server has the report IF, it ren-ders the report in its final presentation format as per the export format requested bythe user. You will be pleasantly surprised to see the plethora of natively supported for-mats that a report can be exported to. My favorites are HTML and PDF. For example,as figure 1.7 shows, I have loaded a report exported to a PDF file in Adobe Acrobat.
The Report Server delegates the report-rendering process to rendering extensions.RS comes with various rendering extensions that correspond to supported export for-mats. If the report consumer does not specify the export format explicitly, the reportwill be rendered in HTML 3.2 or 4.0, depending on the browser capabilities. Table 1.5lists each out-of-the box RS supported rendering formats.
As we’ve said before, when the supported formats are not enough, you can writeyour own rendering extensions.

UNDERSTANDING REPORT PROCESSING 19
Table 1.5 Report rendering options
Rendering Extension Description
HTML HTML 4.0 (Internet Explorer 5.0 and above), Netscape (6.2 and above), HTML 3.2 otherwise.
HTML with Office Web Components HTML 4.0 with Office Web Components (OWC). Charts are rendered using the OWC chart control and matrixes are ren-dered using the PivotTable OWC.
MHTML MIME encapsulation of the Aggregate HTML Documents standard, which embeds resources such as images, docu-ments, or other binary files as MIME structures within the report. This is a good option to minimize the number of round trips between the browser and server to fetch resources. MHTML is most useful for sending reports through e-mail, as we see in chapter 14.
PDF Adobe Acrobat files.
Excel Creates a visual representation of the report in an Excel work-book and translates Excel formulas whenever possible. Users can open the report in Excel to change it.
continued on next page
Figure 1.7 With RS you can export your reports to many formats, including Adobe Acrobat
PDF. Here, I have exported this report to Adobe PDF and loaded it in Adobe Reader.

20 CHAPTER 1 INTRODUCING MICROSOFT REPORTING SERVICES
Once the report is generated it is ready to travel to its final destination: the report user.RS gives you a lot of flexibility to distribute your reports, as you’ll see in the next section.
1.5 DELIVERING REPORTS
As we mentioned earlier, RS supports both on-demand (pull) and subscribed (push)report delivery. To view a report on demand, the user explicitly requests the reportfrom the Report Server. Alternatively, the user can choose to subscribe to a report.With this option, the report is pushed to the subscribers when the report data isrefreshed or on a specified schedule.
Let’s take a closer look at each delivery option.
1.5.1 On-demand delivery
One of the most important decisions you have to make when integrating RS reportsin your application is how the application will access the Report Server to requestreports. While in some cases the system design may dictate the integration option,occasionally the choice won’t be so straightforward and you may have to carefully eval-uate the application requirements to determine the best approach. We revisit the on-demand delivery options in more detail in chapter 9. For now, note that reports canbe requested on-demand in two ways: URL access and the Web service.
URL-based report access
The report consumer requests a report by URL by submitting an HTTP-GET request tothe Report Server. The advantages of URL access are its simplicity and better perfor-mance. In the simplest case, the consumer can embed the report URL into a hyperlink.
For example, a web-based application can have a drop-down Reports menu whereeach link targets a RS report. With the URL access option, the report arguments are
XML Creates an XML document containing the information in the report. The schema of the XML document generated is determined by the contents and layout of the report. Users can use the Data Output tab in the Report Designer to control how the elements will be rendered.
CSV Comma-separated value file, with no formatting.
Image Renders reports to bitmaps or metafiles, including any format that GDI+ supports: BMP, EMF, GIF, JPEG, PNG, RIFF, and WMF. By default, the image is rendered in TIFF, which can be dis-played with an image viewer. Image rendering ensures the report looks the same on every client. Rendering occurs on the server; all fonts used in the report must be installed on the server.
Table 1.5 Report rendering options (continued)
Rendering Extension Description
DELIVERING REPORTS 21
passed as query parameters in the report URL. For example, assuming that you haveinstalled the sample reports included with book source code, the following URL willrun the Territory Sales Crosstab sample report with the start date 3/1/2003 and an enddate of 4/30/2003.
http://localhost/ReportServer?/AWReporter/Territory Sales Crosstab&Start-Date=3/1/2003&EndDate=4/30/2004
Web service
With RS, reports can also be requested by submitting SOAP-based requests to theReport Server Web service. The main advantage of this service is that its feature setgoes well beyond just report rendering. It also encompasses an extensive set of methodsto manage all aspects of the Report Server, such as uploading reports, retrieving a listof resources from the report catalog, and securing RS.
You can think of the Report Server Web service as a façade to the Report Serverthat allows RS to be integrated with a broad array of platforms. For example, if youare building an enterprise application integration (EAI) solution, a BizTalk schedulemight invoke the Web service Render() method, get the XML representation of thereport, retrieve some data from it, and pass it on to another application. Or, if yourreporting application is B2B oriented and your partner has a Web service, you can sendthe report results to it in XML.
In some cases, a report consumer will use a combination of both access options tointegrate with RS. For example, a report consumer can use the RS Web service to findout what parameters a report takes. Then, the application presentation layer canpresent the parameters to the user so that the user can enter the parameter values.When the user submits the report request, the application can use URL access to sendthe request to the Report Server.
1.5.2 Subscribed delivery
In the “push” report delivery scenario, the reports are generated and delivered auto-matically by the Report Server to a delivery target. Reports can also be delivered ata scheduled time. For example, a financial institution can set up a portfolio balancereport to be generated and delivered through e-mail to its customers at the end ofeach month.
The Report Server Windows service (ReportingServicesService.exe) works in tan-dem with the SQL Server Agent service to generate and deliver subscribed reports.
NOTE SQL Server Agent is a component of Microsoft SQL Server, and it is respon-sible for running scheduled SQL Server tasks.
For example, if the report is to be generated according to a set schedule, the SQLServer Agent will create a job and move the subscription to the Subscriptions tablewhen the time is up. The RS Windows service periodically polls the Report Config-uration Database to find out whether there are any new subscription jobs. If this is

22 CHAPTER 1 INTRODUCING MICROSOFT REPORTING SERVICES
the case, the Windows service picks up the job, generates the report, and delivers it tothe end users through a delivery extension.
Out of the box, RS comes with two delivery extensions: the e-mail delivery exten-sion and the file share delivery extension. The e-mail delivery extension delivers thereport via e-mail. The report can be delivered to either subscribed users (opt-in sub-scription) or to a data-driven list of recipients. The file share extension delivers reportsto a network share. When these two options are not enough, you can write customdelivery extensions.
Note that the Report Server Windows service doesn’t communicate with theReport Server through the HTTP Handler or Web service façades. Instead, because itis installed on the same machine as the Report Server, the Windows service directlyloads and calls the Report Server assemblies. This is beneficial for two reasons. Thefirst relates to availability. Even if the IIS server is down, the Windows service will stillexecute scheduled tasks and deliver reports to subscribers. The other reason is betterperformance—the web façades are completely bypassed.
Another task that the Report Services Windows service is responsible for is per-forming background database integrity checks, as well as other administrative tasks.
Before we see RS in action, it may be beneficial to get a good high-level under-standing of the report lifecycle. This is important because the remaining chapters ofthis book follow an identical flow.
1.6 WHAT IS THE REPORT LIFECYCLE?By now, you probably realize that the Report Server is a sophisticated reporting plat-form with a feature set that goes well beyond a desktop reporting tool. To minimizethe learning curve, this book follows a logical path based on the report lifecycle. Thereport lifecycle is the process that you typically follow to work with reports, and itinvolves three stages: authoring, management, and delivery. Figure 1.8 depicts thereport lifecycle stages.
In the report-authoring stage, you create the RDL file through the use of report-authoring tools. For example, you can use the Visual Studio .NET Report Designerto lay out the report. Recall that both report data retrieval and layout information aredescribed in the RDL file. We’ll discuss many more details of the report authoringstage in chapters 2–6.
In the report-management stage, you manage the report catalog. As you recall, thereport catalog is stored in the Reporting Services Configuration Database. The reportcatalog keeps the report and all related items. Typical management tasks include orga-nizing reports in folders, uploading reports, and granting users access to run reports.We’ll take a closer look at report management in chapters 7 and 8.
The report-delivery stage is concerned with distributing the reports to their finaldestinations, including end users, printers, or archive folders. A managed report canbe delivered either on-demand or pushed to the subscribed users. Report delivery isdiscussed in detail in chapters 9–14.

RS IN ACTION 23
Enough theory! Let’s put in practice what we learned so far and get our hands on RS.
1.7 RS IN ACTION
This section has two main objectives. First, we introduce an imaginary company,Adventure Works Cycles (AWC), which we reference throughout the rest of this book.We will discuss various hypothetical reporting challenges that AWC faces and imple-ment solutions to address them.
Second, we get our feet wet and create our first report using the Visual Studio .NETReport Wizard and the AdventureWorks2000 sample database. Granted, this is goingto be a simple tabular-style report, but as simple as it is, it showcases all the phases ofthe report lifecycle. We also use this report in the next three chapters as a practicalexample to expand our knowledge about RS.
1.7.1 About the Adventure Works Reporter
Let’s start with a hypothetical problem statement. You are a developer with AWC, whichmanufactures and sells goods to individuals and retailers. The company has enjoyed tre-mendous success the last few years. Sales are going up exponentially and the customerbase is growing fast. Today, AWC has customers both in the United States and overseas.It has already implemented a web-based ordering online transaction processing (OLTP)system to capture sales orders online.
Figure 1.8
Report lifecycle phases include
report authoring, management,
and delivery. In the report-
authoring stage, you lay out the
report. In the report-management
stage, you deploy and manage the
report. Finally, RS gives you many
ways to distribute your reports to
their final destination.
24 CHAPTER 1 INTRODUCING MICROSOFT REPORTING SERVICES
However, success does not come cheap. Data inaccuracy and slow decision makingare among the top complaints by the sales managers. Often, data is captured and con-solidated in the form of Excel spreadsheets. What is needed is a reporting system topresent the company with data in a format that’s both easy to understand and analyzeand to allow AWC’s management to discover trends and see how the company is per-forming. You have been designated as a lead developer for the new Adventure Works(AW) Reporter system. Fascinated by Microsoft SQL Server 2000 RS, you decide tobase your reporting system on it.
NOTE In the real world, you should abstain from reporting off an OLTP data-base for performance reasons. As the name suggests, OLTP systems mustscale to meet large transaction volumes and handle hundreds and eventhousands of users. Reporting applications usually submit queries to re-trieve and analyze substantial sets of data, which impose data locks onmany records in the database. This can severely tax your OLTP systemperformance. For this reason, reporting and OLTP are usually two mutu-ally exclusive options. A typical solution involves consolidating OLTPdata and then uploading it to a data warehouse database that is optimizedand designated for reporting purposes only. We discuss OLAP and datawarehousing in detail in chapter 12.
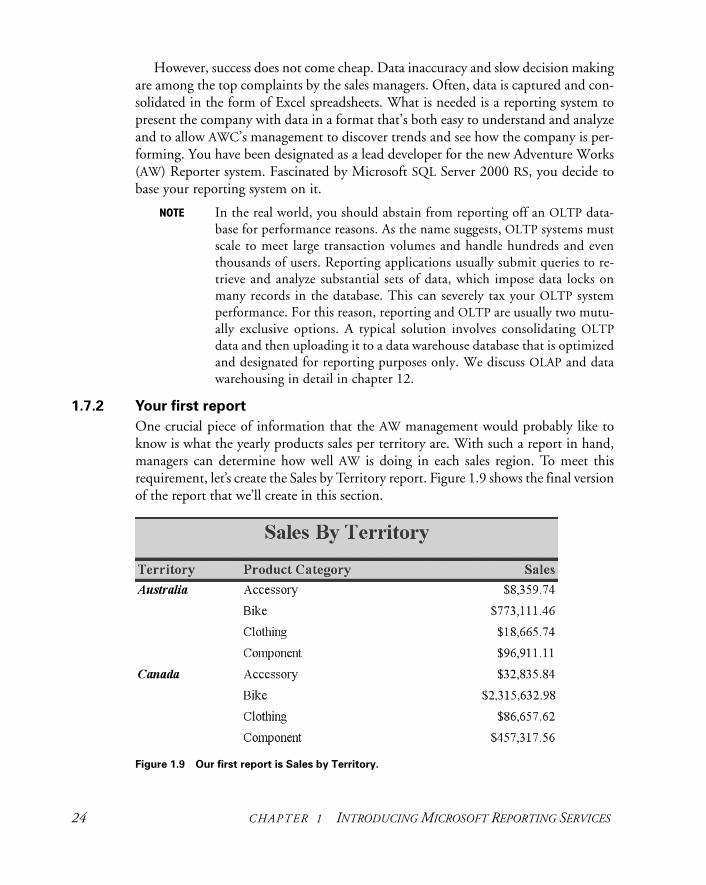
1.7.2 Your first report
One crucial piece of information that the AW management would probably like toknow is what the yearly products sales per territory are. With such a report in hand,managers can determine how well AW is doing in each sales region. To meet thisrequirement, let’s create the Sales by Territory report. Figure 1.9 shows the final versionof the report that we’ll create in this section.
Figure 1.9 Our first report is Sales by Territory.

RS IN ACTION 25
This is just one of the many sample reports we’ll design throughout the course of thisbook. We’ll use the Sales by Territory report in subsequent chapters to demonstrateother RS features.
Table 1.6 shows the list of tasks that we need to accomplish to create the reportorganized by the report lifecycle phases.
As you’ll recall, the first phase of the report lifecycle is authoring the report.
Authoring the report
Let’s develop our first report using the Report Designer. To do so, we need to create anew Visual Studio .NET Business Intelligence (BI) project.
Task: Create a Business Intelligence Project
To create a project, complete the following steps (see figure 1.10):
Step 1 Open Visual Studio .NET and choose File → New → Project.
Step 2 From Project Types, select Business Intelligence Projects.
Step 3 From Templates, select Report Project.
Step 4 In the Location field, enter AWReporter, specify a location, and click OK.
Step 5 Once the project is created, right-click on the AWReporter project node inthe Solution Explorer window and select Properties. The Property Pages dia-log box appears, as shown in figure 1.11.
Step 6 Verify that the TargetFolder setting is set to AWReporter. This specifies thefolder name in the report catalog where all reports defined in the project willbe deployed.
Step 7 In the TargetServerURL field, enter the Report Server URL. If RS is installedlocally on your machine and you have accepted the defaults during setup, the
Table 1.6 The task map for creating our first report
Phase Task Description
Authoring Create BI project. Create a new BI project in Visual Studio .NET.
Create the report data source.
Use the Report Designer Data tab to configure a data-base connection to the AdventureWorks2000 database.
Set the report dataset. Define a dataset query to retrieve the report data.
Lay out the report. Use the Report Wizard and Report Designer to author the report.
Test the report. Use the Report Designer Preview tab to preview and test the report.
Management Deploy the report. Use Visual Studio .NET to deploy the report to the Report Server catalog.
Delivery Ensure on-demand report delivery.
Use the Report Manager to navigate and render the report.

26 CHAPTER 1 INTRODUCING MICROSOFT REPORTING SERVICES
Figure 1.10 Use Visual Studio .NET to create a new BI project.
Figure 1.11 Use the report property page to set up the project properties.
RS IN ACTION 27
URL of the Report Server should be http://localhost/ReportServer. Click OKto close the Property Pages dialog box.
Task: Create the Report Data Source
Next, we create a shared data source pointing to the AdventureWorks2000 sampledatabase. Don’t worry if the concept of a shared data source is not immediately clear.When we get to chapter 3 it will all begin to make sense.
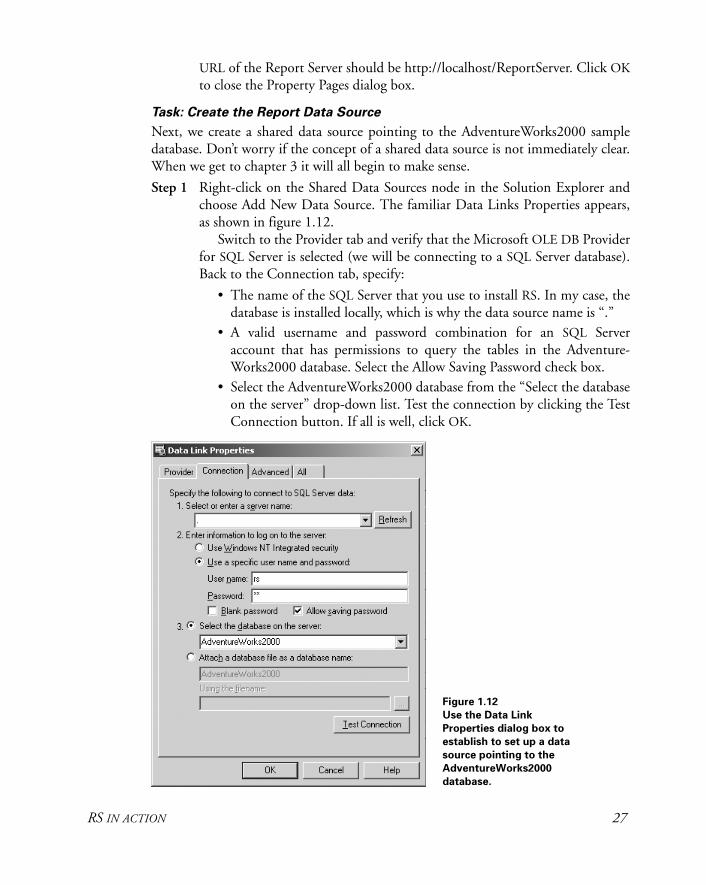
Step 1 Right-click on the Shared Data Sources node in the Solution Explorer andchoose Add New Data Source. The familiar Data Links Properties appears,as shown in figure 1.12.
Switch to the Provider tab and verify that the Microsoft OLE DB Providerfor SQL Server is selected (we will be connecting to a SQL Server database).Back to the Connection tab, specify:
• The name of the SQL Server that you use to install RS. In my case, thedatabase is installed locally, which is why the data source name is “.”
• A valid username and password combination for an SQL Serveraccount that has permissions to query the tables in the Adventure-Works2000 database. Select the Allow Saving Password check box.
• Select the AdventureWorks2000 database from the “Select the databaseon the server” drop-down list. Test the connection by clicking the TestConnection button. If all is well, click OK.
Figure 1.12
Use the Data Link
Properties dialog box to
establish to set up a data
source pointing to the
AdventureWorks2000
database.
28 CHAPTER 1 INTRODUCING MICROSOFT REPORTING SERVICES
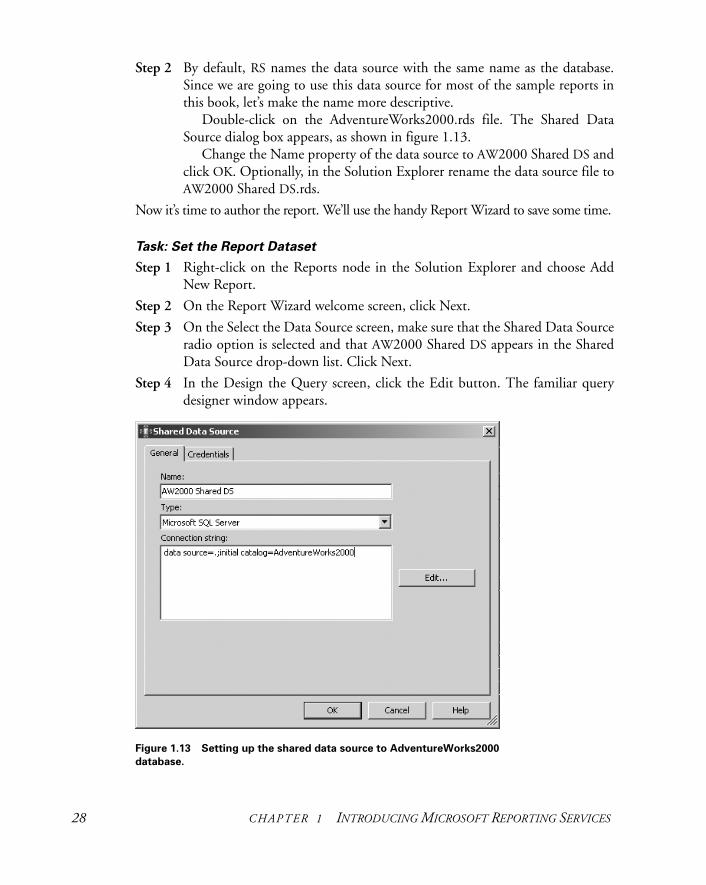
Step 2 By default, RS names the data source with the same name as the database.Since we are going to use this data source for most of the sample reports inthis book, let’s make the name more descriptive.
Double-click on the AdventureWorks2000.rds file. The Shared DataSource dialog box appears, as shown in figure 1.13.
Change the Name property of the data source to AW2000 Shared DS andclick OK. Optionally, in the Solution Explorer rename the data source file toAW2000 Shared DS.rds.
Now it’s time to author the report. We’ll use the handy Report Wizard to save some time.
Task: Set the Report Dataset
Step 1 Right-click on the Reports node in the Solution Explorer and choose AddNew Report.
Step 2 On the Report Wizard welcome screen, click Next.
Step 3 On the Select the Data Source screen, make sure that the Shared Data Sourceradio option is selected and that AW2000 Shared DS appears in the SharedData Source drop-down list. Click Next.
Step 4 In the Design the Query screen, click the Edit button. The familiar querydesigner window appears.
Figure 1.13 Setting up the shared data source to AdventureWorks2000
database.

RS IN ACTION 29
Step 5 Enter the following SQL statement in the query pane:
SELECT ST.Name AS Territory, PC.ProductCategoryID, PC.Name AS ProductCategory, SUM(SOD.UnitPrice * SOD.OrderQty) AS SalesFROM SalesOrderDetail SOD INNER JOIN Product P ON SOD.ProductID = P.ProductIDINNER JOIN SalesOrderHeader SOH ON SOD.SalesOrderID = SOH.SalesOrderID INNER JOIN SalesTerritory ST ON SOH.TerritoryID = ST.TerritoryID INNER JOIN ProductSubCategory PSC ON P.ProductSubCategoryID = PSC.ProductSubCategoryID INNER JOIN ProductCategory PC ON PSC.ProductCategoryID = PC.ProductCategoryIDWHERE DATEPART(YY, SOH.OrderDate) = DATEPART(yy, GETDATE())GROUP BY ST.Name, PC.Name, PC.ProductCategoryIDORDER BY ST.Name, PC.Name
This query retrieves the product sales orders grouped by territory and product cate-gory. The AW database groups products in subcategories, which are then rolled up toproduct categories. For the purposes of this report, we summarize the sales data byproduct categories since this represents the most consolidated level in the product hier-archy, which is exactly what upper management is interested in seeing. The salesamount is retrieved from the SalesOrderDetail table. In addition, the query filters theorders created for the current year. In chapter 3, we’ll make the report parameter drivenby allowing the user to pass an arbitrary date. At this point, click Next.
Task: Lay Out the Report
To lay out the report, perform the following steps:
Step 1 On the Select the Report Type screen, leave the report type set to Tabular.Click Next.
Step 2 On the Design the Table screen, select all fields except ProductCategoryIDand click Details so the fields appear in the report details section, as shown infigure 1.14. Click Next.
Step 3 On the Choose the Table Style screen, click Corporate, the click Next.
Step 4 Finally, on the Completing the Report Wizard screen, enter Sales by Terri-tory as the name of the report. Click Finish, and we’re done!
Visual Studio displays the Report Designer with the Layout tab selected, as shown infigure 1.15.
The integration with Visual Studio.NET Report Designer allows you to easily pre-view and test your reports without leaving the Visual Studio .NET IDE.

30 CHAPTER 1 INTRODUCING MICROSOFT REPORTING SERVICES
Figure 1.14 In the Design the Table step, you choose which fields will appear
on the report and how data will be grouped.
Figure 1.15 Use the Report Designer Layout tab to lay out your report.
RS IN ACTION 31
Task: Test the Report
Let’s make some cosmetic changes to enhance our report.
Step 1 Click on the Report Designer Preview tab to see the HTML representation ofthe report. Notice the report toolbar at the top, which allows you to zoom,print, and save the report in different formats. The Sales field needs someformatting work.
Step 2 Click the Layout tab again to go back to design mode.
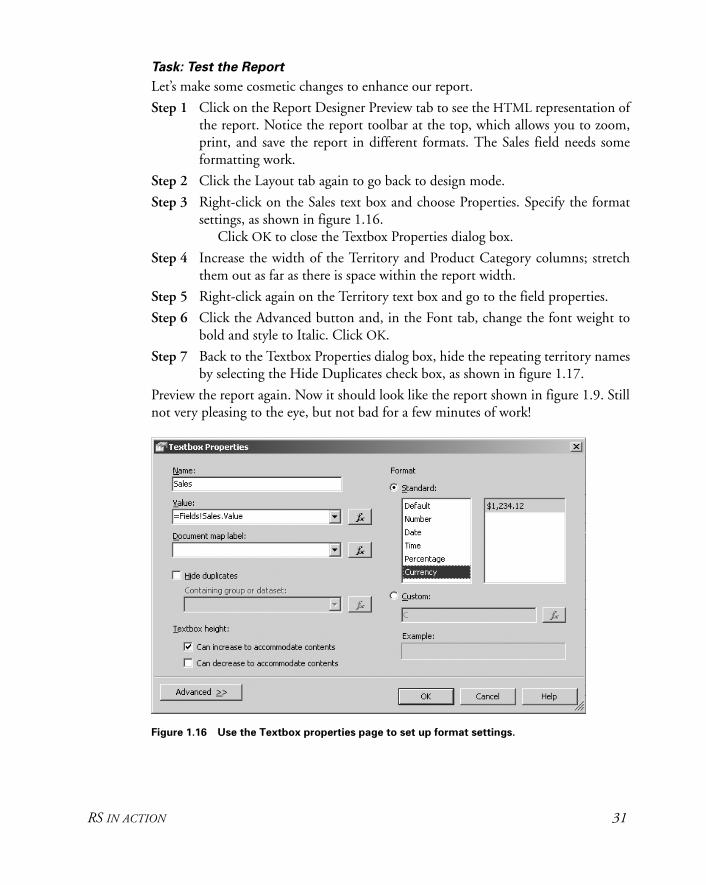
Step 3 Right-click on the Sales text box and choose Properties. Specify the formatsettings, as shown in figure 1.16.
Click OK to close the Textbox Properties dialog box.
Step 4 Increase the width of the Territory and Product Category columns; stretchthem out as far as there is space within the report width.
Step 5 Right-click again on the Territory text box and go to the field properties.
Step 6 Click the Advanced button and, in the Font tab, change the font weight tobold and style to Italic. Click OK.
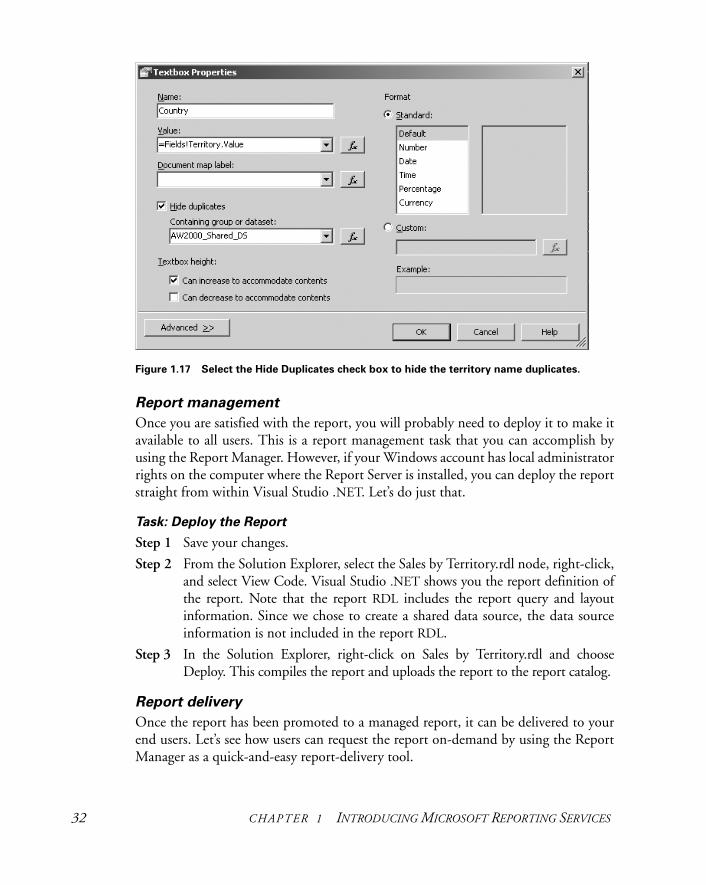
Step 7 Back to the Textbox Properties dialog box, hide the repeating territory namesby selecting the Hide Duplicates check box, as shown in figure 1.17.
Preview the report again. Now it should look like the report shown in figure 1.9. Stillnot very pleasing to the eye, but not bad for a few minutes of work!
Figure 1.16 Use the Textbox properties page to set up format settings.
32 CHAPTER 1 INTRODUCING MICROSOFT REPORTING SERVICES
Report management
Once you are satisfied with the report, you will probably need to deploy it to make itavailable to all users. This is a report management task that you can accomplish byusing the Report Manager. However, if your Windows account has local administratorrights on the computer where the Report Server is installed, you can deploy the reportstraight from within Visual Studio .NET. Let’s do just that.
Task: Deploy the Report
Step 1 Save your changes.
Step 2 From the Solution Explorer, select the Sales by Territory.rdl node, right-click,and select View Code. Visual Studio .NET shows you the report definition ofthe report. Note that the report RDL includes the report query and layoutinformation. Since we chose to create a shared data source, the data sourceinformation is not included in the report RDL.
Step 3 In the Solution Explorer, right-click on Sales by Territory.rdl and chooseDeploy. This compiles the report and uploads the report to the report catalog.
Report delivery
Once the report has been promoted to a managed report, it can be delivered to yourend users. Let’s see how users can request the report on-demand by using the ReportManager as a quick-and-easy report-delivery tool.
Figure 1.17 Select the Hide Duplicates check box to hide the territory name duplicates.

EVALUATING RS 33
Task: On-Demand Report Delivery
Step 1 Open the browser and navigate to the Report Manager URL, which bydefault is http://<reportservername>/reports. Notice that below the ReportManager Home folder there is a new folder, AWReporter, and that its namematches the TargetFolder setting you specified in the report project settings.
Step 2 Click on the AWReporter folder link to see its content. You should find theAW2000 Shared DS data source and Sales by Territory report links.
Step 3 Click on the Sales by Territory report link to request the report with theReport Manager.
As you can see, authoring, managing, and delivering reports with RS is straightfor-ward. At this point, you may decide to compare RS at a high level with other reportingtools you’ve used in the past. The next section discusses how RS stacks up against thecompetition.
1.8 EVALUATING RS
By the time you read this book, comparison charts will probably be available fromMicrosoft and other sources to show how RS compares with other popular reportingtools. For example, the Resource section at the end of this chapter lists a link to adetailed feature comparison document between RS and Crystal Reports.
Based on my experience with integrating applications with third-party reportingpackages, I think that as a first iteration, RS is surprisingly feature-rich. My favoritetop ten features, where I believe RS excels, are as follows:
1 Natively exposed as a Web service—The RS reports are widely accessible, and youdon’t have to do anything special to publish your reports as web services becausethey are hosted under the Report Server, which provides a web service façade.
2 Support of plethora of export formats—You may be delighted to learn that theability to export reports to PDF and Excel is provided out the box. In addition,reports can be delivered in many other popular formats, including web formats(HTML), popular image formats (such as TIFF and JPEG), and data formats(Excel, XML, CSV).
3 On-demand and subscribed report delivery—Another huge plus is the sub-scribed report delivery option, which allows developers to implement opt-inreport features in their applications.
4 Documented report definition format—Developers can create reports to bepublished to the Report Server using Microsoft or third-party design tools thatsupport the RS XML RDL.
5 .NET Framework integration—In the extensibility area, you’ll appreciate thefact that you are not locked from a programmability standpoint. As we men-tioned earlier, when built-in features are not enough, you can reach out and

34 CHAPTER 1 INTRODUCING MICROSOFT REPORTING SERVICES
borrow from the power of the .NET Framework by integrating your reportswith .NET code. In addition, the Report Services programming model is 100percent .NET-based.
6 Extensible architecture—The RS architecture is fully extensible and allows devel-opers to plug in their own security, data, delivery, and rendering extensions.
7 Zero deployment—Thanks to its service-oriented architecture, RS has no clientfootprint and offers true zero deployment for all application types.
8 Scalability—RS can scale better, since it is designed from the ground up to scalein web farm environments.
9 Visual Studio .NET integration—Report authors will enjoy the familiar IDEenvironment when designing and testing reports.
10 Cost—From a cost perspective, it is hard to beat the bundled with the SQLServer RS pricing model, especially if you compare it with the five-digit pricetag of third-party reporting tools.
Of course, nothing is perfect, and Report Services has its own shortcomings, some ofwhich I would like to mention here. As a .NET developer, I would like to see a futureversion of RS bring a tighter integration with Visual Studio .NET. Ideally, workingwith BI projects should not be much different than working with .NET code projects,for example, Windows Forms. In the future, I would expect RS to evolve and add thefollowing features:
• Allow developers to add code-behind files to their reports.
• Instead of Visual Basic .NET only, support all .NET-compatible languages forwriting expressions and report-specific code.
• Use the Visual Studio .NET code editor instead of the Notepad-like CustomCode Editor.
• Support events; currently, developers cannot write event handlers to respond toruntime conditions. Microsoft Access, for example, has been enjoying a reportobject model with events since its first release. Since the RS generation process isnot event-driven, the only option for implementing runtime code customiza-tion with Report Services is to use expressions.
• Include more flexible object model, for example, creating report elementsdynamically, and referencing and changing report items from custom code.
• Convert reports from reporting tools other than Microsoft Access.
I hope that the above shortcomings will be addressed in future releases of RS to makethis tool an even more compelling choice for enterprise reporting.
RESOURCES 35
1.9 SUMMARY
This chapter took you on a whirlwind tour of the RS platform. We’ve discussed its rolein the Microsoft BI initiative, as well as its features and high-level architecture. Youhave even had a chance to use RS and create a simple report based on the Adventure-Works2000 sample database. Now that you have a good high-level understanding ofits features, you can begin using RS to report-enable your own applications.
By now, you should understand the major components of RS and their role in thereport lifecycle. In addition, you should see the advantages that the service-orientedand web-enabled RS architecture has to offer.
Perhaps most important, you should be familiar with the three stages of the reportlifecycle: report authoring, management, and delivery. The remaining chapters exploreeach of these stages in this order. In the next chapter, we discuss different ways to cre-ate RS reports.
1.10 RESOURCES
Microsoft RS website(www.microsoft.com/sql/reporting/)—First stop for the latest on RS.
Microsoft Business Intelligence Platform website (www.microsoft.com/sql/evaluation/BI/default.asp) —The Microsoft BI portalhome page.
A feature comparison between RS vs. Crystal Reports(http://certia.ramblainf.com/pdf/RSvsBO_En_v1.pdf)—Ceria’s Business Intel-ligence Team has developed a detailed feature comparison document that out-lines how Microsoft RS stacks against Crystal Enterprise.
A Guide to Developing and Running Connected Systems with Indigo(http://msdn.microsoft.com/msdnmag/issues/04/01/Indigo/)—In section 1.3 Iemphasized the role of the RS service-oriented programming model. Read DonBox’s article for more information about SOA.

M A N N I N G $39.95 US/$55.95 Canada
Business reporting is a lifeline of business, so a better reportingenvironment is a big deal. With a sophisticated, modern tool likeMicrosoft Reporting Services, you can report-enable any type of
application, regardless of its targeted platform or development language.
Written for information workers, system administrators, and developers,this book is a detailed and practical guide to the functionality provided byReporting Services. It systematically shows off many powerful RS featuresby leading you through a dizzying variety of possible uses. Following a typ-ical report lifecycle, the book shows you how to create, manage, and deliv-er RS reports.
In the first half, you will master the skills you need to create reports.System administrators will learn the ropes of managing and securing thereport environment. The second half of the book teaches developers thetechniques they need to integrate RS with their WinForm or web-basedapplications. It exercises RS through a wide variety of real-world scenar-ios—one of this book’s strengths are its many useful examples.
What’s Inside■ Extend RS with custom code■ Expose reports as RSS feeds■ Implement dynamic reports with Office Web Components■ Create reports off ADO.NET datasets■ Deliver reports to Web Services■ Customize RS security■ Evaluate RS performance and capacity■ and much more
A technology consultant with the Enterprise Application Services practiceof Hewlett-Packard, Teo Lachev has more than 11 years’ experience design-ing and developing Microsoft-centric solutions. He is a MicrosoftCertified Solution Developer and a Microsoft Certified Trainer. Teo livesin Atlanta, GA.
Microsoft Reporting Services IN ACTIONTeo Lachev
,!7IB9D2-djeccb!:p;n;T;T;pISBN 1-932394-22-2
www.manning.com/lachev
Ask the Author Ebook edition
AUTHOR✔
ONLINE
✔