Americas financial reviewAmericas financial review
32
1 Americas financial review Americas financial review Darryl Button CFO Americas Analyst and Investor Day, New York City, December 2, 2009
Transcript of Americas financial reviewAmericas financial review

1
Americas financial reviewAmericas financial review
Darryl Button CFO Americas
Analyst and Investor Day, New York City, December 2, 2009

o Adjusted operating expenses down 10%
Key messages
o Reporting structure aligned with management changes
o Earnings impacted by financial crisis – franchises intact and producing
strong underlying earnings growth going forward
o Institutional spread lending in run off – reduced exposure to credit risk over
time
o Adjusted operating expenses down 10%
o US impairment trend improving
o Significant improvement in unrealized bond losses
o Additional capital markets de-risking resulting in higher quality, consistent
earnings going forward
Local knowledge. Global power. 2

o Financial review
Agenda
o Business review
Local knowledge. Global power. 3

Ope
ratin
ea
rnin
g
rotect on ro ucts e nsuranceSavin s and and Asset
P i
P d
R i
Reporting structure - today
Over /
(under)
performance
of fair value
items
Life and Protection
Individual Savings and Retirement
Pension and Asset
Management
Institutional Products
Life Reinsurance
Life Institutional guaranteed
products
Accident and
health
Fixed annuities
Variable annuities
Retail mutual funds
BOLI / COLI U
nd
erlyin
gea
rnin
gs
g s Life and
Individual Savings and
Pension and Asset
Institutional Life
Ope
ratin
gea
rnin
gs Protection
g Retirement Management
Products Reinsurance
Life Institutional guaranteed
products
Accident and
health
Fixed annuities
Variable annuities
Retail mutual funds
BOLI / COLI
o Gains / losses
o Impairment charges
o Other income
o Income tax
o Americas net income
Local knowledge. Global power. 4

U ede
rlyin
g
rnin
gs
Reporting structure – aligned with management changes
Unnde
rlyin
g
ea
a
rnin
gs
US Work Mon AFP SVS Canada EU Life site Japan
LTC TCM DIA Argos Mexico ADMS TAM TRS BOLI
Korea /COLI
Mong WFG TRM Clark Brazil eral
Individual Employer Life and Alternative Life
Savings and Solutions and Protection Markets Reinsurance
Retirement Retirement Pensions Pensions
o Over / (under) performance of fair value items
o Run-off business
o Gains / losses
o Impairment charges
o Other income
o Income tax
o Americas net income
Local knowledge. Global power. 5

Development of underlying earnings before tax per quarter
Pre-crisis Current Post-crisis
<2008 Q3 2009 >2010
USD
700
million
Earnings impacted by
o Run-off institutional
spread-based business
o Equity markets
o De-risking
USD
430*
million
Earnings drivers
o Growth of business
o Cost savings
o Redeployment of cash
o Financial markets
* Excluding exceptional items (USD 30 million)
Local knowledge. Global power. 6

Quarterly run-rate underlying earnings before tax
Pre-Crisis Current
(<2008) Change (Q3 09) (USD million) (USD million) (USD million)
Americas 630 (160) 470
(excluding IGP spread)
IGP spread 70 (110) (40)
Total Americas 700 (270) 430
Excluding IGP spread (160) o (70) lower equity based fees and higher DPAC amortization on variable annuity, mutual fund and pension businesses
o (50) investment de-risking (reduced hedge funds, high yield, BBB and credit derivatives)
o (40) employee pension plan expenses
IGP spread (110) o Spread compression driven by shortening of institutional liabilities during financial crisis
o IGP run-off loss follows maturity pattern of internally transferred assets and amortizes off over next four years
Local knowledge. Global power. 7

Impact of run-off institutional spread-based business
Spread balances (USD billion)
33
24
13 8
3 2
2008 Q3 2009 2010E 2012E 2014E 2016E
o Institutional cash shortfall due to shortening of liabilities
– 12 month notice putable funding agreements (USD 6 billion)
– Municipal GICs (USD 5 billion)
– Extendable MTNs (USD 1 billion)
o Remainder of US businesses cash flow positive through the crisis
Local knowledge. Global power. 8

exchan e for cash
Impact of run-off institutional spread-based business
Pre-Crisis Current (<2008) Change (Q3 09)
(USD million) (USD million) (USD million)
IGP spread per quarter 70 (110) (40)
o USD 10 billion internal asset transfer from institutional to other US portfolios in
exchange for cash g
– Transfer pricing basis – what other portfolios priced for
– Actual book value of USD 11.4 billion
– Unrealized loss before tax of USD (1.4) billion amortized through run-off
institutional earnings:
• 2009 (0.3) billion • 2012 (0.2) billion
• 2010 (0.3) billion • 2013 (0.2) billion
• 2011 (0.3) billion • 2014 (0.1) billion
o Run-off will reduce sensitivity to credit markets going forward and free up USD 0.8
billion of capital by the end of 2010
Local knowledge. Global power. 9

.
0
.
.
Mean reversion – equity return assumptions
7.50%
8.25%
7.50%
8.25%
6 25%
7.25% 7.25%
6.25% 6.00% 5.00% 6.25%
5.75%
4.75% 4.75% 4.75% 4.75%
6.00%
9.00%
10.0 %
15 00% 15.00% 15.00%
11 00%
8.00%
Corridor cap
Corridor floor
Negative DAC unlocking above cap �
Corridor floor
Positive DAC unlocking below floor �
Q4 Q1 Q2 Q3 Q4 Q1 Q2 Q3 Q4 Q1 Q2 Q3 Q4 Q1 Q2 Q3 Q4 Q1 Q2 Q3 Q4 Q1 Q2 Q3 '03 '04 '04 '04 '04 '05 '05 '05 '05 '06 '06 '06 '06 '07 '07 '07 '07 '08 '08 '08 '08 '09 '09 '09
o Equity return assumptions adjusted quarterly within the corridor
o Corridor based on current information and management best estimate
o Over last six years, corridor breached once in Q207 (floor) and then in Q308-Q109
(cap)
o Underlying earnings impact is approximately USD 60 million per point change
in equity growth rate assumption
Local knowledge. Global power. 10

Proven ability to execute on cost reduction initiatives
Adjusted operating expenses down 10% year to date
Category 9M 2009 9M 2008 Change
Total operating expenses 1,678 1,640 38
Less: employee pension plan costs (90) 76 (166)
Less: restructuring charges (40) n/a (40)
Adjusted operating expenses 1,548 1,716 (168)
o Restructuring the organization resulted in charges during 2009; however,
the efficiencies gained will result in reduced costs going forward
o We are not done – we will continue to aggressively pursue expense savings
initiatives throughout the organization
Local knowledge. Global power. 11

–
Fair value items
Liabilities
Assets
Macro
Hedge
Local knowledge. Global power.
o GMWB (USD 14 billion) - delta / rho hedged
o Segregated funds (USD 3.4 billion) – 92% delta hedged
o Total return annuities (USD 1.4 billion) – closed blocks
o Hedge funds (USD 0.7 billion) – reduced by 1.7 billion reduced by 1.7 billion o Hedge funds (USD 0.7 billion)
o Private equity (USD 0.7 billion) and REAP (USD 0.7 billion)
o Credit derivatives – super senior program unwound
o Capital protection – 50% of unhedged retail VA
o Total return swap (USD 1.3 billion)
o Put options (USD 0.8 billion)
Balances reflect ending balances as of September 30, 2009 12

Q3 '07 Q4 '07 Q1 '08 Q2 '08 Q3 '08 Q4 '08 Q1 '09 Q2 '09 Q3 '09
Improved US impairment losses
Gross impairments (USD million)
US housing (ABS and RMBS)
Corporate Bonds
US commercial mortgages (CMBS and CML) 550 516 491
Other 430 370
131 61
40 36
Q3 '07 Q4 '07 Q1 '08 Q2 '08 Q3 '08 Q4 '08 Q1 '09 Q2 '09 Q3 '09
Recoveries (USD million)
49
5
20 18
3 4
38
3
24
Q3 '07 Q4 '07 Q1 '08 Q2 '08 Q3 '08 Q4 '08 Q1 '09 Q2 '09 Q3 '09
Local knowledge. Global power. 13

Reduced unrealized bond losses
Revaluation account (USD billion)
Q3 '07 Q4 '07 Q1 '08 Q2 '08 Q3 '08 Q4 '08 Q1 '09 Q2 '09 Q3 '09
(5)
(10)
(15)
(20) (20)
Gross Bond Unrealized Gain (Loss) Net Revaluation Reserve
o Significant improvement in recent quarters
o Not a proxy for actual impairments
Local knowledge. Global power. 14

o Business review
Agenda
o Financial review
Local knowledge. Global power. 15
Variable annuities
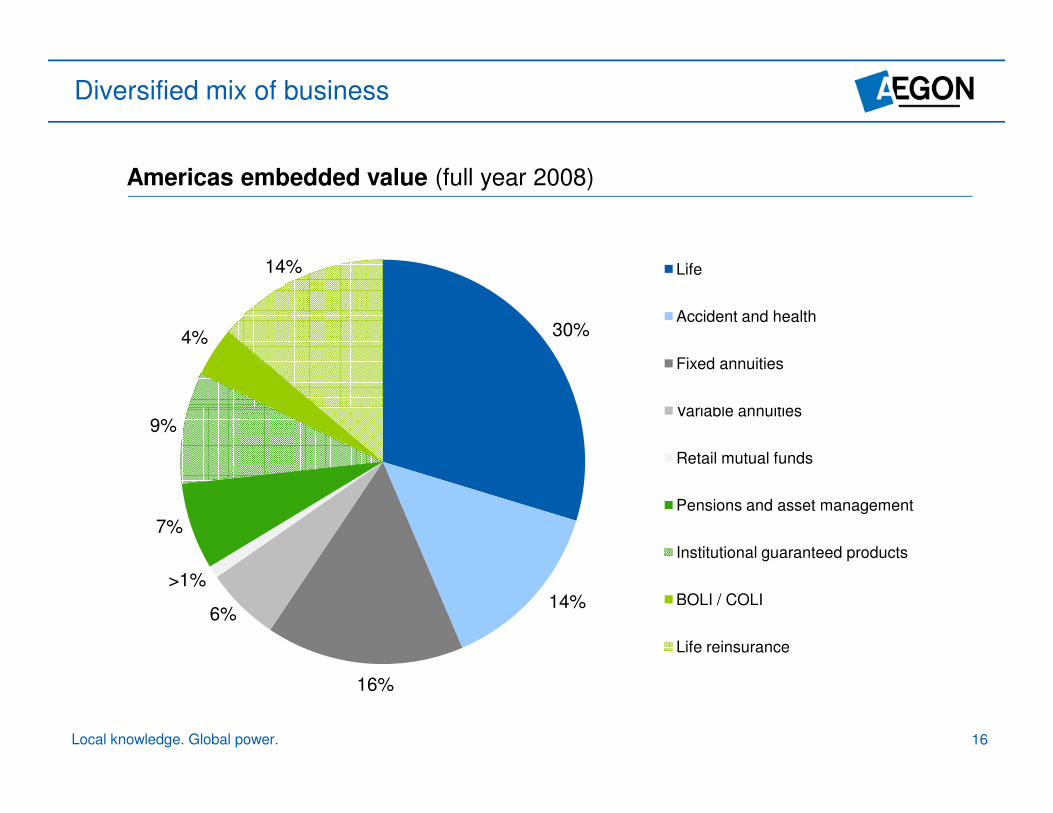
Diversified mix of business
Americas embedded value (full year 2008)
14% Life
Accident and health
4% 30%
Fixed annuities
Variable annuities 9%
Retail mutual funds
Pensions and asset management
7%
Institutional guaranteed products
>1% 14% BOLI / COLI
6%
Life reinsurance
16%
Local knowledge. Global power. 16

o yn e c so Variable life insurance
Diversified product offering
Life and Protection
Individual Savings
and Retirement
Employer Solutions
and Pensions
Alternative Markets
Life Reinsurance
o Traditional life
o Term life
o Universal life
o Equity indexed universal life
o Variable life
o Fixed annuities
o Variable annuities
o Mutual funds
o 401(k) plans
o 403(b) plans
o Defined benefit
o Variable annuities
o Mutual funds
S th ti GIC
o Canadian life and segregated funds
o Latin America life insurance products
o Bank and corporate owned life insurance
o Term coinsurance
o Annuities
o Product consulting and development
o Automated underwriting
Local knowledge. Global power. 17
o Health and supplemental health
o Long term care
o Synthetic GICs

o ome serv ceartners o Worksite ecialists
Diversified distribution
Life and Protection
Individual Savings
and Retirement
Employer Solutions
and Pensions
Alternative Markets
Life Reinsurance
o General agents
o Registered representatives
o Independent marketing organizations
H i
o Banks
o Wirehouses
o Broker/dealers
o Financial planners
o Institutional partners
o Consulting firms
o Broker/dealers
o Banks
o Independent producers
o Worksite specialists
o General agents
o Company representatives
o Consultants
o Company representatives (business to business)
Local knowledge. Global power. 18
o Home service agents
o Direct marketing
p
o Agents
sp
o Employee benefit brokers and benefit consultants
o Third-party administrators

Life and Protection Canada
WFG
ADMS AFP
Mon Life LTC
Work site
Sources of
earnings
Financial
model*
Risk
management
o Investment spreads (30%) o Insurance fee margins (70%)
400
300
200
100
0
Q1 07 Q2 07 Q3 07 Q4 07 Q1 08 Q2 08 Q3 08 Q4 08 Q1 09 Q2 09 Q3 09
Underlying Earnings 2007 Sample Model 10% of Premium 1% of Reserves
o Actuarial experience studies o External reinsurance o Effective ALM strategies o Extensive operational controls and processes
Local knowledge. Global power. *Model based on old reporting structure 19

Individual Savings and Retirement
TRM
TAM TCM
Canada
Sources of
earnings
o Fixed annuities - investment spreads (100%) o Variable annuities
- fees net of hedging (70%) - investment spreads (30%)
o Mutual funds - fees (100%)
Financial
model*
Variable Annuities 150 100 Fixed Annuities
100 50
050
-50 0
Q1 Q2 Q3 Q4 Q1 Q2 Q3 Q4 Q1 Q2 Q3 Q1 Q2 Q3 Q4 Q1 Q2 Q3 Q4 Q1 Q2 Q3 07 07 07 07 08 08 08 08 09 09 09 07 07 07 07 08 08 08 08 09 09 09
Underlying Earnings 2007 Sample Model Underlying Earnings 2007 Sample Model
Risk
management
o ALM matching for fixed annuities o Delta / rho hedging on GMWB o Macro hedge for 50% of previously unhedged business o New product launched Q3 ‘09 � reduced hedge costs, tiered pricing
Local knowledge. Global power. *Model based on old reporting structure 20

TRS
DIA
Employer Solutions and Pensions SVS
Work
site
Clark TIM
Sources of
earnings
Financial
model*
Risk
management
o Separate account and off balance sheet � fees o Purchased annuities and general account � spread o Worksite voluntary � insurance margins
60
50
40
30
20
10
0
Q1 07 Q2 07 Q3 07 Q4 07 Q1 08 Q2 08 Q3 08 Q4 08 Q1 09 Q2 09 Q3 09
Underlying earnings 2007 Sample Model
o ALM matching for general account o Extensive operational controls and processes o Actuarial experience studies for voluntary benefits o Strict investment mandates for synthetic GICs
Local knowledge. Global power. *Model based on old reporting structure 21
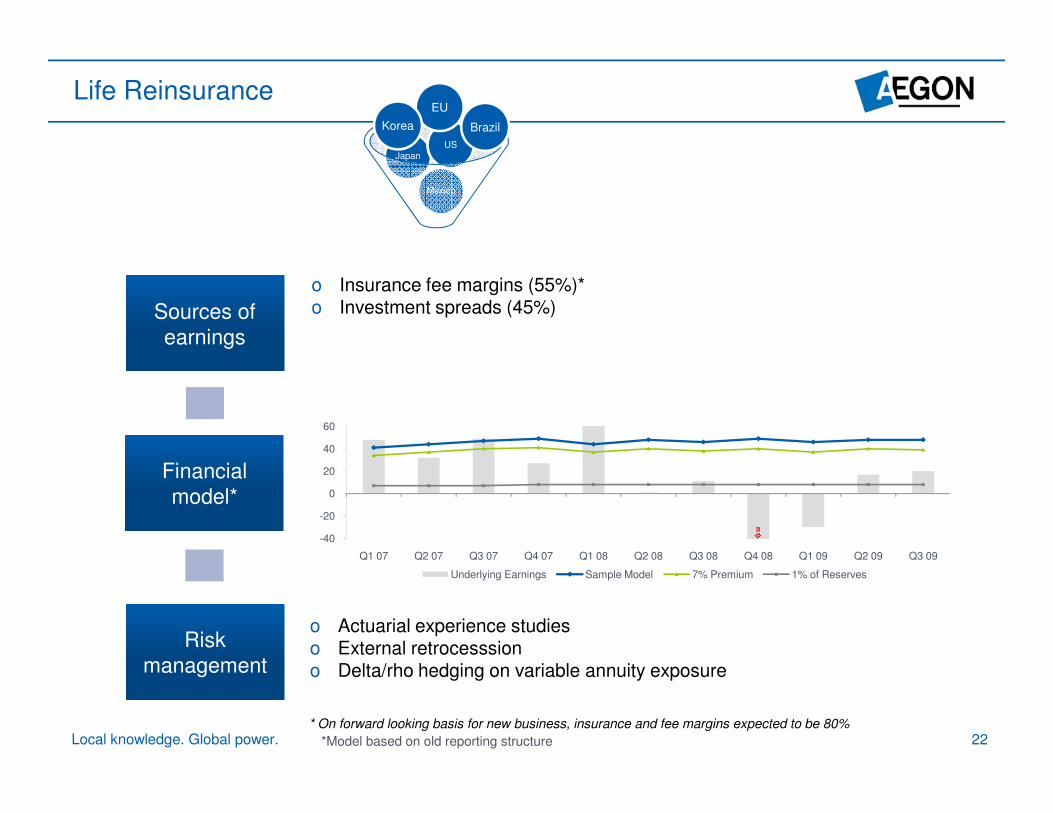
Life Reinsurance
Mexico
Japan
US
Brazil
EU
Korea
Sources of
earnings
o Insurance fee margins (55%)* o Investment spreads (45%)
60
40
20
0
Financial
model* -20
-40
Q1 07 Q2 07 Q3 07 Q4 07 Q1 08 Q2 08 Q3 08 Q4 08 Q1 09 Q2 09 Q3 09
Underlying Earnings Sample Model 7% Premium 1% of Reserves
Risk
management
o Actuarial experience studies o External retrocesssion o Delta/rho hedging on variable annuity exposure
* On forward looking basis for new business, insurance and fee margins expected to be 80%
Local knowledge. Global power. *Model based on old reporting structure 22

• Reduced hedge fund • Floating rate assets
Reduced capital markets risk
Equity Risk
• VA hedging
• Common equity divestment
• Reduced hedge fund investment exposure
Interest Rate Risk
• Effective ALM
• Cash and forward starting swaps
• Floating rate assets added to fixed annuity portfolio
Improved risk / return profile
Credit Risk
• Run-off institutional spread lending
• Asset de-risking to mitigate migration
• Upgraded credit quality in mortgage tranches over last 5 years
Local knowledge. Global power. 23
Conclusion
o Organizational changes to simplify the business and extract synergies
o Strong franchises positioned to win
o Focused on costs to drive competitive advantage
o Reduced exposure to capital markets risk will result in higher quality,
consistent earnings going forward
Local knowledge. Global power. 24

Q&A
Local knowledge. Global power. 25

Appendix
Local knowledge. Global power. 26

Divisional restructuring
Previous Reporting Structure New Reporting Structure
Life and Protection
AEGON Direct Marketing Services No change Life and Protection
Long Term Care No change Life and Protection
Monumental Life No change Life and Protection
World Financial Group No change Life and Protection
AEGON Financial Partners (including TIIG) No change Life and Protection
Transamerica Worksite Marketing Moved to Employer Solutions and Pensions
Transamerica Canada Moved to Alternative Markets
Individual Savings and Retirement
Transamerica Capital Management No change Individual Savings and Retirement
Transamerica Asset Management Transamerica Asset Management No change No change Individual Savings and Retirement Individual Savings and Retirement
Transamerica Retirement Management No change Individual Savings and Retirement
Transamerica Canada Moved to Alternative Markets
Pensions and Asset Management
Transamerica Investment Management Moved to Global Asset Management
Diversified Investment Advisors Moved to Employer Solutions and Pensions
Transamerica Retirement Services Moved to Employer Solutions and Pensions
Transamerica Canada Moved to Alternative Markets
Institutional Markets
Extraordinary Markets Moved to Alternative Markets
Institutional Markets Division spread Moved to Below the line in run-off
Institutional Markets Division Stable Value Solutions (synthetic GICs) Moved to Employer Solutions and Pensions
Clark Consulting Moved to Employer Solutions and Pensions
Life Reinsurance
Transamerica Reinsurance No change Life Reinsurance
Local knowledge. Global power. 27
variable life
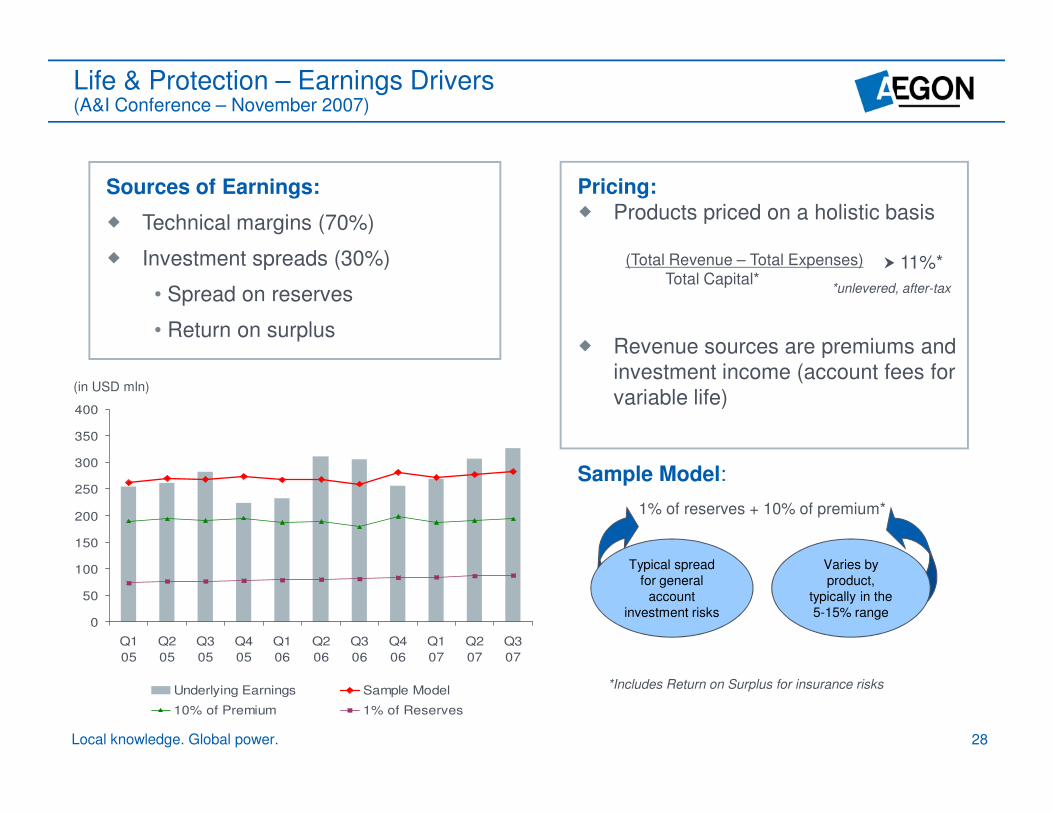
Life & Protection – Earnings Drivers (A&I Conference – November 2007)
Sources of Earnings: Pricing:
� Products priced on a holistic basis � Technical margins (70%)
� Investment spreads (30%) (Total Revenue – Total Expenses) � 11%* Total Capital*
*unlevered, after-tax • Spread on reserves
• Return on surplus � Revenue sources are premiums and
investment income (account fees for
variable life) (in USD mln)
400
Local knowledge. Global power. 28
0
50
100
150
200
250
300
350
400
Q1
05
Q2
05
Q3
05
Q4
05
Q1
06
Q2
06
Q3
06
Q4
06
Q1
07
Q2
07
Q3
07
Underlying Earnings Sample Model
10% of Premium 1% of Reserves
)
Sample Model:
1% of reserves + 10% of premium*
*Includes Return on Surplus for insurance risks
Typical spread
for general
account
investment risks
Varies by
product,
typically in the
5-15% range
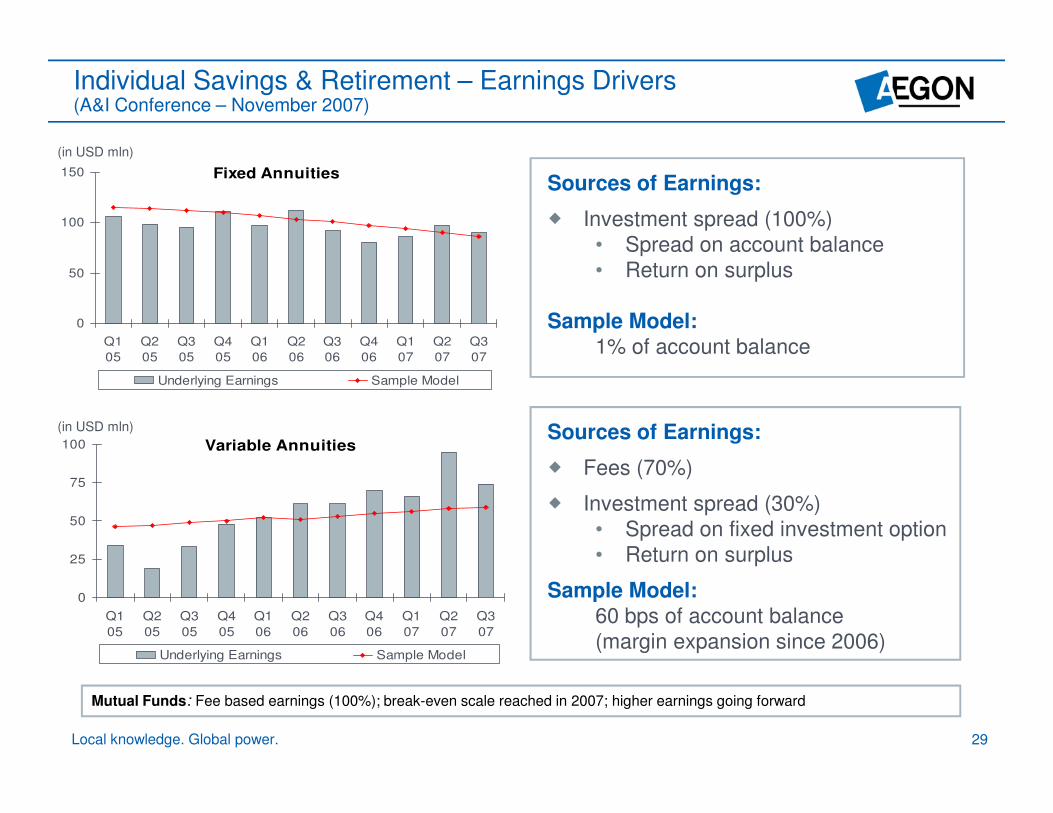
Individual Savings & Retirement – Earnings Drivers (A&I Conference – November 2007)
(in USD mln)
150
100
50
0
100
75
50
25
0
Fixed Annuities Sources of Earnings:
� Investment spread (100%)
• Spread on account balance
• Return on surplus
Sample Model:
1% of account balance Q1 Q2 Q3 Q4 Q1 Q2 Q3 Q4 Q1 Q2 Q3
05 05 05 05 06 06 06 06 07 07 07
Underlying Earnings Sample Model
(in USD mln)
Variable Annuities
Q1 Q2 Q3 Q4 Q1 Q2 Q3 Q4 Q1 Q2 Q3
05 05 05 05 06 06 06 06 07 07 07
Underlying Earnings Sample Model
Sources of Earnings:
� Fees (70%)
� Investment spread (30%)
• Spread on fixed investment option
• Return on surplus
Sample Model:
60 bps of account balance
(margin expansion since 2006)
Mutual Funds: Fee based earnings (100%); break-even scale reached in 2007; higher earnings going forward
Local knowledge. Global power. 29

Pension & Asset Management – Earnings Drivers (A&I Conference – November 2007)
60
50
40
30
20
10
0
Q1 05 Q2 05 Q3 05 Q4 05 Q1 06 Q2 06 Q3 06 Q4 06 Q1 07 Q2 07 Q3 07
Underlying earnings Sample Model Local knowledge. Global power.
Sources of Earnings:
� Fees (40%)
� Investment spread (60%)
• Spread on account balance
• Return on surplus
Margins vary
significantly by
product based on
capital allocation –
range from 10 to 100
bps
10 bps => large case off balance sheet 401(k)
service contract
100 bps => purchased annuities and general
account fixed option of retirement plans
Sample earnings model:
25 bps of account balance
30

n m ninvestment income and account
Life Reinsurance – Earnings Drivers (A&I Conference – November 2007)
� Products priced on a holistic basis Sources of Earnings: Pricing:
� Technical Margins (45%) to return minimum return on capital
� Investment Spreads (45%) (Total Revenue – Total Expenses)
• Spread on reserves � 11%* Total Capital*
*unlevered, after-tax • Return on surplus
� Fees (10%) � Revenue sources are premiums,
investment income, and account (i USD l )
Local knowledge. Global power. 31
0
20
40
60
Q1 05 Q2 05 Q3 05 Q4 05 Q1 06 Q2 06 Q3 06 Q4 06 Q1 07 Q2 07 Q3 07
Underlying Earnings Sample Model
7% Premium 1% of Reserves
,
fees
Sample earnings model:
1% of reserves + 7% of premium*
Typical spread
for general
account
investment risks
Varies by
product,
typically in the
5-15% range
*Includes Return on Surplus for insurance risks
(in USD mln)

Disclaimer
Forward-looking statements
The statements contained in this presentation that are not historical facts are forward-looking statements as defined in the US Private Securities Litigation Reform
Act of 1995. The following are words that identify such forward-looking statements: aim, believe, estimate, target, intend, may, expect, anticipate, predict, project,
counting on, plan, continue, want, forecast, goal, should, would, is confident, will, and similar expressions as they relate to our company. These statements are
not guarantees of future performance and involve risks, uncertainties and assumptions that are difficult to predict. We undertake no obligation to publicly update
or revise any forward-looking statements. Readers are cautioned not to place undue reliance on these forward-looking statements, which merely reflect company
expectations at the time of writing. Actual results may differ materially from expectations conveyed in forward-looking statements due to changes caused by
various risks and uncertainties. Such risks and uncertainties include but are not limited to the following:
o Changes in general economic conditions, particularly in the United States, the Netherlands and the United Kingdom;
o Changes in the performance of financial markets, including emerging markets, such as with regard to:
- The frequency and severity of defaults by issuers in our fixed income investment portfolios; and
- The effects of corporate bankruptcies and/or accounting restatements on the financial markets and the resulting decline in the value of equity and
debt securities we hold;
o The frequency and severity of insured loss events;
o Changes affecting mortality, morbidity and other factors that may impact the profitability of our insurance products;
o Changes affecting interest rate levels and continuing low or rapidly changing interest rate levels; interest rate levels and continuing low or rapidly changing interest rate levels; o Changes affecting
o Changes affecting currency exchange rates, in particular the EUR/USD and EUR/GBP exchange rates;
o Increasing levels of competition in the United States, the Netherlands, the United Kingdom and emerging markets;
o Changes in laws and regulations, particularly those affecting our operations, the products we sell, and the attractiveness of certain products to our consumers;
o Regulatory changes relating to the insurance industry in the jurisdictions in which we operate;
o Acts of God, acts of terrorism, acts of war and pandemics;
o Effects of deliberations of the European Commission regarding the aid we received from the Dutch State in December 2008;
o Changes in the policies of central banks and/or governments;
o Litigation or regulatory action that could require us to pay significant damages or change the way we do business;
o Customer responsiveness to both new products and distribution channels;
o Competitive, legal, regulatory, or tax changes that affect the distribution cost of or demand for our products;
o Our failure to achieve anticipated levels of earnings or operational efficiencies as well as other cost saving initiatives; and
o The impact our adoption of the International Financial Reporting Standards may have on our reported financial results and financial condition.
Further details of potential risks and uncertainties affecting the company are described in the company’s filings with Euronext Amsterdam and the US Securities
and Exchange Commission, including the Annual Report on Form 20-F. These forward-looking statements speak only as of the date of this document. Except as
required by any applicable law or regulation, the company expressly disclaims any obligation or undertaking to release publicly any updates or revisions to any
forward-looking statements contained herein to reflect any change in the company’s expectations with regard thereto or any change in events, conditions or
circumstances on which any such statement is based.
Local knowledge. Global power. 32