[American Society of Civil Engineers Second International Conference on Vulnerability and Risk...
11
Influence of Record Selection Procedures on Seismic Loss Estimations Mário Marques 1 , Luís Macedo 1 , Miguel Araújo 1 , Luís Martins 1 , José Miguel Castro 1 , Luís Sousa 1 , Vítor Silva 2 and Raimundo Delgado 1 1 Civil Engineering Department, Faculty of Engineering of the University of Porto, Rua Dr. Roberto Frias, s/n, 4200-465 Porto, Portugal; email: [email protected] 2 Civil Engineering Department, University of Aveiro, Campus Universitário de Santiago, 3810-193 Aveiro, Portugal; PH (351) 234370200; FAX (351) 234370985; email: [email protected] ABSTRACT In recent years Performance-based Earthquake Engineering (PBEE) techniques have been gaining significance as an alternative to existing deterministic assessment procedures. Briefly, on the basis of an extensive probabilistic framework, PBEE intends to provide information to various stakeholders in terms of monetary losses, downtime and/or casualties associated to a return period. These expected losses are the end result of three fundamental components: the hazard, the exposure and the vulnerability. The aim of the present study is to evaluate the influence of the record selection procedures on the quantification of the physical vulnerability, and consequently on the seismic loss estimations, arguably recognized within the scientific community to produce a higher level of variability in structural demands when comparing to material properties and different numerical modelling solutions. INTRODUCTION The issue of selection and scaling of ground motion records has been gaining relevance as nonlinear dynamic analysis becomes a more common procedure among practicing engineers for predicting structural response. In fact, ground motion selection and modification(GMSM) methods are currently included in building codes, that in general consist of selecting a set of records compatible with a target response spectrum (usually the uniform hazard spectrum (UHS) (Araújo et al. 2013). However, when the objective is to give an accurate estimation of the complete probability distribution of the response, one is interested in maintaining consistency between the probabilistic seismic hazard assessment (PSHA) and the selection of ground motions (Haselton et al. 2009, Baker 2010). Thus, code-based GMSM methods do not fulfil this requirement as the UHS conservatively implies that large- amplitude spectral values will occur at all periods within a single ground motion. This statement stems from the fact that a UHS represents an envelope over rupture magnitude (M), source-to-site distance (R) and epsilon ( ) contributors to hazard (Baker and Cornell 2005). This information is deemed crucial when risk assessment and loss estimations are concerned as the scope of these studies is to provide 1756 Vulnerability, Uncertainty, and Risk ©ASCE 2014 Vulnerability, Uncertainty, and Risk Downloaded from ascelibrary.org by University of California, Davis on 08/14/14. Copyright ASCE. For personal use only; all rights reserved.
Transcript of [American Society of Civil Engineers Second International Conference on Vulnerability and Risk...
Influence of Record Selection Procedures on Seismic Loss Estimations
Mário Marques1, Luís Macedo1, Miguel Araújo1, Luís Martins1, José Miguel Castro1, Luís Sousa1, Vítor Silva2 and Raimundo Delgado1
1Civil Engineering Department, Faculty of Engineering of the University of Porto, Rua Dr. Roberto Frias, s/n, 4200-465 Porto, Portugal; email: [email protected] 2Civil Engineering Department, University of Aveiro, Campus Universitário de Santiago, 3810-193 Aveiro, Portugal; PH (351) 234370200; FAX (351) 234370985; email: [email protected]
ABSTRACT
In recent years Performance-based Earthquake Engineering (PBEE) techniques have been gaining significance as an alternative to existing deterministic assessment procedures. Briefly, on the basis of an extensive probabilistic framework, PBEE intends to provide information to various stakeholders in terms of monetary losses, downtime and/or casualties associated to a return period. These expected losses are the end result of three fundamental components: the hazard, the exposure and the vulnerability. The aim of the present study is to evaluate the influence of the record selection procedures on the quantification of the physical vulnerability, and consequently on the seismic loss estimations, arguably recognized within the scientific community to produce a higher level of variability in structural demands when comparing to material properties and different numerical modelling solutions. INTRODUCTION
The issue of selection and scaling of ground motion records has been gaining relevance as nonlinear dynamic analysis becomes a more common procedure among practicing engineers for predicting structural response. In fact, ground motion selection and modification(GMSM) methods are currently included in building codes, that in general consist of selecting a set of records compatible with a target response spectrum (usually the uniform hazard spectrum (UHS) (Araújo et al. 2013).
However, when the objective is to give an accurate estimation of the complete probability distribution of the response, one is interested in maintaining consistency between the probabilistic seismic hazard assessment (PSHA) and the selection of ground motions (Haselton et al. 2009, Baker 2010). Thus, code-based GMSM methods do not fulfil this requirement as the UHS conservatively implies that large-amplitude spectral values will occur at all periods within a single ground motion. This statement stems from the fact that a UHS represents an envelope over rupture magnitude (M), source-to-site distance (R) and epsilon ( ) contributors to hazard (Baker and Cornell 2005). This information is deemed crucial when risk assessment and loss estimations are concerned as the scope of these studies is to provide
1756Vulnerability, Uncertainty, and Risk ©ASCE 2014
Vulnerability, Uncertainty, and Risk
Dow
nloa
ded
from
asc
elib
rary
.org
by
Uni
vers
ity o
f C
alif
orni
a, D
avis
on
08/1
4/14
. Cop
yrig
ht A
SCE
. For
per
sona
l use
onl
y; a
ll ri
ghts
res
erve
d.

stakeholders with the most accurate evaluation of losses, so as to define critical information such as the probable maximum loss (PML).
Many studies have highlighted the need for selecting and scaling ground motion records that match the target hazard scenario, guaranteeing the agreement to magnitudes, distances and (number of standard deviations by which the target Sa is greater than the median prediction) (Bommer and Acevedo 2004, Baker and Cornell 2006). Towards the selection of scenario ground motions an important breakthrough was attained with the conditional mean spectrum (CMS) method, initially proposed by Baker and Cornell (2006). Its theoretical robustness lies on the definition of spectral ordinates conditioned on the occurrence of a specific value of a single spectral period, being directly related to PSHA. Jayaram et al. (2011) pointed out to the need for including the variance of the mean and standard deviation of the CMS spectral ordinates between two different periods and to the conditioned period (conditional spectrum (CS) method). The ability to account for the median, standard deviation and correlations in scenariobased intensity measures are also addressed in the studies of Ay and Akkar (2012) and Bradley (2010).
The purpose of this paper is to examine the influence of ground motion selection procedures on seismic risk assessment and loss estimations. The study begins by evaluating the performance of six different scenario-based GMSM approaches on the definition of the probabilistic distribution of the fragility of two non-seismically designed structures, one in RC and one in steel. The number of ground motions and corresponding scaling factors, as well as the significance to several intensity measure types (IMTs) are also analysed herein. The paper closes with a discussion on the impact of the GMSM approaches on the seismic risk of the structures. To this end, the probabilistic SAC/FEMA closed-form probabilistic framework (Cornell et al. 2002), assuming a second-order hazard approximation (Vamvatsikos 2013), is adopted. CASE STUDY DESCRIPTION Structural models
The influence of the GMSM methods is demonstrated in the prediction of the nonlinear time-history response of two real moment frame structures, one built with reinforced concrete and the other with steel. Both structures were designedonly to resist gravity loads. In brief, the RC building consists of a three-storey moment frame with irregular bay spans and floor heights built in Europe during the 50's (pre-seismic code). This frame has a natural period of vibration of 0.37s and has been randomly generated assuming the geometric and material statistical distributions for this class of buildings, as proposed by Silva et al. (2014). In turn, the steel structure is a five-storey, three-bay regular frame with a fundamental period of vibration of 1.63s. More information on the characteristics of this structure may be found in Araújo et al. (2013). Both buildings were modelled and analysed using the open source software OpenSEES (PEER, 2005).
1757Vulnerability, Uncertainty, and Risk ©ASCE 2014
Vulnerability, Uncertainty, and Risk
Dow
nloa
ded
from
asc
elib
rary
.org
by
Uni
vers
ity o
f C
alif
orni
a, D
avis
on
08/1
4/14
. Cop
yrig
ht A
SCE
. For
per
sona
l use
onl
y; a
ll ri
ghts
res
erve
d.

Seismic hazard scenario and ground motion records
The case study application is assumed to be located in Lisbon, Portugal, for rock conditions (vs,30=760 m/s). Probabilistic seismic hazard and disaggregation calculations were performed for this site location using the OpenQuake engine (Monelli et al. 2012). Although being necessary for the sake of the present study, one should note that the evaluation of the seismic hazard model for Portugal was not a priority of the work (additional information should be referred to the works of Sousa and Costa (2009) and Vilanova and Fonseca (2007)).Nevertheless, following the work of Silva (2012), the Atkinson and Boore (2006) and the Akkar and Bommer (2010) ground motion prediction models (GMPM) were selected, demanding for multiple causal M, R and GMPM, addressed within a 3D disaggregation for the exceedance of the spectral acceleration (Sa) at the fundamental period (T1) intensity level (Sousa et al. 2014).A total of 911 non-pulse records,compatible with the seismological, geological and tectonic environment of the Portuguese mainland territory, were selected from the PEER and ESMD databases. GROUND MOTION SELECTION AND MODIFICATION METHODS
In order to illustrate the effect on the multiple stages of a risk assessment, a total of six GMSM were examined based on the mean and variance of the conditioned scenario-based spectrum and implicit causal parameters, such as magnitude (M), distance to rupture (R) and epsilon ( ). A random (Rand) selection of ground motion records (from the preliminary set of 911 records) was also considered, representing the lower bound of accuracy of the methodologies under analysis.The various ground motion record selection methods adopted in this work are presented hereafter.
Conditional spectrum – CS
The conditional spectrum method may be shortly defined as a procedure that seeks to the target mean and variance computation of the scenario spectrum, whose spectral accelerations are conditioned at periods of interest (herein the fundamental period). This methods sets the reference for matching of a set of real ground motion records using the disaggregation information, such as the causal earthquake M, R and , and the GMPM (Jayaram and Baker, 2008). Jayaram’s “greedy” optimization
algorithm (Jayaram et al. 2011) was applied for the selection of ground motion records with no control of the scaling factors for the conditioned spectral acceleration.
Conditional mean spectrum – CSM
Baker and Cornell (2006) proposed an innovative method for the selection of ground motion records with the intention to overcome the limitations associated with the conservative adoption of UHS. The CMS method provides the mean response spectrum, conditioned on occurrence of a target spectral acceleration value at the fundamental period, requiring only existing GMPM and PSHA results. In the present study a narrow band of ± one standard deviation was also included, delimiting the lower and upper bounds for matching the target conditional mean spectrum of the scenario. No control of the scaling factor was considered. The fit of records compatible to the CMS was achieved by the Harmony Search (HS) algorithm and its
1758Vulnerability, Uncertainty, and Risk ©ASCE 2014
Vulnerability, Uncertainty, and Risk
Dow
nloa
ded
from
asc
elib
rary
.org
by
Uni
vers
ity o
f C
alif
orni
a, D
avis
on
08/1
4/14
. Cop
yrig
ht A
SCE
. For
per
sona
l use
onl
y; a
ll ri
ghts
res
erve
d.

several variants (Macedo et al. 2013). This algorithm has been implemented in SelEQ developed at the University of Porto (Dias et al. 2010).
Rupture magnitude and source-to-site distance – MR
Possibly one of the most common ground motion selection procedure, the herein termed MR approach aims to minimize the deviation between the disaggregated mean values, of M and R, to the corresponding values of the selected ground motion records. In this study records are selected complying with the minimum deviations to the disaggregated mean M and R, taking into account that only a horizontal component of each record is selected and ensuring that spectral ordinates are not scaled over than 3 times at the fundamental period of the structure.
Epsilon – Eps
Similarly to what was performed in the aforementioned MR method, Eps records were selected so as to minimize the deviations between the ε values for each record and the ε mean value from the scenario, limiting the maximum value of the scaling factor to 3. It is also ensured that only a horizontal component of each record is selected.
Rupture magnitude, source-to-site distance and epsilon – MRE
The MRE procedure minimizes the deviations of the M, R and εvalues for each record and the M, R and ε mean values from the hazard scenario. The same control on the scaling factor and repetition of selected records defined above was considered.
Random – Rand
This selection procedure follows solely the preliminary compatibility with the the local site conditions, such as the geological, tectonic and seismological characteristics. Therefore, records were selected from stable continent and active shallow crustal regions, as well as with similar hazard information (minimum M and R) provided by the studies of Vilanova and Fonseca (2007) and Sousa and Costa (2009). No control on the scaling factors was endorsedin this procedure. RESULTS
The influence of the considered GMSMs on the derivation of the fragility
functions and risk assessment will bepresented in this section. The impact of the number of ground motion records will bealso discussed, as well as the influence of considering different failure criteria. Additionally, the statistical significance of various types of intensity measure and the scaling factor in the definition of the fragility functions will beexamined.
The scenario-based sets of ground motion records were obtained considering 9 intensity levels ranging from 0.1g to 2.0g and a number of 60 records was assumed for each intensity level, that is believed to be an efficient number. In the specific case of the Rand selection method only 55 records have been adopted.A total of 100 random generations of bins with 20 and 40 records was also conducted so as to assess the efficiency of considering this amount of records in the derivation of the fragility functions.Moreover, the fragility functions have been derived by controlling
1759Vulnerability, Uncertainty, and Risk ©ASCE 2014
Vulnerability, Uncertainty, and Risk
Dow
nloa
ded
from
asc
elib
rary
.org
by
Uni
vers
ity o
f C
alif
orni
a, D
avis
on
08/1
4/14
. Cop
yrig
ht A
SCE
. For
per
sona
l use
onl
y; a
ll ri
ghts
res
erve
d.

differentfailure criteria, defined both by local and global engineering demand parameters.In the case of the RC structure the shear and the chord rotation demands were controlled based on the limits proposed in part 3 of Eurocode 8 (CEN, 2005), the global and the inter-storey drifts were checkedassuming the limits established by HAZUS MR5 (2001) and ASCE 41-06 (ASCE, 2007), respectively, and the level of strainsdeveloped in the concrete and the reinforcement steel verifiedby comparisons with the maximum strain values referred in Crowley et al. (2004). In turn, the local deformation demands developed in the steel building were controlled considering the plastic rotation limits proposedin part 3 of Eurocode 8 (EC8-3), while both global and inter-storey drifts were controlled based on the limits defined by HAZUS MR5 and ASCE 41-06, respectively. An additional criterion, assuming the most criticaldemand parameterverifiedfor each intensity level was also adopted for the derivation of the fragility functions for both structures, being designated by Envelope. Finally, three limit states consistent with the ones proposed in EC8-3, namely the damage limitation (DL) limit state, the significant damage (SD) limit state and the near collapse (NC) limit state, were considered. Influence of the various GMSM on fragility functions
Figure 1 depicts the influence of the various GMSMs on the derivation of the
Envelope fragility functions using 60 records for the RC building and the three considered limit states.It may be observed that, on the one hand, the Rand selection method systematically leads to flatter fragility functions at every limit state, resulting in higher probabilities of failure for lower values of spectral acceleration, which is expected to have an important impact in the quantification of the risk, but also, on the other hand, although the MRE, MR and ε selection methods resulted in fragility functions relatively similar, these somehow differ from those obtained by using the reference CS and CMS selection methods. In fact, the two methods lead to similar fragility functions, as it has also been observed for the steel building.It may be interesting to note that for the NC limit state, with the exception of the Rand selection method, all other GMSMs lead to fragility functions with equal median values, but with different levels of dispersion.
Figure 1. Influence of the various GMSMs on the derivation of theEnvelope fragility functions for the RC building.
0 0.5 1 1.5 20
0.2
0.4
0.6
0.8
1
Sa(T1)[g]
Pro
babi
lity
of F
ailu
re
DL Limit State
DLCS
DLCMS
DLEps
DLMRE
DLMR
DLRand
0 0.5 1 1.5 20
0.2
0.4
0.6
0.8
1
Sa(T1)[g]
Pro
babi
lity
of F
ailu
re
SD Limit State
SDCS
SDCMS
SDEps
SDMRE
SDMR
SDRand
0 0.5 1 1.5 20
0.2
0.4
0.6
0.8
1
Sa(T1)[g]
Pro
babi
lity
of F
ailu
re
NC Limit State
NCCS
NCCMS
NCEps
NCMRE
NCMR
NCRand
1760Vulnerability, Uncertainty, and Risk ©ASCE 2014
Vulnerability, Uncertainty, and Risk
Dow
nloa
ded
from
asc
elib
rary
.org
by
Uni
vers
ity o
f C
alif
orni
a, D
avis
on
08/1
4/14
. Cop
yrig
ht A
SCE
. For
per
sona
l use
onl
y; a
ll ri
ghts
res
erve
d.

Influence of the number of GM records on the fragility functions
As mentioned before, the influence of the number of ground motion records in the computation of the fragility functions has been assessed by generating a total of 100 bins of 20 and 40 records for the various GMSMs. The95th percentiles were compared with the reference fragility functions derived using the CS method with 60 records. Figure 2 shows theEnvelopefragility functions obtained for the RC building and the NC limit state. As expected, it may be seen that the increase in the number of records, from 20 to 40,narrowedthe dispersion in the derivation of the fragility functions with respect to the ones obtained using 60 records, being this reduction in the dispersion more evident when adopting the ε, the MRE, the MR and theRand selection methods. Contrarily, the CMS method seems to be less sensitive to the number of records exhibiting a narrower band of dispersion when comparing to the results obtained using 60 records. Still, as the loss estimates are the result of the convolution between the fragility functions and the hazard curve, the interpretation of the results presented in Figure 2 is not totally conclusive of the impact of the number of records on the seismic loss estimates.
Representativeness of the GMSM and number of records in the derivation of the fragility functions
The issue of the bias-variance trade-offs in the estimation of the seismic response parameters has already been addressed by Bradley (2013), wherein it has been recognized that although the use of a larger number of records reduces the variance in the seismic response estimates, in some situations, it may also lead to potential bias in the estimated responses as a result of a biased ensemble of ground motions.Therefore, in order to account for this issue in the derivation of the fragility functions, Figure 3 depicts the representativeness of the GMSMs and the number of records in the definition of the Envelope fragility functions for both steel and RC buildings at the various limit states.
Figure 2. Influence of the number of GM records on the derivation of the
Envelope fragility functions for the RC building.
For such, the Kolmogorov-Smirnov goodness of fit test was used (Bradley, 2013) assuming a theoretical distribution defined by the CS method with 60 records. In fact, it may be seen that at the NC limit state neither the number of records, nor the ground motion scaling methods seem to introduce statistically significant bias in the
1761Vulnerability, Uncertainty, and Risk ©ASCE 2014
Vulnerability, Uncertainty, and Risk
Dow
nloa
ded
from
asc
elib
rary
.org
by
Uni
vers
ity o
f C
alif
orni
a, D
avis
on
08/1
4/14
. Cop
yrig
ht A
SCE
. For
per
sona
l use
onl
y; a
ll ri
ghts
res
erve
d.
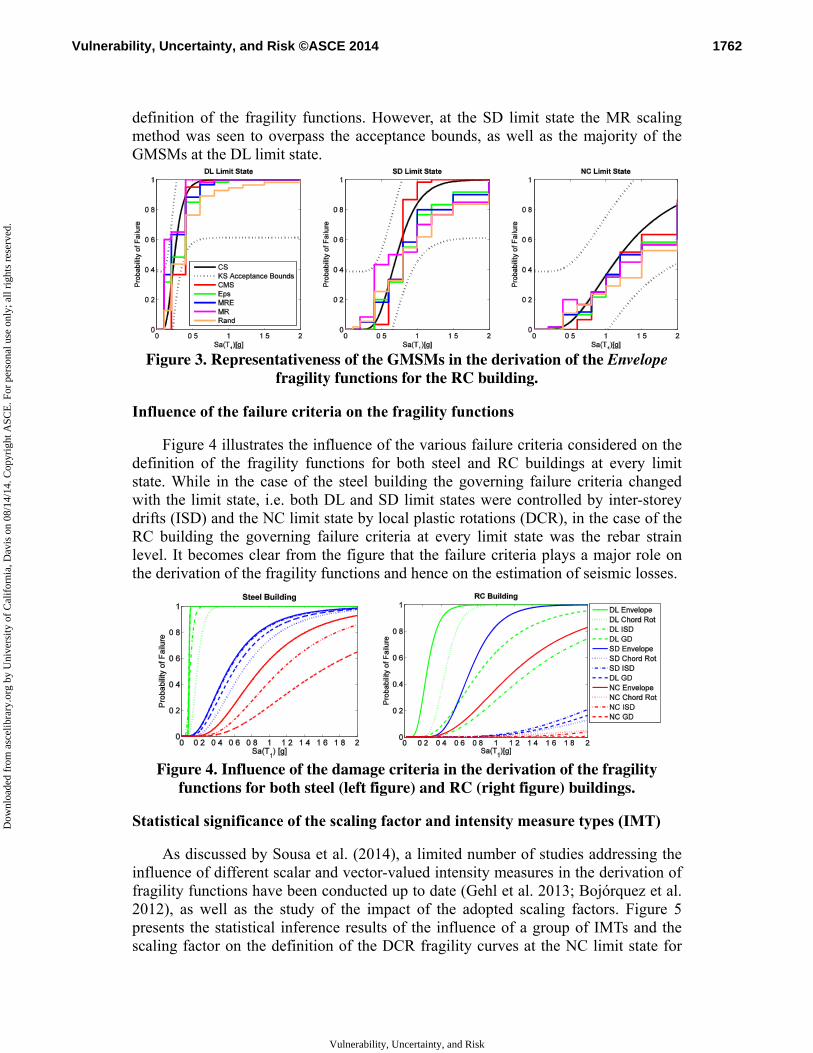
definition of the fragility functions. However, at the SD limit state the MR scaling method was seen to overpass the acceptance bounds, as well as the majority of the GMSMs at the DL limit state.
Figure 3. Representativeness of the GMSMs in the derivation of the Envelope fragility functions for the RC building.
Influence of the failure criteria on the fragility functions
Figure 4 illustrates the influence of the various failure criteria considered on the definition of the fragility functions for both steel and RC buildings at every limit state. While in the case of the steel building the governing failure criteria changed with the limit state, i.e. both DL and SD limit states were controlled by inter-storey drifts (ISD) and the NC limit state by local plastic rotations (DCR), in the case of the RC building the governing failure criteria at every limit state was the rebar strain level. It becomes clear from the figure that the failure criteria plays a major role on the derivation of the fragility functions and hence on the estimation of seismic losses.
Figure 4. Influence of the damage criteria in the derivation of the fragility functions for both steel (left figure) and RC (right figure) buildings.
Statistical significance of the scaling factor and intensity measure types (IMT)
As discussed by Sousa et al. (2014), a limited number of studies addressing the influence of different scalar and vector-valued intensity measures in the derivation of fragility functions have been conducted up to date (Gehl et al. 2013; Bojórquez et al. 2012), as well as the study of the impact of the adopted scaling factors. Figure 5 presents the statistical inference results of the influence of a group of IMTs and the scaling factor on the definition of the DCR fragility curves at the NC limit state for
1762Vulnerability, Uncertainty, and Risk ©ASCE 2014
Vulnerability, Uncertainty, and Risk
Dow
nloa
ded
from
asc
elib
rary
.org
by
Uni
vers
ity o
f C
alif
orni
a, D
avis
on
08/1
4/14
. Cop
yrig
ht A
SCE
. For
per
sona
l use
onl
y; a
ll ri
ghts
res
erve
d.

the steel building using a logistic regression analysis.Only the IMTs that were seen to have higher statistical significance on the definition of the DCR fragility functions, given by a p-value of the estimated slope coefficient (β) smaller than 5% (Baker and Cornell, 2005; Tothong and Luco, 2007), are herein presented. Moreinformation on the description of each IMT adopted may be found in Sousa et al. (2014) and Bojórquez et al. (2012). It was concluded that the scaling factor has no statistical significance in the definition of the DCR fragility curves at the NC limit state and,additionally, that the spectral acceleration, namely for Sa (T1)=0.6g and Sa (T1)=0.8g, seems to be insufficient with respect to the ground motion duration (tD), the root-mean-square velocity (vRMS), the spectrum intensity (SI), the mean period of the ground motion (Tm) (Kumar et al. 2011) and the vector-valued RT1,T2 and Np parameters (Bojórquez et al. 2012). Thus, the use of more than one IMT in addition to the spectral acceleration in the ground motion selection process may lead to a better prediction of the damage state.
Figure 5. Statistical significance of the scale factor and IMT in the derivation of the DCR fragility functions at the NC limit state for the steel building.
Impact of the various GMSMs and number of records on the risk assessment
Figure 6 depicts the influence of the use of the various GMSMs and number of records on the risk assessment of the RC building for a 50 years time interval. It may be seen that, whereas the MR, MRE, and Rand ground motion methods are significantly influenced by the number of records, thus leading to a high dispersion in the quantification of risk, the CS and CMS methods lead to systematically similar results at the various limit states. Additionally, as already presented in Figure 4, the
5 10 150
0.2
0.4
0.6
0.8
1Sa(T1)=0.4g
Pro
babi
lity
of F
ailu
re
Scale Factor5 10 15
0
0.2
0.4
0.6
0.8
1Sa(T1)=0.6g
Pro
babi
lity
of F
ailu
re
Scale Factor5 10 15
0
0.2
0.4
0.6
0.8
1Sa(T1)=0.8g
Pro
babi
lity
of F
ailu
re
Scale Factor5 10 15
0
0.2
0.4
0.6
0.8
1Sa(T1)=1g
Pro
babi
lity
of F
ailu
re
Scale Factor5 10 15
0
0.2
0.4
0.6
0.8
1Sa(T1)=1.2g
Pro
babi
lity
of F
ailu
re
Scale Factor5 10 15
0
0.2
0.4
0.6
0.8
1Sa(T1)=1.5g
Pro
babi
lity
of F
ailu
re
Scale Factor5 10 15
0
0.2
0.4
0.6
0.8
1Sa(T1)=2g
Pro
babi
lity
of F
ailu
re
Scale Factor
=0p-value=1
=0.07p-value=0.08
=0.05p-value=0.15
=-0.04p-value=0.3
=0.05p-value=0.2
=0.04p-value=0.23
=-0.01p-value=0.71
0.2 0.4 0.6 0.8 1 1.2 1.40
0.2
0.4
0.6
0.8
1Sa(T1)=0.4g
Pro
babi
lity
of F
ailu
re
Tm0.2 0.4 0.6 0.8 1 1.2 1.4
0
0.2
0.4
0.6
0.8
1Sa(T1)=0.6g
Pro
babi
lity
of F
ailu
re
Tm0.2 0.4 0.6 0.8 1 1.2 1.4
0
0.2
0.4
0.6
0.8
1Sa(T1)=0.8g
Pro
babi
lity
of F
ailu
re
Tm0.2 0.4 0.6 0.8 1 1.2 1.4
0
0.2
0.4
0.6
0.8
1Sa(T1)=1g
Pro
babi
lity
of F
ailu
re
Tm0.2 0.4 0.6 0.8 1 1.2 1.4
0
0.2
0.4
0.6
0.8
1Sa(T1)=1.2g
Pro
babi
lity
of F
ailu
re
Tm0.2 0.4 0.6 0.8 1 1.2 1.4
0
0.2
0.4
0.6
0.8
1Sa(T1)=1.5g
Pro
babi
lity
of F
ailu
re
Tm0.2 0.4 0.6 0.8 1 1.2 1.4
0
0.2
0.4
0.6
0.8
1Sa(T1)=2g
Pro
babi
lity
of F
ailu
re
Tm
=0p-value=1
=0.93p-value=0.42
=3.05p-value=0.01
=0.57p-value=0.57
=1.22p-value=0.25
=1.58p-value=0.08
=1.23p-value=0.19
0.4 0.6 0.80
0.2
0.4
0.6
0.8
1Sa(T1)=0.4g
Pro
babi
lity
of F
ailu
re
RT1,T2
0.4 0.6 0.80
0.2
0.4
0.6
0.8
1Sa(T1)=0.6g
Pro
babi
lity
of F
ailu
re
RT1,T2
0.4 0.6 0.80
0.2
0.4
0.6
0.8
1Sa(T1)=0.8g
Pro
babi
lity
of F
ailu
re
RT1,T2
0.4 0.6 0.80
0.2
0.4
0.6
0.8
1Sa(T1)=1g
Pro
babi
lity
of F
ailu
re
RT1,T2
0.4 0.6 0.80
0.2
0.4
0.6
0.8
1Sa(T1)=1.2g
Pro
babi
lity
of F
ailu
re
RT1,T2
0.4 0.6 0.80
0.2
0.4
0.6
0.8
1Sa(T1)=1.5g
Pro
babi
lity
of F
ailu
re
RT1,T2
0.4 0.6 0.80
0.2
0.4
0.6
0.8
1Sa(T1)=2g
Pro
babi
lity
of F
ailu
re
RT1,T2
=0p-value=1
=1.07p-value=0.54
=2.86p-value=0.06
=1.31p-value=0.39
=1.14p-value=0.52
=3.36p-value=0.03
=-0.62p-value=0.6
0.4 0.6 0.80
0.2
0.4
0.6
0.8
1Sa(T1)=0.4g
Pro
babi
lity
of F
ailu
re
Np
0.4 0.6 0.80
0.2
0.4
0.6
0.8
1Sa(T1)=0.6g
Pro
babi
lity
of F
ailu
re
Np
0.4 0.6 0.80
0.2
0.4
0.6
0.8
1Sa(T1)=0.8g
Pro
babi
lity
of F
ailu
re
Np
0.4 0.6 0.80
0.2
0.4
0.6
0.8
1Sa(T1)=1g
Pro
babi
lity
of F
ailu
re
Np
0.4 0.6 0.80
0.2
0.4
0.6
0.8
1Sa(T1)=1.2g
Pro
babi
lity
of F
ailu
re
Np
0.4 0.6 0.80
0.2
0.4
0.6
0.8
1Sa(T1)=1.5g
Pro
babi
lity
of F
ailu
re
Np
0.4 0.6 0.80
0.2
0.4
0.6
0.8
1Sa(T1)=2g
Pro
babi
lity
of F
ailu
re
Np
=0p-value=1
=2.58p-value=0.33
=8.93p-value=0
=4.28p-value=0.08
=2.27p-value=0.39
=4.91p-value=0.03
=-1.71p-value=0.23
1763Vulnerability, Uncertainty, and Risk ©ASCE 2014
Vulnerability, Uncertainty, and Risk
Dow
nloa
ded
from
asc
elib
rary
.org
by
Uni
vers
ity o
f C
alif
orni
a, D
avis
on
08/1
4/14
. Cop
yrig
ht A
SCE
. For
per
sona
l use
onl
y; a
ll ri
ghts
res
erve
d.

failure criteria was also seen to be an important source of variability in the risk assessment process.
Damage Criteria Mean Values 95th and 5th percentiles
Figure 6. Impact of the various GMSMs and number of records in the risk
assessment for the RC building and 50 years.
CONCLUSIONS
In this paper a comparison between various ground motion selection methods (GMSM) was presented in the context of seismic loss estimation. The influence of using different number of records and failure criteria was examined, as well as the statistical significance of the scaling factor and intensity measure types (IMT) in the derivation of the fragility functions.
It becomes clear from this study that special care should be taken when theselection of the ground motions is simply conducted by conditioning the characteristics of the earthquake defined in terms of magnitudes (M), distances (R) and epsilon (ε), while, in turn, the CS and the CMS methods were seen to systematically lead to similar results, without being significantly affected by the number of ground motion records. Still, further studies on theseissues are deemed necessary. Additionally,it was shown that the selection of different failure criteria in the derivation of the fragility functions is an important source of bias in the quantification of seismic risk.
1764Vulnerability, Uncertainty, and Risk ©ASCE 2014
Vulnerability, Uncertainty, and Risk
Dow
nloa
ded
from
asc
elib
rary
.org
by
Uni
vers
ity o
f C
alif
orni
a, D
avis
on
08/1
4/14
. Cop
yrig
ht A
SCE
. For
per
sona
l use
onl
y; a
ll ri
ghts
res
erve
d.

AKNOWLDGEMENTS This work has been performed within the framework of the research project PTDC/ECM-EST/3062/2012 ‘Earthquake loss of the Portuguese building stock’ funded by the Foundation of Science and Technology (FCT) of Portugal. REFERENCES
Akkar, S. & J. J. Bommer (2010). "Empirical equations for the prediction of PGA, PGV, and spectral accelerations in Europe, the Mediterranean region, and the Middle East." Seismological Research Letters 81(2): 195-206.
Araújo, M., Macedo, L., Castro, J.M.& Delgado, R. (2013). “Influence of code-based record selections methods on the seismic assessment of existing steel buildings”. 4th COMPDYN, Kos Island, Greece.
ASCE (2007). “Seismic rehabilitation of existing buildings (ASCE/SEI 41-06)”. American Society of Civil Engineers, Reston, Virginia, USA.
Atkinson, G. M. & D. M. Boore (2006). "Earthquake ground-motion prediction equations for eastern North America." Bulletin of the Seismological Society of America 96(6): 2181-2205.
Ay, B. Ö. & S. Akkar (2012). "A procedure on ground motion selection and scaling for nonlinear response of simple structural systems." Earthquake Engineering and Structural Dynamics 41(12): 1693-1707.
Baker, J. W. (2010). "Conditional mean spectrum: Tool for ground-motion selection." Journal of Structural Engineering 137(3): 322-331.
Baker, J. W. & C. A. Cornell (2005). "A vector‐valued ground motion intensity measure consisting of spectral acceleration and epsilon." Earthquake Eng. and Structural Dynamics 34(10): 1193-1217.
Baker, J. W. & C. A. Cornell (2006). "Spectral shape, epsilon and record selection." Earthquake Engineering Structural Dynamics 35(9): 1077-1095.
Bojórquez, E., Iervolino, I., Reyes-Slazar, A. & Ruiz, S., (2012). “Comparing vector-valued intensity measures for fragility analysis of steel frames in the case of narrow-band ground motions.” Eng. Structures, 45, 472-480.
Bommer, J. J. & A. B. Acevedo (2004). "The use of real earthquake accelerograms as input to dynamic analysis." Journal of Earthquake Engineering 8(spec01): 43-91.
Bradley, B. (2013). “A critical examination of seismic response uncertainty analysis in earthquake engineering”. Earthquake Engineering and Structural Dynamics, 42, 1717-1729.
Bradley, B. A. (2010). "A generalized conditional intensity measure approach and holistic ground‐motion selection." Earthquake Engineering and Structural Dynamics 39(12): 1321-1342.
CEN (2005). “ENV 1998-3 Eurocode 8: Design of structures for earthquake resistance – Part 3: Assessment and retrofitting of buildings”. European Committee for Standardization, Brussels, Belgium.
Cornell, C. A., et al. (2002). "Probabilistic basis for 2000 SAC Federal Emergency Management Agency steel moment frame guidelines." Journal of Structural Engineering 128(4): 526-533.
Crowley, H., Pinho, R. &Bommer, J. (2004). “A probability displacement-based vulnerability assessment procedure for earthquake loss estimation”. Bulletin of Earthquake Engineering, 2, 173-219.
Dias, J., Castro, J. M., Romão, X., Gonçalves, M.& Lopes, J. C. (2010). “SelEQ: a web-based application for the selection of earthquake ground motions for structural analysis”. 14th Euro. Conference on Earthquake Eng.
Gehl, P., Seyedi, D. M. & Douglas, J. (2013). “Vector-valued fragility functions for seismic risk evaluation.” Bulletin of Earthquake Engineering 11:365-384.
Haselton, C. B., et al. (2009). "Evaluation of ground motion selection and modification methods: Predicting median interstory drift response of buildings." PEER Report 2009 1.
HAZUS – MH MR5 (2001). “Technical and user’s manual”. Federal Emergency Management Agency, Washington DC, Maryland, USA.
Jayaram, N., et al. (2011). "A computationally efficient ground-motion selection algorithm for matching a target response spectrum mean and variance." Earthquake Spectra 27(3): 797-815.
Kumar, M., Castro, M., Stafford, P. & Elghazouli, A. (2011). “Influence of the mean period of ground motion on the inelastic dynamic response of single and MDOF systems”. Earthq. Eng.& Struct. Dynamics, 40, 237-256.
Macedo, L.; Araújo, M. & Castro, J.M (2013). "Assessment and calibration of the Harmony Search algorithm for earthquake record selection". VEESD - Recent Advances in Earthquake Eng. and Structural Dynamics.
Monelli, D., M. Pagani, G. A. Weatherill, V. Silva, & H. Crowley. "The hazard component of OpenQuake: the calculation engine of the Global Earthquake Model." 15th W.C. on Earthquake Engineering. 2012.
Silva, V., Crowley, H., Varum, H., Pinho, R. & Sousa, L. (2014). “Development of a Fragility Model for Moment-frame RC buildings in Portugal”, 2nd ICVRAM, Liverpool, UK.
Silva, V. (2013). Development of open models and tools for seismic risk assessment: application to Portugal. PhD.
Sousa, L., Silva, V., Marques, M., Crowley, H. & Pinho, R. (2014). “Including multiples IMT in the development of fragility functions for earthquake loss estimation”, 2nd ICVRAM, Liverpool, UK.
1765Vulnerability, Uncertainty, and Risk ©ASCE 2014
Vulnerability, Uncertainty, and Risk
Dow
nloa
ded
from
asc
elib
rary
.org
by
Uni
vers
ity o
f C
alif
orni
a, D
avis
on
08/1
4/14
. Cop
yrig
ht A
SCE
. For
per
sona
l use
onl
y; a
ll ri
ghts
res
erve
d.

Sousa, M. L. &Costa, A.C. (2009). "Ground motion scenarios consistent with probabilistic seismic hazard disaggregation analysis. Application to Mainland Portugal." Bull. of Earthquake Eng. 7(1): 127-147.
Tothong, P. & Luco, N. (2007). “Probabilistic seismic demand analysis using advanced ground motion intensity measures”. Earthquake Engineering and Structural Dynamics, 36, 1837-1860.
Vamvatsikos, D. (2013). "Derivation of new SAC/FEMA performance evaluation solutions with second-order hazard approximation." Earthquake Engineering and Structural Dynamics 42(8): 1171-1188.
Vilanova, S. P. & J. F. Fonseca (2007). "Probabilistic seismic-hazard assessment for Portugal." Bull. of the Seismological Society of America 97(5): 1702-1717.
1766Vulnerability, Uncertainty, and Risk ©ASCE 2014
Vulnerability, Uncertainty, and Risk
Dow
nloa
ded
from
asc
elib
rary
.org
by
Uni
vers
ity o
f C
alif
orni
a, D
avis
on
08/1
4/14
. Cop
yrig
ht A
SCE
. For
per
sona
l use
onl
y; a
ll ri
ghts
res
erve
d.