American Politics Research 2010 Sides 502 30 (1)
30
http://apr.sagepub.com/ American Politics Research http://apr.sagepub.com/content/38/3/502 The online version of this article can be found at: DOI: 10.1177/1532673X09336832 2009 2010 38: 502 originally published online 3 October American Politics Research John Sides, Keena Lipsitz and Matthew Grossmann Do Voters Perceive Negative Campaigns as Informative Campaigns? Published by: http://www.sagepublications.com can be found at: American Politics Research Additional services and information for http://apr.sagepub.com/cgi/alerts Email Alerts: http://apr.sagepub.com/subscriptions Subscriptions: http://www.sagepub.com/journalsReprints.nav Reprints: http://www.sagepub.com/journalsPermissions.nav Permissions: http://apr.sagepub.com/content/38/3/502.refs.html Citations: What is This? - Oct 3, 2009 OnlineFirst Version of Record - May 18, 2010 Version of Record >> at Uni Babes-Bolyai on May 14, 2014 apr.sagepub.com Downloaded from at Uni Babes-Bolyai on May 14, 2014 apr.sagepub.com Downloaded from
-
Upload
oana-cristina-font -
Category
Documents
-
view
214 -
download
1
description
american
Transcript of American Politics Research 2010 Sides 502 30 (1)

http://apr.sagepub.com/American Politics Research
http://apr.sagepub.com/content/38/3/502The online version of this article can be found at:
DOI: 10.1177/1532673X09336832
2009 2010 38: 502 originally published online 3 OctoberAmerican Politics Research
John Sides, Keena Lipsitz and Matthew GrossmannDo Voters Perceive Negative Campaigns as Informative Campaigns?
Published by:
http://www.sagepublications.com
can be found at:American Politics ResearchAdditional services and information for
http://apr.sagepub.com/cgi/alertsEmail Alerts:
http://apr.sagepub.com/subscriptionsSubscriptions:
http://www.sagepub.com/journalsReprints.navReprints:
http://www.sagepub.com/journalsPermissions.navPermissions:
http://apr.sagepub.com/content/38/3/502.refs.htmlCitations:
What is This?
- Oct 3, 2009 OnlineFirst Version of Record
- May 18, 2010Version of Record >>
at Uni Babes-Bolyai on May 14, 2014apr.sagepub.comDownloaded from at Uni Babes-Bolyai on May 14, 2014apr.sagepub.comDownloaded from
American Politics Research38(3) 502 –530
© The Author(s) 2010Reprints and permission: http://www. sagepub.com/journalsPermissions.nav
DOI: 10.1177/1532673X09336832http://apr.sagepub.com
Do Voters Perceive Negative Campaigns as Informative Campaigns?
John Sides1, Keena Lipsitz2, and Matthew Grossmann3
Abstract
We argue that citizens distinguish the tone of a campaign from the quality of information that it provides and that evaluations on each dimension respond differently to positive and negative political advertising. We test these claims using survey and advertising data from the 2000 presidential campaign and two 1998 gubernatorial races. In each race, citizens separate judgments about the tone of a campaign from judgments about the quality of information they have received. Furthermore, negative campaigning affects the former, but not the latter, set of evaluations. These results have implications for the debate over the impact of negative advertising and for how citizens perceive campaigns as political processes.
Keywords
elections, political campaigns, political advertising, negative advertising, voting
Campaigns are key political moments because they bring citizens and leaders in closer contact and provide citizens opportunities to learn about and choose among those who want to represent them. Scholars have lauded campaigns for their ability to communicate information that helps citizens make voting decisions. At the same time, the conventional wisdom goes, Americans dis-like campaigns, and negative campaigning—the criticisms that candidates make of one another—is a primary cause of this aversion.
1George Washington University, Washington, DC2CUNY-Queens College, Flushing3Michigan State University, East Lansing
Corresponding Author:John Sides, 2115 G Street, NW, Suite 440, Washington, DC 20052e-mail: [email protected].
at Uni Babes-Bolyai on May 14, 2014apr.sagepub.comDownloaded from

Sides et al. 503
Despite, or perhaps because of, the ubiquity of this conventional wisdom, we know little about how citizens view campaigns. Although it is easy to elicit derisive statements from citizens about campaigns, the mere existence of these sentiments does not mean that citizens’ views are reducible to a simple and inevitable aversion or that negative campaigning is to blame. The lack of scholarly consensus about campaign effects—such as the conse-quences of negative campaigning for voter participation—suggests that we have much to learn about how citizens view and respond to campaigns.
One promising way to address this gap is to broaden the question. Rather than investigating how campaign activities affect candidate evaluations or electoral participation, we investigate how citizens evaluate campaigns. In particular, we focus on how citizens evaluate the tone of campaigns and the information they provide. Are perceptions of tone and “informativeness” loosely connected in the minds of citizens or are they more tightly linked, such that, for example, citizens who perceive the campaign as negative also perceive it as less informative? Moreover, how are perceptions related to the content of the campaign itself ? As the campaign becomes more positive or negative, do citizens perceive that its tone has changed and, more impor-tantly, do they reevaluate the quality of the information that the campaign is providing? Answers to these questions will suggest an answer to a more fun-damental question: Can negative campaigns be informative campaigns?
These questions have both theoretical and normative implications. First, the question of how citizens feel about campaigns is arguably prior to the much addressed, but largely inconclusive, relationship between negative campaigning and voter turnout. Knowing more about how citizens evaluate campaigns may help explain the lack of a conclusive answer. For example, although citizens may notice negative campaigning when it occurs, and label it as such, they may actually find it useful. If the information it conveys is perceived as relevant, then citizens’ belief that the campaign is negative should not discourage them from voting. Our analysis thus speaks directly to a hypothesis that is often taken as fact, especially when scholars and journal-ists suggest that negative campaigning lowers turnout, but has rarely been subjected to direct empirical scrutiny: the more negatively candidates cam-paign, the less favorably citizens evaluate how they are campaigning.
Second, the results of our analysis speak to “revisionist” views of negative campaigning. In these accounts, negative campaigning provides citizens with valuable information about the candidates’ views on key issues and with detailed evidence to back up these claims (Geer, 2006). Negative campaigning thus facilitates comparisons between the candidates and, ultimately, a more informed choice on election day. If citizens exposed to negative campaigning
at Uni Babes-Bolyai on May 14, 2014apr.sagepub.comDownloaded from

504 American Politics Research 38(3)
actually find the campaign more informative, then these contrarian scholarly accounts will seem more persuasive than the conventional belief that citizens unequivocally disdain negative campaigning.
Finally, the content and sources of campaign evaluations will illuminate what citizens value in campaigns. Although there is an extensive literature on people’s attitudes toward government and governance (e.g., Hetherington, 2005; Hibbing & Theiss-Morse, 2002), campaigns have received far less attention in this respect, even though they are moments during which citizens pay unusually close attention to politics. Knowing how people evaluate cam-paigns is also important because those evaluations have normative implica-tions for how people feel about politics generally. Studying these evaluations may therefore suggest ways to improve campaigns as political processes.
The Structure of Campaign EvaluationsLittle research speaks to the potentially numerous factors that might affect evaluations of campaigns; as West (2005) notes, “Studies of the effects of ads have rarely paid much attention to the dimensions of evaluation” (p. 43). This oversight may be explained by the fact that some influential research implies (but does not substantiate) a simple hypothesis: that citizens evaluate cam-paigns on a single dimension. In other words, a campaign’s many stimuli—ads, debates, media coverage, other events—are distilled into an overall global assessment. As Ansolabehere and Iyengar (1995) write,
Viewers may learn from the mudslinging and name-calling that politi-cians in general are cynical, uncivil, corrupt, incompetent, and untrust-worthy. Campaigns that generate more negative than positive messages may leave voters embittered toward the candidates and the rules of the game. (p. 110)
Thus, citizens’ distaste for negativity affects how they view the candidates, politicians, and perhaps politics in general, which leads to negative advertis-ing’s demobilizing effect. Most important from our perspective, this research suggests that citizens’ (low) evaluations of the campaign’s tone “spill over” and affect their assessments of other aspects of the campaign.
We believe that citizens’ campaign evaluations are more nuanced than this hypothesis suggests and that they distinguish at least two dimensions of cam-paign communication: its tone and its informativeness.1 Tone captures how negative or positive the campaign is. Increasingly, commentary during elec-tions—among candidates and journalists alike—revolves around whether
at Uni Babes-Bolyai on May 14, 2014apr.sagepub.comDownloaded from

Sides et al. 505
and how much negativity exists (see Geer, 2006). Candidates accuse each other of unfair attacks. Journalists portray the campaign as a battlefield on which opposing sides lob slings and arrows. The increasingly extensive dis-course about negativity has likely heightened citizens’ attention to negativity in campaigns. In a 1996 Markle Foundation poll, “less negative campaign-ing” was the second most desired reform to campaigns. A bevy of other poll-ing data suggests that citizens are more than willing to express opinions about negative campaigning, with most condemning it outright.2 This sug-gests that citizens are taking note when candidates promote themselves or attack their opponents. The second dimension concerns an important func-tion of campaigns: to provide information to citizens. Although most citizens approach elections with preexisting partisan leanings, issue positions, and often with at least some prior knowledge of the candidates, they express a desire to learn more (Lipsitz, Trost, Grossman, & Sides, 2005), and cam-paigns appear to help them do so (Arceneaux, 2006; Freedman, Franz, & Goldstein, 2004). In the Markle Foundation poll, the most desired reform was “more honesty and information from candidates.” Thus, it seems likely that citizens are attentive to the quality of the information they receive in campaigns.
One might argue that citizens are not sophisticated or attentive enough to evaluate campaigns along more than one dimension. But such distinctions are evident with regard to other political objects. For example, citizens dif-ferentiate candidates in terms of multiple traits (Kinder, 1986). This multidi-mensionality is facilitated by the second key fact: Political attitudes are frequently characterized by ambivalence—that is, by the presence of both positive and negative dispositions toward the object of an attitude. Assess-ments of candidates are one important example (McGraw, Hasecke, & Con-ger, 2003; Meffert, Guge, & Lodge, 2004). If citizens can simultaneously believe that political figures have both good and bad qualities, then they may evaluate campaigns in a similar fashion.
How should assessments of the campaign’s tone and informativeness be related? If people believe that negative campaigns are inherently lacking in substance, then a perception that the campaign is negative will be associated with a perception that it is uninformative. However, content analysis of cam-paign advertising suggests negative advertisements are in fact more likely than positive advertisements to focus on policy-related issues, to contain spe-cific evidence for their claims, and to be “more useful than positive appeals in informing the public about the pressing concerns of the day” (Geer, 2006, p. 63; see also Brader, 2006; Jamieson, Waldman, & Sherr, 2000; Mayer,
at Uni Babes-Bolyai on May 14, 2014apr.sagepub.comDownloaded from
506 American Politics Research 38(3)
1996; West, 2005). Thus, a campaign might be simultaneously negative and informative. Citizens, and not just scholars, should be able to recognize this.
Moreover, some research on the processing of negative messages suggests that judgments about a campaign’s tone and informativeness will be distinct. The theory of “affective intelligence” is particularly relevant (Marcus, Neuman, & MacKuen, 2000). Affective intelligence theory posits relationships between the tenor of messages, the emotional reactions those messages pro-voke, and the behavioral consequences of those emotions. More specifically, it argues that negative messages produce anxiety and fear and that these emo-tions automatically activate the higher cognitive faculties involved in search-ing for more information.3 This search for information may extend well beyond the message that provoked the fear response to the larger information environment (Brader, 2006, p. 135).
Thus, in the context of campaigning, the overall quality of a person’s information environment, not simply the campaign’s tone, should determine whether he or she believes the campaign is informative. If the broader envi-ronment provides useful information, then he or she may say that the cam-paign has been negative, but informative—exactly as content analyses of campaign advertising would predict. But if the information encountered is unhelpful, then he or she may find the campaign both negative and uninfor-mative, a view that dovetails with conventional wisdom and contradicts accounts such as Geer’s.4 If, over the course of a campaign, both outcomes result—varying, perhaps, over time or across messages or individuals—then in the aggregate voter judgments about tone and informativeness will be unrelated. Some research suggests such a null relationship because people are able to provide examples of both negative and positive advertisements that are informative and uninformative (Freedman, Wood, & Lawton, 1999; Lipsitz et al., 2005). For this reason, these two dimensions of evaluation may not evince any systematic relationship.
Finally, how will each dimension of evaluation be related to the tone of the campaign? As the candidates “go negative” or take the high road, how do citi-zens’ evaluations respond? We first consider evaluations of the campaign’s tone itself. Some scholars have argued that citizens’ perceptions of negativity may not correspond to the actual tone of campaigns, at least as it is defined and measured by scholars (Sigelman & Kugler, 2003). We expect a stronger rela-tionship between the campaign’s tone and perceptions of negativity. Although citizens may disagree about whether a given piece of campaign information is negative, the pervasive discourse about negativity means they will more often agree about when the candidates are being negative. For example, it is difficult to argue that Lyndon Johnson’s infamous “Daisy” ad was positive or
at Uni Babes-Bolyai on May 14, 2014apr.sagepub.comDownloaded from
Sides et al. 507
that Ronald Reagan’s “Morning Again in America” ad, which featured images of happy families moving into new homes and young couples getting married, was negative. People may disagree about whether negative cam-paigning is acceptable or fair (see Stevens, Sullivan, Allen, & Alger, 2008), but that question is different from those addressed here. We expect citizens’ perceptions of the level of negativity to be systematically related to the actual level of negativity of campaign advertising.
It is less likely, however, that a campaign’s tone will affect evaluations of informativeness. In general, although negative messages may be more infor-mative than positive information, at least by certain criteria (Geer, 2006), there remains considerable variability in the perceived informational value of negative and positive messages. To citizens, some negative messages may illuminate crucial shortcomings of the targeted candidate, but other negative messages may constitute shallow attacks. Some positive information may illuminate a candidate’s agenda and issue positions, but other positive infor-mation may consist of vague statements about a candidate’s values. Although citizens can distinguish between self-promotion and criticism, they will not find either systematically helpful or unhelpful. For example, Brooks and Geer (2007) find little difference in the informational value that subjects saw in positive ads and civil negative ads.
In sum, we expect people to evaluate campaigns along at least two dimensions—tone and informativeness—and the evaluations of these two dimensions should not be systematically related. Second, the actual level of negativity in a campaign should be clearly associated with percep-tions of tone but not with perceptions of informativeness.5
Research Design and DataTo investigate these expectations, we need data that contain multiple indica-tors of campaign evaluations and that provide analytical leverage on the rela-tionship between evaluations and campaign messages. We draw on public opinion data from three rolling cross-sectional surveys commissioned by the Annenberg School for Communication at the University of Pennsylvania. The surveys were conducted during three campaigns: the 1998 California and Illinois gubernatorial races and the 2000 presidential race. The surveys in California and Illinois served as pilot studies for the considerably larger 2000 National Annenberg Election Study (NAES; see Johnston, Hagen, & Jamie-son, 2004). Because the design of these surveys relies on daily interviews of separate cross-sections, their granularity is fine enough to track changes in opinion very closely and to capture the impact of campaign messages on
at Uni Babes-Bolyai on May 14, 2014apr.sagepub.comDownloaded from

508 American Politics Research 38(3)
opinion (see Johnston & Brady, 2002; Romer, Kenski, Waldman, Adasie-wicz, & Jamieson, 2004). In California and Illinois, the Annenberg Survey sampled respondents in the San Francisco Bay Area and Chicago media mar-kets, respectively, from September 22 to November 2, 1998. The total sample size was 2,902 in California and 613 in Illinois. During the 2000 presidential race, the NAES was in the field for nearly a year. We rely on the subset of the NAES interviewed between July 18 and November 6, 2000 (N = 34,391); this period of time captures the vast majority of general election campaigning.
Taken together, these surveys allow us to assess the structure and origins of evaluations across different types of elections (gubernatorial vs. presidential) and in different years (1998 vs. 2000). Even the two gubernatorial races were quite distinct. The California race featured the Democratic Lieutenant Gover-nor, Gray Davis and the Republican Attorney General, Dan Lungren. Davis won handily, garnering 60% of the vote. The Illinois race featured Democratic Congressman Glenn Poshard and Republican Secretary of State George Ryan. Ryan won the election with a narrow margin, garnering 52% of the vote. Ryan outspent Poshard nearly three to one but was hurt by a scandal. That the three Annenberg surveys were conducted during dissimilar races enhances the gen-eralizability of our findings.6
All three surveys asked respondents to assess the campaign’s negativity and informativeness. Before answering the questions on the California and Illinois surveys, respondents were randomly assigned to one of three condi-tions. The first condition referred to “the candidates for governor” and did not specify either candidate by name. The second condition referred to the Republican (Lungren or Ryan), and the third to the Democrat (Davis or Poshard). The battery of questions began “Thinking about the [candidates for governor/governor’s race], overall, would you say the [candidates for gover-nor are/[name], the Republican, is/[name], the Democrat, is] . . .” The ques-tion wording of the specific measures was
• Useful information: “. . . giving voters a great deal of useful information, some, not too much, or no useful information at all?”
• Negative: “. . . conducting a campaign that is very, somewhat, not too, or not very negative?”
• Criticizing: “How much time would you say the [candidates for governor are/Lungren is/Davis is] spending criticizing [their/his] opponent? A great deal of time, some, not too much, or aren’t they doing this at all?”
All the responses were recoded so that higher values indicate more favor-able feelings toward the candidates—that is, more useful information, less negative, and less time spent criticizing.
at Uni Babes-Bolyai on May 14, 2014apr.sagepub.comDownloaded from

Sides et al. 509
In the 2000 NAES, the last item (criticizing) was repeated verbatim. The other relevant items were not identical to those in the two pilot studies, but tap similar impressions.
• Plans Once Elected: “Thinking about what the candidates for president are saying, how much time would you say they are spending talking about what they themselves would do if elected? A great deal of time, some, not too much, or aren’t they doing this at all?”
• Policy Issues: “Thinking about what the candidates for president are say-ing, how much time would you say they are spending talking about policy issues? A great deal of time, some, not too much, or aren’t they doing this at all?”
• Negative: “Which of the major presidential candidates’ campaigns, if any, do you think has been too negative or nasty this year? George W. Bush’s, Al Gore’s, both or neither?”
The first two items speak to the potential informativeness of the cam-paign. “What they themselves would do if elected” and “policy issues” are the kinds of things that citizens deem most useful (Lipsitz et al., 2005). The last item—“negative or nasty”—provides another opportunity to observe whether citizens’ perceptions of the campaign tone derive from the actual campaign tone.7
To measure campaign messages, and in particular the campaign’s tone, we rely on televised political advertising. For California and Illinois, we pur-chased data originally collected by the Campaign Media Analysis Group (CMAG).8 For the presidential race, we draw on data from the Wisconsin Advertising Project, which collated, cleaned, and coded the CMAG data for public dissemination. For the California race, the CMAG data span the period from September 7 to November 2, 1998. During this period, Davis and Lungren aired a total of 3,609 advertisements in the San Francisco market.9 Davis aired the majority of these (1,847 vs. 1,762). For the Illinois race, the CMAG data span the period from July 7 to November 2, 1998. During this period, Ryan and Poshard aired 2,372 advertisements in the Chicago market, of which Ryan aired the vast majority (1,735). During the 2000 presidential general election, Bush and Gore aired a total of 100,258 ads, with Bush airing somewhat more than Gore (55,286 vs. 44,972).10
To measure tone we coded each claim in the ad as referring to the candi-date sponsoring the ad (a positive claim) or to the opponent (a negative claim). Coding the claim as opposed to the entire advertisement provides a more nuanced reading of the ad’s content (see Geer, 2006; Jamieson et al., 2000) and avoids slippery assessments of whether an entire ad can be catego-rized positive, negative, or some combination thereof (i.e., “contrast” ads).11
at Uni Babes-Bolyai on May 14, 2014apr.sagepub.comDownloaded from
510 American Politics Research 38(3)
Having coded the ads in this fashion, we counted the number of positive and negative claims that aired on each day (by multiplying the number of claims in each ad by the number of times the ad aired).
This combination of survey and advertising data is well-suited for explor-ing voter evaluations and their relationship to campaign information. First, the surveys ask respondents to evaluate the campaign in terms of several dif-ferent attributes, allowing us to examine the relationship between evaluations of tone and informativeness. Second, the precise measurement of campaign advertising in respondents’ media markets up to the day of their interview allows us to ascertain how evaluations are related to campaign messages. The time-series nature of the data makes it possible for us to observe campaign effects as they occur. Moreover, in the 2000 presidential race, markets in battleground states saw a great deal of advertising whereas markets in uncom-petitive states saw very little, creating not only temporal but also geographic variation in the volume of campaign messages—a “natural experiment” of sorts (see Gimpel, Kaufman, & Pearson-Markowitz, 2007; Johnston et al., 2004). To our knowledge, no one has examined campaign evaluations and their rela-tionship to advertising tone using comparable data.12
The Dimensionality of Campaign EvaluationsThe dimensionality of campaign evaluations is first evident in whether the items tend to trend in similar directions over time. To track voter perceptions, we took daily averages of each of these indicators and then smoothed these averages to separate true opinion change from sampling fluctuation.13 Figure 1 presents the plots for the California and Illinois races. We include separate plots of the three conditions: the generic “candidates,” the Republican candi-date, and the Democratic candidate. In each case, higher values indicate “bet-ter” campaign conduct—more informative and less negative or critical.
Figure 1 first presents the trendlines for the “candidates.” At the survey’s outset, the trendlines are close to the mid-point of the scale (2.5), except for the perceived frequency of criticism. As the campaign progressed, respon-dents in both California and Illinois tended to believe that the candidates were becoming more negative and more critical. Yet the trend lines for infor-mativeness (“useful information”) remain essentially flat in both states. Per-ceptions of Davis and Lungren display similar trends. Perceptions of Davis’s negativity and level of criticism became less favorable during the campaign, but perceptions of his informativeness did not become less favorable. Much the same conclusions can be drawn about perceptions of Lungren’s campaign.
at Uni Babes-Bolyai on May 14, 2014apr.sagepub.comDownloaded from

Sides et al. 511
1
1.5
2
2.5
3
3.5
1
1.5
2
2.5
3
3.5
1
1.5
2
2.5
3
3.5
1
1.5
2
2.5
3
3.5
1
1.5
2
2.5
3
3.5
1
1.5
2
2.5
3
3.5
Eva
luat
ion
s o
f C
on
du
ct
0 10 20 30 40Day
CA: Candidates
0 10 20 30 40Day
IL: Candidates
Eva
luat
ion
s o
f C
on
du
ctE
valu
atio
ns
of
Co
nd
uct
0 10 20 30 40
Day
CA: Davis
0 10 20 30 40
Day
CA: Lungren
0 10 20 30 40
Day
IL: Poshard
0 10 20 30 40
Day
IL: Ryan
Useful InfoUseful Info
Useful Info
Useful Info
Useful Info
Useful Info Useful Info
NegativeNegative
NegativeNegative
NegativeNegative
Criticizing
Criticizing
CriticizingCriticizing
CriticizingCriticizing
Figure 1. Evaluations of Campaign Conduct in the 1998 California (CA) and Illinois (IL) Gubernatorial RacesNote: The lines are the smoothed trends in voter evaluations. These measures are coded 1 (negative) to 4 (positive). The data begin on September 22 and conclude on November 2, 1998.
The difference between perceptions of negativity and informativeness is evi-dent in the over-time correlations among these trends, that is, the correlations among the daily averages presented in Figure 1. For the California “candidates,” the correlation between perceptions of negativity and criticism (r = .70, p < .001)
at Uni Babes-Bolyai on May 14, 2014apr.sagepub.comDownloaded from

512 American Politics Research 38(3)
is much larger than the correlation between these measures and perceptions of informativeness (r = .30 and r = .39, respectively; p < .001). The results for evalu-ations of Davis and Lungren are even more striking. There are large correlations between perceptions of negativity and criticism (.70 for Davis; .68 for Lungren; p < .001), but smaller and statistically insignificant correlations between these perceptions and perceptions of informativeness (for Davis, −.01 and .10; for Lun-gren, .19 and .20).
A further test of the similarities and differences among these trends derives from a simple regression of the trendlines on the day of interview. These regressions reveal statistically significant declines for the measures of negativity and criticism in all three versions of the items. The “useful information” item exhibited no statistically significant decline in the case of the “candidates” and Davis, and only a very modest decline in the case of Lun-gren. In sum, as the 1998 campaign unfolded, Californians perceived the candidates as campaigning more negatively but not as providing less useful information.
Perceptions during the Illinois campaign tell a similar story. For the “candi-dates,” there is again a growing perception that the candidates are becoming more negative, but not necessarily that they are providing less useful informa-tion. In Poshard’s case, perceptions of negativity also decline somewhat but perceptions of informativeness follow a different pattern, particularly given the increase at the campaign’s end. In Ryan’s case, perceptions on all three indica-tors initially become more favorable and then later less favorable. The trend-line for informativeness manifests some of these trends, although in a more muted fashion. The correlations among these trendlines suggest, on average, stronger relationships between perceptions of negativity and criticism than between these perceptions and perceptions of informativeness. Similar regres-sions of the Illinois measures on day of interview again reveal that either the negativity item or the criticism item or both exhibit statistically significant declines, whereas the “useful information” item does not.
In Figure 2, we present similar plots for evaluations of the 2000 presiden-tial candidates. In each plot, we also include vertical lines that denote the dates of the three presidential debates. Panel A presents trendlines for evalu-ations of the candidates on three dimensions: how much time they are talking about what they will do once elected, policy issues, and criticism of their opponent. Panel B presents the proportion of respondents who said that nei-ther, both, or one or the other candidates were being negative.
Although these items are somewhat different than those included in the California and Illinois surveys, they still demonstrate the multidimensional-ity of evaluations. Panels A and B clearly show that over time respondents saw the candidates as more critical of each other and as more negative. As in
at Uni Babes-Bolyai on May 14, 2014apr.sagepub.comDownloaded from

Sides et al. 513
California and Illinois, the vast majority believed that the candidates were spending some or a great deal of time criticizing each other and this increased as the campaign wore on.14 This trend contrasts sharply with the increasingly favorable perceptions of the campaign’s informativeness. Respondents saw the candidates as spending more, not less, time talking about their plans and about policy issues. Thus, in this race even more than in the two gubernato-rial races, citizens saw no zero-sum trade-off between negative campaigning and informative discussion.
Another way to evaluate dimensionality is to examine each survey as a single cross-section and then examine relationships among these indicators across individuals, rather than over time. With only three indicators in the California and Illinois surveys, a robust test of multidimensionality is not pos-sible, but nevertheless the results of simple principal components models are instructive. In California, separate models for each of the three sets of indica-tors (“candidates,” Davis, and Lungren) produce little evidence of a common underlying factor: The largest eigenvalues are less than 1 in the case of the candidates and Lungren, and only slightly more than 1 for Davis. In Illinois, the same finding emerges, with an eigenvalue of less than 1 for the “candi-dates,” and marginally greater than 1 for Poshard and Lungren. In the presi-dential data, the largest eigenvalue for the 4 indicators in Figure 2 is only
Plans once elected
Policy issues
Criticism
1
1.5
2
2.5
3
3.5
Eva
luat
ion
s o
f C
on
du
ct
0 20 40 60 80 100 120
Day
Both
Bush/Gore
Neither
0
.1
.2
.3
.4
.5
Pro
po
rtio
n0 20 40 60 80 100 120
Day
B. NegativityA. Plans Once Elected,
Policy Issues, and Criticism
Figure 2 Evaluations of Campaign Conduct in the 2000 Presidential RaceNote: The lines are the smoothed trends in voter evaluations. The measures in Panel A are coded 1 (negative) to 4 (positive). The data begin on July 18 and conclude on November 6, 2000. The three vertical lines denote the presidential debates.
at Uni Babes-Bolyai on May 14, 2014apr.sagepub.comDownloaded from

514 American Politics Research 38(3)
.55.15 Thus, across these three races, these various evaluations of campaigns do not clearly tap a single underlying dimension.16
Ultimately, all of this evidence suggests that evaluations of campaign behavior are multidimensional. Over time, evaluations of campaign tone do not move in similar ways to those of campaign informativeness. Cross-sec-tionally, evaluations of a candidate’s negativity are distinct from evaluations of the information the candidate is providing. These dimensions appear to be separate constructs in citizens’ minds.
The Effects of Advertising Tone on EvaluationsTo estimate the effect of advertising tone on perceptions, we combined the measures of positive and negative appeals with the survey data and then con-structed a model where perceptions are a function both of tone and relevant individual-level covariates. Our measures of tone are the cumulative number of positive and negative appeals in the 7 days before the respondent was interviewed.17
These models also include several individual-level controls. For percep-tions of the “candidates,” our model includes partisanship (a “folded” version of the seven-category party identification scale), political information, political efficacy as well as race and gender. Sigelman and Kugler (2003) demonstrate that perceptions of negativity are greater among those who are less effica-cious, less partisan, but more politically attentive.18 Our model for percep-tions of the specific candidates substitutes party identification for partisanship. To measure political information in the California and Illinois data, we use recall of candidate names because these data contain no general measure of political information. In the presidential data, we use the interviewers’ assess-ment of the respondent’s political information. Efficacy is a scale combining responses to 3 items about one’s ability to affect government and compre-hend politics.19
The models are ordinary least squares (OLS) regressions, except in one case, perceptions of negativity in the presidential data, for which we employ an ordered probit model. In each model, we employ robust standard errors that reflect the “clustered” nature of the data (by day of interview in Califor-nia and Illinois and by media market in the presidential data). We estimate a model of each indicator of candidate conduct, with separate sets of models in California and Illinois for the “candidates,” the Republican (Lungren or Ryan) and the Democrat (Davis or Poshard).
Table 1 presents the results of the models from the California and Illinois races. We report only the effects of the advertising measures but the full
at Uni Babes-Bolyai on May 14, 2014apr.sagepub.comDownloaded from
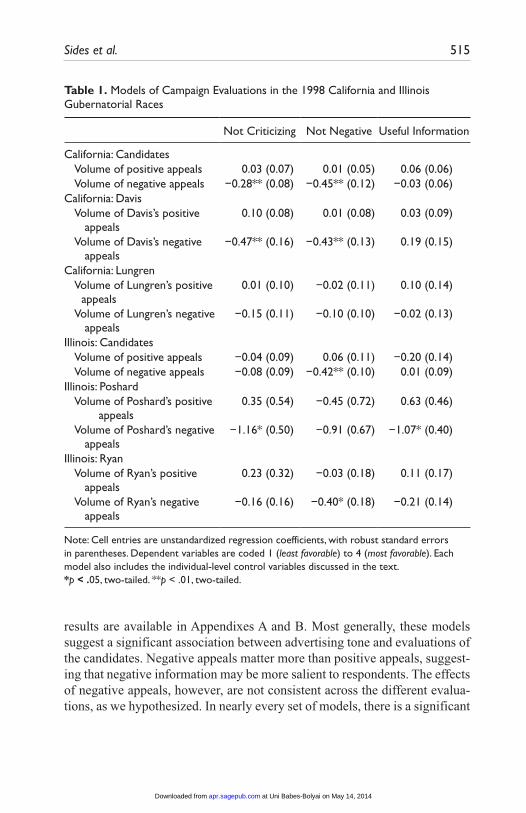
Sides et al. 515
Table 1. Models of Campaign Evaluations in the 1998 California and Illinois Gubernatorial Races
Not Criticizing Not Negative Useful Information
California: Candidates Volume of positive appeals 0.03 (0.07) 0.01 (0.05) 0.06 (0.06) Volume of negative appeals −0.28** (0.08) −0.45** (0.12) −0.03 (0.06)California: Davis Volume of Davis’s positive
appeals0.10 (0.08) 0.01 (0.08) 0.03 (0.09)
Volume of Davis’s negative appeals
−0.47** (0.16) −0.43** (0.13) 0.19 (0.15)
California: Lungren Volume of Lungren’s positive
appeals0.01 (0.10) −0.02 (0.11) 0.10 (0.14)
Volume of Lungren’s negative appeals
−0.15 (0.11) −0.10 (0.10) −0.02 (0.13)
Illinois: Candidates Volume of positive appeals −0.04 (0.09) 0.06 (0.11) −0.20 (0.14) Volume of negative appeals −0.08 (0.09) −0.42** (0.10) 0.01 (0.09)Illinois: Poshard Volume of Poshard’s positive
appeals0.35 (0.54) −0.45 (0.72) 0.63 (0.46)
Volume of Poshard’s negative appeals
−1.16* (0.50) −0.91 (0.67) −1.07* (0.40)
Illinois: Ryan Volume of Ryan’s positive
appeals0.23 (0.32) −0.03 (0.18) 0.11 (0.17)
Volume of Ryan’s negative appeals
−0.16 (0.16) −0.40* (0.18) −0.21 (0.14)
Note: Cell entries are unstandardized regression coefficients, with robust standard errors in parentheses. Dependent variables are coded 1 (least favorable) to 4 (most favorable). Each model also includes the individual-level control variables discussed in the text.*p < .05, two-tailed. **p < .01, two-tailed.
results are available in Appendixes A and B. Most generally, these models suggest a significant association between advertising tone and evaluations of the candidates. Negative appeals matter more than positive appeals, suggest-ing that negative information may be more salient to respondents. The effects of negative appeals, however, are not consistent across the different evalua-tions, as we hypothesized. In nearly every set of models, there is a significant
at Uni Babes-Bolyai on May 14, 2014apr.sagepub.comDownloaded from

516 American Politics Research 38(3)
relationship between the actual volume of negative appeals and respondent’s perceptions of negativity (either the “negative” or “criticizing” indicators, and sometimes both).
An illustration of the substantive magnitude of the relationships in Table 1 comes from the model of negativity for the California “candidates.” Comparing respondents interviewed when the number of negative appeals was largest to those when interviewed when the number of negative appeals was smallest, we would expect their evaluations of the candidates’ negativity to become less favorable by approximately half of a standard deviation. Thus, respondents interviewed at a time when numerous ads included criti-cism of the opponent tend to believe that the candidates are spending more time criticizing each other and are conducting a more negative campaign. Public perceptions of negativity do in fact respond to reality.
Finally, as hypothesized, the tone of campaign messages is not consis-tently related to perceptions of informativeness. Most notably, there is no significant evidence that negative messages affect perceptions of informa-tiveness. In only one case is the coefficient statistically significant (the Poshard model); here, it appears that respondents interviewed amidst a larger volume of negative appeals are less inclined to deem Poshard’s campaigning informative. A similar, though marginally significant relationship, emerges in the models of Ryan’s informativeness (p = .11), but a marginally positive relationship emerges in models of Davis’s informativeness (p = .11, one-tailed). The other models show no relationship between campaign negativity and perceptions of informativeness. Taken together, these results confirm our expectation that negative campaign messages have no consistent effect on perceptions of informativeness.20
Table 2 presents the results for the 2000 presidential campaign. The first set of models includes the two measures of advertising appeals as well as the individual-level controls (which are not shown; see Appendix C). The find-ings from this campaign confirm those from the California and Illinois cam-paigns. First, the volume of negative appeals is strongly associated with the belief that the candidates are being negative and are criticizing each other. Curiously, the volume of positive appeals manifests a similar relationship, though one that is weaker in magnitude. The mere presence of campaign advertising—whether negative or positive—appears to produce less favor-able perceptions of the candidates on this dimension. Negative advertising, however, has a more substantial effect.
Second, negative appeals do not lead respondents to perceive that the can-didates are spending more or less time talking about policy issues or their
at Uni Babes-Bolyai on May 14, 2014apr.sagepub.comDownloaded from

Sides et al. 517
plans once elected. The effect of negative appeals on these dimensions is not statistically significant. Unlike in the results from the California and Illinois races, however, positive appeals do affect evaluations of informativeness: the
Table 2. Models of Campaign Evaluations in the 2000 Presidential Race
Not Criticizing
Not Negative
Plans Once Elected
Policy Issues
Model 1 Volume of
positive appeals
−0.002 (0.001) −0.005* (0.002) 0.003* (0.001) 0.004* (0.002)
Volume of negative appeals
−0.019** (0.003) −0.016** (0.005) 0.004 (0.003) 0.002 (0.004)
Model 2 Volume of
positive appeals
0.001 (0.002) −0.004 (0.002) 0.003 (0.002) 0.003 (0.002)
Volume of negative appeals
−0.021** (0.003) −0.015** (0.005) 0.005 (0.003) 0.004 (0.004)
Number of candidate visits
−0.012 (0.006) −0.012 (0.014) −0.003 (0.006) −0.006 (0.007)
Number of minutes of news
0.001 (0.011) −0.168** (0.048) −0.011 (0.009) −0.022 (0.012)
Week after first debate
−0.037 (0.023) −0.070 (0.044) 0.066 (0.034) 0.057* (0.025)
Week after second debate
−0.057 (0.031) −0.136* (0.060) −0.097** (0.035) 0.029 (0.038)
Week after third debate
−0.144** (0.027) −0.120** (0.044) 0.026 (0.022) 0.022 (0.027)
Note: Cell entries are unstandardized OLS, ordered probit, or logit coefficients, with robust standard errors in parentheses. The dependent variables “criticize,” “promote,” and “policy” are coded 1 (least favorable) to 4 (most favorable); these models are estimated using ordinary least squares regression. “Negative” is coded 0 (both), 1 (Bush or Gore), and 2 (neither); this model is estimated using ordered probit. Each model also includes the individual-level control variables discussed in the text.*p < .05, two-tailed. **p < .01, two-tailed.
at Uni Babes-Bolyai on May 14, 2014apr.sagepub.comDownloaded from

518 American Politics Research 38(3)
more positive advertising in the week before the interview, the more respon-dents feel that the candidates are talking about their issues and plans.
Of course, this model specification fails to capture the rich information environment surrounding the presidential campaign. Perceptions of the cam-paign may also derive from news coverage and candidate debates. To capture this information, we added these indicators to the models: first, the cumulated number of candidate visits to the respondent’s state as of the date of interview, which proxies the amount of local news coverage of the campaign; second, the number of minutes devoted to the campaign on the three major network evening news broadcasts during the week before the date of interview; and third, a set of dummy variables to capture whether respondents were inter-viewed the week after one of the three presidential debates.21
The second model in Table 2 presents the results including these additional measures of campaign information. The central findings from the first model do not change: The volume of negative appeals is still associated with less favorable evaluations on two dimensions (criticizing, negative) but not with the others. The effects of positive appeals are weaker in magnitude and no longer statistically significant. The measures of visits and news have few effects of note, although the volume of news coverage is associated with the perception that the candidates are campaigning negatively. This dovetails with Geer’s (2006) portrayal of the news as focused on negativity. Finally, respon-dents interviewed after the debates also manifest differences, relative to respondents interviewed earlier—although these differences do not conclu-sively prove that the debates themselves mattered. They are more likely to say that the candidates are negative and are spending more time criticizing each other. They are not consistently any more or less likely to say that the candi-dates are discussing their plans once elected or policy issues.22
In sum, the results from these three races confirm our expectations. Dif-ferent evaluations of campaigns respond in distinct ways to positive and negative appeals. As the candidates air more negative appeals, citizens tend to perceive the campaign as more negative and the candidates as spending more time criticizing each other. Yet in almost every case there was no rela-tionship between the volume of negative appeals and beliefs about whether the candidates were providing useful information or discussing policy issues. Negative campaigning does not lead citizens to evaluate the campaign less favorably on every dimension.
at Uni Babes-Bolyai on May 14, 2014apr.sagepub.comDownloaded from

Sides et al. 519
Discussion and Conclusion
Although our results derive from disparate campaigns, they generate a coherent set of conclusions. First, citizens separate evaluations of a campaign’s tone from evaluations of how much useful information the cam-paign is providing. Second, the relationship between these dimensions of evaluation is modest at best. Citizens who believe a campaign is negative will not necessarily find it uninformative. Third, these multiple evaluations respond differently to shifts in the campaign’s tone. Citizens discern when campaigns are negative; they are more likely to call the campaign “negative” when interviewed amidst a barrage of negative ads. Thus, the weak link between negative advertising and participation does not arise because citi-zens define negativity differently than do scholars. Instead, our results sug-gest that the weak link arises because negative campaigning does not lead citizens to evaluate the campaign as uninformative: Evaluations of informa-tiveness are only minimally and inconsistently tied to the tone of advertising. People’s evaluations of negativity are thus somewhere in between the alarm-ist sentiments of some observers and the revisionist accounts of some schol-ars. On the one hand, citizens do not respond to negativity by disdaining campaigns generally, as suggested by some popular commentators. On the other hand, they do not consistently appreciate the benefits of negativity touted by some scholars.
These results have implications for research on negative campaigning. The conventional story about the consequences of negative campaigning often takes this form: Candidates criticize each other, which leads to “voter alienation” from the political process, which leads to lower turnout on election day (Ansolabehere & Iyengar, 1995). This story is at odds, however, with a significant amount of empirical literature that finds either a positive effect of negative campaigning on turnout or, in the most comprehensive review, no consistent evidence of an effect (Lau, Sigelman, & Rovner, 2007). Our findings suggest a reason why existing research on negative campaign-ing is so inconclusive. Although citizens do not necessarily “defend” negativity as much as some political scientists (Geer, 2006; Mayer, 1996), they some-times find merit in negative campaigning. Thus, it makes sense that negative campaigning does not consistently produce alienation or lower turnout, or, for that matter, enthusiasm or higher turnout.23
Extant research has devoted much less attention to how citizens evaluate cam-paigns and, more specifically, negative campaigning—a step arguably prior to “downstream” consequences such as turnout on election day. The multidimen-sionality of evaluations suggests that citizens make distinctions between helpful
at Uni Babes-Bolyai on May 14, 2014apr.sagepub.comDownloaded from

520 American Politics Research 38(3)
and unhelpful negative campaigning. Thus, a central task for future research is to “unpack” negativity to identify those aspects of negative campaigning that citi-zens find objectionable and those they find helpful. Recent research attempting to distinguish negative messages in terms of their relevance and civility is a promis-ing step in this direction (Brooks & Geer, 2007; Fridkin & Kenney, 2006). Ulti-mately, future research could marry this approach and ours, disaggregating both evaluations and messages into their constituent dimensions and looking for sys-tematic relationships among these dimensions. A particularly important question is how citizens evaluate campaign messages in terms of their informativeness. What constitutes useful information for citizens and does that vary among citi-zens? Improving our understanding of campaign communication and the intricate ways in which citizens react to it will help us understand the true relationship between campaign practices and citizen satisfaction with the electoral process, which is an important outcome in its own right.
Our results also suggest several positive normative implications. We find it heartening that citizens evaluate campaigns in a more nuanced fashion than previously thought and change their evaluations of campaigns as they unfold. Citizens appear to respond to campaign advertising. They sometimes express aversion, sometimes acknowledge learning, and most often respond with a mixture of both. They do not always accentuate the negative in their evalua-tions and are thus not uniformly unfavorable toward campaigns, even though they are attentive to the tone of messages that candidates present to them.
Finally, our results also advise against categorical judgments for or against negative campaigning. Citizens may often express grievances about negativ-ity in campaigns but these off-the-cuff complaints conceal a more nuanced evaluation of campaign conduct. In their own evaluations, scholars should not be any less nuanced. As we learn more about the multiple and often con-flicting reactions that citizens have to campaigns, we may discover specific messages that both inform and engage citizens. Scholars should work to identify the kinds of messages that provide the information that citizens need along with the level of civility that they want.
Author’s Note
We thank Rick Lau, John Geer, an audience in the Department of Political Science at Temple University, and the anonymous reviewers for comments. The 2000 data are based on work supported by The Pew Charitable Trusts under a grant to the Brennan Center at New York University and a subsequent subcontract to the Department of Political Science at the University of Wisconsin–Madison. The opinions expressed in this article do not necessarily reflect the views of the Brennan Center, the Campaign Media Analysis Group, the Wisconsin Advertising Project, or The Pew Charitable Trusts. .
at Uni Babes-Bolyai on May 14, 2014apr.sagepub.comDownloaded from
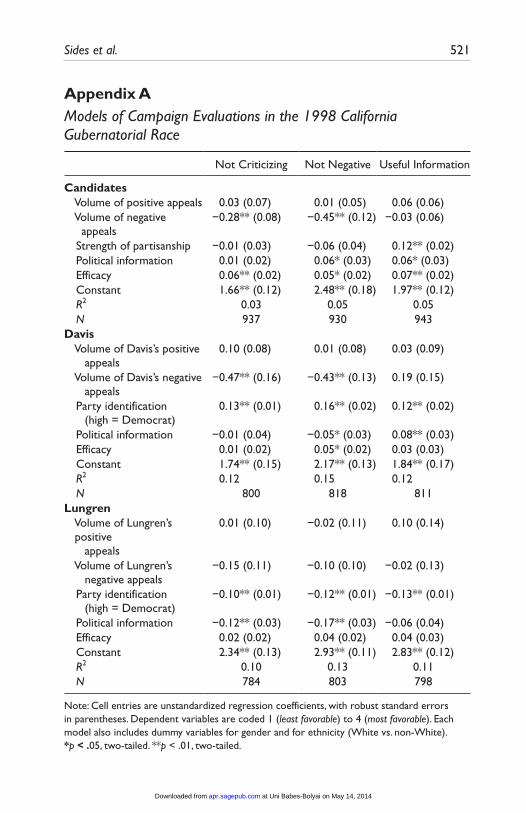
Sides et al. 521
Appendix AModels of Campaign Evaluations in the 1998 California Gubernatorial Race
Not Criticizing Not Negative Useful Information
Candidates Volume of positive appeals 0.03 (0.07) 0.01 (0.05) 0.06 (0.06) Volume of negative
appeals−0.28** (0.08) −0.45** (0.12) −0.03 (0.06)
Strength of partisanship −0.01 (0.03) −0.06 (0.04) 0.12** (0.02) Political information 0.01 (0.02) 0.06* (0.03) 0.06* (0.03) Efficacy 0.06** (0.02) 0.05* (0.02) 0.07** (0.02) Constant 1.66** (0.12) 2.48** (0.18) 1.97** (0.12) R2 0.03 0.05 0.05 N 937 930 943Davis Volume of Davis’s positive
appeals0.10 (0.08) 0.01 (0.08) 0.03 (0.09)
Volume of Davis’s negative appeals
−0.47** (0.16) −0.43** (0.13) 0.19 (0.15)
Party identification (high = Democrat)
0.13** (0.01) 0.16** (0.02) 0.12** (0.02)
Political information −0.01 (0.04) −0.05* (0.03) 0.08** (0.03) Efficacy 0.01 (0.02) 0.05* (0.02) 0.03 (0.03) Constant 1.74** (0.15) 2.17** (0.13) 1.84** (0.17) R2 0.12 0.15 0.12 N 800 818 811Lungren Volume of Lungren’s
positive appeals
0.01 (0.10) −0.02 (0.11) 0.10 (0.14)
Volume of Lungren’s negative appeals
−0.15 (0.11) −0.10 (0.10) −0.02 (0.13)
Party identification (high = Democrat)
−0.10** (0.01) −0.12** (0.01) −0.13** (0.01)
Political information −0.12** (0.03) −0.17** (0.03) −0.06 (0.04) Efficacy 0.02 (0.02) 0.04 (0.02) 0.04 (0.03) Constant 2.34** (0.13) 2.93** (0.11) 2.83** (0.12) R2 0.10 0.13 0.11 N 784 803 798
Note: Cell entries are unstandardized regression coefficients, with robust standard errors in parentheses. Dependent variables are coded 1 (least favorable) to 4 (most favorable). Each model also includes dummy variables for gender and for ethnicity (White vs. non-White).*p < .05, two-tailed. **p < .01, two-tailed.
at Uni Babes-Bolyai on May 14, 2014apr.sagepub.comDownloaded from
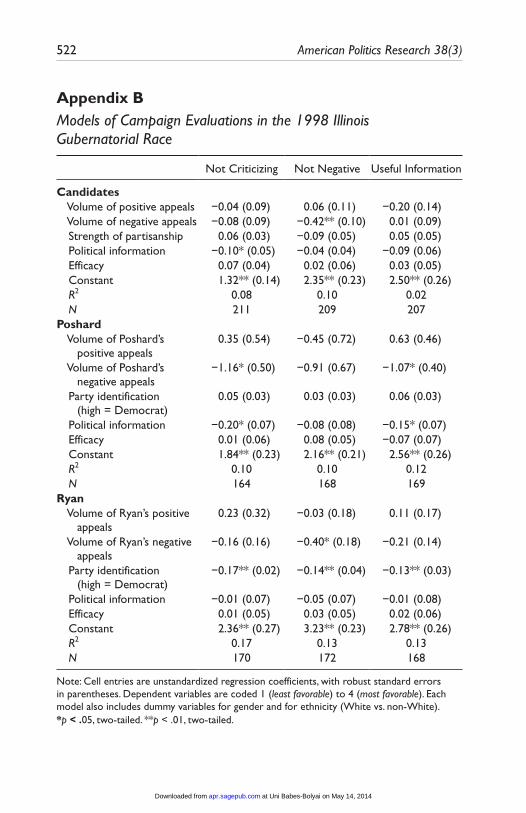
522 American Politics Research 38(3)
Appendix BModels of Campaign Evaluations in the 1998 Illinois Gubernatorial Race
Not Criticizing Not Negative Useful Information
Candidates Volume of positive appeals −0.04 (0.09) 0.06 (0.11) −0.20 (0.14) Volume of negative appeals −0.08 (0.09) −0.42** (0.10) 0.01 (0.09) Strength of partisanship 0.06 (0.03) −0.09 (0.05) 0.05 (0.05) Political information −0.10* (0.05) −0.04 (0.04) −0.09 (0.06) Efficacy 0.07 (0.04) 0.02 (0.06) 0.03 (0.05) Constant 1.32** (0.14) 2.35** (0.23) 2.50** (0.26) R2 0.08 0.10 0.02 N 211 209 207Poshard Volume of Poshard’s
positive appeals0.35 (0.54) −0.45 (0.72) 0.63 (0.46)
Volume of Poshard’s negative appeals
−1.16* (0.50) −0.91 (0.67) −1.07* (0.40)
Party identification (high = Democrat)
0.05 (0.03) 0.03 (0.03) 0.06 (0.03)
Political information −0.20* (0.07) −0.08 (0.08) −0.15* (0.07) Efficacy 0.01 (0.06) 0.08 (0.05) −0.07 (0.07) Constant 1.84** (0.23) 2.16** (0.21) 2.56** (0.26) R2 0.10 0.10 0.12 N 164 168 169Ryan Volume of Ryan’s positive
appeals0.23 (0.32) −0.03 (0.18) 0.11 (0.17)
Volume of Ryan’s negative appeals
−0.16 (0.16) −0.40* (0.18) −0.21 (0.14)
Party identification (high = Democrat)
−0.17** (0.02) −0.14** (0.04) −0.13** (0.03)
Political information −0.01 (0.07) −0.05 (0.07) −0.01 (0.08) Efficacy 0.01 (0.05) 0.03 (0.05) 0.02 (0.06) Constant 2.36** (0.27) 3.23** (0.23) 2.78** (0.26) R2 0.17 0.13 0.13 N 170 172 168
Note: Cell entries are unstandardized regression coefficients, with robust standard errors in parentheses. Dependent variables are coded 1 (least favorable) to 4 (most favorable). Each model also includes dummy variables for gender and for ethnicity (White vs. non-White).*p < .05, two-tailed. **p < .01, two-tailed.
at Uni Babes-Bolyai on May 14, 2014apr.sagepub.comDownloaded from
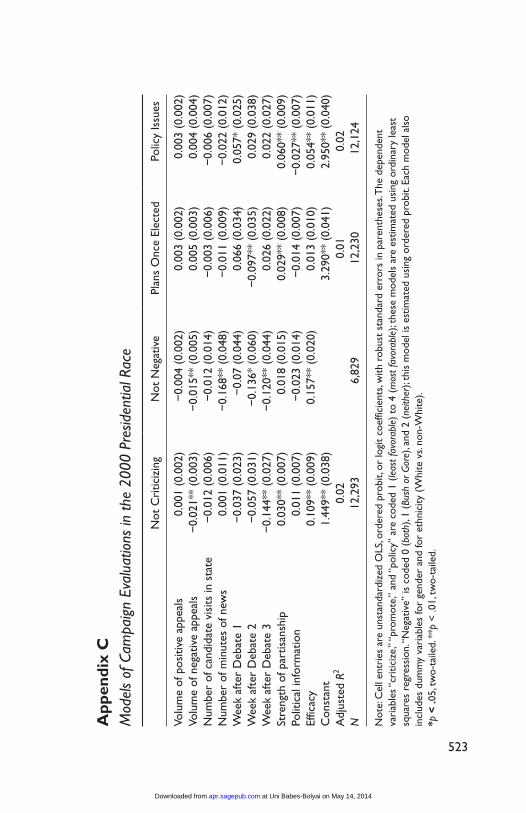
523
App
endi
x C
Mod
els
of C
ampa
ign
Eval
uatio
ns in
the
2000
Pre
siden
tial R
ace
Not
Cri
ticiz
ing
Not
Neg
ativ
ePl
ans
Onc
e El
ecte
d P
olic
y Is
sues
Volu
me
of p
ositi
ve a
ppea
ls0.
001
(0.0
02)
−0.
004
(0.0
02)
0.00
3 (0
.002
)0.
003
(0.0
02)
Volu
me
of n
egat
ive
appe
als
−0.
021*
* (0
.003
)−
0.01
5**
(0.0
05)
0.00
5 (0
.003
)0.
004
(0.0
04)
Num
ber
of c
andi
date
vis
its in
sta
te−
0.01
2 (0
.006
)−
0.01
2 (0
.014
)−
0.00
3 (0
.006
)−
0.00
6 (0
.007
)N
umbe
r of
min
utes
of n
ews
0.00
1 (0
.011
)−
0.16
8**
(0.0
48)
−0.
011
(0.0
09)
−0.
022
(0.0
12)
Wee
k af
ter
Deb
ate
1−
0.03
7 (0
.023
)−
0.07
(0.
044)
0.06
6 (0
.034
)0.
057*
(0.
025)
Wee
k af
ter
Deb
ate
2−
0.05
7 (0
.031
)−
0.13
6* (
0.06
0)−
0.09
7**
(0.0
35)
0.02
9 (0
.038
)W
eek
afte
r D
ebat
e 3
−0.
144*
* (0
.027
)−
0.12
0**
(0.0
44)
0.02
6 (0
.022
)0.
022
(0.0
27)
Stre
ngth
of p
artis
ansh
ip0.
030*
* (0
.007
)0.
018
(0.0
15)
0.02
9**
(0.0
08)
0.06
0**
(0.0
09)
Polit
ical
info
rmat
ion
0.01
1 (0
.007
)−
0.02
3 (0
.014
)−
0.01
4 (0
.007
)−
0.02
7**
(0.0
07)
Effic
acy
0.10
9**
(0.0
09)
0.15
7**
(0.0
20)
0.01
3 (0
.010
)0.
054*
* (0
.011
)C
onst
ant
1.44
9**
(0.0
38)
3.29
0**
(0.0
41)
2.95
0**
(0.0
40)
Adj
uste
d R2
0.02
0.01
0.02
N12
,293
6,82
912
,230
12,1
24
Not
e: C
ell e
ntri
es a
re u
nsta
ndar
dize
d O
LS, o
rder
ed p
robi
t, or
logi
t co
effic
ient
s, w
ith r
obus
t st
anda
rd e
rror
s in
par
enth
eses
. The
dep
ende
nt
vari
able
s “cr
itici
ze,”
“pro
mot
e,”
and
“pol
icy”
are
cod
ed 1
(le
ast f
avor
able
) to
4 (
mos
t fav
orab
le);
thes
e m
odel
s ar
e es
timat
ed u
sing
ord
inar
y le
ast
squa
res
regr
essi
on. “
Neg
ativ
e” is
cod
ed 0
(bo
th),
1 (B
ush
or G
ore)
, and
2 (
neith
er);
this
mod
el is
est
imat
ed u
sing
ord
ered
pro
bit.
Each
mod
el a
lso
incl
udes
dum
my
vari
able
s fo
r ge
nder
and
for
ethn
icity
(W
hite
vs.
non-
Whi
te).
*p <
.05,
tw
o-ta
iled.
**p
< .0
1, t
wo-
taile
d.
at Uni Babes-Bolyai on May 14, 2014apr.sagepub.comDownloaded from
524 American Politics Research 38(3)
Declaration of Conflicting InterestThe authors declared that they had no conflicts of interests with respect to their authorship or the publication of this article.
Financial Disclosure/FundingThe authors declared that they received no financial support for their research and/or authorship of this article.
Notes
1. To be sure, these are not the only possible dimensions on which citizens could evaluate campaigns and it is not our goal to investigate all of the dimensions that citizens use of their own accord. Our claim is simply that tone and informative-ness constitute two likely dimensions. More important to our argument is that citizens distinguish these two dimensions.
2. For example, in a February 2004 Pew survey, respondents were asked “How much does negative campaigning bother you?” A total of 61% said “very much,” 20% said “somewhat,” and only 18% said “not too much” or “not at all.” In a June 2002 poll by the Institute for Global Ethics, 80% of respondents agreed that “negative attack-oriented campaigning is undermining and damaging our democracy” (with 46% saying “strongly agree”). In this same poll, vast majorities agreed that “negative, attack-oriented campaigning” is “making people less likely to go out to vote” (81%), is “unethical” (86%), and “produces leaders who are less trustworthy” (77%).
3. This argument fits well with other research that highlights the salience of nega-tive information (Lau, 1985) and how negative information stimulates cognition by better illuminating the potential costs and benefits of electoral choices (Kahn & Kenney, 1999; Lau, 1985).
4. Affective intelligence theory speaks more to the relationship between perceptions of negativity and informativeness than that between perceptions of positivity and informativeness. One possibility is that people exposed to positive messages feel more content with the information they already have because they have not experienced the anxiety that would lead to a search for additional information. They may say that the campaign has been informative because they have never found information lacking. Below, we examine positive and negative messages separately, which allows us to determine whether these types of messages have distinct effects.
5. These expectations do not suppose that citizens pay close attention to the cam-paign or that they engage in a lot of effortful information processing. Instead, citizens are most likely merely forming impressions of the campaign from the limited information that they encounter. But even this kind of impression forma-tion can still produce evaluations that differ across dimensions—much as it does when citizens are called on to evaluate political candidates.
at Uni Babes-Bolyai on May 14, 2014apr.sagepub.comDownloaded from
Sides et al. 525
6. A final question is whether results based on data from the 1998 and 2000 elections are generalizable to other election and more recent election, in particular. We have no reason to suspect that our findings would prove unique to these elections.
7. Each of these items was asked only of a random one-half of the sample. The “negativ-ity” item was asked only beginning September 5.
8. Their technology tracks satellite transmissions from the major national networks and recognizes the digital “fingerprint” of various television programs and advertisements. With that fingerprint, CMAG then records when and where each political advertisement ran and which candidate (or party or interest group) was its sponsor. Freedman and Goldstein (1999) were the first to demonstrate the power of this data source for political science.
9. In California, the CMAG data did not have clear labels for some ads and thus we could not code them for content. There were also several Spanish-language ads, for which CMAG did not record their content. Yet the vast majority of ads (83%) could be identified and coded. In Illinois, there were two Spanish-language ads whose content was not recorded. We were able to code 93% of the ads that aired in the Chicago market.
10. In the presidential race, coordinated ads were considered candidate ads. We do not include party or independent ads because our focus is on perceptions of the candidates. In response to a reviewer’s suggestion, we included cruder measures of the tone of party advertising, drawing on the Wisconsin Advertising Project’s omnibus coding of each ad as positive, negative, or “contrast” and then assuming contrast ads were equally divided between positive and negative claims. Includ-ing these measures presumes that people conflate candidate ads and party ads and then evaluate the candidates based on both. When we included measures of posi-tive and negative party advertising in the models in Table 2, we found two statis-tically significant effects: Negative party ads are associated with less favorable evaluations of candidates on the “criticizing” dimension, whereas positive party ads are associated with less favorable evaluations on the “policy issues” dimen-sion. The effects of candidate advertising remain similar to those reported in Table 2. The effects of the debates, candidate travel, and news coverage—which we discuss below—are generally weaker once party ads are included. Thus, the overall thrust of our results remains the same. Negative ads tend to be associated with evaluations of negativity but not evaluations of informativeness; positive ads have much weaker effects. In general, the effects of candidate ads are more numerous than those of party ads, suggesting that voters evaluate candidates based more on their own ads than those of their party.
11. We each coded the ads separately. These initial assessments were all correlated at .90 or better. We then resolved any discrepancies to finalize the coding.
12. Sigelman and Kugler (2003) analyze the California and Illinois races using the 1998 NES Pilot Study, which included a sample in each of three states,
at Uni Babes-Bolyai on May 14, 2014apr.sagepub.comDownloaded from

526 American Politics Research 38(3)
California, Illinois, and Georgia. Their measures of campaign content come from newspaper coverage and from a small sample of political ads from the Univer-sity of Oklahoma’s Political Commercial Archive. The CMAG data provide a more complete collection of ads as well as information on when and, crucially, how often those ads aired (see Prior, 2001). The NES included a single measure of voter perception (of the perceived negativity of the gubernatorial campaign) rather than the multiple measures included in the Annenberg data. Finally, the Annenberg data provide temporal leverage that a cross-section such as the 1998 NES Pilot Study cannot. As Sigelman and Kugler (2003, p. 154) note, candidate tone may vary significantly during a campaign, with consequences for voters’ perceptions. A potential disadvantage of the California and Illinois data is that they were collected in select media markets, San Francisco and Chicago, that are not demographically representative of the rest of the state, although we do not believe that this would affect our hypothesis tests. Moreover, the 2000 NAES provides a nationally representative sample.
13. Specifically, we employed lowess procedure in Stata 9, with a bandwidth of 0.3.14. Interestingly, the proportion who believed Bush and/or Gore were being too
negative is smaller than those who thought the candidates were spending some or much time criticizing each other. Of those who said that the candidates were spending some or a great deal of time criticizing each other, only 40% said that both candidates were being “too negative or nasty.”
15. For this analysis, the item capturing perceptions of negativity is coded in three ordinal categories (both, Bush or Gore, and neither).
16. Further analysis shows that, as in the over-time analysis, the correlations between perceptions of negativity and criticism tend to be larger than those between these perceptions and those of informativeness (data not shown).
17. In models of the “candidates’” conduct, we combine the Republican and Demo-cratic candidates’ advertising into a single measure. We divided these 7-day mea-sures by 1,000 to make their scale more compact. Johnston, Hagen, and Jamieson (2004) find that the sum of the previous 7 days’ advertising has the strongest impact on individual-level attitudes. Because the CMAG presidential data cov-ered only the top 75 media markets, we include only respondents who lived in those markets, which is about 75% of the NAES sample.
18. The effect of advertising could be greater among voters who are more politi-cally attentive. We investigated whether individual-level measures of political attentiveness and media consumption moderate the effects we describe below. We found little evidence that such measures play a robust moderating role. These results are available on request. Although party identification is associated with evaluations of the specific candidates—for example, Democrats tend to evaluate Gray Davis’s campaign conduct more favorably—party identification does not
at Uni Babes-Bolyai on May 14, 2014apr.sagepub.comDownloaded from

Sides et al. 527
moderate the effect of advertising messages in alternative model specifica-tions. As the campaign wore on, Republicans and Democrats did not necessarily diverge in their assessments of how negatively the two candidates were cam-paigning. The trends in perceptions of negativity reveal no consistent pattern of increasing partisan polarization during the California and Illinois campaigns. In fact, there is some evidence of partisan convergence in Illinois. These results are also available on request.
19. In the presidential data, the items are “People like me have no say over party choices for presidential candidates”; “People like me have no say over who is president”; and “Presidential elections are too complicated to understand.” In the California and Illinois data, the items are “State public officials don’t care much what people like me think”; “Sometimes state politics and government seem so complicated that a person like me can’t really understand what is going on”; and “People like me don’t have any say about what the state government does.”
20. Some research suggests the value in disaggregating negative appeals, such as by comparing appeals focused on issues to appeals focused on candidate traits (e.g., Fridkin & Kenney, 2004). In this case, one might expect that trait-based attacks would be perceived as more negative and less informative than issue-based attacks. We investigated this distinction but found no systematically dif-ferent effects of these two kinds of attacks. We also attempted to distinguish civil from uncivil attacks, using the definition proposed by Brooks and Geer (2007), but in these races no attacks met their standards for incivility.
21. Richard Johnston graciously supplied the data on candidate visits. The news data were collected by the authors from the Vanderbilt Television News Archive. With regard to the debates, the NAES data do include self-reports of debate exposure, but these are afflicted with a large amount of over-reporting (Prior, 2005). We prefer the dummy variables for this reason and also because they help capture the “debate about the debate” that typically occurs after the debate itself. However, this measurement strategy has important limitations, as there was obviously other campaign activity that took place in the week after each debate. We must there-fore be cautious in interpreting the effects of these variables.
22. We also attempted to distinguish trait- and issue-based negativity in presidential advertising. In the 2000 race, only about 11% of negative appeals mentioned candidate traits, limiting the usefulness of these data for parsing the effects of each type of negative appeal. Similar models to those in Table 2 suggest that issue-based negativity effects are much larger than those of trait-based negativ-ity, but again we do not place too much stock in these results, given the paucity of trait appeals. Finally, as in our analysis of the California and Illinois races, we found no evidence of incivility in these presidential ads, which prevents us from distinguishing appeals on this dimension.
at Uni Babes-Bolyai on May 14, 2014apr.sagepub.comDownloaded from

528 American Politics Research 38(3)
23. Unfortunately, the data we analyze here do not allow a credible exploration of turn-out. In the preelection survey, there is a question asking respondents whether they intend to vote, but this generates the usual socially desirable response—for exam-ple, in the 2000 NAES data, 85% of respondents intended to vote. Analysis using this measure as a dependent variable finds no consistent statistically significant relationship between any measure of campaign evaluation and turnout intention or between positive or negative campaign appeals and turnout intention. But we are hesitant to make much of these results given the dependent variable’s flaws.
References
Ansolabehere, S., & Iyengar, S. (1995). Going negative: How political advertise-ments shrink and polarize the electorate. New York: Free Press.
Arceneaux, K. (2006). Do campaigns help voters learn? A cross-national analysis. British Journal of Political Science, 36, 159-173.
Brader, T. (2006). Campaigning for hearts and minds: How emotional appeals in political ads work. Chicago: University of Chicago Press.
Brooks, D. J., & Geer, J. G. (2007). Beyond negativity: The effects of incivility on the electorate. American Journal of Political Science, 51, 1-16.
Freedman, P., & Goldstein, K. (1999). Measuring media exposure and the effects of negative campaign ads. American Journal of Political Science, 43, 1189-1208.
Freedman, P., Franz, M., & Goldstein, K. (2004). Campaign advertising and demo-cratic citizenship. American Journal of Political Science, 48, 723-741.
Freedman, P., Wood, W., & Lawton, D. (1999, October-November). Do’s and don’ts of negative ads: What voters say. Campaigns and Elections, 20.
Fridkin, K. L., & Kenney, P. J. (2004). Do negative messages work? The impact of negativity on citizens’ evaluations of candidates. American Politics Research, 32, 570-605.
Fridkin, K. L., & Kenney, P. J. (2006, August). Do negative advertisements work? Exploring the dimensions of negativity. Paper presented at the annual meeting of the American Political Science Association, Philadelphia, PA.
Geer, J. G. (2006). In defense of negativity: Attacks ads in presidential campaigns. Chicago: University of Chicago Press.
Gimpel, J. G., Kaufman, K. M., & Pearson-Markowitz, S. (2007). Battleground states versus blackout states: The behavioral implications of modern presidential cam-paigns. Journal of Politics, 69, 786-797.
Hetherington, M. J. (2005). Why trust matters: Declining political trust and the demise of American liberalism. Princeton, NJ: Princeton University Press.
Hibbing, J. R., & Theiss-Morse, E. (2002). Stealth democracy: Americans’ beliefs about how government should work. New York: Cambridge University Press.
at Uni Babes-Bolyai on May 14, 2014apr.sagepub.comDownloaded from

Sides et al. 529
Jamieson, K. H., Waldman, P., & Sherr, S. (2000). Eliminate the negative? Categories of analysis for political advertisements. In J. A. Thurber, C. J. Nelson, & D. A. Dulio (Eds.), Crowded airwaves: Political advertising in elections (pp. 44-64). Washington, DC: Brookings Institution Press.
Johnston, R., & Brady, H. E. (2002). The rolling cross-section design. Electoral Stud-ies, 21, 283-295.
Johnston, R., Hagen, M. G., & Jamieson, K. H. (2004). The 2000 presidential election and the foundations of party politics. New York: Cambridge University Press.
Kahn, K. F., & Kenney, P. J. (1999). Do negative campaigns mobilize or suppress turnout? Clarifying the relationship between negativity and participation. Ameri-can Political Science Review, 93, 877-889.
Kinder, D. R. (1986). Presidential character revisited. In R. R. Lau & D. O. Sears (Eds.), Political cognition (pp. 233-255). Hillsdale, NJ: Lawrence Erlbaum.
Lau, R. R. (1985). Two explanations for negativity effects in political behavior. Amer-ican Journal of Political Science, 29, 119-138.
Lau, R. R., Sigelman, L., & Rovner, I. B. (2007). The effects of negative political campaigns: A meta-analytic reassessment. Journal of Politics, 69, 1176-1209.
Lipsitz, K., Trost, C., Grossman, M., & Sides, J. (2005). What voters want from politi-cal campaign communication. Political Communication, 22, 337-354.
Marcus, G. E., Neuman, W. R., & MacKuen, M. (2000). Affective intelligence and political judgment. Chicago: University of Chicago Press.
Mayer, W. G. (1996). In defense of negative campaigning. Political Science Quar-terly, 111, 437-455.
McGraw, K. M., Hasecke, E., & Conger, K. (2003). Ambivalence, uncertainty, and processes of candidate evaluation. Political Psychology, 24, 421-448.
Meffert, M., Guge, M., & Lodge, M. (2004). Good, bad, and ambivalent: The conse-quences of multidimensional political attitudes. In W. E. Saris & P. M. Sniderman (Eds.), Studies in public opinion (pp. 64-92). Princeton, NJ: Princeton University Press.
Prior, M. (2001). Weighted content analysis of political advertisements. Political Communi cation, 18, 335-345.
Prior, M. (2005, May). The pitfalls of self-reported news exposure. Paper presented at the annual meeting of the American Association for Public Opinion, Miami, FL.
Romer, D., Kenski, K., Waldman, P., Adasiewicz, C., & Jamieson, K. H. (2004). Cap-turing campaign dynamics: The National Annenberg Election Survey. New York: Oxford University Press.
Sigelman, L., & Kugler, M. (2003). Why is research on the effects of negative cam-paigning so inconclusive? Understanding citizens’ perceptions of negativity. Journal of Politics, 65, 142-160.
at Uni Babes-Bolyai on May 14, 2014apr.sagepub.comDownloaded from

530 American Politics Research 38(3)
Stevens, D., Sullivan, J., Allen, B., & Alger, D. (2008). What’s good for the goose is bad for the gander: Negative political advertising, partisanship, and turnout. Journal of Politics, 70, 527-541.
West, D. M. (2005). Air wars: Television advertising in election campaigns, 1952-1992. Washington, DC: CQ Press.
Bios
John Sides is an assistant professor of political science at George Washington University. His research centers on political behavior in American and comparative politics.
Keena Lipsitz is an assistant professor in the Department of Political Science at Queens College, City University of New York. She conducts research in the areas of political behavior, public opinion, campaigns and elections, and democratic theory.
Matthew Grossmann is an assistant professor in the Department of Political Science at Michigan State University. His research focuses on interest group, political cam-paigns, and political parties.
at Uni Babes-Bolyai on May 14, 2014apr.sagepub.comDownloaded from