ALTIUM HALF YEAR INVESTOR PRESENTATION file2012 $100M $70M $50M $30M $90M $60M $40M $20M $10M...
44
21-24 February 2017 Sydney & Melbourne Delivering Strong Performance & Growing Momentum to Market Leadership Aram Mirkazemi CEO Joe Bedewi CFO Kim Besharati VP IR ALTIUM HALF YEAR INVESTOR PRESENTATION
Transcript of ALTIUM HALF YEAR INVESTOR PRESENTATION file2012 $100M $70M $50M $30M $90M $60M $40M $20M $10M...

21-24 February 2017
Sydney & Melbourne
Delivering Strong Performance & Growing Momentum to Market Leadership
Aram Mirkazemi CEO
Joe Bedewi CFO
Kim Besharati VP IR
ALTIUM HALF YEARINVESTOR PRESENTATION

2
Future performance - Forward looking statements, opinions and estimates provided
in this presentation are based on assumptions and contingencies which are subject
to change without notice, as are statements about market and industry trends,
which are based on interpretations of current market conditions. Forward looking
statements including projections, guidance on future earnings and estimates are
provided as a general guide only and should not be relied upon as an indication or
guarantee of future performance. An investment in Altium shares is subject to
investment and other known and unknown risks, some of which are beyond the
control of Altium Limited. No representation or warranty, express or implied, is
made as to the fairness, accuracy, completeness or correctness of the information,
opinions and conclusions contained in this presentation. To the maximum extent
permitted by law, none of Altium employees, its directors, employees or agents, nor
any other person accepts any liability, including, without limitation, any liability
arising out of fault or negligence, for any loss arising from the use of the information
contained in this presentation. In particular, no representation or warranty, express
or implied is given as to the accuracy, completeness or correctness, likelihood of
achievement or reasonableness of any forecasts, prospects or returns contained in
this Presentation nor is any obligation assumed to update such information. Such
forecasts, prospects or returns are by their nature subject to significant uncertainties
and contingencies. Before making an investment decision, you should consider, with
or without the assistance of a financial adviser, whether an investment is
appropriate in light of your particular investment needs, objectives and financial
circumstances.
Financial dataAll dollar values are in US dollars (US$) unless as otherwise presented.
Disclaimer
This presentation has been prepared by Altium Limited (ACN 009 568 772)
and is for information purposes only. It does not constitute financial
product or investment advice or a recommendation to acquire Altium
shares and has been prepared without taking into account the objectives,
financial situation or needs of individuals. Before making an investment
decision prospective investors should consider the appropriateness of the
information having regard to their own objectives, financial situation and
needs and seek legal and taxation advice appropriate to their jurisdiction.
Altium is not licensed to provide financial product advice in respect of
Altium shares.
Altium, Altium Designer, Altium Vault, Ciiva, Circuitmaker, Circuistudio,
Octopart, PCBWorks, Protel and Tasking, and their respective logos, are
trademarks or registered trademarks of Altium Limited, or its subsidiaries.
All other registered or unregistered trademarks mentioned in this
presentation are the property of their respective owners, and no
trademark rights to the same are claimed

Agenda
2017 Half Year Financial Performance & Metrics2
Appendix: Company Overview
Company Highlights & Significant Achievements1
Pursuing PCB Market Leadership & EDA Transformation3
4

2012
$100M
$70M
$50M
$30M
$90M
$60M
$40M
$20M
$10M
$48,342
Revenue Revenue growth
$26,445
20%H1
$55,072
H1 FY
2013
H1 FY
$29,036
10%H1
$61,908
2014
H1 FY
11%H1
$70,964
2015
H1 FY
$37,599
16%H1
$80,216
2016
H1 FY
$42,594
13%H1
$93,597
2017
H1
$48,650
$80M
14%H1
-16.3%
9.6%
18.4%
26.7% 25.0% 25.8%
4
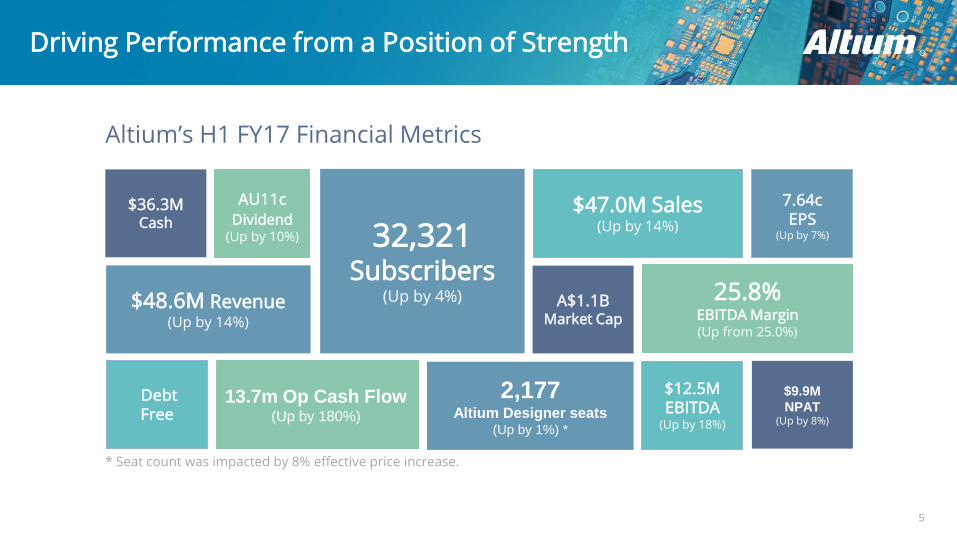
Altium’s H1 FY17 Performance Highlights
• Revenue growth of 14%
• EBITDA Margin 25.8%
• Achieved double digit sales growth and on-
track to exceed $100M revenue in FY17
• 4% increase in subscribed seats to 32,321
$0M
EBITDA Margin
$32,295
5
2,177Altium Designer seats
(Up by 1%) *
$48.6M Revenue (Up by 14%)
$36.3MCash
AU11cDividend
(Up by 10%)
DebtFree
A$1.1BMarket Cap
25.8%EBITDA Margin(Up from 25.0%)
32,321Subscribers
(Up by 4%)
$12.5MEBITDA
(Up by 18%)
$47.0M Sales (Up by 14%)
7.64cEPS
(Up by 7%)
Altium’s H1 FY17 Financial Metrics
13.7m Op Cash Flow(Up by 180%)
$9.9M
NPAT(Up by 8%)
Driving Performance from a Position of Strength
* Seat count was impacted by 8% effective price increase.

6
Delivered major upgrade to Altium’s flagship product, Altium Designer 17, representing the
fifth consecutive annual upgrade.
Released new electronic/mechanical CAD product under OEM partnership with Dassault
Systèmes SolidWorks.
Expanded direct sales presence in Europe acquiring long-time resellers in the Netherlands and
the United Kingdom.
Began the modernization of our TASKING R&D and achieved highly-sought industry
accreditation to support the sale of TASKING’s compiler technology in the automotive industry.
Progress Update – First Half Significant Milestones

7
Achieving Market Leadership by 2020
2015
2017
2020
2025
Strong Strategy, Leading Technology
& Revenue Momentum
$100 + MillionRevenue & Expansion
of Market Opportunity
PCB Market Leadership &
Emerging Leader in Systems Design
Altium Designer
2020 Target Revenue Breakdown
Acquisitions
Octopart
TASKING
OEM
ATINA
Data
Management
55-65%
10-15%
5-7.5%
7.5-10%
5-10%
5-10%
3-5%
$200M In Total Revenue
$150M In Pure PCB
Transforming the Realization of
Electronic Design

Agenda
2017 Half Year Financial Performance & Metrics
3
Appendix: Company Overview
Company Highlights & Significant Achievements
2
Pursuing PCB Market Leadership & EDA Transformation
1
4

9
Revenue Sources
Altium Designer Subscriptions
Octopart Search
Tasking Maintenance
Altium Designer Term Based Licenses
Tasking Term Based Licenses
Vault Subscription and Term Based LicensesOther Recurring
Altium DesignerPerpetual Licenses
Services
Tasking Licenses
Other Transactional
Recurring Revenue
Transactional Revenue
44.2%($21.5M –up 15%)
55.8% ($27.1M
– up 14%)
33.1%($16.1M –up 14%)
3.3%($1.6M –
down 27%)5.8%
($2.8M –up 47%)
2.0%($1M)
40.2%($19.5M –
up 9%)
7.2%($3.5M –up 150%)
3.7%($1.8M –up 6%)
2.2%($1.1M)
0.4%($0.2M)
1.0%($0.5M)
1.0%($0.5M)

Revenue – Board and Systems
BSD - Americas 5 Yr Revenue CAGR: 15%
5 Yr Recurring CAGR: 16%
$5m
$10m
$15m
$20m
$40m
2012
H1
2013 2014 2015 2016 2017
H1
H1 Revenue: 5%
$25m
$30m
$35m
BSD – EMEA USD 5 Yr Revenue CAGR: 11%
5 Yr Recurring CAGR: 14%
H1 Revenue: 15%
$5m
$10m
$15m
$20m
$25m
BSD – Rest of World 5 Yr Revenue CAGR: 8%
5 Yr Recurring CAGR: 9%
$3m
$5m
$7m
$9m
$17m
H1 Revenue: 17%
$11m
$13m
$15m
BSD – Total 5 Yr Revenue CAGR: 12%
5 Yr Recurring CAGR: 14%
H1 Revenue: 10%
$20m
$40m
$60m
$80m
Revenue
Recurring
FY H1 FY H1 FY H1 FY H1 FY
2012
H1
2013 2014 2015 2016 2017
H1FY H1 FY H1 FY H1 FY H1 FY
2012
H1
2013 2014 2015 2016 2017
H1FY H1 FY H1 FY H1 FY H1 FY
2012
H1
2013 2014 2015 2016 2017
H1FY H1 FY H1 FY H1 FY H1 FY
8,92710,146 10,931 14,253 17,177 17,973
7,961 8,468 10,015
11,159 10,86512,463
6,712 7,267 7,285
8,135 7,631
8,950
23,600 25,881 28,231 33,547 35,673
39,386
10

11
TASKING 5 Yr Revenue CAGR: 10%
5 Yr Recurring CAGR: 8%
$2m
$4m
$6m
$8m
$10m
RevenueRecurring
Revenue – TASKING and Octopart
H1 Revenue: -5% Octopart Search 5 Yr Revenue CAGR: 34%
$1m
$2m
$3m
$4m
$5m
H1 Revenue: 64%
2012
H1
2013 2014 2015 2016 2017
H1FY H1 FY H1 FY H1 FY H1 FY
2012
H1
2013 2014 2015 2016 2017
H1FY H1 FY H1 FY H1 FY H1 FY
2,780 2,893
3,716 3,920
5,425 5,158
856 826 1,020
1,827 2,117
3,485

12
Board and Systems – Underlying Metrics
Americas EMEA Rest of World
Altium Designer Seat Count Subscription Pool
672 (+ 25)
858 (+ 63)
647 (- 73)
Americas EMEA Rest of World
29,320 (+1,314)
5,000
3,000
2,000
1,000
2013
H1 FY
2014
H1 FY
2015
H1 FY
2016
H1 FY
2017
H1
4,000
-
6,000
2,177(+ 15)
11,967 (+496)
13,991 (+539)
6,363 (+152)
25,000
15,000
10,000
5,000
20,000
-
30,000
2,177(+ 15)
2013
H2
2014
H1 H2
2015
H1 H2
2016
H1 H2
2017
H1
26,943 (+860)
2,296
1,916
1,756
2,162
32,321 (+1,187)
24,821 (-222)

13
Subscription Pool
New Subscriptions (NS)Attached to New License Sales
Growth pool = ~86.5% of subscription pool
H1 FY17 renewal rate of 86.2%Down from 86.6% in FY16
Re-join (RJ)Lapsed Subscribers Re-joining
and Upgrades
Constant pool = ~13.5% of subscription pool
H1 FY17 renewal rate of 36.4%up from 30.3% in FY16
Lapse Rate (LR)
Subscription Pool (SP)H1 FY17: 32,321
(up from 31,134 June 2016)
Non-renewals
2,567(Up from 2,330)
+2,507(Up from 2,490)
+1,247(Up from 1,150)
Growth Equation = NS + RJ - (LR x SP)

14
Operating expenses
R&D spend driven by capability acquisitions and product investment.
Sales and Marketing gaining efficiency as we implement our “go-direct” strategy
G&A increases due to One-Time Charges and Key Hiring
R&D Sales & Marketing G&A
$11,373
$15,709
$9,021$7,477
$14,083
$7,095
$6,520
$10,350
$25M
$15M
$5M
2015 2016 2017
$35M
$13,670
H1H1 H1

15
Operating expenses
No Waste Culture – Every Dollar Counts
We support a Value-Based Market but, we service this market with a commodity selling model
R&D is driven by a high product release rate
What Drives Altium’s Unique Operating Leverage?
R&D Sales G&A
Operating Expenses as a % of Revenue
32.3%
18.5%
24.3%
17.6%
18.9%
36.4%
17.3%
80%
40%
20%
0%
60%
100%
2015 2016 2017
23.4%
H1H1 H1
33.1%

Cash Balance
Dec-16 Jun-16 Var
$ '000 $ '000 $ '000 %
Cash and cash equivalents 36,348 38,139 (1,791) -5%
Trade and other receivables 25,852 30,406 (4,554) -15%
Other current assets 2,083 1,548 535 35%
Total current assets 64,283 70,093 (5,810) -8%
Trade and other receivables 3,669 5,379 (1,710) -32%
Property, plant and equipment 6,512 5,091 1,421 28%
Intangible assets 34,699 33,508 1,191 4%
Other non-current assets 81,871 82,301 (430) -1%
Total non-current assets 126,751 126,279 472 0%
Total assets 191,034 196,372 (5,338) -3%
Trade and other payables 6,362 7,188 (826) -11%
Tax liabilities 1,461 2,713 (1,252) -46%
Provisions 6,071 3,568 2,503 70%
Deferred revenue 31,269 32,234 (965) 3%
Total current liabilities 45,163 45,703 (540) -1%
Deferred Tax 4,687 4,793 (106) -2%
Provisions 1,474 4,230 (2,756) -65%
Deferred revenue 7,390 9,038 (1,648) -18%
Other liabilities 768 1,793 (1,025) -57%
Total non-current liabilities 14,319 19,874 (5,555) -28%
Total liabilities 59,482 65,577 (6,095) -9%
Net assets 131,552 130,795 757 1%
Contributed equity and reserves 136,296 135,571 725 1%
Accumulated losses (4,744) ( 4,776) 32 -1%
Total equity 131,552 130,795 757 1%
16
FY11 FY12 FY13 FY14 FY15 FY16
10,000
0
20,000
30,000
40,000
50,000
60,000
70,000
H1 FY17

17
Cash Flow
H1 FY17 H1 FY16 Var
$ '000 $ '000 $ '000 %
Cash flows from operating activities
Receipts from customers 54,397 43,919 10,478 24%
Payments to suppliers and employees (39,268) (37,366) (1,902) 5%
Payments for expenses relating to acquisitions (72) (839) 767 -91%
Net Interest (paid)/received (21) 38 (59) 119%
Net income taxes paid (1,320) (862) (458) 53%
Operating Cash Flow 13,716 4,890 8,826 180%
Capital Expenditure
Payments for property, plant and equipment
(2,548) (1,779) (769) 43%
Free Cash Flow 11,168 3,111 7,059 -56%
Cash flows from investing activities
Payments for purchase of subsidiary, net of cash acquired (2,939) (10,767) 7,828 -73%
Cash flows from financing activities
Dividends paid (9,830) (7,644) (2,184) 29%
Repayment of borrowings (28) (30) 2 -7%
Subtotal (1,629) (15,330) 13,701 -89%
Effects of exchange rate changes (162) (223) 61 -27%
(Decrease)/increase in cash and cash equivalents (1,791) (15,553) 13,762 -88%
Dividends paid/declared
Interim
Final
FY12 FY13 FY14 FY15 FY16
5
0
10
15
20
25
FY17

18
Half Year Results Key Metrics
USD millions H1 FY17 H1 FY16Change
%
Revenue (excl. interest) 48.7 42.6 14%
Reported expenses 36.2 31.9 13%
EBITDA 12.5 10.7 18%
Depreciation and amortization 1.7 1.3
EBIT 10.8 9.7 11%
Net interest - -
Profit before income tax 10.8 9.7 11%
Income tax expense 0.9 0.6
Profit after income tax 9.9 9.1 8%
H1 FY17 H1 FY16Change
%
EPS 7.64 7.12 7%
Dividends (AU cents) 11 10 10%
Key Margin Analysis
EBITDA Margin
Net profit before tax margin
Net profit after tax margin
Return on equity
Effective tax rate
25.8%
22%
20%
7.5%
8.6%
25.0%
23%
21%
7.3%
6.1%
Balance Sheet (USD millions)
Cash and equivalents
Net assets
36.3
131.6
46.4
125.8
Operating cash flows 13.7 4.9 180%

Agenda
2017 Half Year Financial Performance & Metrics2
Appendix: Company Overview
Company Highlights & Significant Achievements
4
Pursuing PCB Market Leadership & EDA Transformation
1
3

Rise of Smart Connected Devices
20

21
Printed Circuit Boards Central to Electronics
At the Heart of All Intelligent Systems is Electronics

22
Exploration(Discovery & Invention)
Innovation(Pioneering & Development)
Adoption(Accessibility & Refinement)
Innovation in the Age of Internet of Things
Modelling, digitalizing and integrating all objects and processes associated with the creation, adoption & evolution of smart products is critical for increasing the speed of innovation

23
The Future is Multi-disciplinary…
Cloud System EngineeringCloud application development and Infrastructure management
Development of Control Systems in Electromechanical devices
Embedded System Engineering
Creation of high-performance electronic hardware with complex form factor
Electronics Engineering
Mechanical EngineeringDesigning complex objects with sophisticated electromechanical behaviour
Electrical EngineeringDevelopment of wire harness and electrical systems in Electromechanical devices

24
Speeding up the Pace of Innovation
Success depends on the ability of the enterprise to move through innovation cycles faster than its competitors
Electronics is critical to speeding up cycles of innovation
Existing Product Lifecycle Management (PLM) tools do not adequately address the needs of high-tech products

IoT Will Transform the EDA Industry...
25

PCB Design Software Market Current Trends, Segmentation & Size
26
Product Reliability
Design Complexity
Lower Cost Products
Product Differentiation
Shorter Time-to-Market
Lack of Formal Training
Collaborative Mindset
Multi-disciplinary Tools
Systematic Design Reuse
No Sustainable Economy
High-End Tools
Robust Data Management
Shorter Cycle Time
57% of market value - Top-down Direct
Enterprise Sales Model. Large engineering
teams designing complex products.
Mainstream Tools 36% of market value - Bottom-up direct / indirect sales model. Moderate to high design complexity, carried out by small teams of specialist engineers.
Low-End Tools 7% of market value - Indirect Sales through partners. Simple designs carried out by multi-skilled engineers.
Total PCB Market Size: $1 Billion
Currently Addressable: $600 Million
Source: Gary Smith EDA

Altium’s Strategy for PCB Market Leadership
27
4Maintaining Leadership in Mainstream PCB Market
Delivering the Next Generation Agile Enterprise Solution
2
3Closing Advanced Capability Gaps in High-end PCB Design & Going Beyond
Altium’s Multi-Product, Multi-Channel Strategy is at the Heart of Altium’s bid for Market Leadership
5Smart Content Strategy - Monetization Through Smart Delivery of Content
6Online Collaboration & Smart Workflow
A Well-Executed M&A and Partnership Strategy is Critical to Success
1
7

A Unique PCB Design Solution for Every Market Segment
28
X2 Platform
OEM Partner Product
Mainstream PCB Design Tool
CIIVADesign Realization
(online Service)
Community PCB Design Tool
(Free / Unlimited)
Streamlined PCB Design Tool
(Professional / Entry Level)
Electronic Part-Pedia
(Wikipedia of Electronic Parts)

29
ATINA
• Multi-board System Design Capability
• Advanced Routing Capability
• Constraint-Driven Design
• Handling Large Boards with Ease
X2 Platform
• Next Generation - 3D Graphics Engine
• State-of-the-art User Interface/Experience
• 64-bit Computing Architecture
ATINA - Altium’s High-End PCB Design Tool

30
Altium’s Long-Term Outlook
The proliferation of electronics through the rise of smart connected devices is driver of
growth for our business for the foreseeable future
Altium will continue to drive top line growth while expanding operating margin to enter
and maintain 30% plus
Altium expects to see continuing growth in revenue
Altium is confident that achieving market leadership in PCB design software by 2020 is
well within its reach
Altium’s goal is to achieve $200 million in revenue by 2020

Agenda
2017 Half Year Financial Performance & Metrics2
Appendix: Company Overview
Pursuing PCB Market Leadership & EDA Transformation
1
3
4
Company Highlights & Significant Achievements
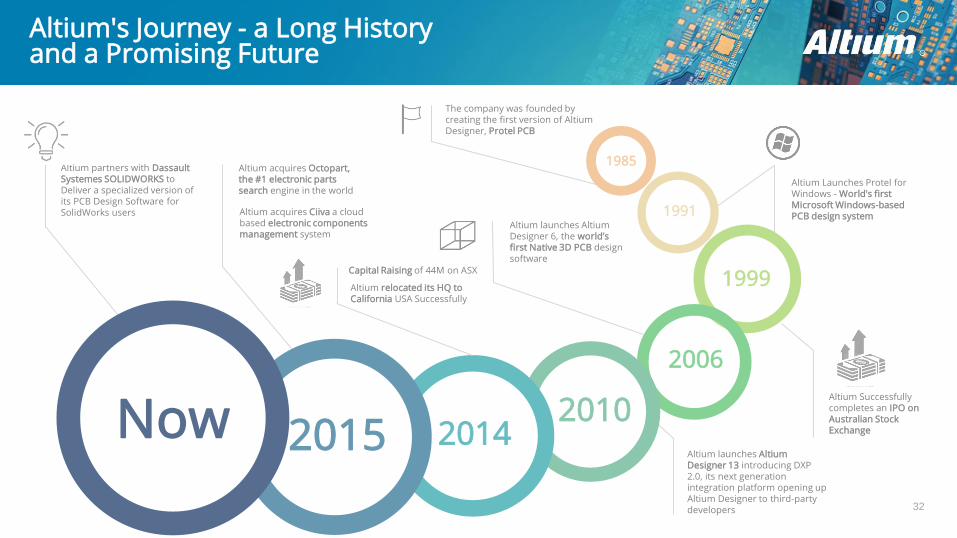
Altium's Journey - a Long History and a Promising Future
2010
1985
1991
1999
The company was founded by creating the first version of Altium Designer, Protel PCB
Altium Launches Protel for Windows - World's first Microsoft Windows-based PCB design system
Altium Successfully completes an IPO on Australian Stock Exchange
2006
Altium launches Altium Designer 6, the world’s first Native 3D PCB design software
Altium launches Altium Designer 13 introducing DXP 2.0, its next generation integration platform opening up Altium Designer to third-party developers
Altium partners with Dassault Systemes SOLIDWORKS to Deliver a specialized version of its PCB Design Software for SolidWorks users
Altium relocated its HQ to California USA Successfully
Altium acquires Octopart, the #1 electronic parts search engine in the world
32
20142015Now
Altium acquires Ciiva a cloud based electronic components management system
Capital Raising of 44M on ASX

33
Printed Circuit Board Design and Manufacturing Process
Bare BoardLayout Film Assembled BoardCircuit Diagram
Design Capture Layout Fabrication Assembly

Altium Products
34

Diversity of Application
35

36
High Profile Customers
Automotive
Electronics & High-Tech
Life SciencesAerospace & Defence Consumer- Electronics
SemiconductorsIndustrial ControlsResearch & Education
Mobile Devices
Computers

Global Reach
37

38
Competition and Industry Landscape
PADS
Cadence (Allegro)ECAD
(Cadence Allegro)
Cooper & Chan
OrCAD
CADStar
PCAD
Altium (Protel)
Accel Technology (Tango)
Mentor (PADS)
OrCAD (Cadence)
CADStar (Zuken)
Ma
ins
tre
am
CADSoft (Eagle)Eagle
CR-5000/8000 Zuken
Racal-Redac
Zuken(CR-2000)
National Instruments
(Electronic Workbench)
Electronic Workbench
Pulsonix
Hig
h-e
nd
1960’s & 1970’s 1980’s 1990’s 2000’s 2010’s 2020
Low
-end
Altium (Designer)
Zuken (CR-5000, CR-8000)
PC Based
Workstation
Based
Daisy
Cadnetix
Veribest (Intergraph) Mentor (Expedition)
Mentor Graphics
(Board Station)
Browser-based PCB Tools
Growth
(LTM)
3%
3%
17%
7%

Current Market Share for the ‘Big Four’PCB Software Companies
39
37%
29%
18%
16%
Altium
Cadence
Mentor
Graphics
Zuken
Revenue Share - Pure PCB Excluding Wire Harness, IC Packing and Services
This chart depicts market share based on the most recent financial reports for the ‘Big Four’ PCB software companies (Mentor Graphics,
Cadence Design Systems, Zuken and Altium) and the breakdown of the addressable market based on Gary Smith’s PCB Market Trends Report.

7.82
21.635.09
13.26
2.37
4.52
2.81
6.34
1.9
4.6
2014 2022
0
10
20
30
40
50
60
Tota
l R
evenue (
Bill
ions)
CAD CAE CAM AEC EDA
13.9%
13.0%
8.3%
10.6%
11.8%
40
Global Engineering Software Market revenue, 2014 and 2022
Computer Aided
Design (CAD)
Electronic Design
Automation (EDA)
Computer Aided
Engineering (CAE)
Computer Aided
Manufacturing (CAM)
Architecture
Engineering &
Construction (AEC)
Segments CAGRRevenue
Source: Transparency Market Research

41
The Altium Advantage
Transformational Leadership
Established Global Business User-Centric DNA

Altium’s Leveraged Sales Strategy
42

Altium’s High-Level Strategy
43

Altium’s Long-Term Outlook
Altium’s goal is to achieve $200 million in revenue by 2020
The proliferation of electronics through the rise of smart connected devices is
driver of growth for our business for the foreseeable future
Altium will continue to drive top line growth while expanding operating margin
to enter and maintain 30% plus
Altium expects to see continuing growth in revenue
Altium is confident that achieving market leadership in PCB design software
by 2020 is well within its reach