
2017 Half Year Results Presentation - Amazon Web …...225 211 H1 17 H1 18 Working Capital (£m)...
39
2018 HALF YEAR RESULTS PRESENTATION 7 August 2018 Good Revenue Growth Momentum
Transcript of 2017 Half Year Results Presentation - Amazon Web …...225 211 H1 17 H1 18 Working Capital (£m)...

2018 HALF YEAR RESULTSPRESENTATION
7 August 2018
Good Revenue Growth Momentum

CAUTIONARY STATEMENT REGARDING FORWARD-LOOKING STATEMENTS
This presentation contains certain forward-looking statements with respect to the financial condition, results, operations and business of Intertek Group plc.
These statements and forecasts involve risk and uncertainty because they relate to events and depend upon circumstances that will occur in the future.
There are a number of factors that could cause actual results or developments to differ materially from those expressed or implied by these forward-looking statements and forecasts.
Nothing in this presentation should be construed as a profit forecast.
7 August 2018
2

AGENDA
3
Performance Highlights
H1 2018 Financial Results
Strategic Update
2018 Outlook by Division
Summary
01
05
04
03
02

01
4
PERFORMANCEHIGHLIGHTS

225 211
H1 17 H1 18
Working Capital (£m)
CONTINUOUS PROGRESS ON REVENUE, MARGIN AND CASH
5
1,372 1,348
H1 17 H1 18
Revenue (£m)
224 226
H1 17 H1 18
Operating Profit (£m)
16.3% 16.8%
H1 17 H1 18
Operating margin (%)
90.4 91.2
H1 17 H1 18
Adjusted EPS (p)
23.5 31.9
H1 17 H1 18
Interim Dividend (p)
+3.9% CCR(1.8%)
+6.4% CCR+0.8%
+40bps CCR+50bps
+6.8% CCR+0.9%
+35.7%7.7% of Revenue18.2% of Revenue1
1 Rolling 12 months revenue
(6.5%)YoY

ORGANIC REVENUE GROWTH ACCELERATION
6
H1 organic growth by division
Note: (1) At 2018 constant currency rates
1.7%
2.5%
3.4%
H1 17 H2 17 H1 18
Organic growth at constant currency
Organic revenue growth1 (%)
Revenue growth (%)
(10.0%)
10.0%
76% of
earnings
(10.0%)
[]%
Products: +5.7%
Trade: +0.7%
Resources: (0.7%)
18% of
earnings
6%10.0%
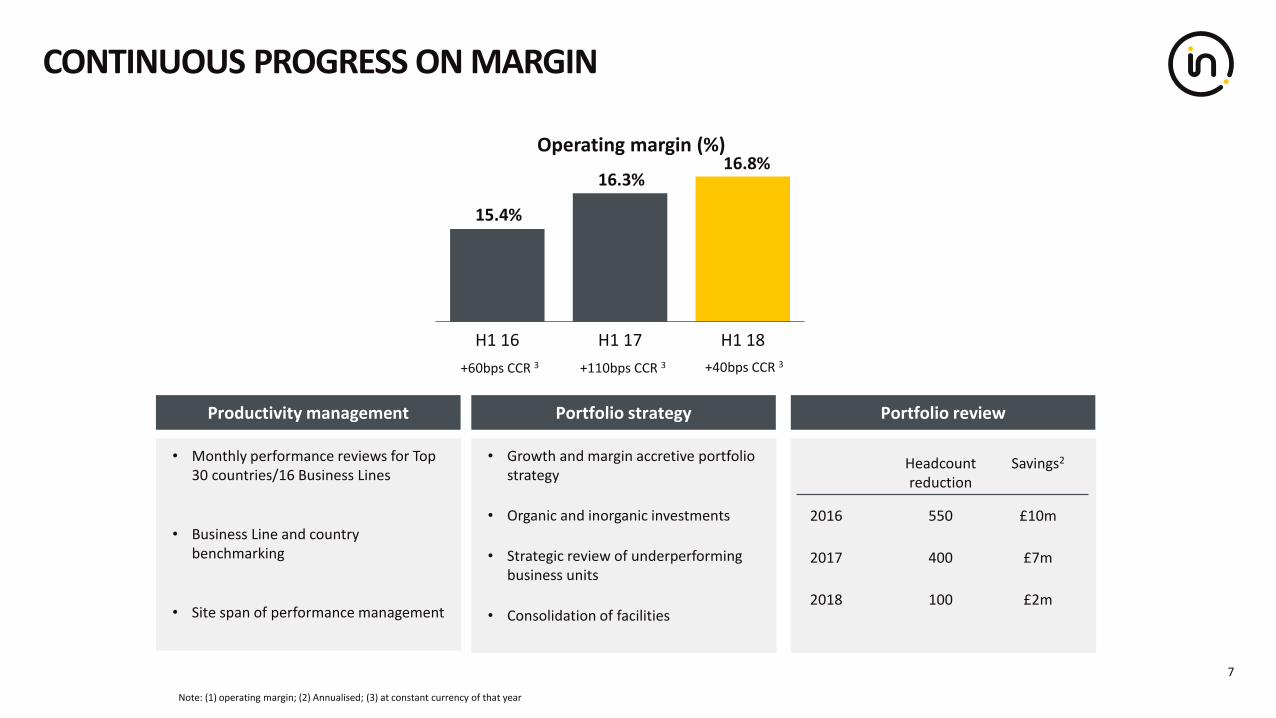
Portfolio review
• Growth and margin accretive portfolio strategy
• Organic and inorganic investments
• Strategic review of underperforming business units
• Consolidation of facilities
Headcountreduction
Savings2
2016 550 £10m
2017 400 £7m
2018 100 £2m
Note: (1) operating margin; (2) Annualised; (3) at constant currency of that year
Productivity management Portfolio strategy
• Monthly performance reviews for Top 30 countries/16 Business Lines
• Business Line and country benchmarking
• Site span of performance management
CONTINUOUS PROGRESS ON MARGIN
7
+60bps CCR 3 +110bps CCR 3 +40bps CCR 3
15.4%
16.3%16.8%
H1 16 H1 17 H1 18
Operating margin (%)

02
8
H1 2018 FINANCIAL RESULTS

KEY P&L FINANCIALS
9
YoY %
H1 18 ActualRates
Constant Rates
Revenue £1,347.7m (1.8%) 3.9%
Organic revenue1 £1,339.4m (2.3%) 3.4%
Operating profit2 £225.8m 0.8% 6.4%
Operating profit margin2 16.8% 50bps 40bps
Adjusted diluted EPS2 91.2p 0.9% 6.8%
Notes: (1) Organic revenue excludes the impact of acquisitions and disposals in 2017 and 2018; (2) Before separately disclosed items
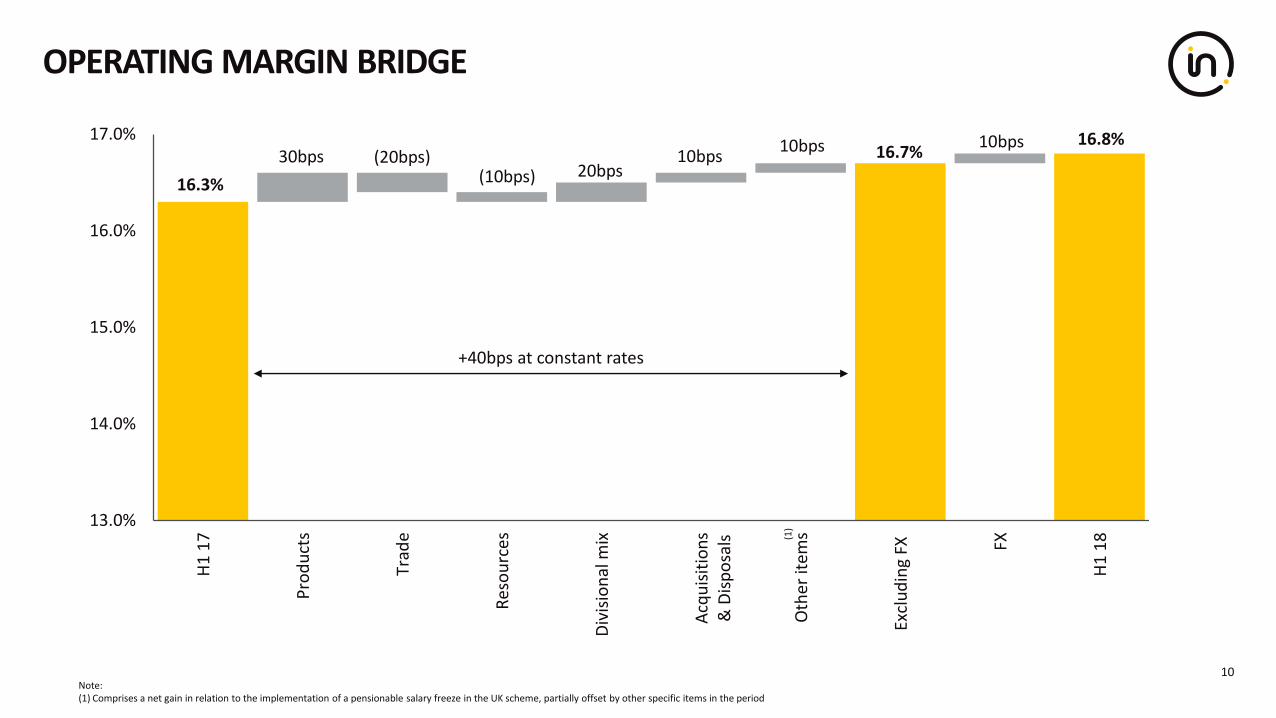
OPERATING MARGIN BRIDGE
10
16.3%
16.8%16.7%30bps
20bps10bps
10bps 10bps(20bps)
(10bps)
13.0%
14.0%
15.0%
16.0%
17.0%
H1
17
Pro
du
cts
Trad
e
Res
ou
rces
Div
isio
nal
mix
Acq
uis
itio
ns
& D
isp
osa
ls
Oth
er it
ems
Excl
ud
ing
FX FX
H1
18
+40bps at constant rates
Note:(1) Comprises a net gain in relation to the implementation of a pensionable salary freeze in the UK scheme, partially offset by other specific items in the period
(1)

£m @ actual exchange rates H1 17 H1 18
Adjusted operating profit1 223.9 225.8
Depreciation/amortisation 47.3 43.8
Change in working capital (52.3) (75.4)
Other2 7.1 9.9
Adjusted cash flow from operations 226.0 204.1
Net capex (33.9) (46.3)
Other3 (68.1) (67.2)
Free cash flow 124.0 90.6
Acquisitions4 (10.5) (10.6)
Net debt 696 568
CASH FLOW & NET DEBT
11Notes:(1) Before Separately Disclosed Items; (2) Comprises Special Pension payments, add back Equity Settled transactions and other Non-Cash Items; (3) Comprises: Exceptionals, Interest Paid/Received and Tax; (4) Total cash consideration in HY18 for 2018 acquisition £13.0m, net of cash acquired £10.6m

FINANCIAL GUIDANCE
12
Note: Before any material change in FX rates and any additional M&A
FY 2018 Guidance
Net finance cost £28 – 30m
Effective tax rate 25.3 – 25.8%
Minority interest c.£20m
Diluted shares (as at 30 June 2018) 163.0m
Capex £130 – 140m
Net Debt (incl. acquisition of Alchemy) £800 – 850m

STRATEGIC UPDATE
03
13

INTERTEK HIGH QUALITY EARNINGS MODEL
14
Ou
r Se
rvic
es Testing Inspection CertificationAssurance
ResourcesTradeProducts
Ou
r Se
cto
rsO
ur
Mid
-to
Lo
ng-
Term
V
alu
e C
reat
ion
GDP+ GDP growth Long-term growth
GDP+ Organic revenue growth
Margin accretive revenue growth
Strong free cash flow
Disciplinedcapital allocation
Investments in attractive growth and margin sectors
with Capex / M&A
Intertek Virtuous Economics

ATTRACTIVE GROWTH IN THE $250BN GLOBAL QUALITY ASSURANCE MARKET
$50BNCurrently outsourced
$200BNCurrently in-house
Existing & New customers:
Existing customers:
• Outsourcing
• Increase account penetration
• ATIC cross selling
New customers:• New contracts
15

ATTRACTIVE STRUCTURAL GROWTH DRIVERS
16
6% of Group profit based on global growth drivers in the energy sector
Long-term growth
Resources
17% of Revenue 6% of Profit
Long term demand for energy
Investment in infrastructure
Supply chain risk management
Sustainability of energy supply
Growth in alternative energy
Focus on health & safety
76% of Group profit based on GDP agnostic growth drivers
Products
60% of Revenue 76% of Profit
Increased number of Brands & SKUs
Faster innovation cycle
Increased regulation
Increased corporation focus
on risk management
Increased consumer focus on
sustainable products
Improvements in safety,
performance and quality
GDP+
18% of Group profit based on global trade growth
23% of Revenue 18% of Profit
Trade
Population growth GDP growth
Development of regional trade
Increased focus on traceability
Growth in transport
infrastructure
Growth in port infrastructure
GDP growth
Growth outlook: GDP+ Organic revenue growth in real terms

5X5 DIFFERENTIATED STRATEGY FOR GROWTH
Differentiated Brand Proposition
Superior Customer Service
Effective Sales Strategy
Growth and Margin Accretive Portfolio
Operational Excellence
5 Strategic Priorities 5 Enablers
Living Our Customer Centric Culture
Disciplined Performance Management
Superior Technology
Energising Our People
Delivering Sustainable Results
5x5 Strategic Goals
Fully engaged employees working in a safe environment
1 2 3 4 5
Superior customer service in Assurance, Testing, Inspection and Certification
Margin accretive revenue growth based on GDP+ organic growth
Strong cash conversion from operations
Accretive, disciplined capital allocation policy
17

INTERTEK TQA VALUE PROPOSITIONA SYSTEMIC APPROACH TO QUALITY ASSURANCE
18
Helping corporations manage the complexity of their supply chains by taking an end-to-end approach to quality assurance

KAIZEN: OPERATIONAL MARGIN ACCRETIVE SOLUTIONS
Technology Based Innovations
INNOVATION AND KAIZEN
Shared Services SystemsOperating Systems
INNOVATIONS: CUSTOMER FACING DIFFERENTIATED SOLUTIONS
Digital Based InnovationsAcquisition of leading and
innovative solutions
19

INNOVATIONS: PRODUCTS
• Customer insight: Our customers collect vast quantities of valuable feedback from consumers. However, analysing this data to deliver actionable product quality improvements can be challenging
• Electrical & Network Assurance innovation: Our experts use advanced data analysis techniques to quickly identify common issues and then work with our customers to design bespoke solutions aa
• Customer benefit: Our customers are able to better leverage their customer feedback data and to deliver improved products to consumers faster
Voice of the Consumer
20
• Customer insight: Stakeholder expectations and growing supply chains complexity mean that customers are more focussed on the environmental impact of their business than ever before
• Business Line agnostic innovation: Intertek’s expertise allows us to offer a comprehensive suite of sustainability services, assuring sustainability across our customers’ entire business #
• Customer benefit: Customers are able to anticipate, navigate, validate, and achieve their current and emerging sustainability requirements and goals
Intertek Sustainability
• Customer insight: With increasing regulation, supply chain complexity and a stronger focus on risk management, it is increasingly important for our customers to truly understand their supply chains
• Business Assurance innovation: InlightTM Network is a trusted SaaS platform for suppliers to share their validated business profile and audits, giving organisations information on their suppliers identities, capabilities and compliance levels
• Customer benefit: Through this Network of validated suppliers, customers are able to gain greater visibility of their supply chain risks, build resilience into their global operations and safeguard their reputation
InlightTM Network

• Customer insight: Our clients value high quality and independent expertise in the services they receive from their Total Quality Assurance Partner
a
• Caleb Brett innovation: We have strengthened our differentiated offering by rebranding our Cargo/AA business Caleb Brett leveraging the strong heritage of our founder who invented marine surveillance
• Customer benefit: This innovation clearly expresses our industry leadership true to the principles of our founder, Caleb Brett: “I will treat each cargo as if it were my own”
• Customer insight: For small farmers in Sub-Saharan Africa, meeting the safety and quality regulations required to bring their crop to market can mean an expensive and time consuming testing process
• AgriWorld innovation: Our experts have developed a unique Mobile Crop Quality Toolkit, empowering small farmers to test their crop on-site at their own farms
• Customer benefit: In combination with training from Intertek experts, can enable an entire community of small farmers to maximise the quality of their crops and to bring them to market in compliance with local regulations
Mobile Crop Quality Toolkit
INNOVATIONS: TRADE
• Customer insight: For ExxonMobil, ensuring that they offer high quality fuel is of mission critical importance to their $300 million in fuels logistics, product inventories and marketing, into the Mexico retail fuel market
• Caleb Brett innovation: In collaboration with ExxonMobil experts, Intertek has mobile laboratories, giving ExxonMobil the flexibility required to test fuel quality across their fast growing Mexico retail business following special requirements from their Quality and Quantity Program
• Customer benefit: The Mobile Laboratories provide a competitive advantage to ExxonMobil in the market, and give their consumers the peace of mind that the fuel they purchase is of the correct quantity and the highest quality
MAI: Mobile TestingCaleb Brett
21

INNOVATIONS: RESOURCES
• Customer insight: Our Oil Industry customers value rapid, accurate assessment of the quality of their crude oil
aa
• Exploration & Production innovation: Intertek has the only database of near-infrared spectrum analysis of crude oil in the world. This puts us in the unique position of being able to analyse crude oil quality in real time using advanced spectrum analysis techniques
• Customer benefit: Customers are able to assess the quality of their crude oil within minutes, a substantial improvement over the days/weeks taken by traditional lab-based tests
Near-Infrared Spectral Database
22
• Customer insight: Greenlink is a major infrastructure project to link the power markets in Great Britain and the Republic of Ireland. Minimising the impact on the marine environment is key for the project a
• Industry Services innovation: Intertek’s experts provide vital marine environmental support for the project, ensuring regulatory compliance and environmentally conscious project planning
a
• Customer benefit: Intertek’s expertise allows the project to be delivered efficiently and with minimal impact on the marine environment
Greenlink Interconnector Project
• Customer insight: Pipeline asset owners require a way in which to accurately track and monitor vital asset information
• Industry Services innovation: Following the successful launch of Intertek PipeAware™, an industry-leading software solution that allows customers to access real-time information on their asset inspection data throughout all stages of manufacturing, Intertek has extended the reach with PipeAware™2, to track and monitor all aspects during construction
• Customer benefit: Customers are provided with a unique solution which combines traceability software with inspection expertise, to achieve full transparency into the pipeline manufacturing and construction process
Intertek PipeAware™ 2

OUTLOOK BY DIVISION
04

• Good organic revenue growth at constant currency
− Robust growth momentum in Products
− Solid growth momentum in Trade
− Stable revenue performance in Resources
• Moderate Group margin expansion at constant currency
− Continuous cost discipline
− Performance management
− Portfolio strategy
• Strong cash conversion
• Capex: £130m – £140m
• Net debt: £800m – £850m (incl. acquisition of Alchemy)1
24
GROUP OUTLOOK 2018
Note: (1) Before any material change in FX rates and any additional M&A

EXCELLENT PERFORMANCE IN PRODUCTS
25
799 806
H1 17 H1 18
Revenue (£m)
798 799
H1 17 H1 18
Organic Revenue (£m)
164 172
H1 17 H1 18
Operating Profit (£m)
20.5% 21.3%
H1 17 H1 18
Operating Margin (%)
+6.4% CCR+0.9%
+5.7% CCR+0.2%
+10.3% CCR+4.6%
+70bps CCR+80bps
Growth Drivers
Increased number of Brands & SKUs
Supply chain expansion in new
markets
Increased demand in chemical testing
SoftlinesSolid organic
growth
Hardlines
Electrical & Network Assurance
HY18 Actual
Innovation from our customers leveraging wireless technology
Increased demand for chemical testing
Innovative inspection technology
Good organic growth
Electrical appliance innovations to provide better efficiency and
connectivity
Increased demand for IoT Assurance services, including cyber
security
Robust organic growth
FY18 Outlook
Solid organic growth
Good organic growth
Robust organic growth

Growth Drivers
ISO standards upgrades
Increased focus of corporations on supply
chain and risk management
Increased consumer and government focus on ethical
and sustainable supplyBusiness Assurance
Building & Construction
Transportation Technology
Growing demand for greener, safer and higher quality commercial buildings
Increased investment in large infrastructure projects
Continued investment of our clients in new models and new
fuel efficient engines
Growth in the hybrid / electric engine
segment
Food
Chemicals and Pharma
Continuous food innovation
Increased focus on the safety of supply chains
Growth in the food service assurance
business
Increased scrutiny on emissions
Growth of SKUs
Expansion of the supply base in emerging markets
Increased concerns on product safety and
traceability
EXCELLENT PERFORMANCE IN PRODUCTS
26
HY18 Actual FY18 Outlook
Robust organic growth
Robust organic growth
Double-Digit organic growth
Double-Digit organic growth
Strong organic growth
Strong organic growth
Robust organic growth
Robust organic growth
Robust organic growth
Robust organic growth

Global and regional trade structural growth drivers
Increased transport infrastructureCaleb Brett
(Cargo / AA)
Government & Trade Services
AgriWorld
Award of new contracts
GDP growth Population growth
The expansion of our clients’ supply chains in fast growing markets
New customer wins
326 311
H1 17 H1 18
Revenue (£m)
326 309
H1 17 H1 18
Organic Revenue (£m)
46 42
H1 17 H1 18
Operating Profit (£m)
14.1%13.4%
H1 17 H1 18
Operating Margin (%)
+1.1% CCR(4.7%)
+0.7% CCR(5.2%)
(3.3%) CCR(9.6%)
(60bps) CCR(70bps)
SOLID PERFORMANCE IN TRADE
27
Growth DriversHY18 Actual FY18 Outlook
Below last year Below last year
Stable organic growth
Solid organic growth
Robust organic growth
Robust organic growth
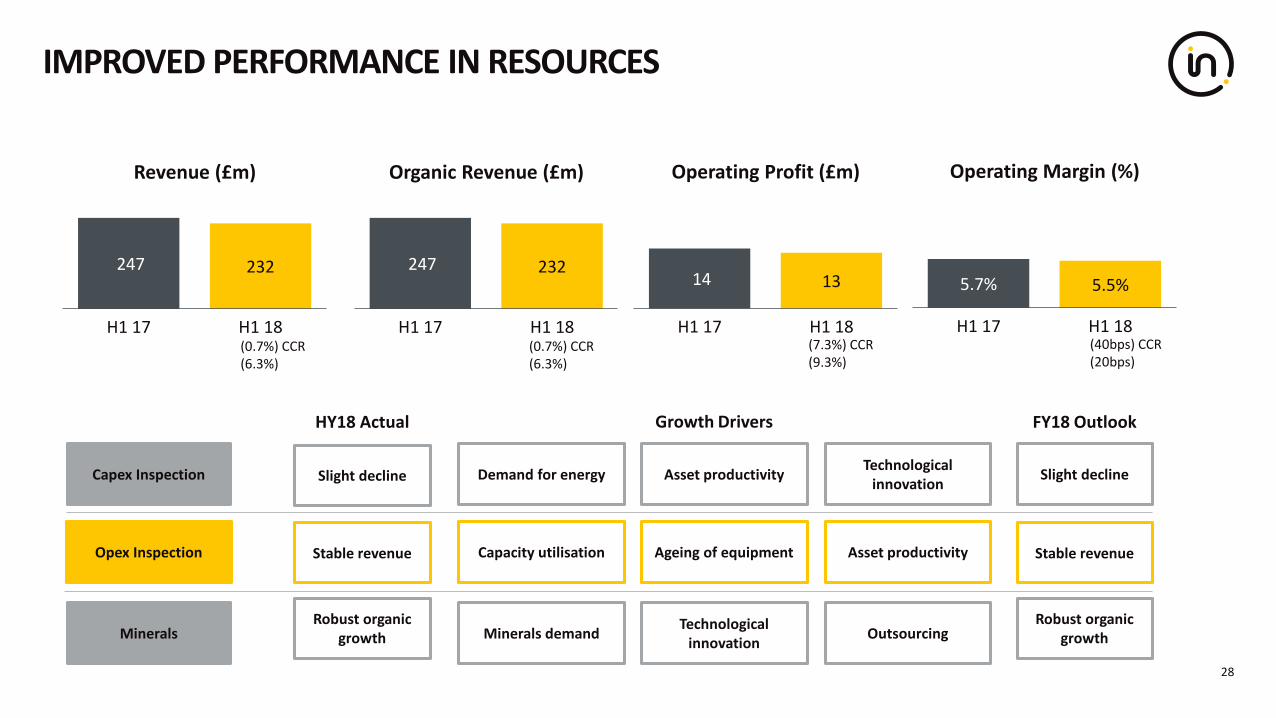
247 232
H1 17 H1 18
Revenue (£m)
247 232
H1 17 H1 18
Organic Revenue (£m)
14 13
H1 17 H1 18
Operating Profit (£m)
5.7% 5.5%
H1 17 H1 18
Operating Margin (%)
(0.7%) CCR(6.3%)
(0.7%) CCR(6.3%)
(7.3%) CCR(9.3%)
(40bps) CCR(20bps)
IMPROVED PERFORMANCE IN RESOURCES
28
Minerals demandTechnological
innovationMinerals
Capex Inspection
Opex Inspection
Demand for energy Asset productivityTechnological
innovation
Capacity utilisation Asset productivityAgeing of equipment
Outsourcing
Growth Drivers
Slight decline
HY18 Actual
Stable revenue
Robust organic growth
FY18 Outlook
Slight decline
Stable revenue
Robust organic growth

Acumen SecurityAldo Abela
SurveysProasem NTA Monitor Alchemy
Business line Network Assurance Cargo / AA Cargo / AA Network Assurance People Assurance
Location USA Malta Colombia UK, Malaysia USA
Completion Date December 2017 March 2018 April 2018 June 2018 Q3 2018
Market position
A trusted security certification and assurance partner to many
of the world’s leading IT solutions providers
A leading provider of quality and quantity cargo inspection
services
Leading provider of laboratory testing, inspection, metrology
and training services
A leading network security and assurance services provider
A leading provider of SaaS solutions for People Assurance
Growth driversIncreased corporate and consumer focus on data
security
Structural growth in regional and global trade flows
Structural growth in regional and global trade flows
Increased corporate and consumer focus on data
security
Increased focus on food safety, and increased regulation;
scalability
RNS Acumen Aldo Abela Surveys (AAS) Proasem NTA Monitor Alchemy
M&A IN ATTRACTIVE MARKETS STRENGTHENING INTERTEK’S PORTFOLIO
29

ALCHEMY'S VALUE PROPOSITION ADDRESSES THE FRONT END OF SUPPLY
• Limited direct impact on safety, quality, yield and productivity
• Low risk environment• English fluent• Computer skills• Low turnover
OFFICE WORKER CHARACTERISTICS
FRONTLINE WORKER CHARACTERISTICS ALCHEMY SOLUTIONS
High Direct Impact on Safety, Compliance, Quality, Yield, Productivity and Overall Brand
Worker skills gaps diagnosis and training for Compliance / Safety and Key Operational & Cultural Communications
High Risk Environment Job / Equipment Training and Professional Consulting
Large, Highly Diverse Workforce Group-Based Mobile Gamification
Desk-less / Limited Computer Access Mobile Learning & Communication Platform
Low Engagement / High Turnover Branded Corporate Culture Solutions
FRONTLINE WORKER SKILLS GAPS DIAGNOSIS AND TRAINING
30

OPPORTUNITIES FOR SIGNIFICANT FURTHER FOOD MARKET PENETRATION
US Food & Beverage Manufacturing/Processing
Brands
Outlets/Sites
US Quick Service Restaurants
• c.25,000 companies in food & beverage processing • c.900 companies
• Over 30,000 plants
• Employing over 1.5 million workers
• Over 270,000 restaurants
• Employing over 3.7 million workers
Source: Euromonitor, BMI Research
With its 1,100 customers Alchemy captures only a fraction of its addressable market
31

ACQUISITION OF SCALABLE LEADING SAAS PEOPLE ASSURANCE PLATFORM
32
IN LINE WITH OUR M&A STRATEGY FOCUSED ON ACQUISITION OF LEADING AND INNOVATIVE SOLUTIONS SCALABLE ACROSS INTERTEK
Global Market Leader in Assurance
3,000 auditors
100,000+ audits
43,000+ employees
Global Market Leader in TIC
1,000+labs and offices
80+languages
100+countries

ALCHEMY: A VALUE ACCRETIVE TRANSACTION
• $480m on cash and debt free basis • Represents 7.2x 2018E Billings • Valuation compares favourably with comparable companies that are trading on
median 2018 EV/Revenue of 9.3x with an average expected 2018-19 growth rate of 20%**
• 20% growth p.a. in billings/revenues• >30% IFRS EBITDA by Year 5; >25% IFRS EBIT margin by year 5• Strong cash conversion / negative working capital• EPS accretive on a Billings basis from Year 1 • ROIC > Group WACC by year 5
• Funded from existing facilities and cash
DEAL METRICS
FINANCING
5 YEAR GUIDANCE
** Based on average of 58 U.S. based SaaS companies
* Adjusted for non-recurring items33

SUMMARY
05
34

• Consistent progress on revenue, margin, cash and returns with interim dividend up 35.7%
• TQA Value Proposition delivering superior customer service with ATIC offering
• GDP+ organic revenue growth outlook in real terms with attractive structural growth drivers:
• Disciplined margin, cash performance and capital allocation
• M&A targeting businesses with attractive growth and margin prospects
SUMMARY
6% of Group profit18% of Group profit76% of Group profit
Products Trade Resources
Global growth drivers in the energy sector
Global trade growthGDP agnostic growth drivers
“We are on track on our ‘good to great’ journey,
making progress on both performance and strategy”


GROUP PERFORMANCE (H1 17 – H1 18)
37
247 232
326 311
799 806
1,372 1,348
H1 17 H1 18
Revenue (£m)
14 13
46 42
164 172
224 226
H1 17 H1 18
Adjusted Operating Profit (£m)
Margin Key Metrics H1 2018
H1 17 H1 18% Group Revenue
% Group Profit
Organic Revenue Growth1
Products 20.5% 21.3% 60% 76% 5.7%
Trade 14.1% 13.4% 23% 18% 0.7%
Resources 5.7% 5.5% 17% 6% (0.7%)
Group 16.3% 16.8% 100% 100% 3.4%
(1) At 2018 constant currency rates

Margin Key Metrics 2017
FY 16 FY 17% Group Revenue
% Group Profit
Organic Revenue Growth1
Products 20.3% 21.6% 59% 75% 5.5%
Trade 14.0% 13.7% 23% 19% 3.0%
Resources 5.8% 5.7% 18% 6% (8.6%)
Group 16.0% 16.9% 100% 100% 2.1%
GROUP PERFORMANCE (2016 – 2017)
38
517 496
585 648
1,466 1,625
2,567 2,769
FY 16 FY 17
Revenue (£m)
30 29 82 89
298 350
410468
FY 16 FY17
Adjusted Operating Profit (£m)
(1) At 2017 constant currency rates

KEY INVESTOR INFORMATION
39
Key dates:
2018 Half Year Results 7 August 2018
2018 Trading Update 27 November 2018
Conference attendance:
UBS, Support and Business Services Conference, London 12 September 2018 IR
KeplerCheuvreux Autumn Conference, Paris 13 September 2018 IR
Bernstein, Strategic Decisions Conference, London 26 September 2018 CEO, IR
Berenberg, Testing, Inspection & Certification Conference, London 9 October 2018 CEO, IR
Key contacts:
Denis Moreau, VP Investor Relations; +44 (0)20 7396 3400; [email protected]
www.intertek.com/investors


![H1 - Financial Year 2016 - EDAGir.edag.com/download/companies/edag/Presentations/H12016... · Analyst Presentation – H1 2016 355.2 362.4 H1 2015 H1 2016 Core Revenue [m€] Revenues](https://static.fdocuments.in/doc/165x107/5f746af321bff008d84401b2/h1-financial-year-2016-analyst-presentation-a-h1-2016-3552-3624-h1-2015.jpg)


