Alpha edge - January 2016
26
www.citadelle.in Questions Insight Analysis Action “Why the delay?” India Strategy | January 2016
-
Upload
socialcitadelle -
Category
Economy & Finance
-
view
58 -
download
1
Transcript of Alpha edge - January 2016

www.citadelle.in
Questions
Insight
Analysis
Action
“Why the delay?”
India Strategy | January 2016


January 2016 3
End of fear? India Strategy | January, 2016
Foreword
Dear Investor,
The year ended more or less on a flattish note with Nifty shedding 4.1%. When compared to the year
earlier (CY2014 - ~30%) 2015 is a pretty forgettable one. Our fear that Equity Markets will both price
and time correct, and that Liquid Funds may do better than Equities turned out to be true {as shared in
the March 2015 note}. Infact 2015 could be termed as the year when “High hopes turned in to realism”
and new investors bore the brunt of it. 2015 started with hopes of big ticket reforms like the Land bill & GST, earnings recovery,
improvement in macroeconomic condition on lower commodity prices etc., eventually realism set in, in that they may been expecting
too much, too soon. This realism may spread wider, causing further negative sentiments in the near term, gravitating the Nifty to
around 7000 +/- 200 points. That’s when value may emerge and the next leg of the bull market is likely to resume. You may well be
reminded of the frustrating time of 2012 & 2013, when markets went sideways till it became cheap enough to re-rate.
Going by the four thumb rules that form the basis for our expectation of higher equity returns, the picture is far from encouraging…
a) Attractive valuations aren’t cheap to begin with b) earnings growth & momentum isn’t strong even if valuations are expensive c)
interest rate cuts aren’t translating into softening secondary market yields d) and confidence inspiring progress in policy making is
lacking. On each of the counts we may not exactly be in a sweet spot. Moreover, there are upside risks to inflation and fund flows
from FIIs. Especially the latter. Anecdotally we hear that one another fall out of collapsing oil & commodity prices is a steady increase
in redemptions by Sovereign Wealth Funds, which for years have funded the actual liquidity that circulates globally. A few of them
have started to develop deficits that need to be funded back home. We wonder if this is why Saudi’s are considering an IPO of Aramco.
Are we then looking at a repetition of 2008 that we should be afraid of? We don’t think so, unless US markets extends its price
correction well after a year of time correction in 2015. Speaking of which, there are worrying and increasing divergences in the
internals of US markets. For example, Down Jones Transportation Index is already in a bear market that is not evident in S&P 500
which is skating on thin ice with the support of its FANG {Facebook, Amazon, Netflix and Google}. Widely evident is a general technical
weakening of long term picture that needs reverse quickly, along with a revival in its broader markets. We will change our mind if it
doesn’t improve.
Back home, where our bread and butter lies, we think that there has been a delay in the recovery and that all is not yet lost. We are
in an environment where the ground is changing structurally thanks to the executive reforms {different from legislative reforms, GST
etc.,} and other various initiatives undertaken by the government along with the certain technological changes impacting existing
businesses. Generally the process of change is painful and we are witnessing the same in our earnings, however the long term outcome
of it would be more than fruitful. In all, 2016 may not the year of great returns without deft exploitation of market rallies through
tactical asset allocation calls just like 2015. For those who have been ahead of the curve in 2015, excellent re-entry points will emerge
that need to be bought into rather than feared. Remember 2013… Ah! How time flies.
For those interested in bottoms up stock picking strategy, we have overhauled our process and made it completely quantitative. This
approach, a first in India, will make it easier for investors to believe in what they are investing in, due to its simplicity and transparency.
As 2016 is likely to be the year where one would be better off sticking with the best, a portfolio of our 4* and above rated stocks,
some 30 of the best in the country can work well, just as it could have been in 2015. Read on to find out how a quantitative method
that cuts all noise in the process of investing, may well have beaten most fund managers. This portfolio strategy of 4* and above
rated stocks, would have delivered 26% CAGR vs Nifty return of 14.5%. At sectoral level we are bullish on consumer discretionary as a
theme and we believe Pharma & Media will do well.
Warm Regards,
A V Srikanth

January 2016 4
Alpha Edge | “Why the delay?”
Asset Class performance
Asset Class returns for Calendar Year 2015
Source: Bloomberg
2015 has been turbulent post a reset seen expectations of and Equity markets were down by 4.06%. Gold has been the worst performer with returns of 7.19%.
FII Flows for CY 2015
Source: ACEMF
Equity as well as Debt markets have seen outflows in December. Equities saw a net outflow of Rs 2,817 Crs whereas Debt market has seen net inflow of Rs 5,488 Crs. The outflows have been due to rate hike by US Federal Reserve.
Sector Returns for CY 2015
Source: Bloomberg
Consumer Durables, Healthcare and IT have been
outperformers for CY 2015. Metal, PSU and Realty have
been the laggards during the same period.
-4.06%
7.48% 8.01%
-7.19%-8.00%
-6.00%
-4.00%
-2.00%
0.00%
2.00%
4.00%
6.00%
8.00%
10.00%
Equity 10 yrTreasuries
Cash Gold
Asset Class Returns For CY 2015
Equity 10 yr Treasuries Cash Gold
47 3771
-53
83133
-3
128 113 97
18
-6
4
9
12
5
46
42
35
-51
160
46
-100
-50
0
50
100
150
200
250
300
20
05
20
06
20
07
20
08
20
09
20
10
20
11
20
12
20
13
20
14
19
05
FII F
low
s (i
n `
00
0 C
rs)
Equity Debt
-31.2
-17.2
-13.6
-9.9
-8.5
-6.4
-5.0
-3.4
-0.6
1.4
3.6
4.5
6.8
7.4
15.1
24.0
-35.0 -21.0 -7.0 7.0 21.0 35.0
S&P BSE METAL Index
S&P BSE PSU
S&P BSE Realty Index
S&P BSE BANKEX
S&P BSE Capital Goods
S&P BSE Power Index
S&P BSE SENSEX
S&P BSE OIL & GAS Index
S&P BSE AUTO Index
S&P BSE FMCG
S&P BSE TECk Index
S&P BSE IT
S&P BSE Small-Cap
S&P BSE Mid-Cap
S&P BSE Health Care
S&P BSE Consumer Durables
Sector Returns for CY 2015 (%)

January 2016 5
Alpha Edge | “Why the delay?”
Global markets 2015 - A recap
In 2015 there were few events that defined global markets in 2015. We have tried to list down the same and give a quick
review through a timeline
Falling oil prices
Grexit fear looms
Russian ruble crisis
China financial crisis
Our Clients
After equity markets stellar
performance around the world
in 2014, 2015 started with the
world adjusting to falling oil
prices which favoured all the
oil importing countries. Oil
plunged to $44 per barrel on
record high US oil inventories
The European Central Bank
(ECB) started its massive 60
billion euro-a-month bond-
buying program. Total bond
buying programme of $1.2
trillion. Added liquidity meant
suppression of yields which in
turn meant lower financing of
debt and faster recovery
process for Eurozone
Loose monetary policy
Greece defaults on $1.7 billion
payment to IMF. Greece becomes
the first developed nation to default
on payment. It was almost
confirmed that Greece will exit,
however Greece cut a deal with its
lenders but emerging markets came
under pressure again as currency
weakness dented investor
confidence in the regions. Eurozone
leaders reach an agreement over
third Greek bailout
Ruble hits a new low with falling oil
prices and economic sanctions. Oil
constitutes about 70% of total
exports for Russia. On top of the oil
slump, Russia is also facing pain
from Western sanctions imposed
over its role in the crisis in Ukraine. This double hit has pushed Russia
into deep recession. Russia's
economy shrank 4.6% in the second
quarter, the biggest drop since the
global financial crisis in 2009 Stock market in China collapsed 40%
from peak since June 2015. Chinese
economy has been on a borrowing
binge creating huge capacity. Due to
over capacity and high debt levels the
Chinese economy has slowed to a
multi year low. China devalued yuan
to spur exports which rattled the
markets. The world took notice of the
problems of the economy trying to
avoid hard landing as it transitions
from an investment led to
consumption led economy.
The lift off and the normalisation
Finally as anticipated Fed raised interest rates
for the first time in nearly a decade to start
the process of normalization of rates. The
year ended as it had started with the central
bank hogging the headlines. Equities fell in
the build up to the announcement pricing the
risk off and FII’s withdrew significant amount
of money from the emerging markets.
Jan 2015
Mar 2015
July 2015
Aug 2015
Aug 2015
Dec 2015

January 2016 6
Alpha Edge | “Why the delay?”
US Interest rates – Finally the lift off
It was probably the most awaited event of the year,
and Fed finally pulled the trigger by increasing the
Fed funds rate by 25 bps to 25-50 bps. The first in
nearly a decade and signaled the end of a zero rate
era. Markets braced for it, but when it happened it
turned out to be just another day signaling that first
hike was priced in, as we anticipated.
The central bank noted that the economy has come
a long way in recovery, although not completely. This
shows that the central bank has good confidence of
a recovery in the US economy. It also mentioned the
further course of interest rate hikes would be data
dependent and the economic conditions will only
warrant gradual increases in the Fed funds rate with
expectation of economy growing at 2.4% next year
and unemployment falling further to 4.7%.
The first hike was anticipated but the risk now lies in
the market’s expectations of a “slow and low” rate
hiking cycle. Right now the path of interest hike is of
utmost importance. Since the expectation is of a
slow rate hike, if conditions later warrant for a faster
rate hike (Inflation recovering faster than
anticipated) than what is expected right now, then it
could result into volatility.
Crude oil below $40
Brent crude started the year at around US$58 a
barrel having halved in the previous six months and
hitting a new 6 year low of around $36 per barrel.
Robust production from U.S. shale-oil fields pushed
the global crude market into oversupply in late 2014,
and production rose again this year as producers,
including Saudi Arabia and Russia opted to keep
output levels high. Inventories of crude oil in the U.S.
stand near eight-decade highs as producers continue
to produce at high rates to maximize profits in a low-
price environment. Although lower crude has
benefitted by increasing the consumption
expenditure due to increase in savings, it has rattled
the energy producers with cutbacks in earnings and
oil producing nations suffering from lower revenues
and weaker currencies.
The outlook for Oil prices for 2016 still looks under
pressure as Saudi Arabia, the world’s largest oil
exporter is preparing for a long period of low returns.
Saudi Arabia announced that they will reduce the
budget deficit of $98bn for 2016 through spending
cuts and reducing subsidies whilst it intends to stick
to its policy of no cut in oil production. It shows that
they are prepared to accept cheap prices for its crude
as it seeks to put pressure on higher cost rivals such
as US shale producers and waits for the market to
rebalance. Also, once the sanctions on Iran is lifted it
will result in even higher production of oil.
Global outlook 2016
0
2
4
6
8
Jan
-91
Jan
-93
Jan
-95
Jan
-97
Jan
-99
Jan
-01
Jan
-03
Jan
-05
Jan
-07
Jan
-09
Jan
-11
Jan
-13
Jan
-15
Fed Rate
Fed Rate
020406080
100120140160
Crude oil
January 2016 7
Alpha Edge | “Why the delay?”
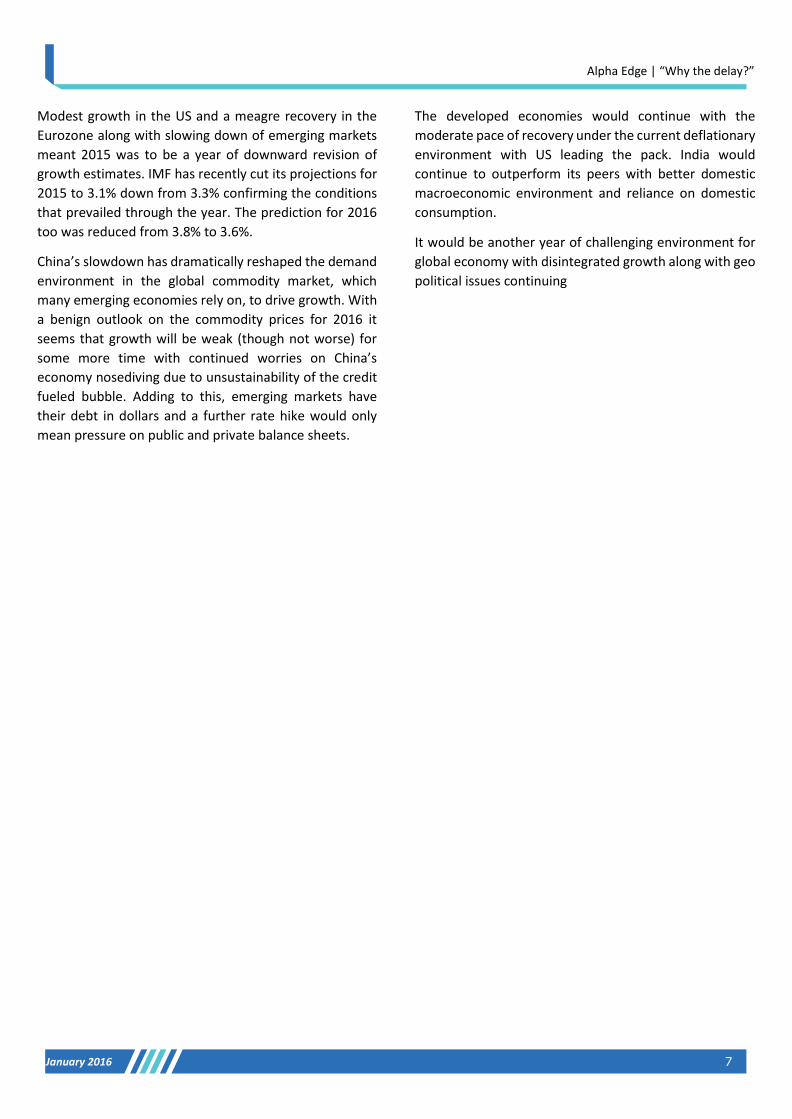
Modest growth in the US and a meagre recovery in the
Eurozone along with slowing down of emerging markets
meant 2015 was to be a year of downward revision of
growth estimates. IMF has recently cut its projections for
2015 to 3.1% down from 3.3% confirming the conditions
that prevailed through the year. The prediction for 2016
too was reduced from 3.8% to 3.6%.
China’s slowdown has dramatically reshaped the demand
environment in the global commodity market, which
many emerging economies rely on, to drive growth. With
a benign outlook on the commodity prices for 2016 it
seems that growth will be weak (though not worse) for
some more time with continued worries on China’s
economy nosediving due to unsustainability of the credit
fueled bubble. Adding to this, emerging markets have
their debt in dollars and a further rate hike would only
mean pressure on public and private balance sheets.
The developed economies would continue with the
moderate pace of recovery under the current deflationary
environment with US leading the pack. India would
continue to outperform its peers with better domestic
macroeconomic environment and reliance on domestic
consumption.
It would be another year of challenging environment for
global economy with disintegrated growth along with geo
political issues continuing

January 2016 8
Alpha Edge | “Why the delay?”
Indian Economy
The good
1) Pradhan Mantri Jan Dhan Yojana exceeds Rs.
25,000 crore – Results in financial inclusion
2) Direct benefits transfer in LPG saved Rs.
14,672 crore of subsidy last fiscal
3) Gold monetization scheme to help curb the
import of gold as the gold lying physically in
households is put to use in the economy
4) Government sets up Rs 40,000 crore National
Investment and Infrastructure fund
5) Pick up in public expenditure
6) IIP making a strong come back with capital
goods and consumption clocking double digit
growth. Industrial production in India rose
9.8 percent year-on-year in October of 2015,
the fastest pace since October of 2010 when
it went up 10 percent. Manufacturing output
jumped 10.6 percent, also the strongest in
five years
7) The 7th Pay commission would result in to
increase in savings and consumption
expenditure.
8) Even as growth has slowed in virtually every
other emerging market (EM), India’s growth
has accelerated over the last year
9) Low crude and other commodity prices for
the year have resulted in lowering of CAD to
1.4% of GDP from 1.8% last year H1.
10) Lower CPI & WPI numbers have resulted in
positive real interest rates.
11) A falling interest rate regime would result in
further increase in demand in the economy.
12) ‘Make in India’ campaign resulting in 35% FDI
growth wherein it has fallen by 17% in rest of
the world.
The not so good
1) Even though public expenditure is on the rise,
private expenditure is lacking
2) Urban consumption is on the rise however
rural consumption remains weak. Lower
hikes in MSP and weak monsoons
3) Missing big ticket reforms like GST & land bill
4) Weak global demand resulted in negative
topline growth for Indian companies, a bleak
outlook towards the global economy for the
next year persists
5) Second consecutive drought season resulting
in weak rural demand
6) Lack FII inflows in anticipation of the Fed rate
hike
7) Even though the Nominal GDP is growing at
10% in the last few years the earnings of Nifty
companies has been subdued.
-1.2-1.3
0.11.1
-2.0-0.5
3.75.6
4.3
0.90.5
2.6
-2.7
5.23.6
2.8
4.8
2.53.02.54.24.1
6.3
3.8
9.8
-4
-2
0
2
4
6
8
10
Oct
-13
Dec
-13
Feb
-14
Ap
r-1
4
Jun
-14
Au
g-1
4
Oct
-14
Dec
-14
Feb
-15
Ap
r-1
5
Jun
-15
Au
g-1
5
Oct
-15
IIP 3 months mov. Avg.
-2.6
-4.2 -4.7
-1.7 -1.3 -1.1
-7.6
-10.3 -10.5
-7.9-7.0
-6.4
FY11 FY12 FY13 FY14 FY15 FY16E
Current A/c deficit Trade deficit
4.9
5.9
4.94.4 4.1 3.9
FY11 FY12 FY13 FY14 FY15 FY16E
Fiscal Deficit
January 2016 9
Alpha Edge | “Why the delay?”
Why the delay… in recovery??
For most of 2015, we have been hearing about all the
good that has happened in the economy with its
growth as one of the fastest in the world, Crude
falling to lower levels helping inflation come down,
Government expenditure on the rise etc. Despite all
of the above investors aren’t really seeing ‘things
moving on the ground’ in a way that all of it
percolates to improved corporate earnings,
represented by in the Nifty/Sensex companies. Why
then is there a disparity in the growth of the
economy and the corporate profitability and why has
there been a delay in the economic recovery.
Almost 55% of the BSE100 revenues are export oriented
and are hurt by the weak global growth. Around 45% of it
is domestic oriented which too have been hurt by weak
rural economy, that’s no longer being supported by NDA
through artificial hikes in MSP that led to sustained
inflation under UPA. Further, using the decisive mandate
the NDA government is attempting to clean the fallout of
the UPA regime which pushed India towards crony
capitalism, suppression of competition, wasteful
subsidies and populist measures. The latter, especially the
uneconomical hikes in Minimum Support Prices (MSP) for
rural producers not only led to artificial inflation but also
led to transfer of money from urban to rural economy, all
of which doesn’t came back into the banking systems,
keeping the cost of capital high and liquidity poor. We
believe that the Jodi of Modi and Rajan through their
initiatives (mentioned below) are trying to address these
issues, by trying to overhaul the malaise that’s plaguing
India. It’s unfortunate that the much needed cleanup is
happening when the global growth is weak. Their policies
while good for all of us are changing things for established
business whose profits are under pressure for now as they
adapt to a new regime of transparency and competition.
What exactly are they doing and how some of it is it
hurting listed companies temporarily?
1) Moving from Physical assets to Financial
assets- India has one of the highest savings
rate in the world, despite that we have high
interest rates. The prime reason for the same
is most of the savings go into physical assets
like gold, real asset etc. which is ideally not
put to use in the economy. Modi introduced
several measures that bring the parallel
economy to main stream by building bridges
between the two. Initiatives like Jan Dhan
accounts, promoting use of Aadhar card, Gold
monetization scheme etc. move the physical
savings into financial savings steadily, which
would eventually lead to even higher
financial savings and higher availability of
capital to all at sustainably lower costs. The
lower cost of debt would help businesses
grow and increase overall demand which
creates more jobs in the economy.
2) Transition from protective to Competitive
business environment. While we moved
away from the license raj of yore, India’s
growth is still concentrated in the hands of a
few. The Modi government wants to change
that through many interconnected steps. Like
relaxing the regulatory environment for
businesses, expediting FDI proposals and
increasing the limit that needs government
approval, transparent auctions of natural
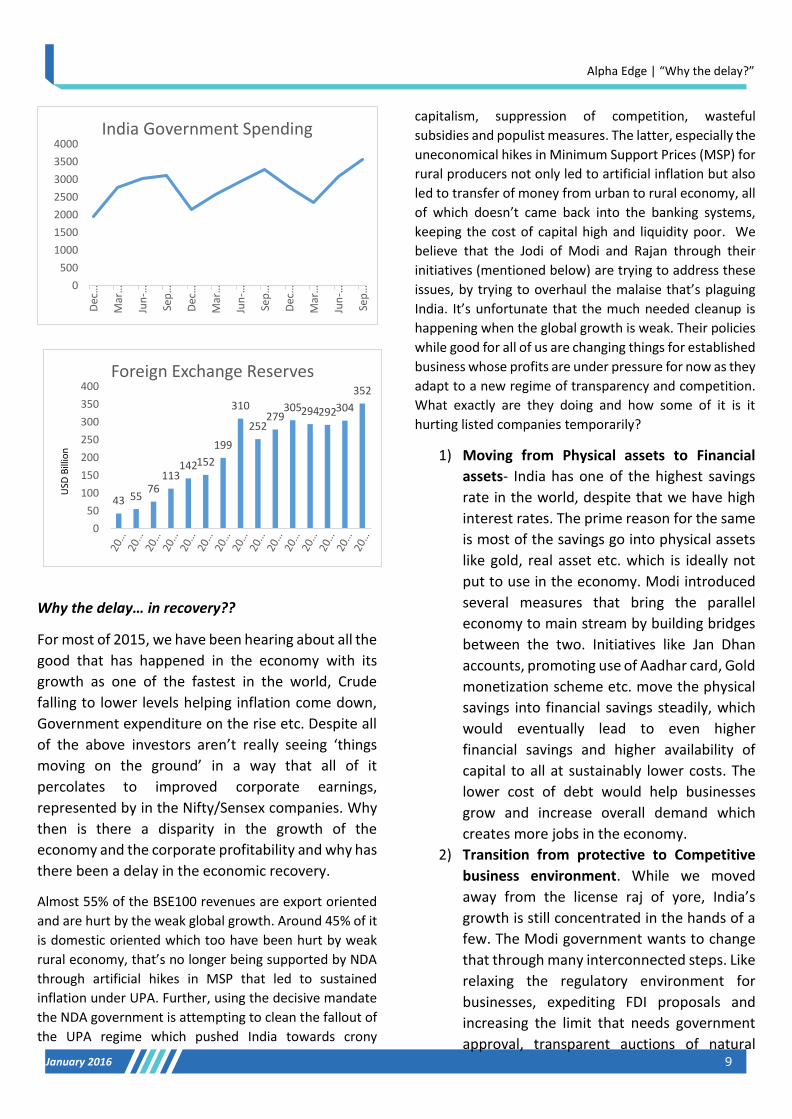
43 5576
113142152
199
310
252279
305294292304
352
0
50
100
150
200
250
300
350
400Foreign Exchange Reserves
USD
Bill
ion
0
500
1000
1500
2000
2500
3000
3500
4000
Dec
…
Mar
…
Jun
-…
Sep
…
Dec
…
Mar
…
Jun
-…
Sep
…
Dec
…
Mar
…
Jun
-…
Sep
…
India Government Spending
January 2016 10
Alpha Edge | “Why the delay?”
resources, faster environmental clearances,
digital India initiative, and simplification of
procedures through online mechanism and
passing of crucial Bills through the ordinance
route. All these steps make the business
environment more conducive but much more
competitive. The aim is to reduce corruption
and make a level playing field for all the
existing corporates and new ones who want
to enter. What this is doing is, it is disrupting
the traditional way the bigger businesses
have operated under the earlier regime
where they could protect their interests
through maneuvering (Crony Capitalism).
What the measures taken by government do,
is that it will reduce the entry barriers to new
and efficient. As established ones compete to
survive and grow, their profits will be under
pressure from new players who are funded
by FDI or PE players. This is why the domestic
facing large cap companies are struggling to
take off even though GDP is growing. As luck
would have it, this coincides with an
environment that has seen temporary
deflation – a direct hit to pricing power of
corporates and their margins
3) Direct benefit transfer plan (DBT) - DBT plan
is a mechanism for transferring government
benefits and subsidies directly into the hands
of residents through a biometric based
identification system (Aadhaar ), that aims to
speed up payments, removing leakages, and
enhancing financial inclusion. Citizens can
thus bypass an often circuitous and tedious
government mechanism and can obtain
funds directly. This also enables transparency
and prevents funds from being pilfered or
misused and more importantly increasing the
likelihood that it will come back to the
banking system. Already almost Rs. 40,000
crore has been transferred to the accounts of
the beneficiaries which directly results in to
higher savings and expenditure of the same
amount, Since the scheme is targeted more
towards the rural areas it also results in a
more sustainable inclusive growth. The plan
also would result in more savings to the
government as well. The increased incomes
of the households will also have a multiplier
effect on the GDP over the long run.
4) RBI increasing competition in the banking
sector - While the government is focused on
growth our central bank is focused on taming
inflation and improving competition in the
banking sector. Raghuram Rajan’s monetary
policy in the last 2 years has helped break the
back of inflation from chronically high levels.
RBI in the last 2 years have given banking
licenses to 23 banks whereas only 12 bank
licenses were given in the last 20 years. This
increase in competition would put lot of
pressure on the earnings of current banks.
Another reason that the headline corporate
growth numbers may be subdued
Hence one can draw a conclusion that the result of
the actions taken by the current government & RBI
coupled with improvements in technology are more
focused towards changing the structural economic
landscape of India. And whenever there is a
structural change, it results in changes to the way
businesses function, which is painful in the short
term and this is what we are currently witnessing in
the corporate sector. The reforms undertaken by the
government are in the right direction and address
long term structural problems and transform the
economy in to a modern place to do business
however it will take time for this process to bear the
fruits. We strongly believe that while these
measures may test your patience as an investor
temporarily, they may in fact lay the foundation for
a structural bull run that puts all our current worries
to rest. And for a long time.

January 2016 11
Alpha Edge | “Why the delay?”
Key risks to watch out for in 2016 -
1) One more drought season is of a key risk this
year, if it happens it will result in further
impact on the rural consumption and could
hurt the earnings of FY17
2) If the inflation hardens (Either because of
weak monsoons or rise in global commodity
prices from its current low levels) we could
see no significant rate cuts in FY17
3) Government going slow on the big ticket
reforms (GST, Land bill) would dent the
confidence of the private sector leading to
another year of muted corporate capital
expenditure.
4) Risk to global economy arising, specially out
of China, could result in to further weakening
of global demand
5) Fed hiking the interest rates aggressively
would impact the flows to India
6) US markets correcting can have a global
domino effect
Fixed income
Inflation hits 14-month high of 5.41% in November
In Nov we saw CPI & WPI spiking to 5.41% and -1.99%
respectively. One important observation is food
inflation seems to be contributing to the rise in CPI
for the last couple of months. The food inflation rose
to 6.07 percent from 5.25 percent, vegetables rose
by 4 percent compared with 2 percent and that of the
pulses zoomed by 46 percent compared with 42.8
percent. The food inflation is likely to stay high
through the March-quarter on account of two
reasons. One, the benefit of base effect clearly
vanishing. Two, the fear of unseasonal rains
impacting crops.
The year that was & outlook 2016
As compared to 2014, 2015 was a subdued year for
fixed income with 10 year benchmark yields falling 10
bps from 7.85 to 7.75 in CY2015. During the year the
yields fell to 7.5% only to recover quickly back to 7.75
levels. RBI governor cut the repo by 125 bps,
suggesting most of the yield fall was front ended.
With CPI & WPI outlook benign for the year the
governor had head room for rate cuts. Currently the
repo rate stands at 6.75%. With a real rate of return
target of RBI at 1.5% to 2% and CPI projection of 5%
by Mar 2017 we expect not more than 25-50 bps rate
cut till FY17, 50 bps possible if RBI undershoots its
inflation target. Also the rate cut would depend on
how well the government manages its fiscal situation
as that would affect the inflation. We see few upside
risks to inflation viz. unfavourable base effect for
inflation which is already evident for the last few
months, fiscal slippage on account of pay
commission, OROP etc., another year of weak
rainfall, rebound in commodity prices or aggressive
rate hikes by Fed.
With a gradual economic recovery under play with
improving macros, stable outlook on inflation and an
accommodative RBI governor we do expect yields to
fall though, marginally.
-10
-5
0
5
10
CPI and WPI
CPI WPI
6
7
8
9
10
2-J
an-1
4
2-M
ar-1
4
2-M
ay-1
4
2-J
ul-
14
2-S
ep
-14
2-N
ov-
14
2-J
an-1
5
2-M
ar-1
5
2-M
ay-1
5
2-J
ul-
15
2-S
ep
-15
2-N
ov-
15
Repo vs Gsec
Repo Rate Gsec yield
January 2016 12
Alpha Edge | “Why the delay?”
Equity
After a big rally in 2014, 2015 was a subdued year for
equities with Nifty falling 4.1% attributable to the
weak earnings numbers. 2015 was a year of
considerable volatility thanks to the i)anticipation of
the Fed rate hike which consumed all the 12 months
of 2015, ii) oil making a new low and iii) China growth
concerns. For the second consecutive year the mid
and small caps have outperformed their larger peers.
Mid cap index was up 7.4% and small cap index was
up 6.8%. From a sectoral point of view the sectors
that did well for the year were Consumer durables
(24%), Healthcare (15%) & IT (4.5%) and the worst
performing sectors for the year were Metals (-31.2%)
PSU (-17.2%) & Realty (-13.6%).
Few reasons attributed towards the dismal equity
performance for the year could be FII outflows in
the current year on global woes, slow pace of
economic reforms than what was expected, and
delay in the earnings recovery.
2015 was the year where we saw global commodity
prices falling which helped an importing country like
India however the benefits of the same was more
than offset by lower prices of the finished goods
and low global demand environment which
eventually resulted de growth in the sales number
and flat PAT growth. There was a surge seen in
public expenditure, however private expenditure
was muted as the cyclical businesses are facing
excess capacity and high debt levels. Even though
we saw recovery in IIP numbers for the year along
with decent GDP growth numbers the same was not
visible in the earnings.
So what has kept the earnings growth at bay? We
have tried to answer this question in the earlier
section by outlining how the current government is
changing the structural landscape which in turn
changes the way businesses function. This change
will bring out new businesses and put pressure on
the earnings of the old ones. We could see
disproportionate earnings growth as few companies
will do well and others would languish, which also
means we could see turnover in the index with new
companies coming in. Such inflection points are
sometimes marred by pain in the shorter term
(which we are currently witnessing). However, these
reforms along with the technological changes would
help us move in the right direction however, the
pace may be slow initially.
We think that currently the markets are little over
valued and one should expect single digit returns
over the next one year on the index, however we do
feel there is merit in bottoms up approach as good
quality companies and few sectors would continue
to do well in the next year. We would continue to
see volatility due to political and global economic
factors over the next one year and believe that
these are the best times to accumulate and invest in
equity as the medium to long term growth outlook
for markets and economy remains intact.
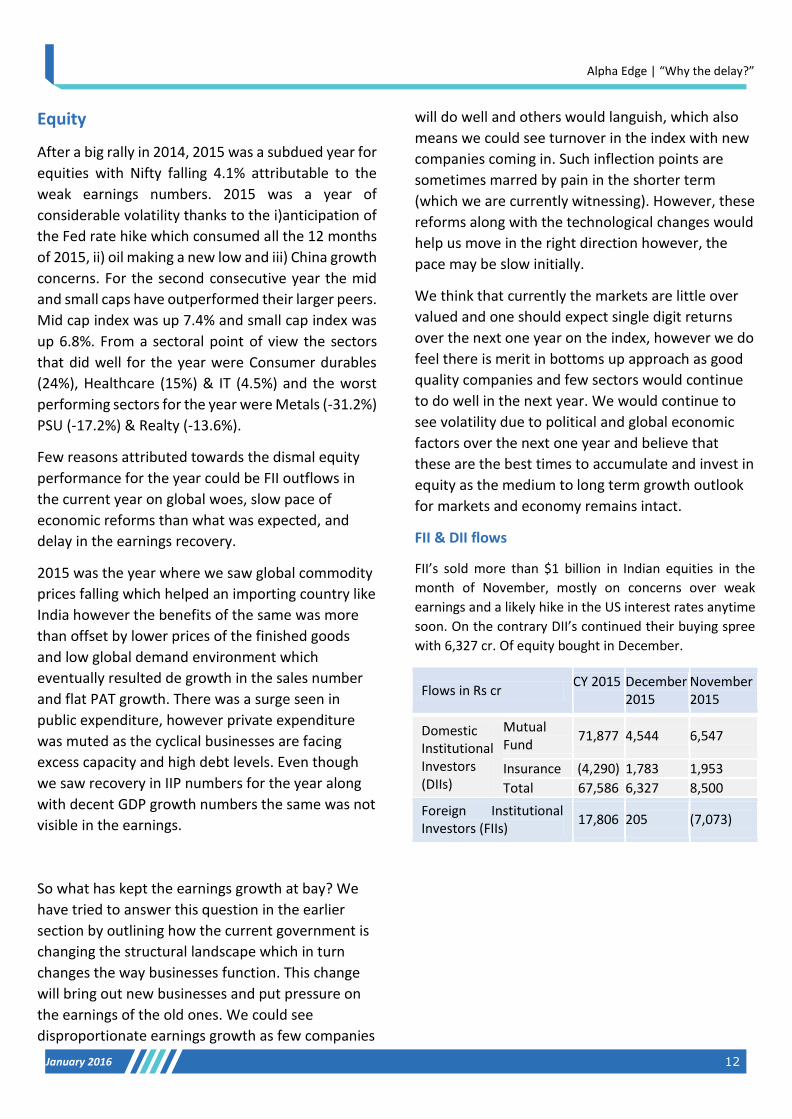
FII & DII flows
FII’s sold more than $1 billion in Indian equities in the
month of November, mostly on concerns over weak
earnings and a likely hike in the US interest rates anytime
soon. On the contrary DII’s continued their buying spree
with 6,327 cr. Of equity bought in December.
Flows in Rs cr CY 2015 December
2015 November 2015
Domestic Institutional Investors (DIIs)
Mutual Fund
71,877 4,544 6,547
Insurance (4,290) 1,783 1,953
Total 67,586 6,327 8,500
Foreign Institutional Investors (FIIs)
17,806 205 (7,073)
January 2016 13
Alpha Edge | “Why the delay?”
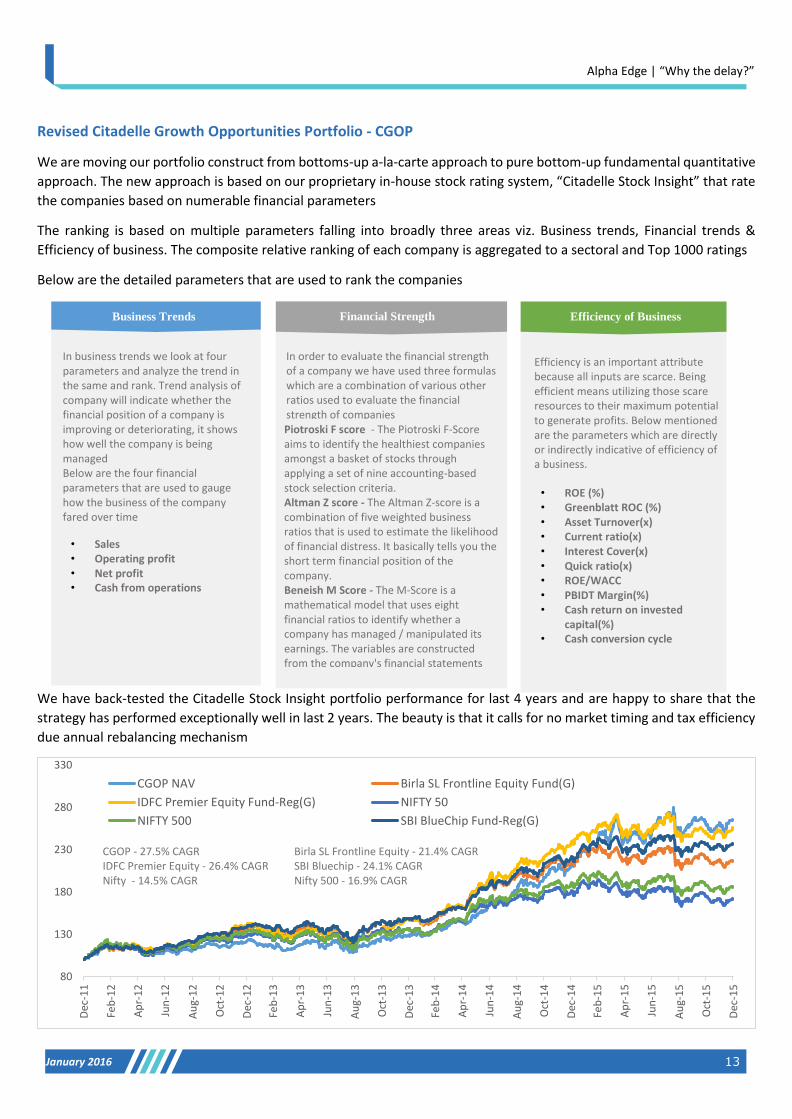
Revised Citadelle Growth Opportunities Portfolio - CGOP
We are moving our portfolio construct from bottoms-up a-la-carte approach to pure bottom-up fundamental quantitative
approach. The new approach is based on our proprietary in-house stock rating system, “Citadelle Stock Insight” that rate
the companies based on numerable financial parameters
The ranking is based on multiple parameters falling into broadly three areas viz. Business trends, Financial trends &
Efficiency of business. The composite relative ranking of each company is aggregated to a sectoral and Top 1000 ratings
Below are the detailed parameters that are used to rank the companies
We have back-tested the Citadelle Stock Insight portfolio performance for last 4 years and are happy to share that the
strategy has performed exceptionally well in last 2 years. The beauty is that it calls for no market timing and tax efficiency
due annual rebalancing mechanism
80
130
180
230
280
330
Dec
-11
Feb
-12
Ap
r-1
2
Jun
-12
Au
g-1
2
Oct
-12
Dec
-12
Feb
-13
Ap
r-1
3
Jun
-13
Au
g-1
3
Oct
-13
Dec
-13
Feb
-14
Ap
r-1
4
Jun
-14
Au
g-1
4
Oct
-14
Dec
-14
Feb
-15
Ap
r-1
5
Jun
-15
Au
g-1
5
Oct
-15
Dec
-15
CGOP NAV Birla SL Frontline Equity Fund(G)
IDFC Premier Equity Fund-Reg(G) NIFTY 50
NIFTY 500 SBI BlueChip Fund-Reg(G)
Business Trends
In business trends we look at four parameters and analyze the trend in the same and rank. Trend analysis of company will indicate whether the financial position of a company is improving or deteriorating, it shows how well the company is being managed
Below are the four financial parameters that are used to gauge how the business of the company fared over time
• Sales • Operating profit • Net profit • Cash from operations
Efficiency of Business
• ROE (%) • Greenblatt ROC (%) • Asset Turnover(x) • Current ratio(x) • Interest Cover(x) • Quick ratio(x) • ROE/WACC • PBIDT Margin(%) • Cash return on invested
capital(%) • Cash conversion cycle
Efficiency is an important attribute because all inputs are scarce. Being efficient means utilizing those scare resources to their maximum potential to generate profits. Below mentioned are the parameters which are directly or indirectly indicative of efficiency of a business.
Financial Strength
In order to evaluate the financial strength of a company we have used three formulas which are a combination of various other ratios used to evaluate the financial strength of companies Piotroski F score - The Piotroski F-Score aims to identify the healthiest companies amongst a basket of stocks through applying a set of nine accounting-based stock selection criteria. Altman Z score - The Altman Z-score is a combination of five weighted business ratios that is used to estimate the likelihood of financial distress. It basically tells you the short term financial position of the company. Beneish M Score - The M-Score is a mathematical model that uses eight financial ratios to identify whether a company has managed / manipulated its earnings. The variables are constructed from the company's financial statements and create a score to describe the degree to
CGOP - 27.5% CAGR Birla SL Frontline Equity - 21.4% CAGR IDFC Premier Equity - 26.4% CAGR SBI Bluechip - 24.1% CAGR
Nifty - 14.5% CAGR Nifty 500 - 16.9% CAGR

January 2016 14
Alpha Edge | “Why the delay?”
Citadelle Growth Opportunities Portfolio
Company Name 3 yr Avg ROE PAT 3yr CAGR Dividend Yield(%)
Ahluwalia Contracts (India) Ltd. 1.04 133.11 0.00
AIA Engineering Ltd. 19.71 33.44 0.64
Ajanta Pharma Ltd. 41.05 58.81 0.49
Aurobindo Pharma Ltd. 27.95 236.96 0.37
Avanti Feeds Ltd. 41.93 60.69 1.79
Bajaj Corp Ltd. 33.50 12.86 2.50
Bajaj Finance Ltd. 20.11 30.20 0.44
Bajaj Finserv Ltd. 27.26 8.42 0.13
Bosch Ltd. 17.71 6.01 0.33
Cadila Healthcare Ltd. 27.33 20.28 0.69
Caplin Point Laboratories Ltd. 49.84 72.28 0.54
CCL Products (India) Ltd. 21.00 37.34 0.84
Cholamandalam Investment & Finance Company Ltd. 17.88 37.96 0.60
DB Corp Ltd. 25.60 16.06 2.09
Gillette India Ltd. 14.84 27.78 0.33
Gujarat Pipavav Port Ltd. 15.43 89.17 0.00
Gulf Oil Lubricants India Ltd. 24.48 3560.17 1.08
Himachal Futuristic Communications Ltd. 88.88 179.95 0.00
Honeywell Automation India Ltd. 12.70 2.15 0.15
JM Financial Ltd. 11.29 43.00 2.81
Kitex Garments Ltd. 36.80 53.67 0.23
KRBL Ltd. 23.73 63.85 1.02
Lupin Ltd. 30.37 40.13 0.37
Marksans Pharma Ltd. 39.39 117.64 0.19
Navneet Education Ltd. 26.35 18.83 2.22
Procter & Gamble Hygiene & Health Care Ltd. 30.49 24.03 0.45
Skipper Ltd. 19.20 107.95 0.85
Sonata Software Ltd. 15.69 204.12 3.93
Tata Elxsi Ltd. 28.13 38.09 0.95
Vinati Organics Ltd. 31.48 28.29 0.67
108.66
95.94
90
95
100
105
110
115120
Dec
-14
Jan
-15
Feb
-15
Mar
-15
Ap
r-1
5
May
-15
Jun
-15
Jul-
15
Au
g-1
5
Sep
-15
Oct
-15
No
v-1
5
Dec
-15
Citadelle Growth Opportunities Portfolio Performance
Citadelle Growth Opportunities Portfolio NAV Nifty Index
90%
10%
Citadelle Growth Opportunities Portfolio Current Asset Allocation
Equity CashPerformance of CGOP as per previous methodology
January 2016 15
Alpha Edge | “Why the delay?”
Sample analysis of few stocks that make the cut
Sector Sector Top 1000 Top 1000
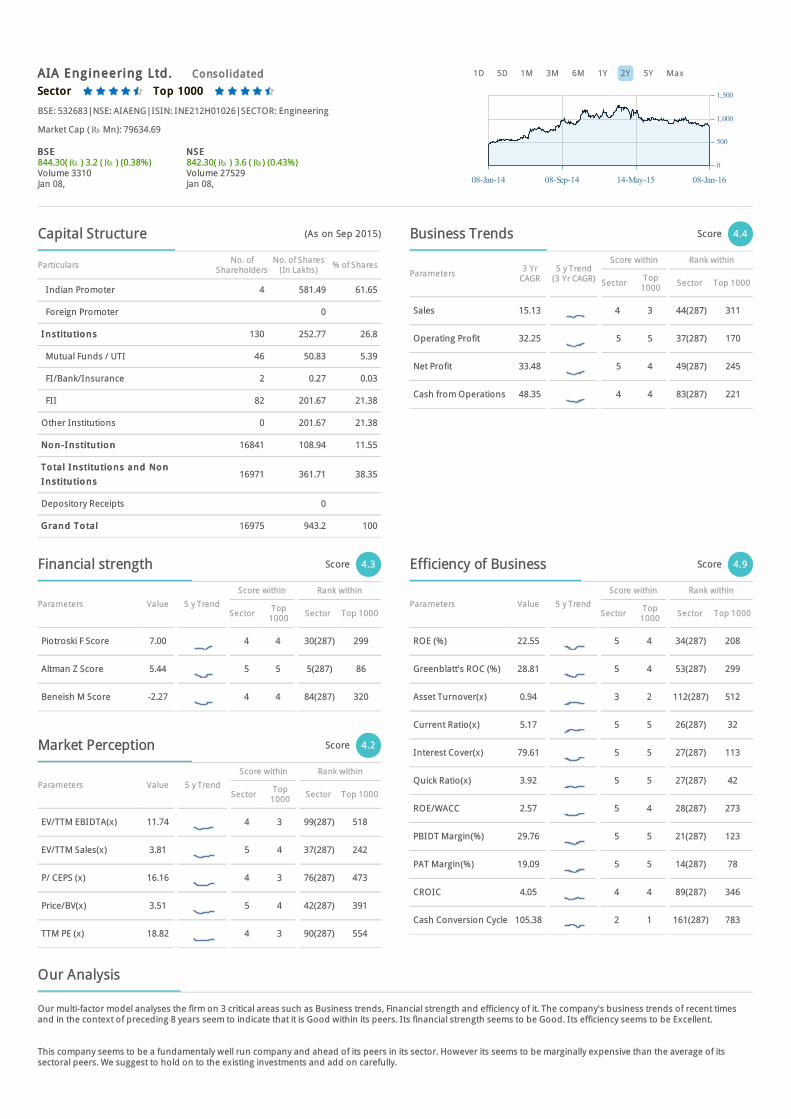
BSE: 532683|NSE: AIAENG|ISIN: INE212H01026|SECTOR: Engineering
Market Cap (Rs Mn): 79634.69
Jan 08,
BSE BSE 844.30(Rs ) 3.2 (Rs ) (0.38%)Volume 3310
Jan 08,
NSE NSE 842.30(Rs ) 3.6 (Rs) (0.43%)Volume 27529
AIA Engineering Ltd.AIA Engineering Ltd. ConsolidatedConsolidated 1D 5D 1M 3M 6M 1Y 2Y 5Y Max
Particulars No. ofShareholders
No. of Shares(In Lakhs)
% of Shares
Indian Promoter 4 581.49 61.65
Foreign Promoter 0
I n stitu tio n sI n stitu tio n s 130 252.77 26.8
Mutual Funds / UTI 46 50.83 5.39
FI/Bank/Insurance 2 0.27 0.03
FII 82 201.67 21.38
Other Institutions 0 201.67 21.38
No n -I n stitu tio nNo n -I n stitu tio n 16841 108.94 11.55
To tal I n stitu tio n s an d No nTo tal I n stitu tio n s an d No n
I n stitu tio n sI n stitu tio n s16971 361.71 38.35
Depository Receipts 0
Gran d To ta lGran d To ta l 16975 943.2 100
Parameters3 Yr
CAGR5 y Trend
(3 Yr CAGR)
Score within Rank within
Sector Top1000
Sector Top 1000
Sales 15.13 4 3 44(287) 311
Operating Profit 32.25 5 5 37(287) 170
Net Profit 33.48 5 4 49(287) 245
Cash from Operations 48.35 4 4 83(287) 221
Parameters Value 5 y Trend
Score within Rank within
Sector Top1000 Sector Top 1000
Piotroski F Score 7.00 4 4 30(287) 299
Altman Z Score 5.44 5 5 5(287) 86
Beneish M Score -2.27 4 4 84(287) 320
Parameters Value 5 y Trend
Score within Rank within
Sector Top1000 Sector Top 1000
EV/TTM EBIDTA(x) 11.74 4 3 99(287) 518
EV/TTM Sales(x) 3.81 5 4 37(287) 242
P/ CEPS (x) 16.16 4 3 76(287) 473
Price/BV(x) 3.51 5 4 42(287) 391
TTM PE (x) 18.82 4 3 90(287) 554
Parameters Value 5 y Trend
Score within Rank within
Sector Top1000 Sector Top 1000
ROE (%) 22.55 5 4 34(287) 208
Greenblatt's ROC (%) 28.81 5 4 53(287) 299
Asset Turnover(x) 0.94 3 2 112(287) 512
Current Ratio(x) 5.17 5 5 26(287) 32
Interest Cover(x) 79.61 5 5 27(287) 113
Quick Ratio(x) 3.92 5 5 27(287) 42
ROE/WACC 2.57 5 4 28(287) 273
PBIDT Margin(%) 29.76 5 5 21(287) 123
PAT Margin(%) 19.09 5 5 14(287) 78
CROIC 4.05 4 4 89(287) 346
Cash Conversion Cycle 105.38 2 1 161(287) 783
Our multi-factor model analyses the firm on 3 critical areas such as Business trends, Financial strength and efficiency of it. The company's business trends of recent timesand in the context of preceding 8 years seem to indicate that it is Good within its peers. Its financial strength seems to be Good. Its efficiency seems to be Excellent.
This company seems to be a fundamentaly well run company and ahead of its peers in its sector. However its seems to be marginally expensive than the average of itssectoral peers. We suggest to hold on to the existing investments and add on carefully.
08-Jan-14 08-Sep-14 14-May-15 08-Jan-16
0
500
1,000
1,500
Capital Structure (As on Sep 2015) Business Trends Score 4.4
Financial strength Score 4.3
Market Perception Score 4.2
Efficiency of Business Score 4.9
Our Analysis

Sector Sector Within BFS Within BFS
BSE: 500034|NSE: BAJFINANCE|ISIN: INE296A01016|SECTOR: Finance - NBFC
Market Cap (Rs Mn): 338666.84
Jan 08,
BSE BSE 6314.55(Rs ) 201.6 (Rs ) (3.3%)Volume 4677
Jan 08,
NSE NSE 6314.50(Rs ) 208.2 (Rs) (3.41%)Volume 103507
Bajaj Finance Ltd.Bajaj Finance Ltd. StandaloneStandalone 1D 5D 1M 3M 6M 1Y 2Y 5Y Max
Particulars No. ofShareholders
No. of Shares(In Lakhs)
% of Shares
Indian Promoter 4 308.94 57.6
Foreign Promoter 0
I n stitu tio n sI n stitu tio n s 293 127.98 23.86
Mutual Funds / UTI 106 33.4 6.23
FI/Bank/Insurance 5 0.25 0.05
FII 182 94.33 17.59
Other Institutions 0 94.33 17.58
No n -I n stitu tio nNo n -I n stitu tio n 33982 99.4 18.53
To tal I n stitu tio n s an d No nTo tal I n stitu tio n s an d No n
I n stitu tio n sI n stitu tio n s34275 227.39 42.4
Depository Receipts 0
Gran d To ta lGran d To ta l 34279 536.33 100
Parameters3Yr
CAGR5 y Trend
(3 Yr CAGR)
Score within Rank within
Sector BFS Sector BFS
Advances 36.82 4 5 224(1192) 24.00
Core Operating
Income38.72 3 5 361(1192) 23
Net Interest Income 31.67 3 5 280(1192) 25
Net Profit 30.24 3 4 450(1192) 36
Adjusted Book Value
per share26.60 5 5 61(1192) 12
Adjusted Earnings
per share23.40 2 4 482(1192) 40
CASA % NA - -
Parameters Value 5 y TrendScore within Rank within
Sector BFS Sector BFS
CAR % (Basel III) 17.97 4 4 37(1192) 27
Credit/Deposits NA - -
Citadelle BFS Score 21.00 5 5 7(1192) 15
Parameters Value 5 y TrendScore within Rank within
Sector BFS Sector BFS
Price / Adj Book Value 4.27 5 5 72(1192) 25
Adj Price / Earnings 22.81 5 4 184(1192) 40
Parameters Value 5 y TrendScore within Rank within
Sector BFS Sector BFS
ROE (%) 20.43 4 5 69(1192) 12
ROA % 2.99 3 4 320(1192) 34
Interest Spread(%) 6.61 3 4 284(1192) 48
NIM % 54.99 3 4 442(1192) 31
Core Cost to Income
Ratio42.91 3 3 303(1192) 71
Net NPAs to net
Advances0.45 1 2 1186(1192) 96
Provision Coverage
ratio70.57 5 5 8(1192) 10
Our multi-factor model analyses the firm on 3 critical areas such as Business trends, Financial strength and efficiency of it. The company's business trends of recent timesand in the context of preceding 8 years seem to indicate that it is Good within its peers. Its financial strength seems to be Good. Its efficiency seems to be Average.
This company seems to be a fundamentaly well run company and ahead of its peers in its sector. However its seems to be very expensive than the average of its sectoralpeers. We suggest to hold on any existing investments and add on on it very carefully. Such companies have very little room for error
08-Jan-14 08-Sep-14 14-May-15 08-Jan-16
0
2,000
4,000
6,000
8,000
Capital Structure (As on Sep 2015) Business Trends Score 3.5
Financial strength Score 3.8
Market Perception Score 5
Efficiency of Business Score 3.3
Our Analysis

Sector Sector Top 1000 Top 1000
BSE: 532321|NSE: CADILAHC|ISIN: INE010B01027|SECTOR: Pharmaceuticals & Drugs
Market Cap (Rs Mn): 317462.58
Jan 08,
BSE BSE 310.10(Rs ) 3.3 (Rs ) (1.08%)Volume 217758
Jan 08,
NSE NSE 310.30(Rs ) 3.45 (Rs) (1.12%)Volume 1615678
Cadila Healthcare Ltd.Cadila Healthcare Ltd. ConsolidatedConsolidated 1D 5D 1M 3M 6M 1Y 2Y 5Y Max
Particulars No. ofShareholders
No. of Shares(In Lakhs)
% of Shares
Indian Promoter 11 1531.38 74.79
Foreign Promoter 0
I n stitu tio n sI n stitu tio n s 265 308.69 15.08
Mutual Funds / UTI 104 93.42 4.56
FI/Bank/Insurance 28 75.59 3.69
FII 130 137.9 6.73
Other Institutions 3 139.68 6.83
No n -I n stitu tio nNo n -I n stitu tio n 52165 207.42 10.13
To tal I n stitu tio n s an d No nTo tal I n stitu tio n s an d No n
I n stitu tio n sI n stitu tio n s52430 516.1 25.21
Depository Receipts 0
Gran d To ta lGran d To ta l 52441 2047.49 100
Parameters3 Yr
CAGR5 y Trend
(3 Yr CAGR)
Score within Rank within
Sector Top1000
Sector Top 1000
Sales 18.07 4 3 48(243) 244
Operating Profit 16.86 4 4 88(243) 357
Net Profit 20.30 4 4 92(243) 349
Cash from Operations 24.81 4 4 81(243) 364
Parameters Value 5 y Trend
Score within Rank within
Sector Top1000 Sector Top 1000
Piotroski F Score 8.00 5 5 7(243) 201
Altman Z Score 4.29 5 5 28(243) 163
Beneish M Score -2.02 4 5 60(243) 191
Parameters Value 5 y Trend
Score within Rank within
Sector Top1000 Sector Top 1000
EV/TTM EBIDTA(x) 15.05 4 4 93(243) 385
EV/TTM Sales(x) 3.68 4 4 87(243) 257
P/ CEPS (x) 18.61 4 4 88(243) 398
Price/BV(x) 6.39 5 5 38(243) 186
TTM PE (x) 23.05 3 3 98(243) 455
Parameters Value 5 y Trend
Score within Rank within
Sector Top1000 Sector Top 1000
ROE (%) 31.12 5 5 26(243) 94
Greenblatt's ROC (%) 35.08 5 4 38(243) 201
Asset Turnover(x) 1.03 4 3 72(243) 460
Current Ratio(x) 1.29 3 3 129(243) 531
Interest Cover(x) 22.29 4 4 49(243) 212
Quick Ratio(x) 0.83 3 3 139(243) 556
ROE/WACC 3.58 5 5 23(243) 142
PBIDT Margin(%) 20.55 4 4 54(243) 253
PAT Margin(%) 13.46 5 5 34(243) 149
CROIC 6.24 5 4 46(243) 259
Cash Conversion Cycle 60.73 2 2 139(243) 558
Our multi-factor model analyses the firm on 3 critical areas such as Business trends, Financial strength and efficiency of it. The company's business trends of recent timesand in the context of preceding 8 years seem to indicate that it is Good within its peers. Its financial strength seems to be Excellent. Its efficiency seems to be Excellent.
This company seems to be a fundamentaly well run company and ahead of its peers in its sector. However its seems to be marginally expensive than the average of itssectoral peers. We suggest to hold on to the existing investments and add on carefully.
08-Jan-14 08-Sep-14 14-May-15 08-Jan-16
0
200
400
600
Capital Structure (As on Sep 2015) Business Trends Score 4
Financial strength Score 4.8
Market Perception Score 4
Efficiency of Business Score 4.7
Our Analysis

Sector Sector Top 1000 Top 1000
BSE: 521248|NSE: KITEX|ISIN: INE602G01020|SECTOR: Textile
Market Cap (Rs Mn): 32152.75
Jan 08,
BSE BSE 676.90(Rs ) 3.65 (Rs ) (0.54%)Volume 4972
Jan 08,
NSE NSE 675.35(Rs ) 1.55 (Rs) (0.23%)Volume 41052
Kitex Garments Ltd.Kitex Garments Ltd. StandaloneStandalone 1D 5D 1M 3M 6M 1Y 2Y 5Y Max
Particulars No. ofShareholders
No. of Shares(In Lakhs)
% of Shares
Indian Promoter 10 257.66 54.24
Foreign Promoter 0
I n stitu tio n sI n stitu tio n s 54 14.18 2.98
Mutual Funds / UTI 5 0.27 0.06
FI/Bank/Insurance 0
FII 37 10.74 2.26
Other Institutions 12 13.9 2.92
No n -I n stitu tio nNo n -I n stitu tio n 24926 203.17 42.77
To tal I n stitu tio n s an d No nTo tal I n stitu tio n s an d No n
I n stitu tio n sI n stitu tio n s24980 217.34 45.76
Depository Receipts 0
Gran d To ta lGran d To ta l 24990 475 100
Parameters3 Yr
CAGR5 y Trend
(3 Yr CAGR)
Score within Rank within
Sector Top1000
Sector Top 1000
Sales 17.92 5 4 89(501) 248
Operating Profit 40.97 4 5 104(501) 115
Net Profit 53.73 4 5 127(501) 165
Cash from Operations 27.06 3 3 153(501) 339
Parameters Value 5 y Trend
Score within Rank within
Sector Top1000 Sector Top 1000
Piotroski F Score 8.00 5 5 9(501) 80
Altman Z Score 5.52 5 5 8(501) 83
Beneish M Score -2.49 4 3 155(501) 471
Parameters Value 5 y Trend
Score within Rank within
Sector Top1000 Sector Top 1000
EV/TTM EBIDTA(x) 15.79 5 4 91(501) 364
EV/TTM Sales(x) 6.65 5 5 62(501) 107
P/ CEPS (x) 24.82 5 4 58(501) 285
Price/BV(x) 10.66 5 5 12(501) 77
TTM PE (x) 29.90 5 4 63(501) 341
Parameters Value 5 y Trend
Score within Rank within
Sector Top1000 Sector Top 1000
ROE (%) 44.98 5 5 22(501) 40
Greenblatt's ROC (%) 52.39 5 5 31(501) 80
Asset Turnover(x) 1.09 2 2 208(501) 426
Current Ratio(x) 1.56 4 4 170(501) 378
Interest Cover(x) 7.71 5 4 70(501) 334
Quick Ratio(x) 1.51 4 4 119(501) 244
ROE/WACC 4.52 5 5 50(501) 83
PBIDT Margin(%) 35.99 5 5 23(501) 86
PAT Margin(%) 19.26 5 5 20(501) 76
CROIC 15.38 5 5 44(501) 63
Cash Conversion Cycle 26.43 3 3 141(501) 292
Our multi-factor model analyses the firm on 3 critical areas such as Business trends, Financial strength and efficiency of it. The company's business trends of recent timesand in the context of preceding 8 years seem to indicate that it is Good within its peers. Its financial strength seems to be Excellent. Its efficiency seems to be Excellent.
This company seems to be a fundamentaly well run company and ahead of its peers in its sector. However its seems to be very expensive than the average of its sectoralpeers. We suggest to hold on any existing investments and add on on it very carefully. Such companies have very little room for error
08-Jan-14 08-Sep-14 14-May-15 08-Jan-16
0
500
1,000
1,500
Capital Structure (As on Sep 2015) Business Trends Score 3.9
Financial strength Score 4.8
Market Perception Score 5
Efficiency of Business Score 4.9
Our Analysis
Sector Sector Top 1000 Top 1000
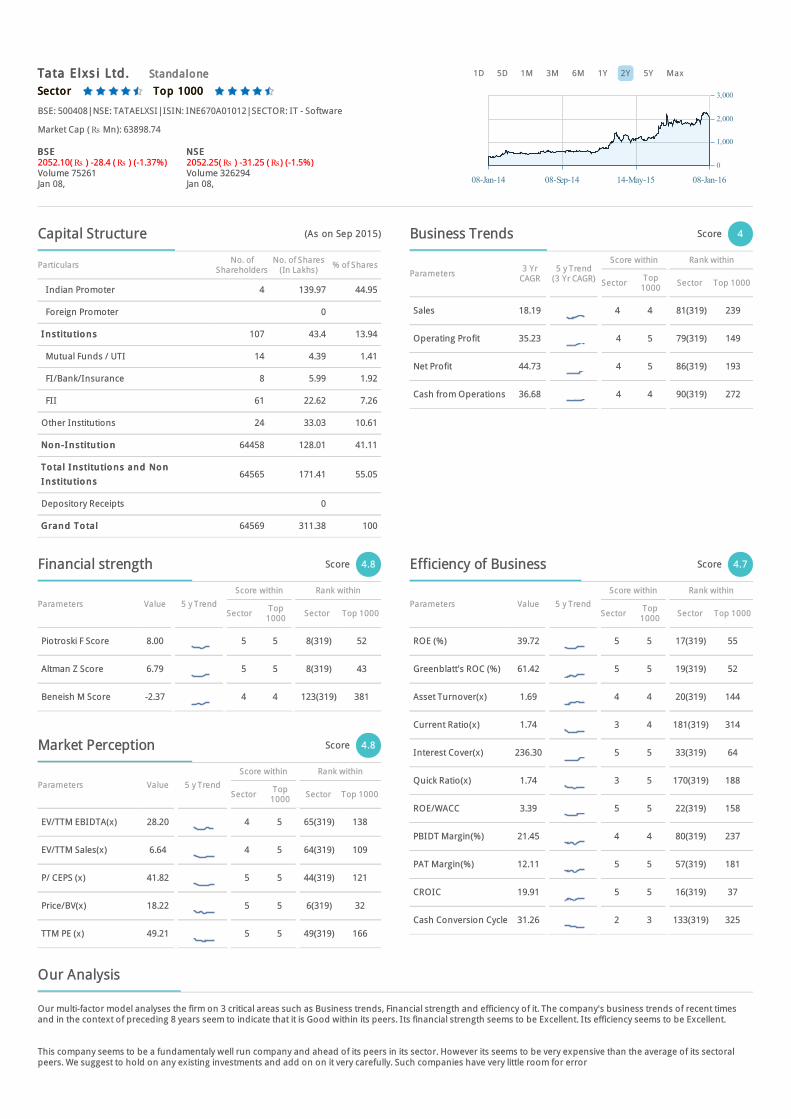
BSE: 500408|NSE: TATAELXSI|ISIN: INE670A01012|SECTOR: IT - Software
Market Cap (Rs Mn): 63898.74
Jan 08,
BSE BSE 2052.10(Rs ) -28.4 (Rs ) (-1.37%)Volume 75261
Jan 08,
NSE NSE 2052.25(Rs ) -31.25 (Rs) (-1.5%)Volume 326294
Tata Elxs i Ltd.Tata Elxs i Ltd. StandaloneStandalone 1D 5D 1M 3M 6M 1Y 2Y 5Y Max
Particulars No. ofShareholders
No. of Shares(In Lakhs)
% of Shares
Indian Promoter 4 139.97 44.95
Foreign Promoter 0
I n stitu tio n sI n stitu tio n s 107 43.4 13.94
Mutual Funds / UTI 14 4.39 1.41
FI/Bank/Insurance 8 5.99 1.92
FII 61 22.62 7.26
Other Institutions 24 33.03 10.61
No n -I n stitu tio nNo n -I n stitu tio n 64458 128.01 41.11
To tal I n stitu tio n s an d No nTo tal I n stitu tio n s an d No n
I n stitu tio n sI n stitu tio n s64565 171.41 55.05
Depository Receipts 0
Gran d To ta lGran d To ta l 64569 311.38 100
Parameters3 Yr
CAGR5 y Trend
(3 Yr CAGR)
Score within Rank within
Sector Top1000
Sector Top 1000
Sales 18.19 4 4 81(319) 239
Operating Profit 35.23 4 5 79(319) 149
Net Profit 44.73 4 5 86(319) 193
Cash from Operations 36.68 4 4 90(319) 272
Parameters Value 5 y Trend
Score within Rank within
Sector Top1000 Sector Top 1000
Piotroski F Score 8.00 5 5 8(319) 52
Altman Z Score 6.79 5 5 8(319) 43
Beneish M Score -2.37 4 4 123(319) 381
Parameters Value 5 y Trend
Score within Rank within
Sector Top1000 Sector Top 1000
EV/TTM EBIDTA(x) 28.20 4 5 65(319) 138
EV/TTM Sales(x) 6.64 4 5 64(319) 109
P/ CEPS (x) 41.82 5 5 44(319) 121
Price/BV(x) 18.22 5 5 6(319) 32
TTM PE (x) 49.21 5 5 49(319) 166
Parameters Value 5 y Trend
Score within Rank within
Sector Top1000 Sector Top 1000
ROE (%) 39.72 5 5 17(319) 55
Greenblatt's ROC (%) 61.42 5 5 19(319) 52
Asset Turnover(x) 1.69 4 4 20(319) 144
Current Ratio(x) 1.74 3 4 181(319) 314
Interest Cover(x) 236.30 5 5 33(319) 64
Quick Ratio(x) 1.74 3 5 170(319) 188
ROE/WACC 3.39 5 5 22(319) 158
PBIDT Margin(%) 21.45 4 4 80(319) 237
PAT Margin(%) 12.11 5 5 57(319) 181
CROIC 19.91 5 5 16(319) 37
Cash Conversion Cycle 31.26 2 3 133(319) 325
Our multi-factor model analyses the firm on 3 critical areas such as Business trends, Financial strength and efficiency of it. The company's business trends of recent timesand in the context of preceding 8 years seem to indicate that it is Good within its peers. Its financial strength seems to be Excellent. Its efficiency seems to be Excellent.
This company seems to be a fundamentaly well run company and ahead of its peers in its sector. However its seems to be very expensive than the average of its sectoralpeers. We suggest to hold on any existing investments and add on on it very carefully. Such companies have very little room for error
08-Jan-14 08-Sep-14 14-May-15 08-Jan-16
0
1,000
2,000
3,000
Capital Structure (As on Sep 2015) Business Trends Score 4
Financial strength Score 4.8
Market Perception Score 4.8
Efficiency of Business Score 4.7
Our Analysis
January 2016 16
Alpha Edge | “Why the delay?”
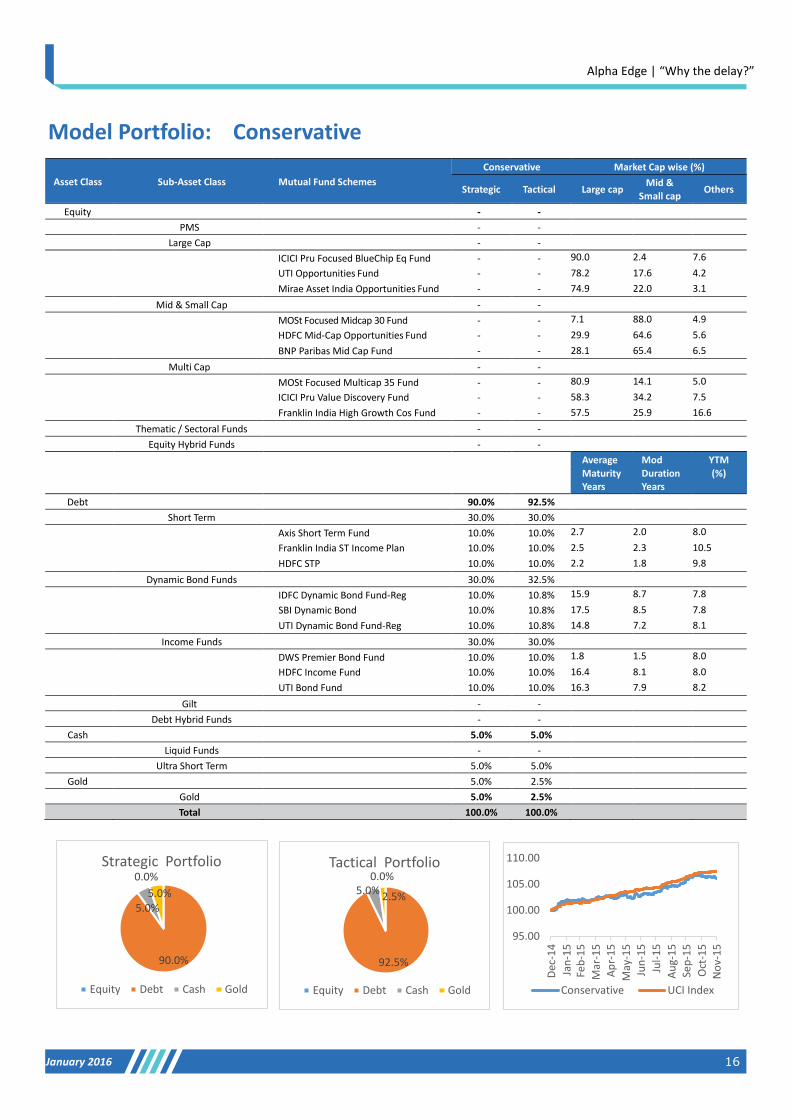
Model Portfolio: Conservative
Conservative Market Cap wise (%)
Asset Class Sub-Asset Class Mutual Fund Schemes
Strategic
Tactical
Large cap Mid &
Small cap
Others
Equity - - PMS - - Large Cap - - ICICI Pru Focused BlueChip Eq Fund - - 90.0 2.4 7.6
UTI Opportunities Fund - - 78.2 17.6 4.2
Mirae Asset India Opportunities Fund - - 74.9 22.0 3.1
Mid & Small Cap - - MOSt Focused Midcap 30 Fund - - 7.1 88.0 4.9
HDFC Mid-Cap Opportunities Fund - - 29.9 64.6 5.6
BNP Paribas Mid Cap Fund - - 28.1 65.4 6.5
Multi Cap - - MOSt Focused Multicap 35 Fund - - 80.9 14.1 5.0
ICICI Pru Value Discovery Fund - - 58.3 34.2 7.5
Franklin India High Growth Cos Fund - - 57.5 25.9 16.6
Thematic / Sectoral Funds - - Equity Hybrid Funds - - Average
Maturity Years
Mod
Duration Years
YTM
(%)
Debt 90.0% 92.5% Short Term 30.0% 30.0% Axis Short Term Fund 10.0% 10.0% 2.7 2.0 8.0
Franklin India ST Income Plan 10.0% 10.0% 2.5 2.3 10.5
HDFC STP 10.0% 10.0% 2.2 1.8 9.8
Dynamic Bond Funds 30.0% 32.5% IDFC Dynamic Bond Fund-Reg 10.0% 10.8% 15.9 8.7 7.8
SBI Dynamic Bond 10.0% 10.8% 17.5 8.5 7.8
UTI Dynamic Bond Fund-Reg 10.0% 10.8% 14.8 7.2 8.1
Income Funds 30.0% 30.0% DWS Premier Bond Fund 10.0% 10.0% 1.8 1.5 8.0
HDFC Income Fund 10.0% 10.0% 16.4 8.1 8.0
UTI Bond Fund 10.0% 10.0% 16.3 7.9 8.2
Gilt - - Debt Hybrid Funds - -
Cash 5.0% 5.0% Liquid Funds - - Ultra Short Term 5.0% 5.0%
Gold 5.0% 2.5% Gold 5.0% 2.5% Total 100.0% 100.0%
0.0%
90.0%
5.0%5.0%
Strategic Portfolio
Equity Debt Cash Gold
0.0%
92.5%
5.0%2.5%
Tactical Portfolio
Equity Debt Cash Gold
95.00
100.00
105.00
110.00
Dec
-14
Jan
-15
Feb
-15
Mar
-15
Ap
r-1
5
May
-15
Jun
-15
Jul-
15
Au
g-1
5Se
p-1
5
Oct
-15
No
v-1
5
Conservative UCI Index

January 2016 17
Alpha Edge | “Why the delay?”
Model Portfolio: Moderately Conservative
Mod Conservative Market Cap wise (%)
Asset Class Sub-Asset Class Mutual Fund Schemes
Strategic
Tactical
Large cap Mid &
Small cap
Others
Equity 25.0% 25.0% PMS - - Large Cap 25.0% 25.0% ICICI Pru Focused BlueChip Eq Fund 10.0% 10.0% 90.0 2.4 7.6
UTI Opportunities Fund 10.0% 10.0% 78.2 17.6 4.2
Mirae Asset India Opportunities Fund 5.0% 5.0% 74.9 22.0 3.1
Mid & Small Cap - - MOSt Focused Midcap 30 Fund - - 7.1 88.0 4.9
HDFC Mid-Cap Opportunities Fund - - 29.9 64.6 5.6
BNP Paribas Mid Cap Fund - - 28.1 65.4 6.5
Multi Cap - - MOSt Focused Multicap 35 Fund - - 80.9 14.1 5.0
ICICI Pru Value Discovery Fund - - 58.3 34.2 7.5
Franklin India High Growth Cos Fund - - 57.5 25.9 16.6
Thematic / Sectoral Funds - - Equity Hybrid Funds - - Average
Maturity Years
Mod
Duration Years
YTM
(%)
Debt 65.0% 67.5% Short Term 30.0% 30.0% Axis Short Term Fund 10.0% 10.0% 2.7 2.0 8.0
Franklin India ST Income Plan 10.0% 10.0% 2.5 2.3 10.5
HDFC STP 10.0% 10.0% 2.2 1.8 9.8
Dynamic Bond Funds 30.0% 32.5% IDFC Dynamic Bond Fund-Reg 10.0% 10.8% 15.9 8.7 7.8
SBI Dynamic Bond 10.0% 10.8% 17.5 8.5 7.8
UTI Dynamic Bond Fund-Reg 10.0% 10.8% 14.8 7.2 8.1
Income Funds 5.0% 5.0% DWS Premier Bond Fund - - 1.8 1.5 8.0
HDFC Income Fund - - 16.4 8.1 8.0
UTI Bond Fund 5.0% 5.0% 16.3 7.9 8.2
Gilt - - Debt Hybrid Funds - -
Cash 5.0% 5.0% Liquid Funds - - Ultra Short Term 5.0% 5.0%
Gold 5.0% 2.5% Gold 5.0% 2.5% Total 100.0% 100.0%
25.0%
65.0%
5.0%5.0%
Strategic Portfolio
Equity Debt Cash Gold
25.0%
67.5%
5.0% 2.5%
Tactical Portfolio
Equity Debt Cash Gold
96.0098.00
100.00102.00104.00106.00108.00
Dec
-14
Jan
-15
Feb
-15
Mar
-15
Ap
r-1
5M
ay-1
5Ju
n-1
5Ju
l-1
5A
ug-
15
Sep
-15
Oct
-15
No
v-1
5D
ec-1
5
Mod Conservative UCI Index
January 2016 18
Alpha Edge | “Why the delay?”
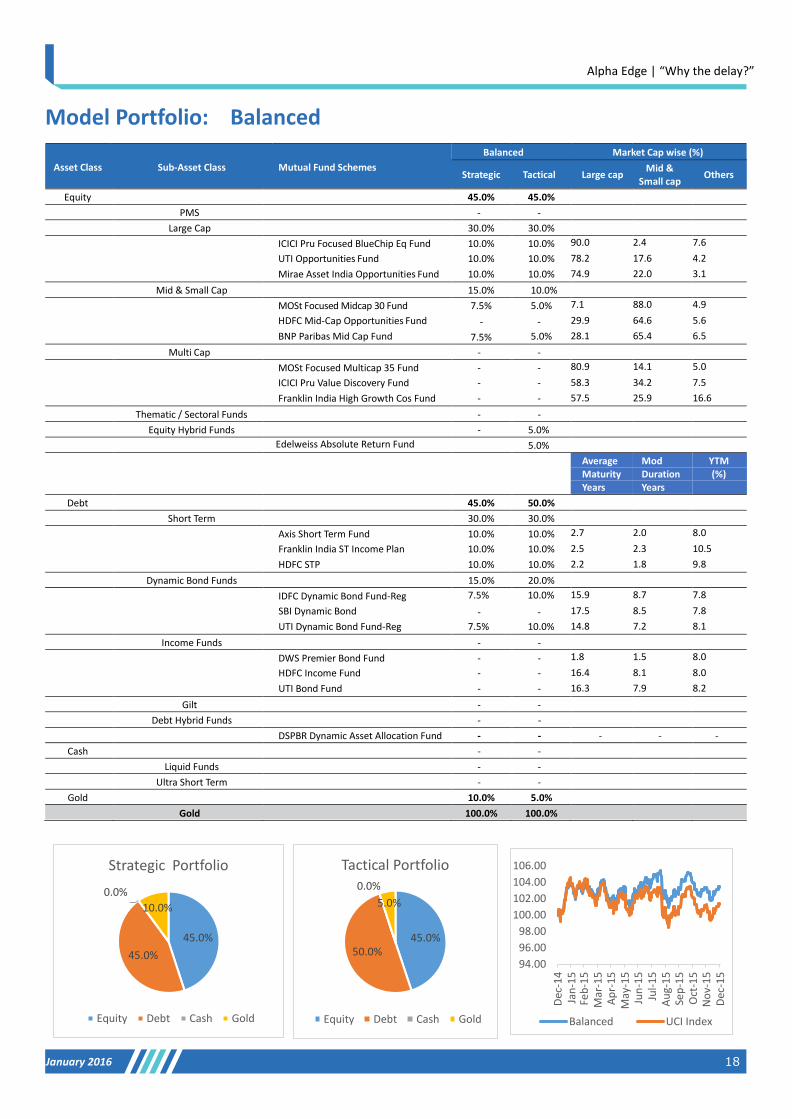
Model Portfolio: Balanced
Balanced Market Cap wise (%)
Asset Class Sub-Asset Class Mutual Fund Schemes
Strategic
Tactical
Large cap Mid & Small cap
Others
Equity 45.0% 45.0% PMS - - Large Cap 30.0% 30.0% ICICI Pru Focused BlueChip Eq Fund 10.0% 10.0% 90.0 2.4 7.6
UTI Opportunities Fund 10.0% 10.0% 78.2 17.6 4.2
Mirae Asset India Opportunities Fund 10.0% 10.0% 74.9 22.0 3.1
Mid & Small Cap 15.0% 10.0% MOSt Focused Midcap 30 Fund 7.5% 5.0% 7.1 88.0 4.9
HDFC Mid-Cap Opportunities Fund - - 29.9 64.6 5.6
BNP Paribas Mid Cap Fund 7.5% 5.0% 28.1 65.4 6.5
Multi Cap - - MOSt Focused Multicap 35 Fund - - 80.9 14.1 5.0
ICICI Pru Value Discovery Fund - - 58.3 34.2 7.5
Franklin India High Growth Cos Fund - - 57.5 25.9 16.6
Thematic / Sectoral Funds - - Equity Hybrid Funds - 5.0% Edelweiss Absolute Return Fund 5.0%
%
Average Maturity Years
Mod Duration Years
YTM (%)
Debt 45.0% 50.0% Short Term 30.0% 30.0% Axis Short Term Fund 10.0% 10.0% 2.7 2.0 8.0
Franklin India ST Income Plan 10.0% 10.0% 2.5 2.3 10.5
HDFC STP 10.0% 10.0% 2.2 1.8 9.8
Dynamic Bond Funds 15.0% 20.0% IDFC Dynamic Bond Fund-Reg 7.5% 10.0% 15.9 8.7 7.8
SBI Dynamic Bond - - 17.5 8.5 7.8
UTI Dynamic Bond Fund-Reg 7.5% 10.0% 14.8 7.2 8.1
Income Funds - - DWS Premier Bond Fund - - 1.8 1.5 8.0
HDFC Income Fund - - 16.4 8.1 8.0
UTI Bond Fund - - 16.3 7.9 8.2
Gilt - - Debt Hybrid Funds - - DSPBR Dynamic Asset Allocation Fund - - - - -
Cash - - Liquid Funds - - Ultra Short Term - -
Gold 10.0% 5.0% Gold 100.0% 100.0%
45.0%
45.0%
0.0%
10.0%
Strategic Portfolio
Equity Debt Cash Gold
45.0%50.0%
0.0%
5.0%
Tactical Portfolio
Equity Debt Cash Gold
94.00
96.00
98.00
100.00
102.00
104.00
106.00
Dec
-14
Jan
-15
Feb
-15
Mar
-15
Ap
r-1
5M
ay-1
5Ju
n-1
5Ju
l-1
5A
ug-
15
Sep
-15
Oct
-15
No
v-1
5D
ec-1
5
Balanced UCI Index
January 2016 19
Alpha Edge | “Why the delay?”
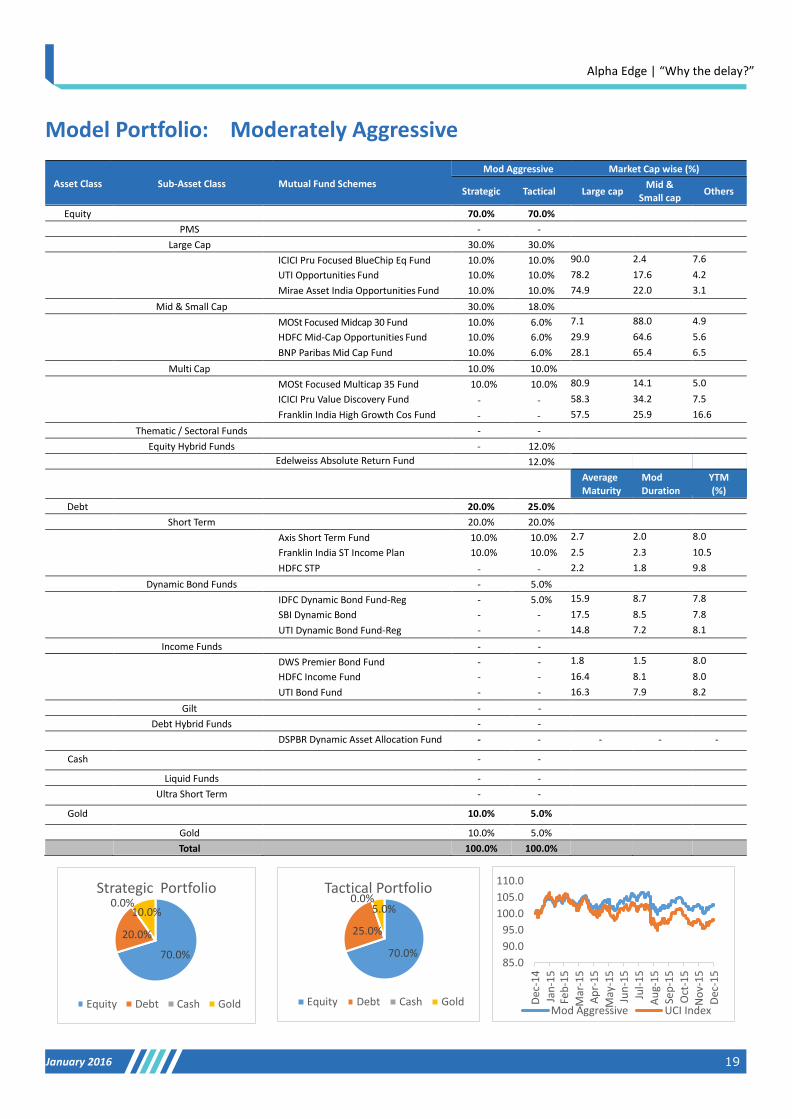
Model Portfolio: Moderately Aggressive
Mod Aggressive Market Cap wise (%)
Asset Class Sub-Asset Class Mutual Fund Schemes
Strategic
Tactical
Large cap Mid & Small cap
Others
Equity 70.0% 70.0% PMS - - Large Cap 30.0% 30.0% ICICI Pru Focused BlueChip Eq Fund 10.0% 10.0% 90.0 2.4 7.6
UTI Opportunities Fund 10.0% 10.0% 78.2 17.6 4.2
Mirae Asset India Opportunities Fund 10.0% 10.0% 74.9 22.0 3.1
Mid & Small Cap 30.0% 18.0% MOSt Focused Midcap 30 Fund 10.0% 6.0% 7.1 88.0 4.9
HDFC Mid-Cap Opportunities Fund 10.0% 6.0% 29.9 64.6 5.6
BNP Paribas Mid Cap Fund 10.0% 6.0% 28.1 65.4 6.5
Multi Cap 10.0% 10.0% MOSt Focused Multicap 35 Fund 10.0% 10.0% 80.9 14.1 5.0
ICICI Pru Value Discovery Fund - - 58.3 34.2 7.5
Franklin India High Growth Cos Fund - - 57.5 25.9 16.6
Thematic / Sectoral Funds - - Equity Hybrid Funds - 12.0% Edelweiss Absolute Return Fund 12.0% Average
Maturity Years
Mod
Duration Years
YTM
(%) Debt 20.0% 25.0%
Short Term 20.0% 20.0% Axis Short Term Fund 10.0% 10.0% 2.7 2.0 8.0
Franklin India ST Income Plan 10.0% 10.0% 2.5 2.3 10.5
HDFC STP - - 2.2 1.8 9.8
Dynamic Bond Funds - 5.0% IDFC Dynamic Bond Fund-Reg - 5.0% 15.9 8.7 7.8
SBI Dynamic Bond - - 17.5 8.5 7.8
UTI Dynamic Bond Fund-Reg - - 14.8 7.2 8.1
Income Funds - - DWS Premier Bond Fund - - 1.8 1.5 8.0
HDFC Income Fund - - 16.4 8.1 8.0
UTI Bond Fund - - 16.3 7.9 8.2
Gilt - - Debt Hybrid Funds - - DSPBR Dynamic Asset Allocation Fund - - - - -
Cash - -
Liquid Funds - - Ultra Short Term - -
Gold 10.0% 5.0%
Gold 10.0% 5.0% Total 100.0% 100.0%
70.0%
20.0%
0.0%10.0%
Strategic Portfolio
Equity Debt Cash Gold
70.0%
25.0%
0.0%5.0%
Tactical Portfolio
Equity Debt Cash Gold
85.0
90.0
95.0
100.0
105.0
110.0
Dec
-14
Jan
-15
Feb
-15
Mar
-15
Ap
r-1
5
May
-15
Jun
-15
Jul-
15
Au
g-1
5Se
p-1
5
Oct
-15
No
v-1
5
Dec
-15
Mod Aggressive UCI Index

January 2016 20
Alpha Edge | “Why the delay?”
Model Portfolio: Aggressive
Aggressive Market Cap wise (%)
Asset Class Sub-Asset Class Mutual Fund Schemes
Strategic
Tactical
Large cap Mid & Small cap
Others
Equity 90.0% 90.0% PMS - - Large Cap 30.0% 30.0% ICICI Pru Focused BlueChip Eq Fund 10.0% 10.0% 90.0 2.4 7.6
UTI Opportunities Fund 10.0% 10.0% 78.2 17.6 4.2
Mirae Asset India Opportunities Fund 10.0% 10.0% 74.9 22.0 3.1
Mid & Small Cap 30.0% 20.0% MOSt Focused Midcap 30 Fund 10.0% 6.6% 7.1 88.0 4.9
HDFC Mid-Cap Opportunities Fund 10.0% 6.6% 29.9 64.6 5.6
BNP Paribas Mid Cap Fund 10.0% 6.6% 28.1 65.4 6.5
Multi Cap 30.0% 30.0% MOSt Focused Multicap 35 Fund 10.0% 10.0% 80.9 14.1 5.0
ICICI Pru Value Discovery Fund 10.0% 10.0% 58.3 34.2 7.5
Franklin India High Growth Cos Fund 10.0% 10.0% 57.5 25.9 16.6
Thematic / Sectoral Funds - - Equity Hybrid Funds - 10.0% Edelweiss Absolute Return Fund 10.0% Average
Maturity Years
Mod
Duration Years
YTM
(%)
Debt - 5.0% Short Term - - Axis Short Term Fund - - 2.7 2.0 8.0
Franklin India ST Income Plan - - 2.5 2.3 10.5
HDFC STP - - 2.2 1.8 9.8
Dynamic Bond Funds - 5.0% IDFC Dynamic Bond Fund-Reg - 5.0% 15.9 8.7 7.8
SBI Dynamic Bond - - 17.5 8.5 7.8
UTI Dynamic Bond Fund-Reg - - 14.8 7.2 8.1
Income Funds - - DWS Premier Bond Fund - - 1.8 1.5 8.0
HDFC Income Fund - - 16.4 8.1 8.0
UTI Bond Fund - - 16.3 7.9 8.2
Gilt - - Debt Hybrid Funds - - DSPBR Dynamic Asset Allocation Fund - - - - -
Cash - - Liquid Funds - - Ultra Short Term - -
Gold 10.0% 5.0% Gold 10.0% 5.0% Total 100.0% 100.0%
90.0%
0.0%0.0%10.0%
Strategic Portfolio
Equity Debt Cash Gold
90.0%
5.0%
0.0% 5.0%Tactical Portfolio
Equity Debt Cash Gold
90.00
95.00
100.00
105.00
110.00
Dec
-14
Jan
-15
Feb
-15
Mar
-15
Ap
r-1
5M
ay-1
5Ju
n-1
5Ju
l-1
5A
ug-
15
Sep
-15
Oct
-15
No
v-1
5D
ec-1
5
Aggressive Nifty

January 2016 21
Alpha Edge | “Why the delay?”
Thank you for your time!
Safe harbor statement!
This document has been prepared by Citadelle Asset Advisors Private Limited (CAAPL). CAAPL, its holding company and associate companies offer full range of, integrated investment banking, portfolio management and brokerage services, through own and or partnerships.
Our research analysts and sales persons provide important input into our investment advisory activities. This document does not constitute an offer or solicitation for the purchase or sale of any financial instrument or as an official confirmation of any transaction. The information contained herein is from publicly available data or other sources believed to be reliable, but we do not represent that it is accurate or complete and it should not be relied on as such. CAAPL or any of its affiliates/ group companies shall not be in any way responsible for any loss or damage that may arise to any person from any inadvertent error in the information contained in this report. This document is provided for assistance only and is not intended to be and must not alone be taken as the basis for an investment decision.
The user assumes the entire risk of any use made of this information. Each recipient of this document should make such investigation as it deems necessary to arrive at an independent evaluation of an investment in the securities of companies referred to in this document (including the merits and risks involved), and should consult his own advisors to determine the merits and risks of such investment. The investment discussed or views expressed may not be suitable for all investors. We and our affiliates, group companies, officers, directors, and employees may: (a) from time to time, have long or short positions in, and buy or sell the securities thereof, of company (is) mentioned herein or (b) be engaged in any other transaction involving such securities and earn brokerage or other compensation or act as advisor or lender/borrower to such company (ies) or have other potential conflict of interest with respect to any recommendation and related information and opinions. This information is strictly confidential and is being furnished to you solely for your information.
This information should not be reproduced or redistributed or passed on directly or indirectly in any form to any other person or published, copied, in whole or in part, for any purpose. This report is not directed or intended for distribution to, or use by, any person or entity who is a citizen or resident of or located in any locality, state, country or other jurisdiction, where such distribution, publication, availability or use would be contrary to law, regulation or which would subject CAAPL and affiliates/ group companies to any registration or licensing requirements within such jurisdiction.
The distribution of this document in certain jurisdictions may be restricted by law, and persons in whose possession this document comes, should inform themselves about and observe, any such restrictions. The information given in this document is as of the date of this report and there can be no assurance that future results or events will be consistent with this information. This information is subject to change without any prior notice. CAAPL reserves the right to make modifications and alterations to this statement as may be required from time to time. However, CAAPL is under no obligation to update or keep the information current. Nevertheless, CAAPL is committed to providing independent and transparent recommendation to its client and would be happy to provide any information in response to specific client queries. Neither CAAPL nor any of its affiliates, group companies, directors, employees, agents or representatives shall be liable for any damages whether direct, indirect, special or consequential including lost revenue or lost profits that may arise from or in connection with the use of the information. Past performance is not necessarily a guide to future performance.
The disclosures of interest statements incorporated in this document are provided solely to enhance the transparency and should not be treated as endorsement of the views expressed in the report. CAAPL generally prohibits its analysts, persons reporting to analysts and their family members from maintaining a financial interest in the securities or derivatives of any companies that the analysts cover.
The analyst for this report certifies that all of the views expressed in this report accurately reflect his or her personal views about the subject company or companies and its or their securities, and no part of his or her compensation was, is or will be, directly or indirectly related to specific recommendations or views expressed in this report. Any dispute arising out of the document shall be subject to the exclusive jurisdiction of the Courts in Mumbai, India