Alliander N.V. Results 2012. Full-year results... · Disclaimer This report is a translation of a...
29
Alliander N.V. results 2012
Transcript of Alliander N.V. Results 2012. Full-year results... · Disclaimer This report is a translation of a...

Alliander N.V.results 2012

Disclaimer
This report is a translation of a selection of sections of the Dutch annual report 2012 of
Alliander N.V.. Although this translation and selection has been prepared with the utmost
care, misinterpretations as a result of the selection process or deviations as a result of the
translation process from the Dutch annual report may nevertheless occur, such that the
information in this report may be misinterpreted or different conclusions may be drawn.
In such cases, the Dutch annual report 2012 will prevail.
‘We’, ‘Alliander’, ‘the company’, ‘the Alliander Group’ or similar expressions are used in
this report as synonyms for Alliander N.V. and its subsidiaries. Liander refers to grid
manager Liander N.V. and its subsidiaries. The name Endinet refers to the Endinet group,
including grid manager Endinet B.V.. In this report Stam refers to Stam Heerhugowaard
Holding B.V. and its subsidiaries and Liandon refers to Liandon B.V.. Alliander N.V. is the
sole shareholder of Liander N.V., Endinet Groep B.V., Liandon B.V., Alliander Telecom N.V.,
Alliander Participaties B.V., Verlian B.V., Stam Heerhugowaard Holding B.V and Alliander AG.
Parts of this report contain forward-looking information. These parts may – without
limitation – include statements on government measures, including regulatory measures,
on Alliander’s share and the share of its subsidiaries and joint ventures in existing and new
markets, on industrial and macroeconomic trends and on the impact of these expectations
on Alliander’s operating results.
Such statements contain or are preceded or followed by words such as ‘believes’, ‘expects’,
‘thinks’, ‘anticipates’ or similar expressions. These prospective statements are based
on the current assumptions and are subject to known and unknown factors and other
uncertainties, many of which are beyond Alliander’s control, so that actual future results
may differ significantly from these statements.
This report has been prepared using the accounting policies applied in the preparation
of the 2012 Annual Report of Alliander N.V., which can be found on alliander.com.

table of contents
Introduction by CEO Peter Molengraaf 3
Profile 6
Trends in energy 8
Shareholders and lenders 9
Consolidated financial statements 23Consolidated balance sheet 23Consolidated income statement 24Consolidated statement of comprehensive income 24Consolidated cash flow statement 25Consolidated statement of changes in equity 26
This report has been prepared for roadshow purposes and is composed of parts of the Annual Report 2012
of Alliander N.V..
1Alliander N.V. results 2012 | table of contents
45%
24%
13%
9%
9%
Gelderland
Amsterdam
Friesland
Other shareholders with interests < 3%
Noord-Holland
electricity and gas
electricity
gas
electricity and gas
gas
Liander
Endinet
the structure of our organisation shareholders geographical network distribution
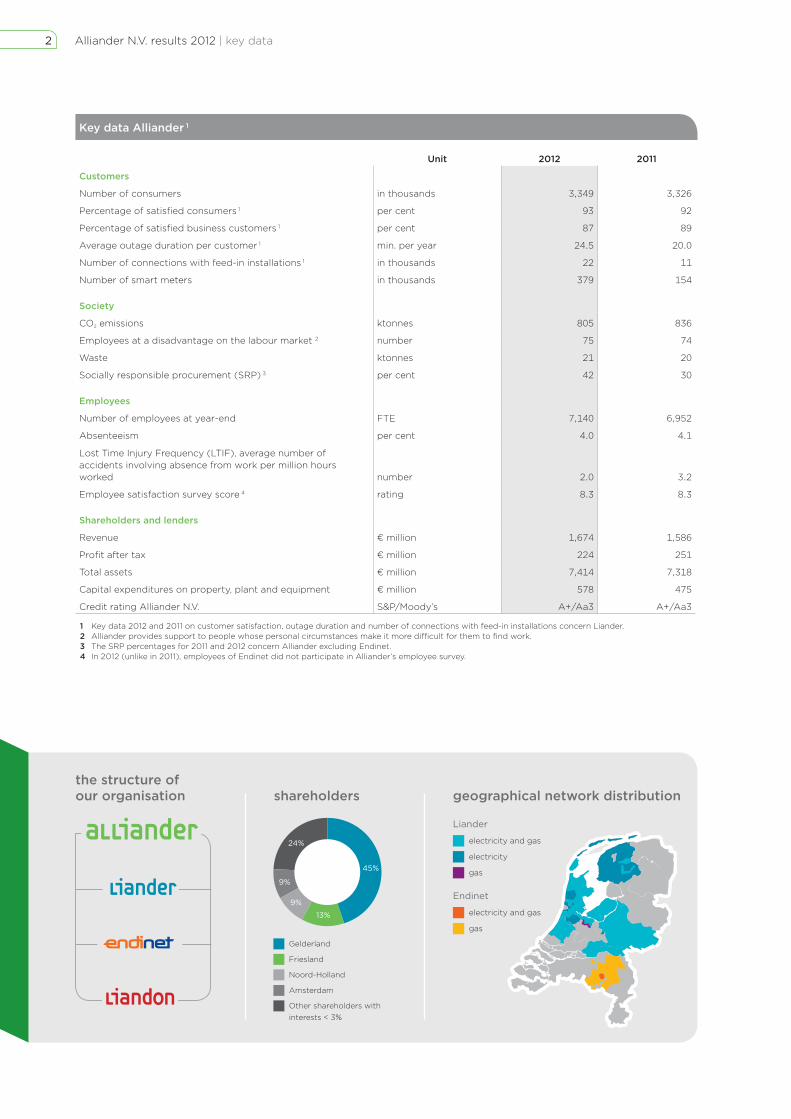
Key data Alliander 1
Unit 2012 2011
Customers
Number of consumers in thousands 3,349 3,326
Percentage of satisfied consumers 1 per cent 93 92
Percentage of satisfied business customers 1 per cent 87 89
Average outage duration per customer 1 min. per year 24.5 20.0
Number of connections with feed-in installations 1 in thousands 22 11
Number of smart meters in thousands 379 154
Society
CO2 emissions ktonnes 805 836
Employees at a disadvantage on the labour market 2 number 75 74
Waste ktonnes 21 20
Socially responsible procurement (SRP) 3 per cent 42 30
Employees
Number of employees at year-end FTE 7,140 6,952
Absenteeism per cent 4.0 4.1
Lost Time Injury Frequency (LTIF), average number ofaccidents involving absence from work per million hours worked number 2.0 3.2
Employee satisfaction survey score 4 rating 8.3 8.3
Shareholders and lenders
Revenue € million 1,674 1,586
Profit after tax € million 224 251
Total assets € million 7,414 7,318
Capital expenditures on property, plant and equipment € million 578 475
Credit rating Alliander N.V. S&P/Moody’s A+/Aa3 A+/Aa3
1 Key data 2012 and 2011 on customer satisfaction, outage duration and number of connections with feed-in installations concern Liander. 2 Alliander provides support to people whose personal circumstances make it more difficult for them to find work.3 The SRP percentages for 2011 and 2012 concern Alliander excluding Endinet.4 In 2012 (unlike in 2011), employees of Endinet did not participate in Alliander’s employee survey.
2 Alliander N.V. results 2012 | key data

As a network company, we connect energy producers and users. The rapidly-changing energy landscape is creating new challenges.
Energy and ICT technologies are advancing strongly, more
and more customers are generating their own energy,
energy flows are becoming more complex, investments in
electric transport are growing, and governments have
great ambitions to reduce CO2 emissions. Amidst these
dynamics, our challenge is to connect producers and
consumers of both electricity and gas in a reliable, safe
and affordable manner.
Alliander sees it as it’s duty to facilitate the transition to a
more sustainable energy system. In doing so, we are
helping customers to gain more insight into their energy
consumption as well as supporting local initiatives of
customers to produce and share their own energy. We are
also busy equipping our networks to handle two-way
energy flows in a step-by-step process. Old sections are
being replaced, the capacity of the electricity network is
being increased and smart ICT solutions are being added
to improve the management and control of energy flows.
While the contours of the future energy system are already
visible, the exact shape of things to come is still unknown.
Learning to deal with that uncertainty is a key aspect of
the energy transition. There are no blueprints for the
coming decades. The energy transition is simply too
complex and too far-reaching to plan far ahead. By
applying innovative technologies and smart ICT solutions
and by working closely with customers, partners and
government agencies, we are trying to anticipate trends
and developments, wherever possible, in a responsible
manner. All our strategic decisions and network
investments are carefully assessed in the light of future
energy distribution scenarios.
However, we as an organisation are not just looking to
the future. After all, our customers clearly also need
reliable and safe energy, now and in the future. In 2012,
we invested more than in previous years in network
construction and maintenance, as well as in the rapid
resolution of faults. Approximately € 600 million was
committed to the replacement and expansion of our
networks. A solid and open energy distribution network
plays a crucial role in our drive towards innovation,
sustainability and new energy applications.
“More and more customers are generating their own energy.”
introduction by CEO Peter Molengraaf
3Alliander N.V. results 2012 | introduction by CEO Peter Molengraaf

New energy for our customersThe figures for 2012 show a positive result. It was a
year with a strong focus on reliability of supply and
sustainability for our customers. In Amsterdam, a new
intelligent energy network serving some 10,000 households
became operational. In Nijmegen, we teamed up as a
partner with the municipality and market parties to
construct a heat transportation network, which will
ultimately supply residual heating to more than
10,000 new homes.
While our customers are satisfied with the service we
provide, continuing customisation is vital to meet their
demands. This is a major challenge because, as is evident
from the growing number of applications for feed-in
connections to our energy networks, our customers are
clearly moving with the times. In 2012 we also connected
350 new charging poles to the electricity network, thus
stimulating the development of electric transport. Due
to the growing number of customers investing in solar
panels, applications for feed-in permission doubled. We
also offered smart meters to 225,000 households, which
doubled the total number of operational meters. Thanks to
various pilots, we have learned how we can best offer the
smart meters to customers. It is crucial, for instance, to
give them online insight into their own energy
consumption. Valuable lessons like these are helping us
to prepare the large-scale offering of smart meters in 2014.
Achieving more togetherWe firmly believe that better results can be achieved by
taking advantage of each other’s talents, knowledge and
potential. In our complex playing field, we need many good
partners to meet the energy needs of today and tomorrow.
Together with municipalities, we took initiatives aimed
at encouraging residents to become involved in new
energy saving and sustainability ideas. And we are
engaged in an open dialogue with ministries as well as
provincial and local authorities to help give direction and
shape to the energy policy at national, regional and local
level. In 2012, our energetic pursuit of cooperation also
led to partnerships aimed at promoting technological
innovations and new forms of service. Furthermore,
we actively contributed to knowledge sharing and
development by participating in the initiation of the
European Network for Cyber Security and the creation
of the Watt Connects inspiration centre in Arnhem.
We are achieving more together. Within the procurement
chains of our organisation, we involve our partners and
suppliers in efforts to create more sustainable and socially
responsible purchasing solutions. And in the labour
market, we worked intensively in 2012 with contractors,
training institutes and ROC regional training centres to
find solutions for the growing scarcity of skilled
technicians. Together with our partners, we are engaged in
a continuous search for innovations to make our energy
supply even more affordable and reliable.
4 Alliander N.V. results 2012 | introduction by CEO Peter Molengraaf

Our operationsThe employees of Alliander make our company what it is.
Working on energy infrastructures demands great skill
and concentration. And of course safety is a priority in our
work. The number of accidents with injury remained well
within the set limit, but every accident is one too many.
Safety at work therefore continues to demand our full and
undivided attention.
The average electricity outage duration was 24.5 minutes
in 2012. Despite having one of the most reliable networks
in the world, we failed to meet our own target of
22 minutes as a result of several major outages at the
end of 2012. In the coming years, we aim to achieve a
further structural reduction in the outage duration in our
networks. Another concern is that a number of investment
projects have fallen behind schedule due to protracted
consultation procedures and delayed decision-making.
Together with all parties involved, we will continue our
efforts to bring these vital network renewal processes to a
successful completion. In connection with our ‘right first
time’ commitment, we focused more intensively on
improving our operational performance in 2012. That is
good for our customers, reduces the workload and creates
better cooperation with partners in the chain.
Operating in the midst of a complex energy transition, we
are more dependent than ever on the professional skills,
commitment and work ethic of our employees. By creating
good, healthy and safe working conditions and by offering
plenty of training opportunities, we encourage our
employees to develop and deploy their competences and
reach their full potential within our company.
A great challengeSecuring a reliable and sustainable energy supply is one
of the biggest challenges our society faces today. In 2012,
we were once again encouraged to see how many people,
both inside and outside our company, are keen to help
make this happen. By looking ahead together, remaining
open to each other’s potential and becoming more
energy-conscious, we can rise to this challenge.
As in 2012, we will continue in the coming years to secure
a reliable and sustainable energy supply with great
passion and ambition.
Peter MolengraafCEO
Operational Excellence Efficiency is a key focus in our work. By further improving our operational management, we will be better able to carry out our projects and deal with the vast amount of work ahead. It will also help optimise safety, quality and customer satisfaction throughout our operations. In October 2012, several teams started using the LEAN method to carry out their daily work with increasing efficiency. Processes are discussed on a day-to-day basis to achieve permanent improvements. Operational Excellence means, above all, doing the job first time right, without needing to redo or repair things later. That is not only good for the customer, but reduces the workload and creates better cooperation with partners in the chain.
“While the contours of the future energy system are already visible, the exact shape of things to come is still unknown. Learning to deal with that uncertainty is a key aspect of the energy transition.”
5Alliander N.V. results 2012 | introduction by CEO Peter Molengraaf

locations, while at the same time energy continues to
be consumed in all regions.
The existing energy chain is still largely based on the
centralised production of electricity and gas, which is
transported by TenneT and Gasunie Transport Services.
However, decentralised generation is now increasingly
coming to the fore. More and more customers are feeding
their renewable energy surpluses, from e.g. solar panels
or combined heat and power (CHP) installations, into
our energy networks.
Liander and Endinet then transport this energy to
consumers, businesses and institutions, and now also
to charging stations for electric vehicles.
The delivery and actual usage of electricity and gas is
arranged between the customer and his energy provider.
The customer is free to choose his own provider.
Alliander operates energy networks which distribute gas and electricity to large parts of the Netherlands. With our work we facilitate businesses, homes, transport and recreation. We want to strengthen and empower society by providing open access to the energy infrastructure and giving our customers more insight into their energy consumption. Alliander is helping to bring an open and sustainable energy market closer.
What Alliander doesCore tasksOur most important task is to distribute gas and
electricity to consumers, businesses and institutions.
The network operators Liander and Endinet make this
possible by keeping the energy networks in good
condition, taking care of distribution and connecting
customers to the energy networks.
In response to the rapidly changing energy landscape,
we are working hard to build a future-proof and open
network that can accommodate multiple energy providers.
To obtain insight into society’s energy ambitions at all
levels, we consult with provinces, municipalities and other
customers. We help them resolve their energy issues and
develop complex energy infrastructures.
How we workOur role in the energy chainThe transportation of energy through Alliander’s networks
is becoming more and more dynamic. Renewable energy is
being produced and offered at a growing number of
profile
CHP installations at agriculturaland horticultural businesses
homes
offi ces
electric cars
local renewable energy companies
wind farmspower stations
Energynetworks
6 Alliander N.V. results 2012 | profile

otheractivities
1,805
48,059
412
37,009
Low-voltage (0,23 kV)
Medium-voltage (3/10/20 kV)
Intermediate voltage (50 kV)
High-voltage (110/150 kV)
Total87,285
Size of electricity transport network (in km)
7,102
35,410 High-pressure (> 0,2 bar)
Low-pressure (< 0,2 bar)
Total 42,512
Size of gas transport network (in km)
The organisational structure
Alliander N.V. is the holding company of our subsidiaries and group companies, including the regional network operators Liander and Endinet. Liandon is Alliander’s knowledge centre and largely responsible for the technical innovations for the transportation and distribution of electricity and gas. Alliander’s shareholders are Dutch provinces and municipalities. The largest shareholders are the provinces of Gelderland, Friesland, Noord-Holland and the municipality of Amsterdam. More information about the legal structure of Alliander can be found at alliander.com.
The regional distribution of energy in the Netherlands is the exclusive responsibility of network operators. This is laid down in the Dutch Electricity Act 1998 and the Gas Act. Network management is the most important activity within Alliander. About 90% of the revenue comes from connections and the distribution of energy by Liander and Endinet. The other 10% is generated by activities involving the construction and maintenance of complex infrastructures by Liandon, as well as the unregulated activities.
Network Operations Gas
Network Operations Electricity
New electricity connections
3,087,000
31,000
Active electricity connections
Transported electricity volume (GWh): 30,522
New gas connections
2,644,000
22,000
Active gasconnections
Transported gas volume (million m3): 7,461
7Alliander N.V. results 2012 | profile

trends in energy
Increase in decentralised energy generationMore and more consumers and businesses
will be producing their own electricity, heating and biogas. They can do this individually or collectively (with neighbours or in cooperatives). Solar panels are particularly popular, as lower prices now make them economically profitable. Homes and buildings are also increasingly using solar and thermal heating as an alternative to natural gas.
New energy mixOur customers’ energy consumption patterns will look very different in the future. We currently use fossil fuels for transport (petrol, gas and diesel) and heating
(natural gas). Moving forward, more use will be made of electricity, particularly when electric transport becomes more commonplace. The share of renewable energy will also rise through e.g. the use of solar boilers and heat pumps for spatial heating.
Strong impact of new technologyThanks to technological developments and IT, appliances are becoming more energy-efficient and the number of
smart applications is constantly expanding. Insight into energy flows and our energy consumption is improving. For instance, the smart meter, in combination with smart applications, enables consumers, institutions and businesses to see exactly how much energy they consume and
manage their energy more effectively. Alliander is investing in new technologies that make it possible to monitor the energy networks, control the energy flows and feed energy into the network. This contributes to a more efficient energy supply.
More efficient energy consumptionAlongside the increasing number of electric applications, such as the electric
car, houses are also becoming more energy-efficient. New buildings are designed to use less energy and, in due course, can even be made energy-neutral. Greenhouses, too, are becoming more energy-efficient and some actually produce more energy than they use. Meanwhile, industrial production processes are becoming more economical in their energy consumption.
Increased opportunities for energy storage Innovative technologies make it possible to store electricity and other forms of energy. The storage capacity of batteries is also being steadily expanded. This opens up new
opportunities for storing renewable energy, which has great implications for our future energy supply. In addition, new storage options for other forms of energy, such as (bio)gas and heat, are constantly being developed.
Trends in energy form an integral part in the determination of Alliander’s strategic choices.
Many developments in society influence our energy system. People are living longer, the urban population is growing and society operates virtually around the clock. Moreover, technology is an increasingly pervasive presence in our daily lives. These developments also have a downside, particularly if you look at energy. Demand for fossil fuels and raw materials is growing, leading to rising prices, uncertain availability and harmful effects on the environment. To continue supplying society with
sustainable, affordable and reliable energy in the future, we urgently need to adopt a new approach to the way we generate and use energy. This ‘energy transition’ also has implications for Alliander’s role and the activities we are required to perform. We see it as our duty to society to facilitate the transition to a sustainable energy supply. Looking at the energy supply and the transition that is taking place, Alliander has identified five key trends.
8 Alliander N.V. results 2012 | trends in energy
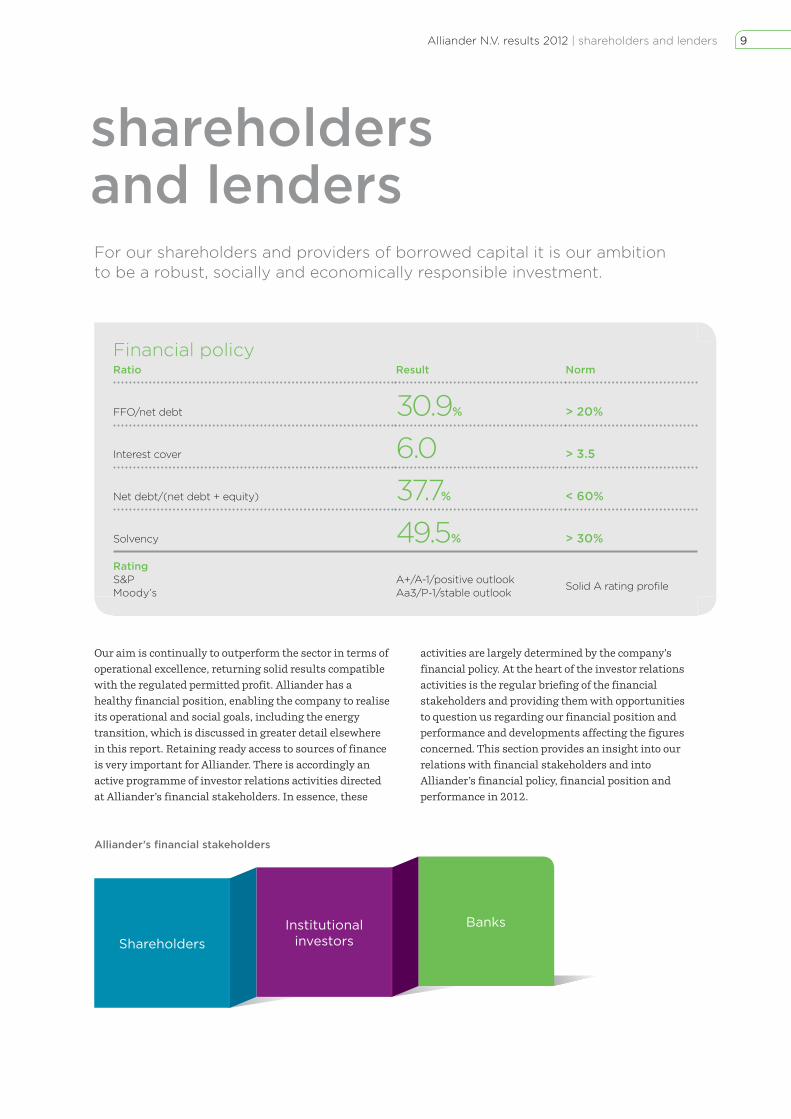
For our shareholders and providers of borrowed capital it is our ambition to be a robust, socially and economically responsible investment.
shareholders and lenders
Our aim is continually to outperform the sector in terms of
operational excellence, returning solid results compatible
with the regulated permitted profit. Alliander has a
healthy financial position, enabling the company to realise
its operational and social goals, including the energy
transition, which is discussed in greater detail elsewhere
in this report. Retaining ready access to sources of finance
is very important for Alliander. There is accordingly an
active programme of investor relations activities directed
at Alliander’s financial stakeholders. In essence, these
activities are largely determined by the company’s
financial policy. At the heart of the investor relations
activities is the regular briefing of the financial
stakeholders and providing them with opportunities
to question us regarding our financial position and
performance and developments affecting the figures
concerned. This section provides an insight into our
relations with financial stakeholders and into
Alliander’s financial policy, financial position and
performance in 2012.
Alliander’s financial stakeholders
ShareholdersInstitutional
investorsBanks
Financial policyRatio Result Norm
FFO/net debt 30.9% > 20%
Interest cover 6.0 > 3.5
Net debt/(net debt + equity) 37.7% < 60%
Solvency 49.5% > 30%
RatingS&PMoody’s
A+/A-1/positive outlook Solid A rating profile
Aa3/P-1/stable outlook
9Alliander N.V. results 2012 | shareholders and lenders

Various instruments are used to fund the maintenance
and expansion of the energy distribution networks and
other activities, for which Alliander is dependent on its
shareholders, institutional investors and banks.
Alliander’s creditworthiness is rated by rating agencies
who publish their findings.
The capitalisation of Alliander as at year-end 2012 was
build up as follows:
163
2,709
98
494
1,766 Equity
Subordinated perpetual bond
Subordinated loans
Euro Medium Term Notes
Other
Total 5,230
Capital structure Alliander/€ million
The capital structure reveals that Alliander’s financing is
more or less equally divided between equity and borrowed
capital. The equity capital is provided by the shareholders
and increases annually by the amount of the earnings
retained. The shareholders receive a percentage of the net
profit as dividend each year. Holders of the hybrid bonds
also receive a fixed return on their investment out of the
reported profit provided the dividend is declared. The
profit which is retained is used as a source of finance.
Alliander does not have access to finance by issuing new
shares to private investors because private shareholdings
in Dutch regional network companies are prohibited by
law. To raise external finance, Alliander needs to turn to
providers of borrowed capital. These are mainly
institutional investors that buy debt instruments issued
by Alliander. To meet its long-term finance requirements,
Alliander has issued six bond loans that are quoted on the
stock exchange, including a subordinated perpetual bond.
The loans are listed on the Luxembourg Stock Exchange
and NYSE Euronext Amsterdam. To meet its variable
finance needs in the short-term, Alliander regularly issues
short-term commercial paper. Additionally, Alliander has
contracted committed credit facilities with a number of
banks to serve as a source of finance, should it not be
possible to raise the necessary funds on the capital market
or the money market.
Open dialogueAlliander pursues an active policy of maintaining an open
and constructive dialogue with shareholders, bondholders,
financial institutions, credit rating agencies, analysts and
the media. We endeavour to provide all stakeholders with
relevant financial and other information as accurately and
promptly as possible, in reports, in press releases and in
meetings as well as by other means.
Financial policy and long-term objectivesAlliander’s financial policy and long-term objectives aim
at achieving a balance between generating an adequate
return for shareholders and protecting bondholders and
other providers of borrowed capital while retaining the
flexibility to be able to invest and allow the business to
grow. The general principles of the financial policy are to
ensure a balanced repayment schedule and to have
available committed credit facilities and sufficient cash
and cash equivalents. By operating within the financial
framework and in accordance with the general principles,
a solid A rating profile is maintained. For network
operators Liander N.V. and Endinet B.V., separate criteria
pursuant to the Network Operators Financial
Management Decree (Besluit Financieel Beheer
Netbeheerder) apply.
Financial frameworkAlliander’s financial framework is formed by the ratios
FFO/net debt, interest cover, net debt/net debt plus equity
and equity as a percentage of total assets less deferred
income (solvency ratio). In a departure from IFRS, the
subordinated perpetual bond loan issued in 2010 is treated
as 50% equity and 50% borrowed capital.
10 Alliander N.V. results 2012 | shareholders and lenders

Ratios
Alliander financial policy ratios
norm 31 December 2012 31 December 2011
FFO/net debt 1 > 20% 30.9% 34.1%
Interest cover 2 > 3.5 6.0 5.8
Net debt/(net debt + equity) < 60% 37.7% 37.0%
Solvency 3 > 30% 49.5% 47.5%
The financial framework within which Alliander operates is based on the four ratios presented in the above table. These ratios are calculated according to the principles of our financial policy. These principles differ in one regard from IFRS accounting policies in that the subordinated perpetual bond loan is treated as equity under IFRS but as 50% borrowed capital and 50% equity for the purposes of our financial policy.
1 The ratio of funds from operations (FFO) to net debt concerns the 12-month profit after tax, adjusted for the movements in the deferred tax assets and liabilities, for the incidental items and fair value movements, plus the balance of depreciation and amortisation of property, plant and equipment and intangible assets and deferred income, divided by the net debt.
2 The interest cover ratio concerns the 12-month profit after tax, adjusted for the movements in the deferred tax assets and liabilities, for the incidental items and fair value movements, plus the depreciation and amortisation of property plant and equipment and intangible assets and the net amount of finance income and expense, divided by net finance income and expense adjusted for incidental items and fair value movements.
3 The solvency ratio is arrived at by dividing equity including the profit for the period by the balance sheet total less the expected dividend distribution to be made in the current year and less deferred income.
As at 31 December 2012, the FFO/net debt ratio amounted
to 30.9% (year-end 2011: 34.1%). This decrease is mainly
the effect of the increase in the net debt position.
As at 31 December 2012, the interest cover ratio worked
out at 6.0, which is a slightly higher figure than at
year-end 2011 (5.8). The ratio of net debt/sum of net debt
and equity as at 31 December 2012 amounted to 37.7%
(year-end 2011: 37.0%). The slight increase is largely due
to an increase in the net debt position in 2012. Alliander’s
financial policy stipulates that this ratio should not exceed
60%. The solvency ratio as at 31 December 2012 amounted
to 49.5% (year-end 2011: 47.5%). Alliander’s financial
policy stipulates that this ratio should be a minimum
of 30%.
Dividend policyThe dividend policy (as part of the financial policy)
provides for distributions out of the profit after tax,
adjusted for non-cash incidental items, unless the
investments required by regulators or the financial
criteria demand a higher profit retention percentage and
unless the solvency ratio falls below 30% after payment
of dividend. Also taken into account is the requirement
formulated by the Minister of Economic Affairs when the
integrated energy companies where unbundled, limiting
the dividend up to 1 January 2014 to a maximum of 45%
of the profit after tax.
Investment policyThe investment policy is consistent with the financial
policy and is part of Alliander’s strategy. Elements of
investment policy include compliance with regulatory
requirements relating to investments in the regulated
domain, generation of an adequate return on investment
and social acceptance and support. Investment proposals
are tested against minimum return requirements and
criteria as set out in the financial policy. As well as
quantitative requirements, investment proposals must
also meet qualitative requirements, such as consistency
with the corporate strategy and stakeholder interests.
It should also be noted that in principle investments in
the regulated domain arise from a network operator’s
statutory task.
ShareholdersAll of Alliander’s shares are held directly or indirectly by
Dutch provincial and municipal authorities. The major
shareholders are (percentages rounded):
• Province of Gelderland 45%
• Province of Friesland 13%
• Province of Noord-Holland 9%
• City of Amsterdam 9%
The remaining shareholders each hold less than 3% of
the shares. A full list of the shareholders can be found on
the Alliander website (alliander.com). For provisions
governing the issue of shares, pre-emptive rights,
repurchase of shares and reductions in share capital,
reference is made to the company’s articles of association,
which can also be found on alliander.com. The articles
also stipulate among other things that shareholders may
exclusively be i) the Dutch state, ii) a provincial authority,
iii) a municipal authority or iv) public or private limited
liability companies whose shares, pursuant to their
articles of association, may exclusively be held directly or
indirectly by the Dutch state, a provincial authority or a
municipal authority. This means Alliander is not allowed
to be privatised. Each share of Alliander N.V. confers the
right to cast one vote.
The authorised share capital of Alliander N.V. is divided
into 350 million shares with a nominal value of five euros.
All the shares are registered shares. As at 31 December
2012, there were 136,794,964 issued and paid-up shares.
11Alliander N.V. results 2012 | shareholders and lenders

Contacts with shareholdersContacts with shareholders primarily take place in
shareholders’ meetings and through the Committee of
Shareholders. Additionally we find regular interaction
outside the formal meetings important. This gives us
valuable feedback on the company’s strategic and
day-to-day management and also provides an insight
into the wishes and concerns of shareholders.
The Annual General Meeting of Shareholders took place
on 12 April 2012. The meeting considered the 2011 annual
report and formally adopted the 2011 financial statements
and the dividend declaration in respect of 2011. At the
same meeting, the shareholders ratified the actions of the
members of the Management Board and Supervisory
Board in performing their duties. The meeting also passed
the proposed revised resolution providing for a total
capital expenditure of € 979 million for the roll-out of
smart meters over the next few years. A resolution
reappointing the presiding Committee of Shareholders for
a period of two years was also adopted and Ms J.B. Irik and
Ms A.P.M. van der Veer-Vergeer were reappointed
members of the Supervisory Board.
The Committee of Shareholders is a group of shareholders
appointed by the General Meeting of Shareholders from
among their number on which certain powers are conferred
to represent shareholders. These powers concern the right to
recommend candidates for appointment to the Supervisory
Board and to appoint and dismiss its members and a
number of powers relating to the appointment and
dismissal of members of the Management Board. The
composition of the Committee, can be found on the
Alliander website (alliander.com).
In 2012, the Supervisory Board consulted the Committee
of Shareholders in writing on three occasions concerning
the appointment and reappointment of Supervisory Board
members. On 20 January 2012, the Committee was
advised of two vacancies on the Supervisory Board. For the
vacancies concerned, which had arisen in connection with
the retirement of Ms J.B. Irik and Ms A.P.M. Van der Veer-
Vergeer, the Committee of Shareholders did not have any
enhanced right of recommendation but only an ordinary
right of recommendation 1. The Committee indicated that
it would not be exercising its right of recommendation.
On 5 November, the Committee of Shareholders was
advised of an interim vacancy arising on the Supervisory
Board, following the death of Mr G. Ybema. In the case of
this interim vacancy, the Committee of Shareholders did
have an enhanced right of recommendation and exercised
this right by recommending Ms J.W.E. Spies for
appointment to the Supervisory Board. On 13 December,
the Committee was advised of the vacancies arising after
the Annual General Meeting of Shareholders (AGM) to be
held on 27 March 2013 and concerning the proposal to
reduce the number of members of the Supervisory Board
from seven to six.
In preparation for the AGM held on 12 April 2012, the
Committee had a meeting with the Selection, Appointment
and Remuneration Committee on 15 March to discuss the
achievement of the objectives for the short-term and long-
term variable remuneration of the Management Board for
2011 and the 2011 Remuneration Report. Also discussed
were the consequences of the Bill before parliament
concerning the regulation of top salaries in the public and
semi-public sector (Wetsvoorstel Normering bezoldiging
topfunctionarissen publieke en semi-publieke sector).
Shareholder briefings were organised on 13 February
and 30 July at which the Management Board gave
presentations covering the results for the 2011 financial
year and the interim results in 2012, respectively.
The Major Shareholder Consultation Body met on three
occasions in 2012, preceded on each occasion by a meeting
of the Sounding Board Group. The Sounding Board Group
is an informal discussion forum at working group level
which makes preparations for the Major Shareholder
Consultation Body’s deliberations. The Major Shareholder
Consultation Body is in turn an informal government body
in which preparations are made for the AGM, providing a
forum for discussion of relevant developments, exchange
information and promotion of mutual understanding. In
these deliberations, the same shareholders and
shareholder groups are represented as in the Committee of
Shareholders. Discussions ranged over such matters as the
strategic and day-to-day management of the company,
trends in tariffs and developments in the fields of energy
transition, innovation and sustainability.
There were also regular contacts with shareholders on an
individual level and at the level of, for example, provincial
government committees, clusters of shareholder
municipal authorities and representatives of political
parties regarding Alliander’s course and strategy as well as
practical matters concerned with implementation.
1 The Central Works Council and the Committee of Shareholders have an enhanced right of recommendation in respect of nominations for one third of the members of the Supervisory Board. This means that the Supervisory Board will propose a candidate nominated by the Central Works Council or Committee of Shareholders unless the Supervisory Board objects to the person recommended. This enhanced right of recommendation applies to every vacancy on the Supervisory Board arising through the resignation of a member of the Supervisory Board appointed as a result of the enhanced right of recommendation.
12 Alliander N.V. results 2012 | shareholders and lenders

2012 profit appropriation The Management Board has determined, with the approval
of the Supervisory Board, to add € 150.0 million of the
profit to other reserves. The remaining profit of
€ 74.4 million is at the disposal of the General Meeting
of Shareholders. This is based on the profit after
tax, excluding incidental items after tax that did not
generate cash flows in the 2012 financial year.
2009 2010 2011 2012
113
7480
54
Dividend/€ million
The lower dividend for 2012 compared with 2011 is
mainly a consequence of the inclusion in the dividend
computations for 2011 of the non-recurring income
resulting from the settlement of corporate income tax
assessments relating to prior years, giving rise to a
dividend pay-out of € 113.0 million for 2011.
Institutional investorsA large part of our finance in the form of borrowed capital
is provided by institutional investors in our bond issues,
such as asset managers, insurance companies, pension
funds and banks. These are professional parties on the
international financial markets. In order to keep existing
and potential bondholders informed regarding the
company’s financial position and results as well as
developments in the industry, Alliander actively engages
in investor relations activities in addition to complying
with ordinary publication requirements. We organise
roadshows, visiting investors on-site with regular updates
on Alliander’s financial performance, the strategic and
day-to-day management of the business, trends in tariffs
and other developments that are of importance in forming
a picture of Alliander’s creditworthiness and arriving at
investment decisions involving Alliander.
In February 2012, Alliander held roadshows in
Amsterdam, Paris, London and Frankfurt to publicise
the company’s annual results and other relevant
developments. One-to-one talks with a number of
investors also took place. Coinciding with the publication
of the half-year figures at the end of July, an investor
conference call was held, allowing investors to listen to
a presentation of the figures on the telephone with the
opportunity to ask questions. Throughout the year there
were regular contacts with investors and analysts in
response to questions and requests for information.
Capital market and money market activitiesDuring the year under review, Alliander was active on the
capital market and the money market in connection with
a refinancing operation and a liability management
transaction:
• in April, as contractually required, a € 500 million bond
loan issued under the Euro Medium Term Notes (EMTN)
programme was repaid, with funds provided partly from
available cash and partly out of the proceeds from the
issue of Euro Commercial Paper (ECP);
• in June, Alliander issued a new bond loan under the
existing EMTN programme with a face value of
€ 400 million, a maturity of 12 years and a coupon rate
of 2.875%. The funds raised were used to redeem the
ECP in issue on schedule;
• in November, Alliander issued a new bond loan , again
under the existing EMTN programme, with a face value
of € 400 million, this time with a maturity of 10 years
and a coupon rate of 2.25%. This issue took place after
the success of a previously announced offer to buy back
bonds maturing in 2014 and 2016. In total, bonds with
a face value of € 324 million issued under the EMTN
programme were redeemed. Investors taking up the
offer were granted preferential allocation, on request,
with respect to the issue of the new bond loan. This
request for preferential allocation was made in the case
of roughly half of the bonds offered for redemption.
These two transactions produced a more regular
maturity profile for the debt, extending farther into
the future. In the longer term, this will lead to lower
interest charges.
13Alliander N.V. results 2012 | shareholders and lenders

The repayment schedule for the interest-bearing debt as at
year-end 2012 was as follows:
2013 2014 2015 2016 2017 2018 2019 2020 2021 2022 2023 2024 >2025–2012
282
422440
590
306 306
43 41
408 400
5 6 5 6 5 6 5 6 7 7 7 7 9
509
Year-end 2011 Year-end 2012
Repayment schedule for interest-bearing debt/€ million
The amounts scheduled for repayment in 2014, 2016,
2019, 2022 and 2024 mainly relate to the bond loans.
The other amounts relate to the repayment of shareholder
loans and other loans.
Alliander has a € 3 billion EMTN programme. As at
year-end 2011, bonds totalling € 1.8 billion had been
issued. In 2012, a total nominal amount of € 824 million
was repaid/redeemed early and a nominal amount of
€ 800 million was issued, meaning that bonds with a
carrying amount of € 1,766 million were in issue as at
31 December 2012 (nominal amount: € 1,776 million).
Alliander also has a € 1.5 billion ECP programme. Under this
ECP programme, an amount of € 537 million was issued in
the year under review. As at year-end 2012, however, all the
ECP loans had been repaid.
BanksAlliander has contracted a committed backup credit
facility totalling € 600 million with six banks. The facility
runs until 15 July 2017, with the option of an extension
by 12 months, until 15 July 2018. Part of this facility can
also be used to issue letters of credit relating to
cross-border leases. The facility has not been drawn on.
During the year, a number of the banks concerned, not
always in the same composition, were involved in the issue
of the aforementioned two bond loans and the partial
buyback of the two existing bond loans. A number of
banks were also involved in the issue of commercial paper.
The option to extend the credit facility with the group of
banks by 12 months until 15 July 2017 was also exercised
in 2012.
Rating agenciesIn order to retain ready access to the capital and money
markets, it is important for existing and potential
financiers to have an accurate picture of Alliander’s
creditworthiness and associated credit ratings. Having
a recognised credit rating is also an obligation under the
terms of the cross-border lease contracts entered into at
the end of the 1990s by Alliander’s legal predecessors.
Alliander has a credit rating from S&P and Moody’s.
These ratings comprise a long-term rating with an
outlook, and a short-term rating. The outlook is an
indication of the expected change in the rating over the
next few years. In 2012, there have been no changes in
the ratings or in the outlook. The credit ratings as at
year-end 2012 were as follows:
Credit ratings
long-term short-term
Standard & Poor’s A+ (positive outlook) A-1
Moody’s Aa3 (stable outlook) P-1
Alliander has also been rated in recent years by rating
agencies looking at corporate social responsibility. These
CSR ratings are intended to give institutional investors an
idea of how worthy of investment Alliander is from the
point of view of sustainability. Topics covered by these
ratings include environmental management, labour
relations, customer relations, business ethics and
corporate governance.
14 Alliander N.V. results 2012 | shareholders and lenders

During the reporting period, Alliander was in contact
with both types of rating agency on several occasions.
Once a year there is a review in which the company’s
creditworthiness and sustainability credentials are
re-examined by reference to the most recent financial and
sustainability performance figures and projections for
Alliander. The rating agencies publish their review
findings and updates. At the time of issue of the new bond
loans in June and November, issue ratings were also
published by S&P and Moody’s. They were the same as
the corporate ratings.
Financial results in 2012 The profit after tax for 2012 was € 224 million
(2011: € 251 million). Excluding incidental items and
fair value movements, the net profit was € 228 million
(2011: € 228 million). In the 2012 reporting period, the
regulated revenue was higher than in the preceding year,
taking advantage of the higher tariff ceiling allowed by
the Office of Energy Regulation. This tariff increase
made possible the increased level of maintenance and
network investments, as reflected in the costs of
subcontracted work, operating expenses and
amortisation/depreciation charges.
The cash flow from operating activities was slightly down,
the solvency ratio and the net debt position increased and
total assets increased by € 96 million, partly accounted for
by an increase in the capital expenditure on the networks.
2012 income statement
20112012
Electricity Metering services
Gas Other products
1,674
900996
357383
161
168162133
1,586
Revenue/€ million
Revenue for 2012 was up by € 88 million (6%) compared
with 2011, at € 1,674 million. This increase is largely
accounted for by higher energy distribution tariffs
(€ 122 million) for both electricity and gas (regulated
activities), partially offset by lower revenue from
deregulated activities (€ 35 million) reported by
Liandon and Alliander AG among others.
Other incomeOther income in 2012 came in at € 98 million
(2011: € 109 million). The decrease of € 11 million
is mainly due to a one-off compensation payment of
€ 7 million in 2011 connected with an incident
involving a powder fire extinguisher.
Operating expenses
20112012
1,3781,297
Total operating expenses/€ million
Total operating expenses for 2012 came in at
€ 1,378 million (2011: € 1,297 million). The increase
of € 81 million compared with 2011 is mainly due to a
higher level of activities connected with maintenance
and capital projects and an increase in costs outside
Alliander’s control, resulting in:
• an increase in both payroll and contract labour staff
costs , totalling € 60 million. This was partly
attributable to reorganisation costs amounting to
€ 15 million connected with organisational changes;
• higher amortisation/depreciation charges and a higher
level of investment in the networks during the year but
also affected by an increase in disposals – combined
effect € 26 million;
• an increase in sufferance tax of € 13 million.
The increase in costs was partly offset by an increase of
€ 29 million in capitalised own production connected
with the increased level of capital expenditure.
15Alliander N.V. results 2012 | shareholders and lenders

Operating profitThe operating profit for 2012 was down by € 4 million at
€ 394 million. Excluding incidental items, the operating
profit came in at € 409 million, an increase of € 11 million
compared with 2011.
20112012
394 398
Operating profit/€ million
Finance income and expense Finance income and expenses in 2012 resulted in a
net expense of € 145 million (2011: € 176 million).
The reduction of € 31 million is due to the difference
in fair value movements on financial instruments, a
gain of € 39 million, and lower regular interest charges,
down by € 7 million . The gains were partly cancelled
out by higher costs (€ 14 million) connected with the
bond buyback operation.
Associates and joint ventures The share in the results after tax of associates and
joint ventures in 2012 was a loss of € 15 million
(2011: € 5 million loss). The 2012 and 2011 results
include an impairment loss of € 12 million following
adjustments of projected medium-term results.
TaxThe effective tax rate (the tax rate expressed as a
percentage of profit before tax excluding the share in
the results after tax of associates and joint ventures) for
the 2012 financial year was 4% (2011: 15.1% negative).
The difference between the standard rate of taxation and
the effective tax burden in both years is mainly the effect
of an adjustment in the forecast results in the long-term,
which led to an increase in the carrying amount of the
deferred tax assets, and the finalisation in 2011 of the
corporation tax assessments for prior years.
Profit after tax
20112012
224251
Profit after tax/€ million
The profit after tax for the year came in at € 224 million
(2011: € 251 million). Excluding incidental items and fair
value movements, the net profit for 2012 was € 228 million
(2011: € 228 million). This result is accounted for by higher
revenue (€ 88 million) resulting from the increase in
regulated tariffs, the gain largely being offset by higher
costs and amortisation/depreciation charges with a
combined downside effect of € 81 million.
Incidental itemsAlliander’s results can be influenced by incidental items
and fair value movements. Alliander defines incidental
items as items which in the management’s opinion do not
derive directly from the ordinary activities and/or whose
nature and size are so significant that they must be
considered separately to permit proper analysis of the
underlying results.
Net incidental items and fair value movements in 2012
combined to give a loss of € 4 million after tax
(2011: € 23 million gain). The table on page 17 contains
an overview of the reported figures and the figures
excluding incidental items and fair value movements.
16 Alliander N.V. results 2012 | shareholders and lenders

Reported figures and figures excluding incidental items and fair value movements
€ million ReportedIncidental items and fair
value movements
Excluding incidental items and fair value
movements
2012 2011 2012 2011 2012 2011
Revenue 1,674 1,586 - - 1,674 1,586
Other income 98 109 - - 98 109
Total purchase costs, costs of subcontracted work and operating expenses -1,222 -1,137 -15 - -1,207 -1,137
Depreciation and impairments -337 -312 - - -337 -312
Own work capitalised 181 152 - - 181 152
Operating profi t (EBIT) 394 398 -15 - 409 398
Finance income and expense -145 -176 -50 -75 -95 -101
Share in results of associates and joint ventures -15 -5 -12 -12 -3 7
Profi t before tax 234 217 -77 -87 311 304
Tax -10 34 73 110 -83 -76
Profit after tax 224 251 -4 23 228 228
Total purchase costs, costs of subcontracted work and operating expenses(2012: € 15 million expense, 2011: nil)The exceptional expense in 2012 is associated with
the formation of the provision for reorganisation
costs connected with organisational changes.
Finance income and expense(2012: € 50 million expense; 2011: € 75 million expense)The exceptional items mainly relate to:
• premium paid for the early redemption of bonds,
€ 44 million (2011: € 30 million);
• fair value movements on interest rate swaps, loss
of € 18 million in 2012 (2011: € 39 million loss).
In October 2012, the interest rate swaps were settled
prior to maturity for an amount of € 57 million;
• items connected with cross-border leases, including
costs arising from the revaluation of an asset relating to
a cross-border lease and the movement in the associated
provision, totalling € 9 million gain (2011: € 5 million
loss). Also accounted for under this heading is the
amount of KEMA’s put and call options, totalling
€ 3 million.
Share in results of associates and joint ventures(2012: € 12 million loss; 2011: € 12 million loss)In both years, this relates to impairment losses arising
from adjustments to the projected medium-term results.
Tax(2012: income item of € 73 million; 2011: € 110 million income)Incidental income in 2012 and 2011 relates to adjustment
of the projected long-term results with a positive effect
on deferred tax, the tax effect on the incidental items and
fair value movements and the finalisation in 2011 of the
corporation tax assessments for prior years.
17Alliander N.V. results 2012 | shareholders and lenders

Cash flowsShown below is a summary of the cash flow statement for 2012.
Consolidated cash flow statement
€ million 2012 2011 1
Cash flow from operating activities 545 557
Cash flow from investing activities -498 -398
Cash flow from financing activities -53 -554
Net cash flow -6 -395
1 The figures for 2011 have been restated in connection with a change in presentation to include the premium paid in connection with the early redemption of bonds in the cash flow from financing activities.
The cash outflow associated with investing activities
in 2012 increased from € 398 million to € 498 million.
The increase of € 100 million is largely explained by
the increase in capital expenditure on the networks.
Investments in property, plant and equipment
€ million 2012 2011
Electricity regulated 272 236
Gas regulated 182 135
Metering devices 52 44
Buildings, ICT etc. 72 60
Total 578 475
The cash flow from financing activities in 2012 amounted
to € 53 million negative (2011: € 554 million negative).
The difference, of € 501 million, is due in part to the issue
in 2012 of two new bond loans totalling € 800 million.
In addition, bonds amounting to € 500 million were
redeemed on schedule in 2012 and bonds in issue
amounting to € 324 million were repurchased prior to
maturity. An amount of € 220 million was also withdrawn
from short-term deposits during the year, leaving a
year-end balance of € 75 million. Finally, dividends
totalling € 113 million were distributed along with
€ 24 million in coupon interest on the perpetual
subordinated bond loan. The settlement in October 2012
of four interest rate swaps, involving a total amount of
€ 57 million, and the premium paid in connection with
the early redemption of bonds, amounting to € 44 million
(2011: € 30 million) have been included in the cash flow
from financing activities.
Free cash flow in 2012The free cash flow in 2012 totalled € 47 million,
compared with a free cash flow in 2011 of € 159 million.
The decrease of € 112 million compared with 2011 is
largely explained by the increase in capital expenditure
on the networks.
The cash flow from operating activities in 2012 amounted
to € 545 million (2011: € 557 million). The slightly lower
figure compared with 2011 is mainly due to a lower profit
after tax in 2012. The cash flow from operating activities
covers the increase of approximately € 100 million in
investing activities.
18 Alliander N.V. results 2012 | shareholders and lenders

Reconciliation of free cash flow
€ million 2012 2011 1
Cash flow from operating activities 545 557
Investment in property, plant and equipment -578 -475
Investments in associates -5 -4
Construction contributions received 85 81
Free cash flow 47 159
1 The figures for 2011 have been restated in connection with a change in presentation to include the premium paid in connection with the early redemption of bonds in the cash flow from financing activities.
€ 146 million. The following graph provides further
analysis of this increase.
Financial positionNet debtThe following table presents the reconciliation of the net
debt position as at 31 December 2012:
Reconciliation net debt position
€ million 31 December 2012 31 December 2011
Long-term interest-bearing debt 1,891 1,422
Short-term interest-bearing debt 5 509
Finance lease liabilities 131 133
Gross debt 2.027 2,064
Cash and cash equivalents 100 106
Non-current financial assets 137 130
Interest-bearing receivables from third parties 46 38
Current financial assets 75 295
Investments held for lease obligations related to cross-border leases 177 149
Total cash and cash equivalents and investments 535 718
Net debt in accordance with the financial statements (IFRS) 1,492 1,346
50% of the subordinated perpetual bond loan 247 247
Net debt on the basis of Alliander’s financial policy 1,739 1,593
The net debt position as at 31 December 2012 amounted to
€ 1,739 million (2011: € 1,593 million). This is an increase
compared with the net debt position as at year-end 2011 of
Net debt 2011
Cash flow fromoperatingactivities
Cash flow frominvestingactivities
Dividendpaid
Premium paid bond buy-back & unwind IRS
Other Net debt2012
1,593 -545 498137
101 -45 1,739
Development in net debt position/€ million
19Alliander N.V. results 2012 | shareholders and lenders

The increase in the net debt position in 2012 by
€ 146 million is mainly due to the dividend distributions
to shareholders in 2012 and the interest payments to
the holders of the subordinated perpetual bond loan
during the year, together totalling € 137 million, plus
the premium paid in connection with the early redemption
of bonds (€ 44 million) and the settlement of the interest
rate swaps (€ 57 million).
The increase in the net debt position is partly compensated
by the balance of the free cash flow (€ 47 million) and the
€ 35 million increase in 2012 of the available-for-sale
financial assets. The latter is accounted for under ‘Other’.
Primary segmentation
Network operator Liander
Network company Endinet Other Eliminations Total
€ million 2012 2011 2012 2011 2012 2011 2012 2011 2012 2011
Operating income
External income 1,558 1,433 109 114 105 148 - - 1,772 1,695
Internal income 12 11 - - 313 284 -325 -295 - -
Total operating income 1,570 1,444 109 114 418 432 -325 -295 1,772 1,695
Operating expenses
Total operating expenses 1,178 1,076 87 88 423 428 -325 -295 1,363 1,297
Operating profit 392 368 22 26 -5 4 - - 409 398
Network operator LianderThe network operator Liander segment consists of the
legal entity Liander N.V. which, as designated network
operator within network company Alliander, has a
statutory duty to manage the electricity and gas networks
and related assets in the provinces of Gelderland, parts of
Friesland, Noord-Holland, Zuid-Holland and Flevoland.
Liander connects customers to the electricity and gas
networks, through which it distributes electricity and
gas. External income in 2012 was up by € 125 million
compared with 2011, at € 1,558 million. This increase is
mainly accounted for by the increase in the regulated
tariffs in 2012. Operating expenses increased, by
€ 102 million, mainly owing to higher maintenance
costs and depreciation charges. Operating profit was
€ 24 million higher compared with 2011, at € 392 million.
Segment reportingGeneralAlliander has applied IFRS 8 (Operating segments)
with effect from the 2010 financial year.
Alliander identifies the following segments:
• Network operator Liander;
• Network company Endinet;
• Other activities within the Alliander group.
The figures for each reporting segment, excluding
incidental items and fair value movements, are
shown in the table below. These figures directly
reflect the regular internal reporting. Detailed
information on segment reporting can be found
in the Annual Report 2012.
Network company EndinetThe network company Endinet segment comprises
Endinet Groep B .V., including the network operator
Endinet B.V.. Endinet was acquired by Alliander on
1 July 2010. On 1 January 2011, Liander integrated
the activities of Endinet Haarlemmermeer B.V. into
its existing activities. On the same date, the network
operators Endinet Oost-Brabant N.V. and Endinet Regio
Eindhoven B.V. were merged into Endinet B.V..
The external operating income in 2012 amounted to
€ 109 million, a decrease of € 5 million compared with
2011. This reduction is accounted for by the sale in 2012 of
the public lighting and traffic signal activities to Ziut B.V..
The effect on the external income is € 9 million.
The negative effect is partially compensated by higher
regulated tariffs. Operating expenses came in at
€ 87 million (2011: € 88 million). The operating profit for
2012 was € 22 million (2011: € 26 million). The drop is
due to lower external operating income.
20 Alliander N.V. results 2012 | shareholders and lenders
OtherThe Other segment comprises all the other operating
segments within the Alliander group, including the
activities of Liandon, Stam, Alliander AG, the corporate
departments and the service units. External operating
income in 2012 was down € 43 million compared with
2011, at € 105 million. This decrease was a consequence
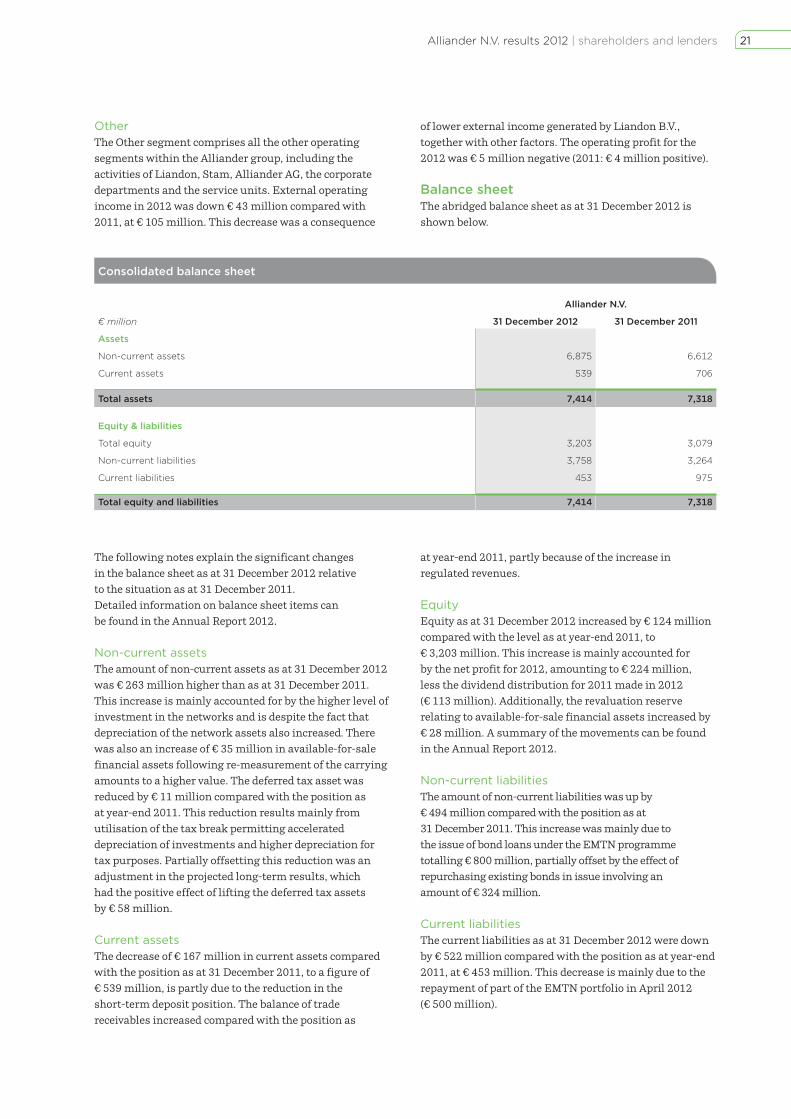
Consolidated balance sheet
Alliander N.V.
€ million 31 December 2012 31 December 2011
Assets
Non-current assets 6,875 6,612
Current assets 539 706
Total assets 7,414 7,318
Equity & liabilities
Total equity 3,203 3,079
Non-current liabilities 3,758 3,264
Current liabilities 453 975
Total equity and liabilities 7,414 7,318
The following notes explain the significant changes
in the balance sheet as at 31 December 2012 relative
to the situation as at 31 December 2011.
Detailed information on balance sheet items can
be found in the Annual Report 2012.
Non-current assetsThe amount of non-current assets as at 31 December 2012
was € 263 million higher than as at 31 December 2011.
This increase is mainly accounted for by the higher level of
investment in the networks and is despite the fact that
depreciation of the network assets also increased. There
was also an increase of € 35 million in available-for-sale
financial assets following re-measurement of the carrying
amounts to a higher value. The deferred tax asset was
reduced by € 11 million compared with the position as
at year-end 2011. This reduction results mainly from
utilisation of the tax break permitting accelerated
depreciation of investments and higher depreciation for
tax purposes. Partially offsetting this reduction was an
adjustment in the projected long-term results, which
had the positive effect of lifting the deferred tax assets
by € 58 million.
Current assetsThe decrease of € 167 million in current assets compared
with the position as at 31 December 2011, to a figure of
€ 539 million, is partly due to the reduction in the
short-term deposit position. The balance of trade
receivables increased compared with the position as
of lower external income generated by Liandon B.V.,
together with other factors. The operating profit for the
2012 was € 5 million negative (2011: € 4 million positive).
Balance sheetThe abridged balance sheet as at 31 December 2012 is
shown below.
at year-end 2011, partly because of the increase in
regulated revenues.
EquityEquity as at 31 December 2012 increased by € 124 million
compared with the level as at year-end 2011, to
€ 3,203 million. This increase is mainly accounted for
by the net profit for 2012, amounting to € 224 million,
less the dividend distribution for 2011 made in 2012
(€ 113 million). Additionally, the revaluation reserve
relating to available-for-sale financial assets increased by
€ 28 million. A summary of the movements can be found
in the Annual Report 2012.
Non-current liabilities The amount of non-current liabilities was up by
€ 494 million compared with the position as at
31 December 2011. This increase was mainly due to
the issue of bond loans under the EMTN programme
totalling € 800 million, partially offset by the effect of
repurchasing existing bonds in issue involving an
amount of € 324 million.
Current liabilitiesThe current liabilities as at 31 December 2012 were down
by € 522 million compared with the position as at year-end
2011, at € 453 million. This decrease is mainly due to the
repayment of part of the EMTN portfolio in April 2012
(€ 500 million).
21Alliander N.V. results 2012 | shareholders and lenders

Events after balance sheet dateNetwork company Alliander will enter into a partnership
with KPN and Entropia Digital in setting up a dedicated
mobile telecommunications network for energy networks.
In connection with this alliance, Alliander acquired the
entire share capital of Utility Connect B.V. from KPN
on 1 February 2013 for an initial purchase price of
€ 7 million. Utility Connect holds a CDMA frequency
licence. Also on 1 February 2013, the entire share capital
of Entropia Assets B.V. was acquired by Alliander from
Entropia Digital B.V. for an amount of € 11 million.
Entropia Assets owns the network of transmission masts.
In the years ahead, Alliander expects to see the expansion
of ‘smart grids’. Such networks incorporate sensors to
allow better remote monitoring and control of energy
flows. Data communications traffic will become more
intensive and more important as a consequence and
wireless telecommunications have an important role to
play in these developments. Alliander’s partnership with
KPN and Entropia Digital is in anticipation of them.
Outlook for 2013InvestmentGross capital expenditure, mainly on replacement and
expansion of the networks but also including energy
transition investment in SASensors, telecommunications
networks and charging points for electric vehicles, will
amount to a total of € 450-500 million. The pace of
development of decentralised generation and feed-in to the
network is taken into account in determining the level of
our medium-term investment. One specific, and major,
investment project that will increase our regular network
investment programme is the phased roll-out of smart
meters. Based on current projections, Alliander will be
investing € 60-100 million a year in smart meters over
the period 2013-2020.
FinancingAlliander’s financial policy aims to preserve financial
strength and flexibility and secure good access to the
capital market at all times by maintaining a solid A rating
profile and by such means as ensuring a balanced
repayment schedule, having a balanced investment plan,
controlling operating costs, having access to committed
credit facilities and maintaining adequate reserves of cash
and cash equivalents.
ResultsGiven that the majority of Alliander’s operations are
regulated and in the light of the current regulation
methodology and the changes in the regulated tariffs in
2013, we expect, barring unforeseen and non-recurring
developments, a higher operating profit in 2013 than
in 2012.
22 Alliander N.V. results 2012 | shareholders and lenders

Consolidated financial statements
Consolidated balance sheet € million 2012 2011
AssetsNon-current assets
Property, plant and equipment 5,821 5,575
Intangible assets 320 320
Investments in associates and joint ventures 28 54
Available-for-sale financial assets 314 279
Derivatives 11 -
Other financial assets 46 38
Deferred tax assets 335 346
6,875 6,612
Current assets
Inventories 36 28
Trade and other receivables 316 277
Derivatives 5 -
Tax assets 7 -
Other financial assets 75 295
Cash and cash equivalents 100 106
539 706
Total assets 7,414 7,318
Equity & liabilitiesEquity
Share capital 684 684
Share premium 671 671
Subordinated perpetual bond 494 494
Hedge reserve -2 -5
Revaluation reserve 28 -
Other reserves 1,104 984
Profit after tax 224 251
Total equity 3,203 3,079
Liabilities
Non-current liabilities
Interest-bearing debt 1,891 1,422
Derivatives 73 120
Finance lease liabilities 131 133
Deferred income 1,530 1,505
Provisions for employee benefits 59 55
Other provisions 74 29
3,758 3,264
Short-term liabilities
Trade and other payables 88 93
Tax liabilities 78 59
Interest-bearing debt 5 509
Derivatives - 49
Provisions for employee benefits 63 58
Accruals 219 207
453 975
Total liabilities 4,211 4,239
Total equity and liabilities 7,414 7,318
23Alliander N.V. results 2012 | consolidated financial statements | consolidated balance sheet
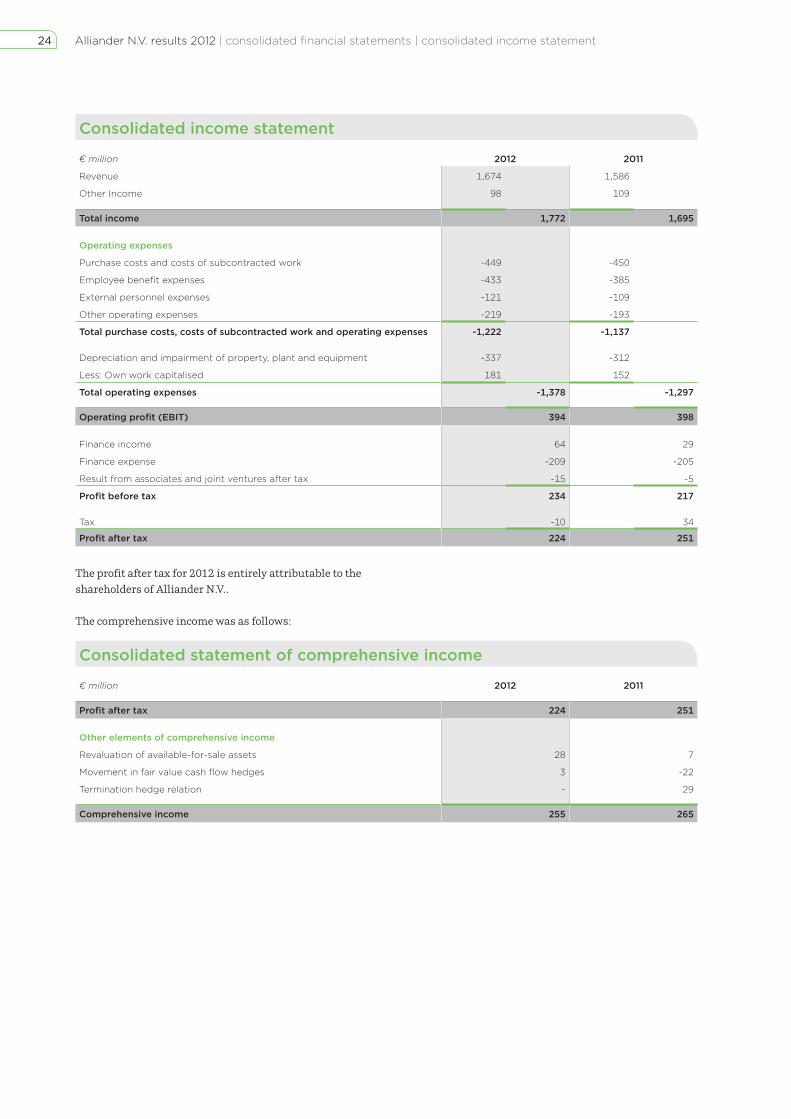
Consolidated income statement
€ million 2012 2011
Revenue 1,674 1,586
Other Income 98 109
Total income 1,772 1,695
Operating expenses
Purchase costs and costs of subcontracted work -449 -450
Employee benefit expenses -433 -385
External personnel expenses -121 -109
Other operating expenses -219 -193
Total purchase costs, costs of subcontracted work and operating expenses -1,222 -1,137
Depreciation and impairment of property, plant and equipment -337 -312
Less: Own work capitalised 181 152
Total operating expenses -1,378 -1,297
Operating profit (EBIT) 394 398
Finance income 64 29
Finance expense -209 -205
Result from associates and joint ventures after tax -15 -5
Profi t before tax 234 217
Tax -10 34
Profit after tax 224 251
The profit after tax for 2012 is entirely attributable to the
shareholders of Alliander N.V..
The comprehensive income was as follows:
Consolidated statement of comprehensive income
€ million 2012 2011
Profit after tax 224 251
Other elements of comprehensive income
Revaluation of available-for-sale assets 28 7
Movement in fair value cash flow hedges 3 -22
Termination hedge relation - 29
Comprehensive income 255 265
24 Alliander N.V. results 2012 | consolidated financial statements | consolidated income statement

Consolidated cash flow statement
€ million 2012 2011 1
Cash fl ow from operating activities
Profi t after tax 224 251
Adjustments for:
- Finance income and expense 145 176
- Tax 10 -34
- Profit after tax from associates and joint ventures 15 5
- Depreciation and impairment less amortisation 278 255
Changes in working capital:
- Inventories -8 -1
- Trade and other receivables -46 2
- Trade and other payables and accruals 31 -73
Total changes in working capital -23 -72
Changes in deferred tax, provisions, derivatives and other -14 72
Cash fl ow from operations 635 653
Net interest paid -100 -119
Net interest received 2 15
Dividends received from associates and joint ventures 15 1
Corporate income tax received (paid) -7 7
Total -90 -96
Cash flow from operating activities 545 557
Cash fl ow from investing activities
Investments in property, plant and equipment -578 -475
Construction contributions received 85 81
Investments in financial assets (associates and joint ventures) -5 -4
Cash flow from investing activities -498 -398
Cash fl ow from fi nancing activitiesRedemption current interest-bearing liabilities and current part of long-term debt -504 -23
Long-term debt issued 798 23
Early redemption long-term debt -329 -259
Premium paid in connection with the early redemption of bonds -44 -30
Settlements interest rate swaps -57 -
Change in current deposits 220 -170
Interest coupon subordinated perpetual bond -24 -15
Dividend paid -113 -80
Cash flow from financing activities -53 -554
Net cash flow -6 -395
Cash and cash equivalents as at 1 January 106 501
Net cash flow -6 -395
Cash and cash equivalents as at 31 December 100 106
1 The figures for 2011 have been restated in connection with a change in presentation to include the premium paid in connection with the early redemption of bonds in the cash flow from financing activities.
25Alliander N.V. results 2012 | consolidated financial statements | consolidated income statement

Consolidated statement of changes in equity
Equity attributable to shareholders and other providers of equity
€ millionShare capital
Share premium
Subor-dinated
perpetual bond
Hedge reserve
Reva-luation reserve
Other reserves
Profit for the year Total
Equity as at 1 January 2011 684 671 494 -12 -7 854 222 2,906
Movement in fair value cash flow hedges - - - -22 - - - -22
Revaluation of available-for-sale financial assets - - - - 7 - - 7
Termination hedge relation - - - 29 - - - 29
Profit after tax for 2011 - - - - - - 251 251
Comprehensive income for 2011 - - - 7 7 - 251 265
Interest coupon subordinated perpetual bond after tax - - - - - -12 - -12
Dividend for 2010 - - - - - - -80 -80
Profit appropriation for 2010 - - - - - 142 -142 -
Equity as at 31 December 2011 684 671 494 -5 - 984 251 3,079
Movement in fair value cash flow hedges - - - 3 - - - 3
Revaluation of available-for-sale financial assets - - - - 28 - - 28
Profit after tax for 2012 - - - - - - 224 224
Comprehensive income for 2012 - - - 3 28 - 224 255
Interest coupon subordinated perpetual bond after tax - - - - - -18 - -18
Dividend for 2011 - - - - - - -113 -113
Profit appropriation for 2011 - - - - - 138 -138 -
Equity as at 31 December 2012 684 671 494 -2 28 1,104 224 3,203
The termination of the hedge relationship relates to a
derivative instrument contracted in 2010 to hedge future
interest rate risks on part of our EMTN programme.
As at year-end 2011, the hedge relationship was
discontinued, meaning that the hedge accounting ceases
to apply. As at year-end 2011, the hedge reserve less
deferred tax (€ 10 million) amounted to € 29 million
negative. The gross amount of € 39 million was charged
to the income statement as at 31 December 2011.
26 Alliander N.V. results 2012 | consolidated financial statements | consolidated statement of changes in equity

February 2013
Alliander N.V.
Visiting address: Utrechtseweg 68, 6812 AH Arnhem, Netherlands P.O. Box:P.O. Box 50, 6920 AB Duiven, Netherlands [email protected] www.alliander.com
Published by © Alliander N.V.