SBM OFFSHORE N.V. ANNUAL RESULTS 2011...SBM Offshore N.V. today publishes its full-year financial...
23
Transcript of SBM OFFSHORE N.V. ANNUAL RESULTS 2011...SBM Offshore N.V. today publishes its full-year financial...


SBM OFFSHORE N.V. ANNUAL RESULTS 2011
SBM OFFSHORE N.V. Press Release | 2 March 2012 | Page 2 of 23
SBM OFFSHORE ANNUAL RESULTS 2011
SBM Offshore N.V. today publishes its full-year financial results for the year ended 31 December 2011.
• Turnover of US$ 3,157 million (US$ 3,056 million in 2010) • EBITDA of US$ 813.2 million (US$ 712.4 million in 2010) • Net loss of US$ 440.6 million (US$ 276.0 million profit in 2010), after impairments and deferrals of US$ 978
million • New order intake totalling US$ 8,552 million (US$ 4,532 million in 2010) • Strongest order portfolio on record of US$ 16,910 million (US$ 11,502 million in 2010) • Net debt US$ 1,958 million (US$ 2,292 million end of Q3 of 2011, US$ 1,711 million in 2010) • Loss per share of US$ 2.77 (EPS of US$ 1.44 in 2010) • No dividend to be distributed for 2011
Total impairments and deferrals comprise:
• previously announced charge of US$ 450 million on the Yme and Deep Panuke MOPU platforms • additional charge of US$ 407 million on the Yme and Deep Panuke MOPU platforms • charges of US$ 38 million associated with revised strategic focus on core FPSO products • charge of US$ 19 million in respect of ThunderHawk platform due to revised assumption of future revenues • book loss of US$ 8 million, following the sale of two tankers from inventory • deferral of US$ 57 million due to revised margin recognition following changes in accounting estimates
Operational Highlights
• Delivery and start of production on both FPSO Okha and FPSO Aseng • Final Semi-Submersible drilling rig delivered in Q3 to Delba • LOI for new 20-year lease contract for FPSO Cidade de Ilhabela in Brazil on Guará Norte field • Contract with ENI for the relocation of FPSO Xikomba under a 12 year lease on block 15/06 in Angola
Outlook and guidance 2012
• Turnover in the region of US$ 4 billion • Turnkey Systems EBIT margin close to 10%, including margin deferral effect • Turnkey Services EBIT margin in the 15%-20% range • Underlying Lease and Operate EBIT margin in-line with 2011 level
Bruno Chabas, CEO of SBM Offshore commented:
“SBM Offshore’s 2011 results have been severely impacted by the legacy projects Yme and Deep Panuke, and the further provision announced today is an unwelcome setback. Resolution of the Yme difficulties is an absolute priority and we are in constructive discussions with both clients on the best way forward.
SBM Offshore must change in several vital respects. Our organisation is reshaped with a new senior management structure to ensure absolute transparency and accountability and an overhaul of our tendering processes. At the same time, new financial risk management measures are being adopted, the better to address the scale and complexity of modern offshore projects. The Company now has an exclusive focus on FPSOs, the product at which we excel, and the record order book reflects this realignment on our core competence in the offshore market.
Despite our challenges, there are grounds for encouragement. I am excited and confident about the portfolio of projects SBM Offshore is undertaking, with the more recent projects on schedule and performing in line with, or above, expectations. Looking ahead we see buoyant market conditions in offshore oil and gas and excellent opportunities for SBM Offshore to continue to lead the industry in developing the FPSO market.”

SBM OFFSHORE N.V. ANNUAL RESULTS 2011
SBM OFFSHORE N.V. Press Release | 2 March 2012 | Page 3 of 23
Key figures
US$ million2011 2010
Turnover 3,157 3,056
EBITDA 813.2 712.4*
EBIT -340.6 386.5*
Net Profit -440.6 276.0
EBIT margin -10.8% 12.6%
Investments in fixed assets 841 519
*) Restated for reclassification of withholding taxes from cost of sales to income tax.
1 Financial Review
The consolidated result for 2011 is a net loss of US$ 440.6 million, which includes non-recurring items and significant impairment charges of US$ 921 million. This compares to a 2010 net profit of US$ 276.0 million. The loss per share amounted to US$ 2.77 (earnings per share of US$ 1.44 in 2010).
New orders in the year totalled US$ 8,552 million (split 37% / 59% / 4% between Lease and Operate, Turnkey Systems and Turnkey Services respectively), compared to US$ 4,532 million of new orders in 2010.
Turnover increased by 3.3% to US$ 3,157 million, in comparison with US$ 3,056 million in 2010, mainly as a result of higher Lease and Operate revenues. Segmental split of turnover was for Turnkey Systems 63%, Lease and Operate 27% and Turnkey Services 10% (in 2010: 65%, 26% and 9% respectively).
Total order portfolio at the end of the year was US$ 16,910 million compared to US$ 11,502 million at the end of 2010, an increase of 47% and a new record by far. Of this, 67% or US$ 11,310 million relates to the non-discounted value of the revenues from the Company’s long-term lease contracts in portfolio at year-end.
EBITDA amounted to US$ 813.2 million, a 14.1% increase compared to US$ 712.4 million in 2010 (restated), reflecting the good performance of the more recent projects.
Operating result (EBIT) decreased to a loss of US$ 340.6 million due to the impairment charges mentioned above, compared with a US$ 386.5 million (restated) profit in 2010. Segmental EBIT margins were for the Turnkey Systems segment 12.1% (9.4% in 2010) and 21.5% for the Turnkey Services segment (20.8% in 2010). The EBIT margin for the Lease and Operate segment before Yme and Deep Panuke impairments was 27.6%.
The year was marked by a mixed set of financial events:
• Impairments of US$ 914 million comprising: » Impairment charges totalling US$ 857 million on the Yme MOPUstor™ and Deep Panuke platforms under
construction for the Lease and Operate segment. The charges take into account projected cost escalation and revised assumptions concerning recoveries from on-going legal actions. Due to the current status of these commercial disputes the charges can not be individually disclosed without seriously prejudicing the Company’s position
» Impairment charges of US$ 38 million in respect of revised strategic focus on core products and consequent write-off of prepayments and development costs incurred in prior years
» Impairment charge of US$ 19 million in respect of ThunderHawk platform, due to revised assumptions concerning future production related revenues
• Loss of US$ 8 million, following the sale of two vessels from the Company’s tanker inventory • Deferral of US$ 57 million of gross margin from 2011 to future years due to revised margin recognition
following changes in accounting estimates on large, complex projects. This measure is impacting the Turnkey Systems segment and is taken into account in the EBIT margin of 12.1%.

SBM OFFSHORE N.V. ANNUAL RESULTS 2011
SBM OFFSHORE N.V. Press Release | 2 March 2012 | Page 4 of 23
• Record new order intake including a Letter of Intent for one major new order in the first half of 2011 (FPSO Cidade de Ilhabela finance lease), as well as a contract in December for the FPSO Xikomba relocation project (also a finance lease)
• Improved margins on Turnkey Systems and Turnkey Services activities
Net debt at 31 December 2011 amounted to US$ 1,958.5 million, lower than the level at 30 September 2011 (US$ 2,292 million), with net liquidities of US$ 165 million and undrawn committed long-term bank facilities totalling US$ 916 million. Net debt to unadjusted EBITDA on a rolling 12 month basis at 31 December 2011 amounted to 2.41 compared with 2.91 at the end of June 2011. All other relevant banking covenants are met.
Mark-to-market revaluation of the Company’s hedge portfolio led to a negative impact directly in equity in 2011 of US$ 270 million. Shareholders’ equity decreased by 38% as a result of the net loss for the year and the negative impact of the hedge portfolio re-evaluation. At close, net gearing stood at 145% (81% at 2010 year-end) within the Company’s established range. Excluding the negative value of the mark to market valuation of the hedge portfolio, net gearing stood at 117%.
In the second half of 2011 a loan facility of US$ 1.0 billion for FPSO Cidade de Paraty has been completed.
Capital expenditure for 2011 amounted to US$ 840 million, which is higher than in 2010 (US$ 519 million), excluding investments in leases which are accounted for as finance leases and accordingly are reported as construction contracts rather than under property, plant and equipment.
More financial information is provided in the detailed financial analysis to be found in the Appendix.
2 Strategy and Organisation
In the years ahead, SBM Offshore will focus on its core products, which have traditionally yielded good margins: the lease or sale of converted tanker FPSOs and associated products and services. The current market outlook supports this focus and should enable the Company to grow in line with the expected expansion of the FPSO market.
As part of the focus on core FPSO products and good margins, the Company is looking actively to pursue contract structures with a favourable risk/reward profile for the Company.
In FLNG production, for large units the Company has decided to focus on edge technologies developed for turrets and offloading systems. For medium-sized FLNG units, the Company will maintain its focus on designing, constructing and operating of the complete FPSO.
The Company strives to make improvements in project management and tendering to ensure optimal execution and delivery. The Company is facing increasingly complex projects, which require an organizational structure that ensures clear accountability, and allocation of responsibility.
The Company is therefore in the process of implementing a new organizational structure based on execution centres, headed by Managing Directors. Seven execution centres have been identified, each with a dedicated portfolio of projects. Control is allocated at operating level with clear and unambiguous lines of responsibility and accountability.
In addition a number of changes in the Board of Management have taken place. Further to the previously announced appointment of Bruno Chabas as CEO, the Company has appointed Jean-Philippe Laurès as COO.
3 Financial risk management
The Company recognises that the increasing complexity of modern projects requires a revised approach to margin recognition. Complex projects will be submitted to gate reviews before margins can be recognised. These gate reviews will occur at an advanced degree of completion in engineering with overall project progress at typically around 25%. Until this point, no margin will be recognised. The above applies only for those projects presenting a high risk profile, because of technical novelty, complexity or pricing arrangement agreed with the respective client.

SBM OFFSHORE N.V. ANNUAL RESULTS 2011
SBM OFFSHORE N.V. Press Release | 2 March 2012 | Page 5 of 23
This change will not affect the Company’s cashflow, nor the total margin at completion, but will alter the timing of margin recognition. Four current projects in the Company’s portfolio are affected by this change. For 2011, approximately US$ 57 million of margin has been deferred. For 2012, a deferral of approximately US$ 100 million of margin is estimated.
4 Order Portfolio Development
4.1 Lease and Operate
Contract Wins:
• A Letter of Intent (LOI) from Petrobras for a twenty year charter and operation of the FPSO Cidade de Ilhabela for the Guará Norte development in the pre-salt area offshore Brazil
• A contract with ENI Angola for the relocation of FPSO Xikomba under a twelve year lease and operate contract for an oil field development on block 15/06 offshore Angola
Amendments to existing contracts:
• The lease and operate contract for LPG FSO Nkossa II extended until November 2018 with options for three further one-year extensions
• The lease and operate contract for FPSO Kuito extended until 31 May 2012 with subsequent extensions expected
• Petrobras extended the lease and operate contract for FPSO Marlim Sul until June 2014 • Lease and operations on FPSO Xikomba were extended by ExxonMobil until July 2011. Since then the unit
has been disconnected and sailed to Singapore where it is currently undergoing a substantial upgrade at Keppel Shipyard to meet production requirements for the ENI Angola contract mentioned above.
• The operations only contract with MEGI for FPSO Serpentina extended until August 2013, including options for three further one-year extensions
• Termination of the FSO Unity operations only contract with Total in Nigeria at the end of September 2011
4.2 Turnkey Systems and Turnkey Services
Contract Wins:
• A contract with Shell for the supply of a turret mooring system for the FLNG development for the Prelude field, offshore Australia
• A contract with BP for the supply of a turret mooring system for the QUAD 204 FPSO • A contract with OSX for the supply of the FPSO OSX-2 for Brazil.
Since year–end 2011:
• A contract with Inpex for the supply of a turret mooring system for the FPSO for the LNG development Ichthys in Australia.
5 Operations
Yme and Deep Panuke
At the end of the first half, the Company installed the Yme and Deep Panuke platforms at their respective offshore locations in Norway and Canada. Commissioning activities were commenced, together with the completion of outstanding construction works offshore to ready the facilities for start of production.
On both projects, the Company had incurred additional costs due to re-assessment of works on-site, leading to modifications to be completed both inshore and offshore. These additional costs, and clarifications of the client’s contractual position on Yme, led the Company to recognize an additional exposure and book impairment charges totalling US$ 450 million in the first half of 2011.

SBM OFFSHORE N.V. ANNUAL RESULTS 2011
SBM OFFSHORE N.V. Press Release | 2 March 2012 | Page 6 of 23
Over the winter period, offshore progress on Yme and commissioning of the platform for start-up was significantly slower than anticipated. Productivity levels were affected by bad weather conditions, among other reasons, and an increase in work scope offshore.
The Company is taking action to improve productivity offshore and to reach common agreement with our client, Talisman, on the optimal path to completion of the platform and first production. We are in constructive dialogue with Talisman, and the requisite resources are being brought to bear. However, a reassessment of the work volumes offshore, productivity levels, and potential recovery from ongoing arbitration proceedings, has led the Company to conclude that substantial additional cost and time will be required to complete the project.
The Deep Panuke platform delivery has also been delayed due to low productivity and additional work on certain systems, requiring further cost provisions. At year-end 2011, no potential recovery from the on-going court case has been recognized, due to the likely long duration of the proceedings. On timing, the Company anticipates first gas production at Deep Panuke in the summer of 2012.
A total additional impairment charge of US$ 407 million related to the Yme MOPUstor™ and Deep Panuke platforms has been booked under the Lease and Operate segment in the second half of the year. The first Yme arbitration case has been concluded in favour of the client; further legal proceedings on both projects continue.
Lease and Operate
All units in operation are performing in line with or ahead of expectations and contributed positively to the Company’s 2011 results. Six production facilities out of the total 19 lease contracts are under construction and at different stages of completion. Construction of these units, except the two MOPUs, is progressing well.
FPSO Aseng
FPSO Aseng started first oil production for Noble Energy on 6 November 2011 in the Aseng field, offshore Equatorial Guinea two months ahead of schedule. The lease and operate contract is for a period of fifteen years, with provisions for further extensions up to five years. SBM Offshore owns a 60% share of the joint venture owning and operating the FPSO.
Turnkey Systems
FPSO Okha
The Company was contracted by Woodside in 2008 to supply a disconnectable FPSO to replace the existing Cossack Pioneer FPSO for the Cossack Wanaea Lambert Hermes (CWLH) redevelopment project. In August, the FPSO Okha was hooked up to the mooring system and first oil production offshore Australia was achieved on 25 September.
Drilling Rig no. 3
The Semi-Submersible drilling rig “Delba III” was handed over to our client Delba, offshore Abu Dhabi on 30 September 2011. This rig is the last of three Semi-Submersible drilling rigs, which the Company had contracted to supply to Brazilian clients.
Turnkey Services
Following a slow start, the Company’s two installation vessels have achieved the expected utilisation rates during the year. In addition, healthy activity levels for other services and products were achieved with good margins.
The Company awarded a contract for the detailed design and construction of a multi-purpose Diving Support & Construction Vessel (DSCV). Delivery is scheduled for the second quarter of 2013. The vessel will be fully owned and operated by SBM Offshore.
SBM OFFSHORE N.V. ANNUAL RESULTS 2011
SBM OFFSHORE N.V. Press Release | 2 March 2012 | Page 7 of 23
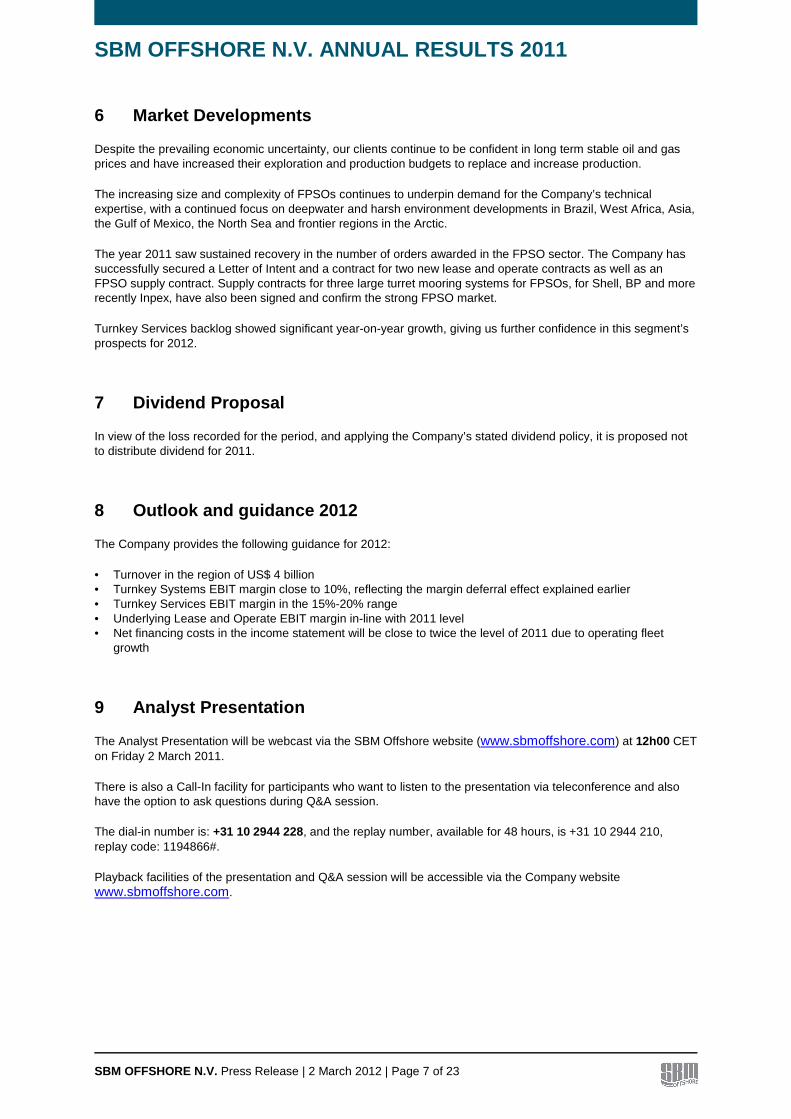
6 Market Developments
Despite the prevailing economic uncertainty, our clients continue to be confident in long term stable oil and gas prices and have increased their exploration and production budgets to replace and increase production.
The increasing size and complexity of FPSOs continues to underpin demand for the Company’s technical expertise, with a continued focus on deepwater and harsh environment developments in Brazil, West Africa, Asia, the Gulf of Mexico, the North Sea and frontier regions in the Arctic.
The year 2011 saw sustained recovery in the number of orders awarded in the FPSO sector. The Company has successfully secured a Letter of Intent and a contract for two new lease and operate contracts as well as an FPSO supply contract. Supply contracts for three large turret mooring systems for FPSOs, for Shell, BP and more recently Inpex, have also been signed and confirm the strong FPSO market.
Turnkey Services backlog showed significant year-on-year growth, giving us further confidence in this segment’s prospects for 2012.
7 Dividend Proposal
In view of the loss recorded for the period, and applying the Company’s stated dividend policy, it is proposed not to distribute dividend for 2011.
8 Outlook and guidance 2012
The Company provides the following guidance for 2012:
• Turnover in the region of US$ 4 billion • Turnkey Systems EBIT margin close to 10%, reflecting the margin deferral effect explained earlier • Turnkey Services EBIT margin in the 15%-20% range • Underlying Lease and Operate EBIT margin in-line with 2011 level • Net financing costs in the income statement will be close to twice the level of 2011 due to operating fleet
growth
9 Analyst Presentation
The Analyst Presentation will be webcast via the SBM Offshore website (www.sbmoffshore.com) at 12h00 CET on Friday 2 March 2011.
There is also a Call-In facility for participants who want to listen to the presentation via teleconference and also have the option to ask questions during Q&A session.
The dial-in number is: +31 10 2944 228, and the replay number, available for 48 hours, is +31 10 2944 210, replay code: 1194866#.
Playback facilities of the presentation and Q&A session will be accessible via the Company website www.sbmoffshore.com.

SBM OFFSHORE N.V. ANNUAL RESULTS 2011
SBM OFFSHORE N.V. Press Release | 2 March 2012 | Page 8 of 23
10 Financial Agenda
Date Year
Publication Annual Report and Agenda Annual General Meeting of Shareholders
28 March 2012
Trading Update Q1 2012 - Press Release (07.30 CET) 16 May 2012
Annual General Meeting of Shareholders (Rotterdam) 16 May 2012
Half-year Results 2012 - Press Release (07.30 CET) 16 August 2012
Half-year Results 2012 - Analysts Presentation (Amsterdam) 16 August 2012
Trading Update Q3 2012 - Press Release (07.30 CET) 15 November 2012
11 Corporate Profile
Dutch limited liability company SBM Offshore N.V. is the holding company of a group of international, offshore energy production orientated companies. Its business is to provide floating production solutions to the offshore energy industry, over the full product life-cycle. The Company is market leading in leased floating production systems with multiple units currently in operation, and has an unrivalled experience in this field.
The Company’s main activity is the design, supply, installation and operation of Floating Production, Storage and Offloading (FPSO) vessels. These are either owned and operated by the Company and leased to our clients or supplied to clients on a turnkey sale basis.
The Company has built over several years a large in-house engineering, procurement and project management capability, to ensure consistency from project to project, and so enable a continuous improvement process for enhancement of product quality.
Headquartered in Schiedam, the Company employs over 6,200 people worldwide, who spread over five main execution centres, eight operational shore bases, several construction yards and the offshore fleet of vessels.
The Board of Management Schiedam, 2 March 2012

SBM OFFSHORE N.V. ANNUAL RESULTS 2011
SBM OFFSHORE N.V. Press Release | 2 March 2012 | Page 9 of 23
For further information:
SBM Offshore N.V. Karel Doormanweg 66 3115 JD Schiedam
Post address:
P.O. Box 31 3100 AA Schiedam The Netherlands
Contact person: Mr. Sebastiaan de Ronde Bresser
Telephone: (+377) 92 05 85 15 Mobile: (+33) 643 919 312 Fax: (+377) 92 05 89 40 E-mail: [email protected] Website: www.sbmoffshore.com
Disclaimer
Some of the statements contained in this release that are not historical facts are statements of future expectations and other forward-looking statements based on management’s current views and assumptions and involve known and unknown risks and uncertainties that could cause actual results, performance, or events to differ materially from those in such statements. Such forward-looking statements are subject to various risks and uncertainties, which may cause actual results and performance of the Company’s business to differ materially and adversely from the forward-looking statements. Certain such forward-looking statements can be identified by the use of forward-looking terminology such as “believes”, “may”, “will”, “should”, “would be”, “expects” or “anticipates” or similar expressions, or the negative thereof, or other variations thereof, or comparable terminology, or by discussions of strategy, plans, or intentions. Should one or more of these risks or uncertainties materialise, or should underlying assumptions prove incorrect, actual results may vary materially from those described in this release as anticipated, believed, or expected. SBM Offshore NV does not intend, and does not assume any obligation, to update any industry information or forward-looking statements set forth in this release to reflect subsequent events or circumstances.
Appendix: Detailed Financial Information
SBM OFFSHORE N.V. Press Release | 2 March 2012 | Page 10 of 23
1 Financial Review
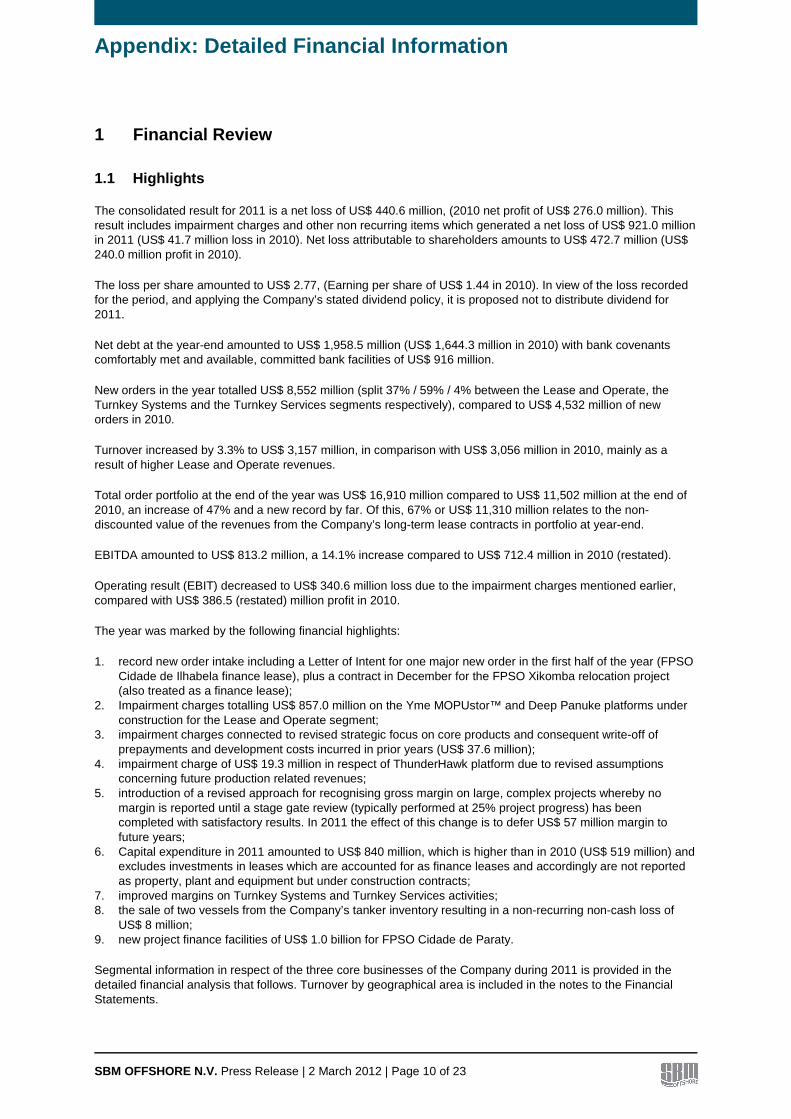
1.1 Highlights
The consolidated result for 2011 is a net loss of US$ 440.6 million, (2010 net profit of US$ 276.0 million). This result includes impairment charges and other non recurring items which generated a net loss of US$ 921.0 million in 2011 (US$ 41.7 million loss in 2010). Net loss attributable to shareholders amounts to US$ 472.7 million (US$ 240.0 million profit in 2010).
The loss per share amounted to US$ 2.77, (Earning per share of US$ 1.44 in 2010). In view of the loss recorded for the period, and applying the Company’s stated dividend policy, it is proposed not to distribute dividend for 2011.
Net debt at the year-end amounted to US$ 1,958.5 million (US$ 1,644.3 million in 2010) with bank covenants comfortably met and available, committed bank facilities of US$ 916 million.
New orders in the year totalled US$ 8,552 million (split 37% / 59% / 4% between the Lease and Operate, the Turnkey Systems and the Turnkey Services segments respectively), compared to US$ 4,532 million of new orders in 2010.
Turnover increased by 3.3% to US$ 3,157 million, in comparison with US$ 3,056 million in 2010, mainly as a result of higher Lease and Operate revenues.
Total order portfolio at the end of the year was US$ 16,910 million compared to US$ 11,502 million at the end of 2010, an increase of 47% and a new record by far. Of this, 67% or US$ 11,310 million relates to the non-discounted value of the revenues from the Company’s long-term lease contracts in portfolio at year-end.
EBITDA amounted to US$ 813.2 million, a 14.1% increase compared to US$ 712.4 million in 2010 (restated).
Operating result (EBIT) decreased to US$ 340.6 million loss due to the impairment charges mentioned earlier, compared with US$ 386.5 (restated) million profit in 2010.
The year was marked by the following financial highlights:
1. record new order intake including a Letter of Intent for one major new order in the first half of the year (FPSO Cidade de Ilhabela finance lease), plus a contract in December for the FPSO Xikomba relocation project (also treated as a finance lease);
2. Impairment charges totalling US$ 857.0 million on the Yme MOPUstor™ and Deep Panuke platforms under construction for the Lease and Operate segment;
3. impairment charges connected to revised strategic focus on core products and consequent write-off of prepayments and development costs incurred in prior years (US$ 37.6 million);
4. impairment charge of US$ 19.3 million in respect of ThunderHawk platform due to revised assumptions concerning future production related revenues;
5. introduction of a revised approach for recognising gross margin on large, complex projects whereby no margin is reported until a stage gate review (typically performed at 25% project progress) has been completed with satisfactory results. In 2011 the effect of this change is to defer US$ 57 million margin to future years;
6. Capital expenditure in 2011 amounted to US$ 840 million, which is higher than in 2010 (US$ 519 million) and excludes investments in leases which are accounted for as finance leases and accordingly are not reported as property, plant and equipment but under construction contracts;
7. improved margins on Turnkey Systems and Turnkey Services activities; 8. the sale of two vessels from the Company’s tanker inventory resulting in a non-recurring non-cash loss of
US$ 8 million; 9. new project finance facilities of US$ 1.0 billion for FPSO Cidade de Paraty.
Segmental information in respect of the three core businesses of the Company during 2011 is provided in the detailed financial analysis that follows. Turnover by geographical area is included in the notes to the Financial Statements.

Appendix: Detailed Financial Information
SBM OFFSHORE N.V. Press Release | 2 March 2012 | Page 11 of 23
1.2 New Orders
Total new booked orders for 2011 amounted to US$ 8,552 million. This total includes US$ 3.5 billion for a 20-year lease contract for the FPSO Cidade de Ilhabela for Petrobras and US$ 1.6 billion for a 12-year lease contract for the FPSO Xikomba for ENI. Due to the specific structures and terms these contracts are accounted for as finance leases and are therefore reported partly as Turnkey Systems sales (US$ 2.8 billion) and partly within Lease & Operate (US$ 2.3 billion).
1.3 Turnover
Total turnover rose marginally when compared with 2010 due to higher revenues recognised in the Lease and Operate and Turnkey Services segments. Turnkey Systems third party turnover of US$ 1,988 million represents 63% of total 2011 turnover (2010: US$ 1,984 million representing 65%). Lease and Operate turnover rose by 8% to US$ 867 million (27% of total revenues; 26% in 2010) as the first year of revenues from FPSO P-57 operations and demobilisation revenues on FPSO Espadarte more than compensated for the reduction in day-rate income resulting from the termination of the charter of FPSO Xikomba (July 2011) and of the FSO Unity operations (September 2011). Turnkey Services third party turnover increased by 11% to US$ 302 million and represents 10% of total revenues (9% in 2010).
The contract for the FPSO Aseng for Noble Energy is accounted for as a finance lease, fully consolidated in the financial statements, with elimination of the GEPetrol 40% share as minority interest. This means that the entire fair value of the asset is recognised as Turnkey Systems turnover during construction, with the return on investment recognised as lease income during the lease period. The project was completed in November 2011, signifying the beginning of the fifteen-year charter.
The contract for the FPSO Cidade de Ilhabela is accounted for as a finance lease in the same manner as the FPSO Cidade de Paraty. The joint venture is jointly controlled by SBM Offshore, and our 62.25% share of the JV is consolidated proportionately. Thus turnover recognised is equal to our partners’ 37.75% share of the EPCI “sales” price of the FPSO from SBM Offshore to the JV (i.e. eliminating the inter-company portion of the sale), plus the Company’s share of the fair value of the lease. As at 31 December 2011 the charter contracts with Petrobras had not been finalised, but are expected to be completed in the first quarter of 2012. Based upon the signed LOI from Petrobras, the Company has accounted for the project revenue in accordance with the stage of completion at the year-end.
For the FPSO Cidade de Paraty (SBM share 50.5%) construction continued throughout 2011. In July 2011 the charter contracts with Petrobras were concluded and a US$ 1 billion project loan arranged with a syndicate of banks. Drawdowns totalling US$ 284 million (SBM share) were made during the second half of 2011.
The twelve-year lease contract with ENI for FPSO Xikomba is also accounted for as a finance lease. Turnover during construction is equal to our partner Sonangol’s 50% share of the investment plus the Company’s 50% share of the fair value of the lease, all on a percentage of completion basis.

Appendix: Detailed Financial Information
SBM OFFSHORE N.V. Press Release | 2 March 2012 | Page 12 of 23
In 2011, total Turnkey Systems turnover recognised in respect of construction of assets accounted for as finance leases amounted to US$ 1.159 million (2010: US$ 681 million).
The ongoing charter contracts for FPSOs Mondo and Saxi Batuque are similarly accounted for as finance leases. Return on investment recognised in the Lease & Operate turnover in 2011 in respect of these contracts and the first two months of the FPSO Aseng charter amounted to US$ 20 million (2010: US$ 16 million).
1.4 Order Portfolio
The year-end order portfolio at US$ 16.91 billion is up 47.0% from last year’s level of US$ 11.50 billion. The current order portfolio includes US$ 11.31 billion (2010: US$ 9.00 billion) for the non-discounted value of future revenues from the long-term charters of the lease fleet, of which US$ 4.5 billion (2010: US$ 4.7 billion) represents the bareboat element of the operating leases. Approximately 57% of the future bareboat revenues will be generated from the lease contracts which have yet to commence (FPSO Baleia Azul, MOPUstor™ Yme and MOPU Deep Panuke). The Turnkey Systems order portfolio more than doubled (US$ 2.30 billion in 2010) to US$ 5.33 billion, boosted by the finance lease treatment of the two new lease contracts, one turnkey sale FPSO and two large turret mooring systems, and represents approximately two years of turnover. Turnkey Services backlog increased by 38.1% to US$ 0.27 billion (approximately nine months of turnover).
Appendix: Detailed Financial Information
SBM OFFSHORE N.V. Press Release | 2 March 2012 | Page 13 of 23
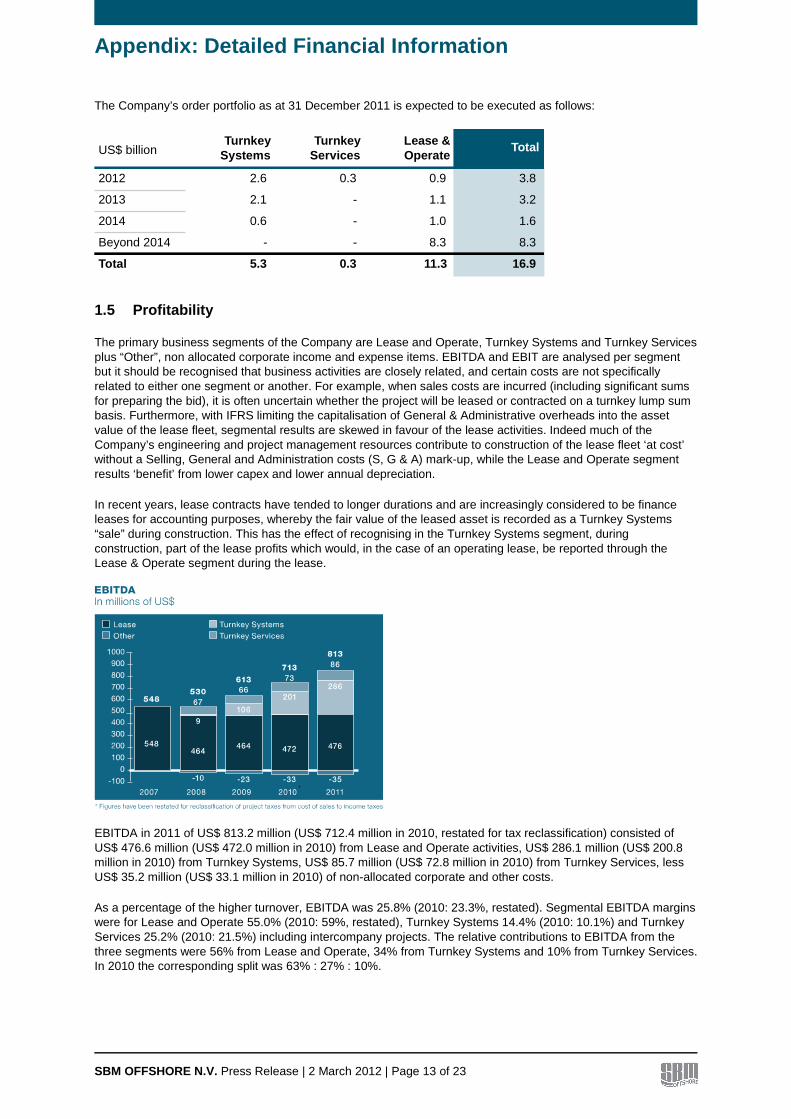
The Company’s order portfolio as at 31 December 2011 is expected to be executed as follows:
US$ billionTurnkey
SystemsTurnkey
ServicesLease & Operate
Total
2012 2.6 0.3 0.9 3.8
2013 2.1 - 1.1 3.2
2014 0.6 - 1.0 1.6
Beyond 2014 - - 8.3 8.3
Total 5.3 0.3 11.3 16.9
1.5 Profitability
The primary business segments of the Company are Lease and Operate, Turnkey Systems and Turnkey Services plus “Other”, non allocated corporate income and expense items. EBITDA and EBIT are analysed per segment but it should be recognised that business activities are closely related, and certain costs are not specifically related to either one segment or another. For example, when sales costs are incurred (including significant sums for preparing the bid), it is often uncertain whether the project will be leased or contracted on a turnkey lump sum basis. Furthermore, with IFRS limiting the capitalisation of General & Administrative overheads into the asset value of the lease fleet, segmental results are skewed in favour of the lease activities. Indeed much of the Company’s engineering and project management resources contribute to construction of the lease fleet ‘at cost’ without a Selling, General and Administration costs (S, G & A) mark-up, while the Lease and Operate segment results ‘benefit’ from lower capex and lower annual depreciation.
In recent years, lease contracts have tended to longer durations and are increasingly considered to be finance leases for accounting purposes, whereby the fair value of the leased asset is recorded as a Turnkey Systems “sale” during construction. This has the effect of recognising in the Turnkey Systems segment, during construction, part of the lease profits which would, in the case of an operating lease, be reported through the Lease & Operate segment during the lease.
EBITDA in 2011 of US$ 813.2 million (US$ 712.4 million in 2010, restated for tax reclassification) consisted of US$ 476.6 million (US$ 472.0 million in 2010) from Lease and Operate activities, US$ 286.1 million (US$ 200.8 million in 2010) from Turnkey Systems, US$ 85.7 million (US$ 72.8 million in 2010) from Turnkey Services, less US$ 35.2 million (US$ 33.1 million in 2010) of non-allocated corporate and other costs.
As a percentage of the higher turnover, EBITDA was 25.8% (2010: 23.3%, restated). Segmental EBITDA margins were for Lease and Operate 55.0% (2010: 59%, restated), Turnkey Systems 14.4% (2010: 10.1%) and Turnkey Services 25.2% (2010: 21.5%) including intercompany projects. The relative contributions to EBITDA from the three segments were 56% from Lease and Operate, 34% from Turnkey Systems and 10% from Turnkey Services. In 2010 the corresponding split was 63% : 27% : 10%.
Appendix: Detailed Financial Information
SBM OFFSHORE N.V. Press Release | 2 March 2012 | Page 14 of 23
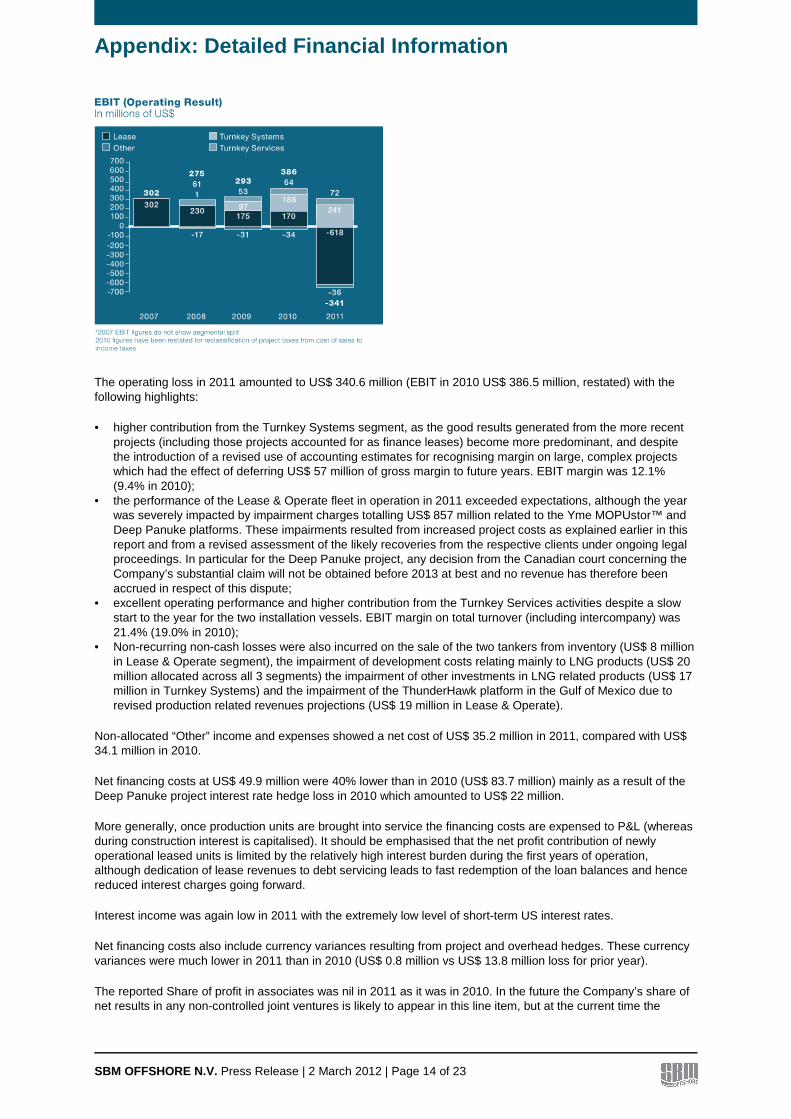
The operating loss in 2011 amounted to US$ 340.6 million (EBIT in 2010 US$ 386.5 million, restated) with the following highlights:
• higher contribution from the Turnkey Systems segment, as the good results generated from the more recent projects (including those projects accounted for as finance leases) become more predominant, and despite the introduction of a revised use of accounting estimates for recognising margin on large, complex projects which had the effect of deferring US$ 57 million of gross margin to future years. EBIT margin was 12.1% (9.4% in 2010);
• the performance of the Lease & Operate fleet in operation in 2011 exceeded expectations, although the year was severely impacted by impairment charges totalling US$ 857 million related to the Yme MOPUstor™ and Deep Panuke platforms. These impairments resulted from increased project costs as explained earlier in this report and from a revised assessment of the likely recoveries from the respective clients under ongoing legal proceedings. In particular for the Deep Panuke project, any decision from the Canadian court concerning the Company’s substantial claim will not be obtained before 2013 at best and no revenue has therefore been accrued in respect of this dispute;
• excellent operating performance and higher contribution from the Turnkey Services activities despite a slow start to the year for the two installation vessels. EBIT margin on total turnover (including intercompany) was 21.4% (19.0% in 2010);
• Non-recurring non-cash losses were also incurred on the sale of the two tankers from inventory (US$ 8 million in Lease & Operate segment), the impairment of development costs relating mainly to LNG products (US$ 20 million allocated across all 3 segments) the impairment of other investments in LNG related products (US$ 17 million in Turnkey Systems) and the impairment of the ThunderHawk platform in the Gulf of Mexico due to revised production related revenues projections (US$ 19 million in Lease & Operate).
Non-allocated “Other” income and expenses showed a net cost of US$ 35.2 million in 2011, compared with US$ 34.1 million in 2010.
Net financing costs at US$ 49.9 million were 40% lower than in 2010 (US$ 83.7 million) mainly as a result of the Deep Panuke project interest rate hedge loss in 2010 which amounted to US$ 22 million.
More generally, once production units are brought into service the financing costs are expensed to P&L (whereas during construction interest is capitalised). It should be emphasised that the net profit contribution of newly operational leased units is limited by the relatively high interest burden during the first years of operation, although dedication of lease revenues to debt servicing leads to fast redemption of the loan balances and hence reduced interest charges going forward.
Interest income was again low in 2011 with the extremely low level of short-term US interest rates.
Net financing costs also include currency variances resulting from project and overhead hedges. These currency variances were much lower in 2011 than in 2010 (US$ 0.8 million vs US$ 13.8 million loss for prior year).
The reported Share of profit in associates was nil in 2011 as it was in 2010. In the future the Company’s share of net results in any non-controlled joint ventures is likely to appear in this line item, but at the current time the

Appendix: Detailed Financial Information
SBM OFFSHORE N.V. Press Release | 2 March 2012 | Page 15 of 23
Company’s accounting policy for joint ventures continues to be the proportionate consolidation method whereby the Company’s share of each income statement or balance sheet line item is included in the consolidated financial statements.
Income tax in 2011 was US$ 50.0 million including US$ 24.9 million of deemed profit taxes and withholding taxes levied outside each group company’s country of incorporation, which were previously considered to be project costs and reported within cost of sales but which are now reported within income tax. In 2010 these taxes amounted to US$ 24.1 million and the 2010 income tax burden has been restated accordingly. After such restatement, the main reason for the increased tax burden in 2011 is the return to profitability of the Company’s Dutch subsidiaries which had incurred significant losses in 2010.
Minority interest in the 2011 net result amounts to US$ 32.0 million which is below the 2010 minority share of US$ 36.1 million due to lower reported results from fully consolidated joint ventures where the Company has a minority partner (principally concerns FPSOs Aseng and Capixaba). Net result attributable to shareholders accordingly amounts to a loss of US$ 472.7 million (US$ 240.0 million profit in 2010).
In accordance with its stated policy to pay 50% of net result as dividend, the Company does not propose to pay a dividend on account of 2011.
1.6 Statement of financial position
Shareholders’ equity decreased by 38% to US$ 1,283.6 million as a result of the net loss for the year and the negative value of the Company’s hedge portfolio explained below. These unrealised losses are charged directly against equity in accordance with hedge accounting rules and result from the Company’s policy of full hedging of identified interest rate and forex exposures and the significant movements in US interest rates and foreign exchange rates.
Capital Employed (Equity + Provisions + Deferred tax liability + Net Debt) at year-end 2011 is US$ 3,354 million which is US$ 458 million (12.0%) below last year’s level (restated) despite the ongoing investments in leased production facilities (partly financed with new debt), due to the net loss and significant negative adjustments to equity in respect of derivative financial instruments. With the strengthening of the US$ (particularly against the
Appendix: Detailed Financial Information
SBM OFFSHORE N.V. Press Release | 2 March 2012 | Page 16 of 23
Euro) in the latter part of the year, equity has been negatively impacted by US$ 198 million in 2011 on marking to market the Company’s portfolio of forward exchange contracts. In addition, with the exceptionally low level of interest rates, the mark to market of the interest rate hedge portfolio generated a negative impact in equity of US$ 73 million in 2011. The combined, cumulative reduction in Group equity from hedging contract valuation amounts to US$ 323 million.
At 31 December 2011 the Company has undrawn committed long-term bank facilities totalling US$ 916 million (Revolving Credit Facility, Cidade de Paraty - SBM 50.5% share, Deep Panuke and Aseng project loans) available for financing capital investment in 2012.
Net debt at the year-end amounted to US$ 1,958.5 million (US$ 1,644.3 million at 31 December 2010) with net gearing at 145.2% which is higher than expected due to the impairment charges booked in the second half of 2011 and due to the negative market values of the hedge portfolio explained above. Excluding the negative value of the hedging reserve, net gearing amounts to 117%. The relevant banking covenants (mainly solvency, net debt: EBITDA, interest cover) were all comfortably met.
There continues to be no off-balance sheet financing.
The current ratio decreased sharply to a more normalised level of 0.86 due to the completion of the FPSO Aseng and the transfer of the investment in this finance lease project from construction work in progress to other financial assets.
1.7 Capital Expenditure
Total capital expenditure for 2011 (comprising of additions to property, plant & equipment plus capitalised development expenditure) amounted to US$ 840 million (2010: US$ 519 million). The majority of this total is related to new investment in the lease fleet (operating leases only) for which the major elements are:
• ongoing expenditure on the conversion and equipment procurement for the MOPUstor™ jack-up facility for Talisman’s Yme field in Norway, the MOPU gas platform for EnCana’s Deep Panuke field in Canada, and the FPSO Espadarte upgrade for relocation to Petrobras’ Baleia Azul field in Brazil;
• initial investment in the construction of a new diving support and construction vessel for the Turnkey Services division;
• ongoing expenditure on Phase II of the Angolan yard Paenal; • two VLCC hulls for future conversion into FPSOs.
Capital expenditure in 2011 on the FPSO Aseng for Noble Energy, the FPSO Cidade de Paraty for Petrobras and first expenditure on FPSOs Cidade de Ilhabela and Xikomba is excluded from the total amount above. Due to the classification of the contracts as finance leases, investment in the units were recorded through construction contracts, with the investments in finance lease to be ultimately recorded in financial fixed assets.
The decrease in property, plant and equipment in 2011 to US$ 2,534 million (31 December 2010: US$ 2,942 million) resulted from capital expenditure in 2011 less depreciation, impairment and amortisation, less the disposal of two inventory tankers, and the transfer of three tankers to construction contracts.
The Company’s investments comprise the external costs (shipyards, subcontractors, and suppliers), internal costs (manhours and expenses in respect of design, engineering, construction supervision, etc.), third party financial costs including interest, and such overhead allocation as allowed under IFRS. The total of the above costs (or a proportionate share in the case of joint ventures) is capitalised in the Company’s consolidated balance sheet as the value of the respective facility. No profit is taken on completion/delivery of such a system for a lease and operate contract which is classified as an operating lease.

Appendix: Detailed Financial Information
SBM OFFSHORE N.V. Press Release | 2 March 2012 | Page 17 of 23
US$ million 2007 2008 2009 2010 2011
Capital employed 2,257.4 2,740.9 3,325.8 3,811.9 3,354.3
Total equity 1,337.7 1,240.9 1,816.8 2,123.4 1,349.0
Net Debt 874.7 1,464.0 1,464.0 1,644.3 1,958.5
Net gearing (%) 65 118 81 77.4 145.2
Net Debt: Unadjusted EBITDA ratio 1.6 2.76 2.39 2.31 2.41
Capital expenditure 551 999.8 656 519.0 840.6
Current ratio 1.15 0.79 0.91 1.48 0.86
1.8 Return On Average Capital Employed and Equity
ROACE (Return On Average Capital Employed) at negative 9.5% and Return On average shareholders’ Equity (ROE) at minus 28.2% both result from the major impairment charges taken in 2011, and were even amplified by the reductions in equity and capital employed due to the mark to market of the hedge portfolio explained earlier. The Company’s objectives are to return to historically achieved returns of 15% for ROACE and 20% for ROE.
*2010 data has been restated for comparison purposes
Appendix: Detailed Financial Information
SBM OFFSHORE N.V. Press Release | 2 March 2012 | Page 18 of 23
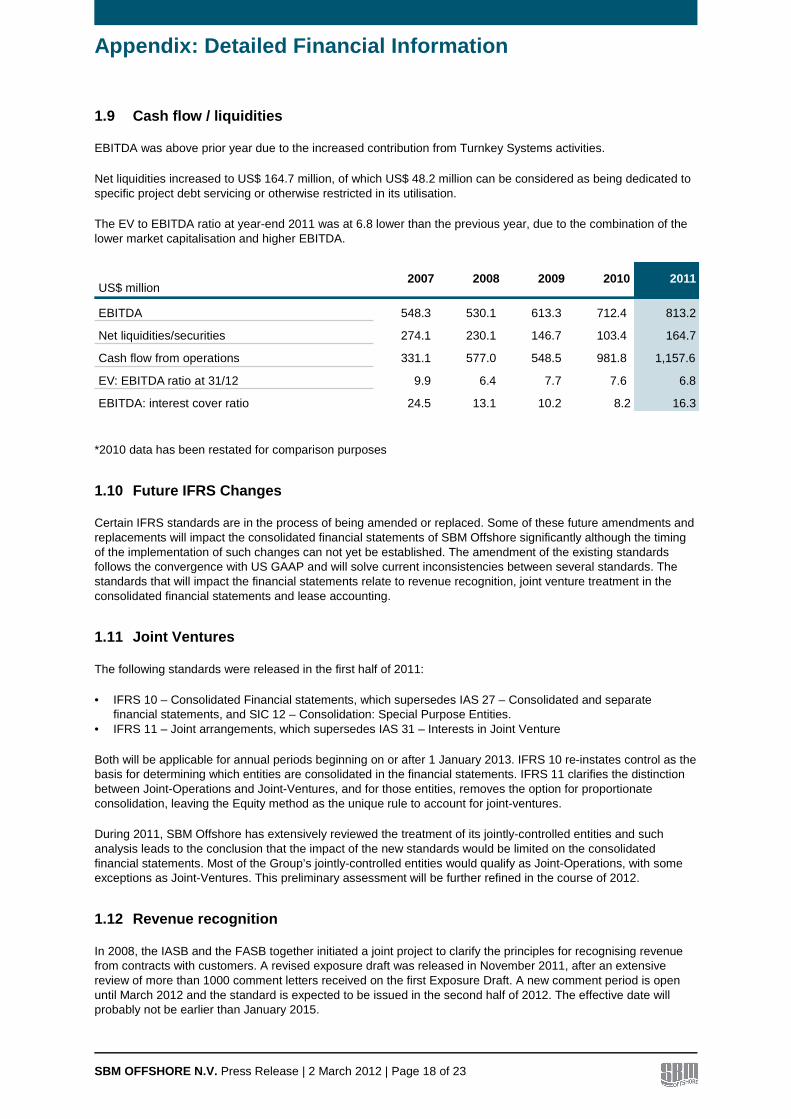
1.9 Cash flow / liquidities
EBITDA was above prior year due to the increased contribution from Turnkey Systems activities.
Net liquidities increased to US$ 164.7 million, of which US$ 48.2 million can be considered as being dedicated to specific project debt servicing or otherwise restricted in its utilisation.
The EV to EBITDA ratio at year-end 2011 was at 6.8 lower than the previous year, due to the combination of the lower market capitalisation and higher EBITDA.
US$ million2007 2008 2009 2010 2011
EBITDA 548.3 530.1 613.3 712.4 813.2
Net liquidities/securities 274.1 230.1 146.7 103.4 164.7
Cash flow from operations 331.1 577.0 548.5 981.8 1,157.6
EV: EBITDA ratio at 31/12 9.9 6.4 7.7 7.6 6.8
EBITDA: interest cover ratio 24.5 13.1 10.2 8.2 16.3
*2010 data has been restated for comparison purposes
1.10 Future IFRS Changes
Certain IFRS standards are in the process of being amended or replaced. Some of these future amendments and replacements will impact the consolidated financial statements of SBM Offshore significantly although the timing of the implementation of such changes can not yet be established. The amendment of the existing standards follows the convergence with US GAAP and will solve current inconsistencies between several standards. The standards that will impact the financial statements relate to revenue recognition, joint venture treatment in the consolidated financial statements and lease accounting.
1.11 Joint Ventures
The following standards were released in the first half of 2011:
• IFRS 10 – Consolidated Financial statements, which supersedes IAS 27 – Consolidated and separate financial statements, and SIC 12 – Consolidation: Special Purpose Entities.
• IFRS 11 – Joint arrangements, which supersedes IAS 31 – Interests in Joint Venture
Both will be applicable for annual periods beginning on or after 1 January 2013. IFRS 10 re-instates control as the basis for determining which entities are consolidated in the financial statements. IFRS 11 clarifies the distinction between Joint-Operations and Joint-Ventures, and for those entities, removes the option for proportionate consolidation, leaving the Equity method as the unique rule to account for joint-ventures.
During 2011, SBM Offshore has extensively reviewed the treatment of its jointly-controlled entities and such analysis leads to the conclusion that the impact of the new standards would be limited on the consolidated financial statements. Most of the Group’s jointly-controlled entities would qualify as Joint-Operations, with some exceptions as Joint-Ventures. This preliminary assessment will be further refined in the course of 2012.
1.12 Revenue recognition
In 2008, the IASB and the FASB together initiated a joint project to clarify the principles for recognising revenue from contracts with customers. A revised exposure draft was released in November 2011, after an extensive review of more than 1000 comment letters received on the first Exposure Draft. A new comment period is open until March 2012 and the standard is expected to be issued in the second half of 2012. The effective date will probably not be earlier than January 2015.

Appendix: Detailed Financial Information
SBM OFFSHORE N.V. Press Release | 2 March 2012 | Page 19 of 23
The core principle of the exposure draft is that a company should recognise revenue to match the transfer of promised goods or services to a customer for an amount that reflects the consideration to which the company expects to be entitled in exchange for those goods or services.
Based on on-going analysis of its main contracts, SBM Offshore’s revenue recognition pattern may not be significantly impacted by the envisaged changes and the cost-to-cost method SBM Offshore currently applies could therefore be maintained.
1.13 Leases
The standard setters’ aim to develop a new single approach to lease accounting that would ensure that all assets and liabilities under lease contracts are recognised in the statement of financial position. During the course of 2011, it has been confirmed that the right-of-use model would apply to all lease arrangements. Under that model, a lessee in an arrangement that is, or contains, a lease would recognise an asset representing its right to use an underlying asset during the lease term and a liability representing its obligation to make payments during the lease term.
For a lessor like SBM Offshore, the application of this right-to-use method is still under discussion.
A first exposure draft was open for public comments until 15 December 2010. A second exposure draft will be issued in the second half of 2012. SBM Offshore is currently following the developments but it is still too early to anticipate precisely the related impact.

Appendix: Detailed Financial Information
SBM OFFSHORE N.V. Press Release | 2 March 2012 | Page 20 of 23
2 Financial Statements
2.1 Consolidated income statement
in thousands of US$ 2011 2010 (*) Revenue 3,156,826 3,055,761 Cost of Sales (3,317,774) (2,520,269) Gross margin (160,948) 535,492 Other operating income 1,894 2,240 Selling and marketing expenses (46,722) (44,617) General and administrative expenses (84,435) (85,977) Research and development expenses (50,408) (20,659) Operating profit/(loss) (EBIT) (340,619) 386,479 Financial income 13,198 19,734 Financial expenses (63,145) (103,475) Net financing costs (49,947) (83,741) Profit/(Loss) before tax (390,566) 302,738 Income tax expense (50,048) (26,727) Profit/(Loss) (440,614) 276,011 * restated for comparison purposes 2011 2010 Attributable to shareholders of the parent company (472,657) 239,960 Attributable to non-controlling interests 32,043 36,051 Profit/(Loss) (440,614) 276,011
2011 2010 Weighted average number of shares outstanding 170,342,173 167,095,777 Basic earnings/(loss) per share US$ (2.77) US$ 1.44 Fully diluted earnings/(loss) per share US$ (2.77) US$ 1.42
2.2 Consolidated statement of comprehensive income
in thousands of US$ 2011 2010 Profit/(Loss) for the period (440,614) 276,011 Cash flow hedges, net of tax (286,882) 64,306 Currency translation differences, net of tax (6,693) (10,642) Other comprehensive income for the period, net of tax (293,575) 53,664 Total comprehensive income for the period (734,189) 329,675
2011 2010 Total comprehensive income: Attributable to shareholders of the parent company (749,500) 293,593 Attributable to non-controlling interests 15,311 36,082 (734,189) 329,675
Appendix: Detailed Financial Information
SBM OFFSHORE N.V. Press Release | 2 March 2012 | Page 21 of 23
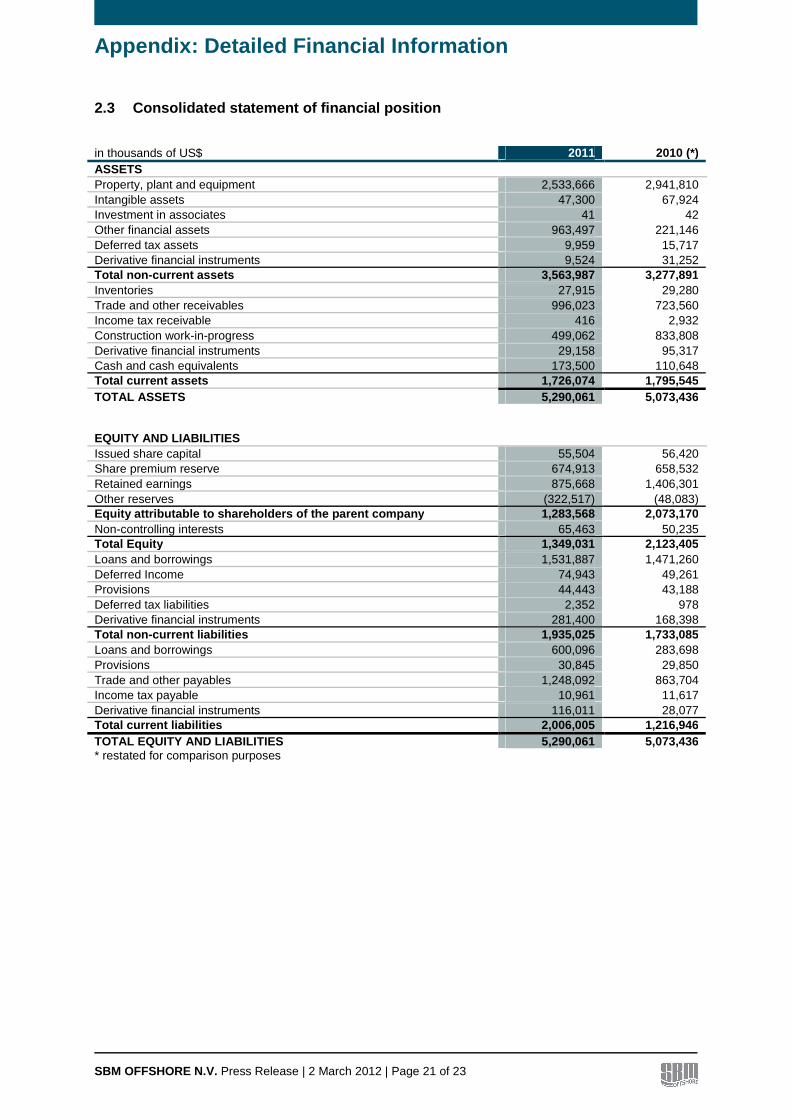
2.3 Consolidated statement of financial position
in thousands of US$ 2011 2010 (*) ASSETS Property, plant and equipment 2,533,666 2,941,810 Intangible assets 47,300 67,924 Investment in associates 41 42 Other financial assets 963,497 221,146 Deferred tax assets 9,959 15,717 Derivative financial instruments 9,524 31,252 Total non-current assets 3,563,987 3,277,891 Inventories 27,915 29,280 Trade and other receivables 996,023 723,560 Income tax receivable 416 2,932 Construction work-in-progress 499,062 833,808 Derivative financial instruments 29,158 95,317 Cash and cash equivalents 173,500 110,648 Total current assets 1,726,074 1,795,545 TOTAL ASSETS 5,290,061 5,073,436 EQUITY AND LIABILITIES Issued share capital 55,504 56,420 Share premium reserve 674,913 658,532 Retained earnings 875,668 1,406,301 Other reserves (322,517) (48,083) Equity attributable to shareholders of the parent company 1,283,568 2,073,170 Non-controlling interests 65,463 50,235 Total Equity 1,349,031 2,123,405 Loans and borrowings 1,531,887 1,471,260 Deferred Income 74,943 49,261 Provisions 44,443 43,188 Deferred tax liabilities 2,352 978 Derivative financial instruments 281,400 168,398 Total non-current liabilities 1,935,025 1,733,085 Loans and borrowings 600,096 283,698 Provisions 30,845 29,850 Trade and other payables 1,248,092 863,704 Income tax payable 10,961 11,617 Derivative financial instruments 116,011 28,077 Total current liabilities 2,006,005 1,216,946 TOTAL EQUITY AND LIABILITIES 5,290,061 5,073,436 * restated for comparison purposes

Appendix: Detailed Financial Information
SBM OFFSHORE N.V. Press Release | 2 March 2012 | Page 22 of 23
2.4 Consolidated statement of changes in equity
Outstanding
number of shares
Share capital
Share premium
Retained earnings
Other reserves
Total Non-controlling
interests
Total equity
in thousands of US$ At 1 January 2011 168,667,512 56,420 658,532 1,406,301 (48,083) 2,073,170 50,235 2,123,405 Loss for the year - - - (472,657) - (472,657) 32,043 (440,614) Foreign currency translation
- (1,882) - - (4,507) (6,389) (304) (6,693)
Cash flow hedges/net investment hedges
- - - - (270,454) (270,454) (16,428) (286,882)
Total comprehensive income for the year
- (1,882) - (472,657) (274,961) (749,500) 15,311 (734,189)
Share based payments
- - - 9,981 - 9,981 - 9,981
Stock dividend 2,104,877 733 (733) - - - - - Share options/ bonus shares
668,027 233 17,114 (7,194) - 10,153 - 10,153
Cash dividend - - - (60,763) 527 (60,236) (83) (60,319) Total transactions with owners of the Company
2,772,904 966 16,381 (57,976) 527 (40,102) (83) (40,185)
At 31 December 2011
171,440,416 55,504 674,913 875,668 (322,517) 1,283,568 65,463 1,349,031
Outstanding
number of shares
Share capital
Share premium
Retained earnings
Other reserves
Total Non-controlling
interests
Total equity
in thousands of US$ At 1 January 2010 164,459,980 58,963 632,963 1,216,343 (105,652) 1,802,617 14,215 1,816,832 Profit for the year - - - 239,960 - 239,960 36,051 276,011 Foreign currency translation
- (3,936) - - (6,737) (10,673) 31 (10,642)
Cash flow hedges/net investment hedges
- - - - 64,306 64,306 - 64,306
Total Comprehensive income for the year
- (3,936) - 239,960 57,569 293,593 36,082 329,675
Share based payments
- - - 11,040 - 11,040 - 11,040
Stock dividend 2,628,848 870 (870) - - - - - Share options/ bonus shares
1,578,684 523 26,439 (2,644) - 24,318 - 24,318
Cash dividend - - - (58,398) - (58,398) (62) (58,460) Total transactions with owners of the Company
4,207,532 1,393 25,569 (50,002) - (23,040) (62) (23,102)
At 31 December 2010
168,667,512 56,420 658,532 1,406,301 (48,083) 2,073,170 50,235 2,123,405
Within retained earnings, an amount of US$ 133.7 million (2010: US$ 129.3 million) relates to equity of joint ventures and other non-distributable items and should therefore be treated as legal reserve. Furthermore, a legal reserve of US$ 18.5 million (2010: US$ 38.2 million) should be maintained in respect of capitalised development expenditures.

Appendix: Detailed Financial Information
SBM OFFSHORE N.V. Press Release | 2 March 2012 | Page 23 of 23
2.5 Consolidated cash flow statement
in thousands of US$ 2011 2010 (*) Cash flow from operating activities Receipts from customers 2,517,081 2,445,617 Payments to suppliers and employees (1,311,288) (1,445,773) Income tax received / (paid) (48,189) (18,040) Net cash from operating activities 1,157,604 981,804 Cash flow from investing activities Investment in property, plant and equipment (799,995) (482,670) Investment in finance leases (572,529) (681,027) Investment in intangible assets (5,757) (9,565) Additions to other financial assets - (21,290) Redemptions of other financial assets 41,732 138,046 Interest received 10,898 11,318 Proceeds from sale of assets 14,450 - Net cash used in investing activities (1,311,201) (1,045,188) Cash flow from financing activities Additions to borrowings and loans 617,604 579,779 Repayments of borrowings and loans (290,507) (433,327) Dividends paid to shareholders (60,846) (58,460) Interest paid (49,783) (64,008) Net cash from financing activities 216,468 23,984 Net increase/(decrease) in cash and cash equivalents 62,871 (39,400) Cash and cash equivalents at 1 January 103,421 146,712 Currency differences (1,592) (3,891) Cash and cash equivalents at 31 December 164,700 103,421 * restated for comparison purposes
The reconciliation of the cash and cash equivalents as at 31 December with the corresponding amounts in the balance sheet is as follows:
2011 2010 Cash and cash equivalents 173,500 110,648 Bank overdrafts (8,800) (7,227) Cash and cash equivalents at 31 December 164,700 103,421