
AllFusion Process Modeler Data Flow Diagramming … · Data Flow Diagrams A Data Flow Diagram (DFD)...
41
A llFusion ® Process Modeler Data Flow Diagramming Design Guide r7.2
Transcript of AllFusion Process Modeler Data Flow Diagramming … · Data Flow Diagrams A Data Flow Diagram (DFD)...

AllFusion® Process Modeler Data Flow Diagramming
Design Guide r7.2

This documentation and any related computer software help programs (hereinafter referred to as the “Documentation”) is for the end user’s informational purposes only and is subject to change or withdrawal by CA at any time.
This Documentation may not be copied, transferred, reproduced, disclosed, modified or duplicated, in whole or in part, without the prior written consent of CA. This Documentation is confidential and proprietary information of CA and protected by the copyright laws of the United States and international treaties.
Notwithstanding the foregoing, licensed users may print a reasonable number of copies of the Documentation for their own internal use, and may make one copy of the related software as reasonably required for back-up and disaster recovery purposes, provided that all CA copyright notices and legends are affixed to each reproduced copy. Only authorized employees, consultants, or agents of the user who are bound by the provisions of the license for the product are permitted to have access to such copies.
The right to print copies of the Documentation and to make a copy of the related software is limited to the period during which the applicable license for the product remains in full force and effect. Should the license terminate for any reason, it shall be the user’s responsibility to certify in writing to CA that all copies and partial copies of the Documentation have been returned to CA or destroyed.
EXCEPT AS OTHERWISE STATED IN THE APPLICABLE LICENSE AGREEMENT, TO THE EXTENT PERMITTED BY APPLICABLE LAW, CA PROVIDES THIS DOCUMENTATION “AS IS” WITHOUT WARRANTY OF ANY KIND, INCLUDING WITHOUT LIMITATION, ANY IMPLIED WARRANTIES OF MERCHANTABILITY, FITNESS FOR A PARTICULAR PURPOSE OR NONINFRINGEMENT. IN NO EVENT WILL CA BE LIABLE TO THE END USER OR ANY THIRD PARTY FOR ANY LOSS OR DAMAGE, DIRECT OR INDIRECT, FROM THE USE OF THIS DOCUMENTATION, INCLUDING WITHOUT LIMITATION, LOST PROFITS, BUSINESS INTERRUPTION, GOODWILL, OR LOST DATA, EVEN IF CA IS EXPRESSLY ADVISED OF SUCH LOSS OR DAMAGE.
The use of any product referenced in the Documentation is governed by the end user’s applicable license agreement.
The manufacturer of this Documentation is CA.
Provided with “Restricted Rights.” Use, duplication or disclosure by the United States Government is subject to the restrictions set forth in FAR Sections 12.212, 52.227-14, and 52.227-19(c)(1) - (2) and DFARS Section 252.227-7014(b)(3), as applicable, or their successors.
All trademarks, trade names, service marks, and logos referenced herein belong to their respective companies.
Copyright © 2006 CA. All rights reserved.
CA Product References This document references the following CA products:
AllFusion® Process Modeler
Contact Technical Support For online technical assistance and a complete list of locations, primary service hours, and telephone numbers, contact Technical Support at http://ca.com/support.


Contents
Chapter 1: Data Flow Diagramming Method 7 Data Flow Diagrams ........................................................................... 7 DFD Objects................................................................................... 8
Activities .................................................................................. 9 Data Stores ............................................................................... 9 External References........................................................................ 9 Arrows ................................................................................... 10 Object Numbering ........................................................................ 11
Chapter 2: DFD Model Syntax and Semantics 13 DFD Model Structure.......................................................................... 13
Chapter 3: Building a DFD 15 How You Build a DFD ......................................................................... 15 Example: Data Flow Diagram.................................................................. 16 Create a DFD................................................................................. 16
Add More Activities to a DFD............................................................... 17 Add Data Stores to a DFD ................................................................. 18 Add External References to a DFD ......................................................... 19 Add Arrows to a DFD...................................................................... 21
Activity Decomposition Diagrams .............................................................. 22 Create an Activity Decomposition Diagram ................................................. 22
Chapter 4: Additional DFD Features 25 Event Partitioning............................................................................. 25
How You Use Event Partitioning............................................................ 25 Organization Visualization ..................................................................... 26
Swim Lane Diagrams...................................................................... 27 Organization Charts....................................................................... 28 How To Use Swim Lane Diagrams and Organization Charts in Your Models.................... 29 Create and Manage Role Groups ........................................................... 30 Create and Manage Roles ................................................................. 31 Create and Manage Resources ............................................................. 32 Create a Process Role in the UDP Dictionary ................................................ 33 Add a Bitmap to the Bitmap Dictionary ..................................................... 33
Contents v

Create a Swim Lane Diagram .............................................................. 34 Create an Organization Chart .............................................................. 35
Index 41
vi Design Guide

Chapter 1: Data Flow Diagramming Method
This section contains the following topics:
Data Flow Diagrams (see page 7) DFD Objects (see page 8)
Data Flow Diagrams A Data Flow Diagram (DFD) documents the movement and processing of information within your business or organization. DFDs model systems as a network of activities, data stores, and external references connected to one another by arrows. DFDs provide a blueprint of your system development tasks and reduce the time you spend on repetitive planning and design. DFDs can also complement existing Business Process (IDEF0) models.
Use DFDs to document the following information:
Data processing functions such as Input Customer Data
Data used or created by the data processing system such as Invoice
Objects, persons, or departments that interact with sales such as Vendor
Data processing tables such as Inventory Table
Data Flow Diagramming Method 7

DFD Objects
The following illustrates a typical data flow diagram:
1 P rocess O rde r
2 C o llec t P aym ent
3 S h ip P roducts
1 C us tom ers
2 F u lfillm en t
1 C ustom ers
2 Invo ices
3 C ustom ers
1 O rde rs
o rde rs
o rde r in fo rm a tion
custom er nam e ,custom er add ress
cus tom er nam e ,cus tom er add ress
sh ipp ingin fo rm a tion
p roduct
p roduct
invo ices, s ta tem en ts /paym ents , inqu iries
custom er nam e ,custom er add ress
b illing in fo rm a tion
b illing in fo rm ation
DFD Objects DFD objects represent data processing functions. You can create these objects using this product or import them from AllFusion ERwin Data Modeler. The following lists the model objects used in Data Flow Diagrams:
Activity
Describes an action that processes or transforms data or resources.
This product supports the Gane and Sarson DFD method, in which activities are represented by a box with rounded corners.
Data Store
Shows the flow of data to and from a database table, AllFusion ERwin Data Modeler entity, or both.
External Reference
Represents a location, entity, person, or department that is a source or destination of data but is outside the scope of the diagram.
Arrow
Represents the flow of data between activities, data stores, and external references.
8 Design Guide

DFD Objects
Activities
An activity in DFD modeling represents a function that processes or transforms inputs to outputs. Although generally drawn as rounded-corner boxes, activities are synonymous with activities in IDEF0 and IDEF3. Like IDEF3 activities, DFD activities have inputs and outputs, but do not support controls or mechanisms as arrows, as in IDEF0. In some implementations of Gane and Sarson DFDs, IDEF0 mechanisms are modeled as resources. The following illustration displays the IDEF0 mechanism at the bottom of the box.
Data Stores
As flows represent objects in motion, data stores represent objects at rest. In a data processing system, data stores represent any mechanism by which data is held for subsequent processing. A typical representation in DFD modeling of a data store is shown in the following illustration:
1 Customer data
External References
An external reference can provide both inputs into the system (act as a supplier), and receive outputs (act as a customer). External references are depicted as shadowed boxes and usually appear at the edges of a diagram. A single external reference (such as Customer) can appear multiple times in a single diagram. This is often used to reduce the clutter of long lines cutting across a diagram.
3Ad
Agency
Data Flow Diagramming Method 9

DFD Objects
Arrows
Arrows are used to describe the flow of objects from one part of the system to another. Because DFD activity box sides do not have a dedicated function (as in IDEF0, where each box side has a specific meaning), arrows can originate from or terminate to any side of the activity. A double-headed arrow indicates a coordinated command-response dialogue between two activities, between an activity and an external reference, or between two external references. For example, in the following illustration, a double-headed arrow represents a coordinated interchange between Quill Computer Business System and Customer.
0Q u ill C o m p u te rB u s in e ss S ys te m
1C us tom er
Branching and Joining of Arrows
An arrow on a data flow diagram may be branched (split), and arrow segments may be relabeled to show the decomposition of the data that is carried along the flow. The following example illustrates the customer information arrow splitting into three separate arrows:
1
Record Custom er
Address Information
3
Validate C ity
2
Validate Zip Code
4
Validate Street
Address
zip code
customer
address City
street
address
10 Design Guide

DFD Objects
The following illustration shows how arrows may also join (merge) to form aggregate objects:
2 Validate Zip Code
3 Validate City
4 Validate Street
Address
5 Process Order
valid city
valid zip code
valid street address
valid customer address
Object Numbering
In a data flow diagram, each activity number can include a prefix, parent diagram number, and an object number, as shown in the figure below. The object number uniquely identifies the activity on a diagram. The parent diagram number and object number together uniquely identify each activity in your model.
A 12 5
Object Number
Parent Diagram Number Prefix
Unique numbers are assigned to each data store or external reference name, regardless of the location of the object in the diagram.
Each data store number can include the prefix D and a unique store number.
D 5Object NumberPrefix
Data Flow Diagramming Method 11

DFD Objects
Similarly, each external reference can include the prefix E and a unique external entity number.
E 5Object NumberPrefix
12 Design Guide
Chapter 2: DFD Model Syntax and Semantics
This section contains the following topics:
DFD Model Structure (see page 13)
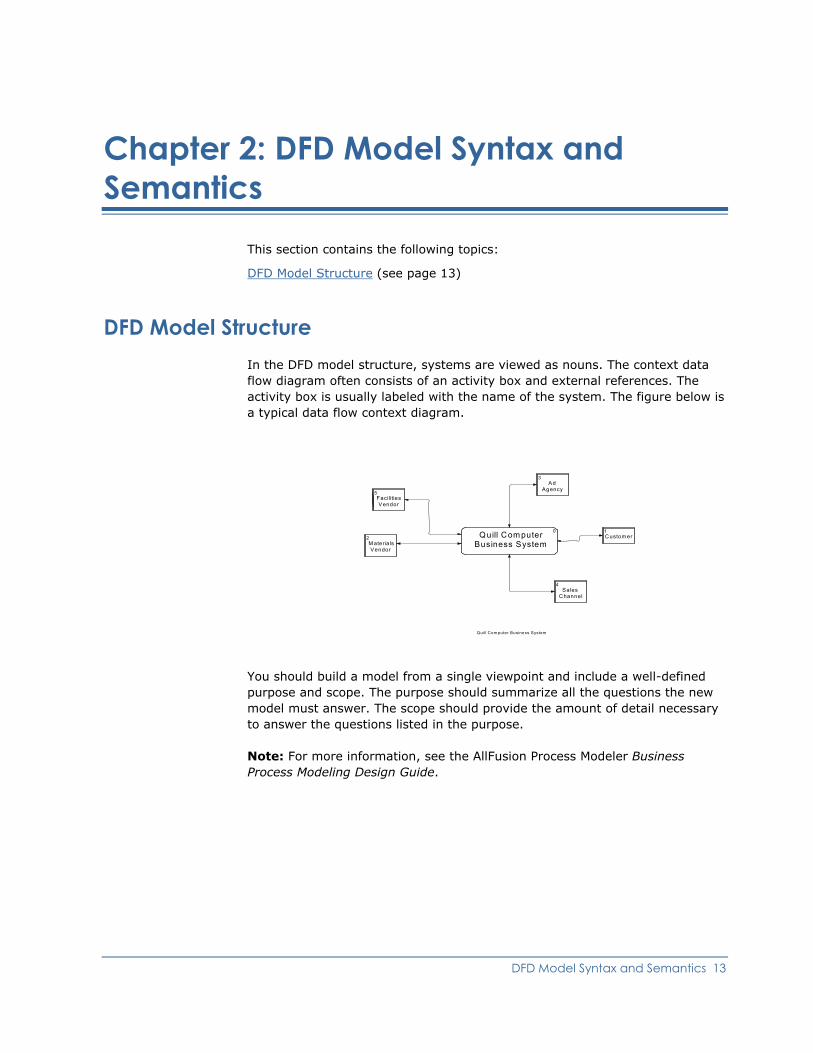
DFD Model Structure In the DFD model structure, systems are viewed as nouns. The context data flow diagram often consists of an activity box and external references. The activity box is usually labeled with the name of the system. The figure below is a typical data flow context diagram.
Quill Com puter Business System
0 Quill Com puter Business System
1 Customer 2
M aterials Vendor
3 Ad
Agency
4 Sales
Channel
5 Facilities Vendor
You should build a model from a single viewpoint and include a well-defined purpose and scope. The purpose should summarize all the questions the new model must answer. The scope should provide the amount of detail necessary to answer the questions listed in the purpose.
Note: For more information, see the AllFusion Process Modeler Business Process Modeling Design Guide.
DFD Model Syntax and Semantics 13


Chapter 3: Building a DFD
This section contains the following topics:
How You Build a DFD (see page 15) Example: Data Flow Diagram (see page 16) Create a DFD (see page 16) Activity Decomposition Diagrams (see page 22)
How You Build a DFD You can build a DFD using a traditional structured analysis and design approach similar to that used for building an IDEF0 diagram, using any of the following methods:
Build a physical model of the system that you are currently using.
Create a logical model containing the essential requirements of the current system.
Create a logical model containing the essential requirements of the proposed system.
Create a physical model of the proposed system.
Building a DFD 15

Example: Data Flow Diagram
Example: Data Flow Diagram The following is an example of a completed data flow diagram:
Create a DFD Create a DFD when it is necessary to document the movement and processing of information within your business or organization.
To create a DFD
1. Click New from the File menu.
The AllFusion Process Modeler r7 dialog opens.
2. Enter a name for the model you are creating in the Name text box, select the Data Flow (DFD) option for model type, and click OK.
The Properties for New Models dialog opens.
16 Design Guide

Create a DFD
3. Complete the following fields in the General tab of the Properties for New Models dialog, and click OK:
Author
Specifies the name of the model author.
Author initials
Specifies the initials of the model author.
Apply CRUD/IRUN restrictions
Enforces CRUD and IRUN restrictions on Call arrows and Mechanism arrows.
When you clear this check box, CRUD and IRUN restrictions are not enforced so that you can specify CRUD and IRUN data to Mechanism arrows and Call arrows.
The model opens and displays the Activity Box that will become your first Activity.
Add More Activities to a DFD
When you create a DFD, you also create your context activity. The next step is to decompose that activity into its related activities. If you need to add more activities to the diagram, you can do this using the Activity Box Tool in any open data flow diagram.
To add activities
1. Click the Activity Box Tool then click the area on the diagram where you want to add the activity.
The activity box is displayed on the diagram.
2. Double-click the activity box you just added.
The Activity Properties dialog opens at the Name tab.
3. Enter a name for the activity or select an existing name from the Unused Activity Names list, and click OK.
The Activity Properties dialog closes and the name for that activity displays in the activity box.
Building a DFD 17

Create a DFD
Add Data Stores to a DFD
After you have added all the required activities, you can add data stores to the diagram to represent the various databases needed for each activity.
To add a data store
1. Click the Data Store Tool then click the area on the diagram where you want to add the data store.
The Data Store dialog opens.
2. Select one of the following to assign a name for the new data store and click OK:
Reusable Data Store
Specifies a data store name from the Reusable Data Store list or lets you enter a new data store name in the lower text box.
Note: If this is the first data store in the diagram, you must use the text box.
Arrow
Specifies the arrow to associate with the data store in the diagram. This option is unavailable if the diagram has no arrows.
Entity
Specifies an existing entity to associate with the data store in the diagram. This option is unavailable if the diagram has no entities.
Other
Specifies not to associate an existing arrow or entity with the data store. Can also indicate you have selected an existing data store or entered a unique name in the text box.
Default: Other
The Data Store dialog closes and the data store appears on the diagram.
18 Design Guide

Create a DFD
Example: Data Store
The following is an example of a data store named PRODUCT with its associated activity:
Add External References to a DFD
Add external references to show sources or destinations of data outside the scope of the diagram.
A DFD external reference is different than a border arrow in an IDEF0 diagram. Although similar, you use them for different purposes.
Note: For more information, see the AllFusion Process Modeler Business Process Modeling Design Guide.
To add external references
1. Click the External Reference Tool then click the area on the diagram where you want to add the external reference.
The External Reference dialog opens.
2. Select one of the following to assign a name for the new external reference and click OK:
Reusable External References
Specifies an external reference name from the Reusable External References list or lets you enter a new external reference name in the lower text box.
Note: If this is the first external reference in the diagram, you must use the text box.
Arrow
Specifies the arrow to associate with the external reference in the diagram. This option is unavailable if the diagram has no arrows.
Building a DFD 19

Create a DFD
Entity
Specifies an existing entity to associate with the external reference in the diagram. This option is unavailable if the diagram has no entities.
Other
Specifies not to associate an existing arrow or entity with the external reference. Can also indicate you have selected an existing external reference or entered a unique name in the text box.
Default: Other
The External Reference dialog closes and the external reference appears on the diagram.
Note: A unique number is assigned to the external reference or, if you select an existing name from the Reusable External References list, the previously assigned external reference number is used.
Example: External Reference
The following is an example of an external reference named CUSTOMER:
20 Design Guide
Create a DFD
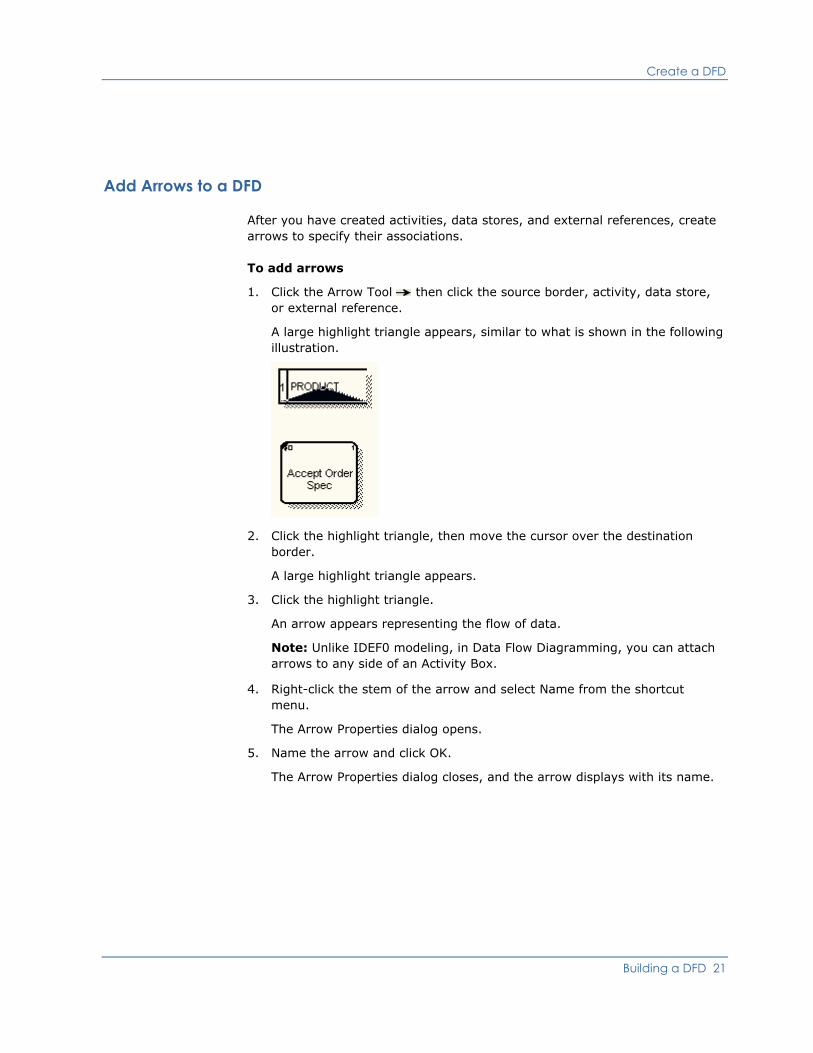
Add Arrows to a DFD
After you have created activities, data stores, and external references, create arrows to specify their associations.
To add arrows
1. Click the Arrow Tool then click the source border, activity, data store, or external reference.
A large highlight triangle appears, similar to what is shown in the following illustration.
2. Click the highlight triangle, then move the cursor over the destination border.
A large highlight triangle appears.
3. Click the highlight triangle.
An arrow appears representing the flow of data.
Note: Unlike IDEF0 modeling, in Data Flow Diagramming, you can attach arrows to any side of an Activity Box.
4. Right-click the stem of the arrow and select Name from the shortcut menu.
The Arrow Properties dialog opens.
5. Name the arrow and click OK.
The Arrow Properties dialog closes, and the arrow displays with its name.
Building a DFD 21

Activity Decomposition Diagrams
Activity Decomposition Diagrams You can use activity decomposition diagrams in business modeling to break an activity down into its constituent parts. For example, the activity Run Video Store can be decomposed into activities such as Open Store, Receive Payment, Rent Video, and Close Store. Each of these activities can also be decomposed into their constituent activities.
You can decompose activities (in IDEF0 and DFD modeling) or Units of Work (in IDEF3 modeling). Units of Work (UOWs) indicate an event, process, decision, or action. Although the methodologies differ, the basic premise of decomposition is the same. You can decompose IDEF0 models into IDEF3 and DFD constituent activities and Units of Work.
Note: The IDEF0 diagram must always be the parent activity of any mixed model decomposition diagram. It is a good idea to have at least two levels of IDEF0 activities before decomposing into another methodology. That way, you have enough activities to create child decomposition diagrams.
Create an Activity Decomposition Diagram
You can decompose a context activity when you create a decomposition diagram. This is helpful when you need greater detail for a more accurate representation of the system you are modeling.
To create an activity decomposition diagram
1. Select the activity that you want to decompose and then click the Go to Child Diagram tool on the AllFusion PM toolbar.
The Activity Box Count dialog opens.
2. Select one of the following decomposition types and any additional options and click OK:
IDEF0
Specifies to create an IDEF0 decomposition diagram.
DFD
Specifies to create a DFD decomposition diagram.
If you select to create a DFD decomposition, you can select the following:
Include Externals and Data Stores
(Optional) Specifies to include externals and data stores in the decomposition diagram.
22 Design Guide
Activity Decomposition Diagrams
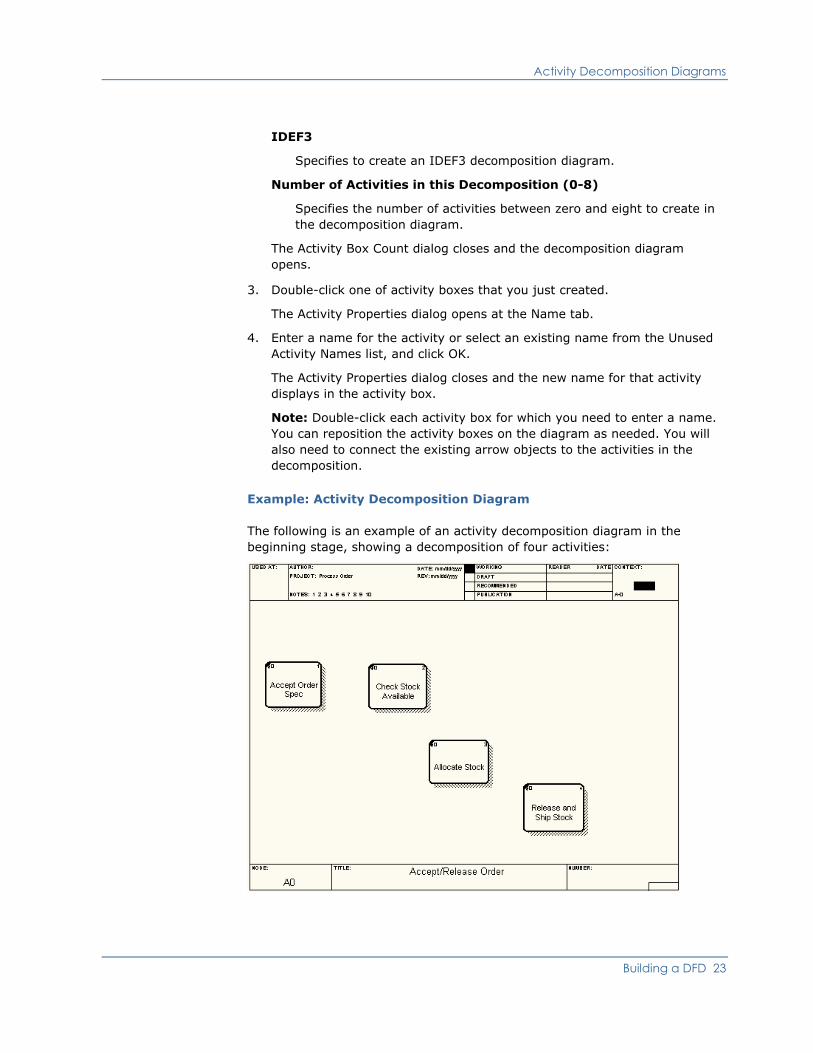
IDEF3
Specifies to create an IDEF3 decomposition diagram.
Number of Activities in this Decomposition (0-8)
Specifies the number of activities between zero and eight to create in the decomposition diagram.
The Activity Box Count dialog closes and the decomposition diagram opens.
3. Double-click one of activity boxes that you just created.
The Activity Properties dialog opens at the Name tab.
4. Enter a name for the activity or select an existing name from the Unused Activity Names list, and click OK.
The Activity Properties dialog closes and the new name for that activity displays in the activity box.
Note: Double-click each activity box for which you need to enter a name. You can reposition the activity boxes on the diagram as needed. You will also need to connect the existing arrow objects to the activities in the decomposition.
Example: Activity Decomposition Diagram
The following is an example of an activity decomposition diagram in the beginning stage, showing a decomposition of four activities:
Building a DFD 23


Chapter 4: Additional DFD Features
This section contains the following topics:
Event Partitioning (see page 25) Organization Visualization (see page 26)
Event Partitioning An alternate approach to data flow diagramming in software design is called event partitioning. Use event partitioning to build a system model containing several DFDs.
How You Use Event Partitioning
To use event partitioning, complete the following tasks:
Build a logical model to show the system as a collection of activities and document what the system should do.
Create an environment model to describe the system as an object that responds to events from external references. This environment model usually consists of a statement of the system's purpose, a single context diagram, and an event list. The context diagram consists of a single box that represents the entire system, and the external references with which this system interacts (its environment).
Create a behavior model to show how the system handles all of the events. This model begins as a single diagram, with one box representing each response to an event identified in the environment model. Data stores are added to model data that must be remembered between events. Flows are added to connect the other elements, and the diagram is checked for consistency with the environment model.
(Optional) Reformat the model for presentations using activity aggregation to create simplified parent diagrams and performing decomposition to improve clarity.
Additional DFD Features 25

Organization Visualization
Organization Visualization Complex business processes often cut across a number of organizational boundaries and disciplines. Understanding and optimizing these types of processes requires companies to extend their thinking beyond traditional hierarchical models and to visualize operations from the perspective of their customers and partners.
With Swim Lane diagrams and organization charts you have the tools to visualize the structure and process flows of your organization. Swim Lane diagrams enable you to quickly assess and improve complex business process flows across organizational groups. Organization charts graphically help you to understand your organization's structure and its impact on your business optimization effort.
26 Design Guide

Organization Visualization
Swim Lane Diagrams
Swim Lane diagrams can provide your organization with an efficient mechanism for visualizing and optimizing processes. Swim Lane diagrams organize complex processes across functional boundaries, and help you to conveniently view processes, roles, and responsibilities, and their flow. You can build a new diagram or use one based on existing Process Flow (IDEF3) diagrams.
You can add Swim Lane diagrams to any model to better visualize process flow. Swim Lane diagrams display graphical horizontal lanes that represent process dependencies called roles. For example, you could create a Swim Lane diagram to display all activities with the Shipping role in the Shipping swim lane. You can also add bitmaps and a diagram scale or timeline to any Swim Lane diagram.
Example: Swim Lane Diagram
The following is an example of a Swim Lane diagram:
Additional DFD Features 27

Organization Visualization
Organization Charts
Organization structures have an immense impact on how business processes are defined and carried out. Without a clear understanding of roles, relationships, and responsibilities, it is often impossible to successfully optimize business operations.
Organization charts are based on user-defined roles and provide a graphical view of an organization's structure. Use them to quickly clarify the business process optimization effort.
Example: Organization Chart
The following is an example of a typical organization chart:
28 Design Guide

Organization Visualization
How To Use Swim Lane Diagrams and Organization Charts in Your Models
To use Swim Lane diagrams or organization charts in AllFusion Process Modeler models, complete the following tasks:
Create process roles using the following procedures:
Create and manage role group names and properties in the Role Group Dictionary.
Create and manage role names and properties in the Role Dictionary.
Create and manage resource names and their role associations in the Resource Dictionary.
Note: For Swim Lane diagrams, you can create process roles in the UDP Dictionary by adding list items to a text list UDP.
(Optional) Add bitmaps to the Bitmap Dictionary for enhancing Swim Lane diagrams and organization charts.
Create Swim Lane diagrams or organization charts.
Additional DFD Features 29

Organization Visualization
Create and Manage Role Groups
The Role Group Dictionary utilizes a grid to provide a way to create and manage role group names and property information. Create a new role group in the Role Group Dictionary so it can be used in Swim Lane diagrams or organization charts, or manage the properties of existing role groups.
Note: You must have at least one role group defined in the Role Group Dictionary before you can add either a role or a resource.
To create or manage a role group
1. Select Role Group from the Dictionary menu.
The Role Group Dictionary opens.
2. Add or edit the information in the following Role Group Dictionary columns, select Save from the Dictionary menu, and then select Close from the Dictionary menu.
Name
Displays the role group name.
Click the cell in the last row and enter the role group name, or select a name to edit.
Note: Use a role group name that best describes how you intend to use the role group. For example, if you want to create a company organizational chart, you can use "WIDGET INC. MANAGEMENT" as a role group.
Definition
Displays the role group definition information.
Bitmap
Displays the default bitmap associated with the role group.
Importance
Displays the importance level of the role group.
Shape
Displays the default shape for the roles associated with the role group.
The role group is added to the Role Group Dictionary and the Role Group Dictionary closes.
30 Design Guide

Organization Visualization
Create and Manage Roles
The Role Dictionary utilizes a grid to provide a way to create and manage role group names and property information. Create a new role in the Role Dictionary so it can be used in Swim Lane diagrams or organization charts, or manage the properties of existing roles.
Note: Before you can add a new role, you must have at least one role group defined in the Role Group Dictionary.
To create or manage a role
1. Select Role from the Dictionary menu.
The Role Dictionary opens.
2. Add or edit the information in the following Role Dictionary columns, select Save from the Dictionary menu, and then select Close from the Dictionary menu.
Name
Displays the role name.
Click the cell in the last row and enter the role name, or select a name to edit.
Definition
Displays the role definition information.
Role Group
Displays the role group associated with the role.
Bitmap
Displays the default bitmap associated with the role.
Importance
Displays the importance level of the role.
Shape
Displays the default shape associated with the role.
The role is added to the Role Dictionary and the Role Dictionary closes.
Additional DFD Features 31

Organization Visualization
Create and Manage Resources
The Resource Dictionary utilizes a grid to provide a way to create and manage resource names and their associations to roles. Create a new resource in the Resource Dictionary so it can be used in Swim Lane diagrams or organization charts, or manage the properties of existing resources.
Note: Before you can add a new resource, you must have at least one role group defined in the Role Group Dictionary, and roles must be defined in the Role Dictionary.
To create or manage a resource
1. Select Resource from the Dictionary menu.
The Resource Dictionary opens.
2. Add or edit the information in the following Resource Dictionary columns, select Save from the Dictionary menu, and then select Close from the Dictionary menu.
Name
Displays the resource name.
Click the cell in the last row and enter the resource name, or select a name to edit.
Definition
Displays the resource definition information.
Associations
Displays the role group/role associations.
The resource is added to the Resource Dictionary and the Resource Dictionary closes.
32 Design Guide

Organization Visualization
Create a Process Role in the UDP Dictionary
Use the UDP Dictionary to add a UDP list item to represent a process role, so that it can be used in a Swim Lane diagram. These list items appear as selections in the UDP list boxes in diagram object dictionaries.
To add a process role to a UDP Dictionary
1. Select UDP from the Dictionary menu.
The UDP Dictionary opens.
2. Click a cell in the UDP Datatype column, select Text List (Single selection) from the dropdown selection, and then click a cell in the Settings column.
The Text UDP List Editor opens.
3. Type the UDP list item name on a new line in the list area and click OK.
The process role is added and the Text UDP List Editor closes.
Add a Bitmap to the Bitmap Dictionary
You can use bitmaps (*.bmp) to enhance the appearance of any Swim Lane diagram or organization chart. To use bitmaps in diagrams, you must add them to the Bitmap Dictionary by importing them from an external source, such as your computer hard drive.
Note: You can import any size bitmap. After you import a bitmap, the original bitmap file is not referenced or required. When you save the model, all imported bitmaps are saved with the model file.
To add a bitmap to the Bitmap Dictionary
1. Select Bitmaps from the Dictionary menu.
The Bitmap Dictionary opens.
2. Click the Import button.
The Open dialog opens.
3. Select the path and file name of the bitmap (*.bmp) you want to add and click Open.
The Open dialog closes, you are returned to the Bitmap Dictionary, and your selected bitmap is displayed in the Model bitmaps list.
4. Click OK.
The bitmap is added and the Bitmap Dictionary closes.
Additional DFD Features 33
Organization Visualization
Create a Swim Lane Diagram
Add a Swim Lane diagram to any IDEF3 model to display all activities with a specific role and better visualize process flow. Once you have created the necessary role groups, roles, and resources, you are ready to create a Swim Lane diagram.
Note: You must have either a role group or a single-selection text list UDP defined in order to create a Swim Lane diagram.
To create a Swim Lane diagram
1. Select Add Swim Lane diagram from the Diagram menu.
The Swim Lane Diagram Wizard - Step 1 of 2 dialog opens.
2. Complete the following information in this dialog, and then click the Next button:
Role Group
Bases the Swim Lane diagram on a role group and lets you select the specific role group from the dropdown list.
Text List UDP
Bases the Swim Lane diagram on a text list UDP and lets you select the specific text list UDP from the dropdown list.
Yes
Specifies to copy the objects from an IDEF3 diagram into the Swim Lane diagram and lets you select the specific IDEF3 diagram from the dropdown list.
No
Specifies not to copy the objects from an IDEF3 diagram into the Swim Lane diagram.
If you select this option, you can add diagram objects such as activities and arrows later.
Diagram name
Specifies a name for the Swim Lane diagram.
The Swim Lane Diagram Wizard - Step 2 of 2 dialog opens.
3. Complete the following information in this dialog, and then click the Finish button:
Swim Lanes on Diagram
Specifies the swim lanes to display in the Swim Lane diagram.
Swim Lanes NOT on Diagram
Specifies the swim lanes to not display in the Swim Lane diagram.
34 Design Guide

Organization Visualization
Add All
Specifies to move all the displayed swim lanes into the Swim Lanes on Diagram list.
Remove All
Specifies to move all the displayed swim lanes into the Swim Lanes NOT on Diagram list.
Bitmap display
Lets you specify each swim lane that you want to display as a bitmap.
Note: Swim Lane bitmaps apply only to Swim Lane diagrams based on a Role Group. Bitmaps do not apply to Swim Lane diagrams that you base on a text list UDP.
The Swim Lane diagram is added to the model using the diagram properties you defined in this wizard, and is opened in the diagram workspace.
Note: You can also drag and drop swim lanes between the Swim Lanes on Diagram tree and the Swim Lanes NOT on Diagram tree, and place them in any order that you need.
Movement of Objects in a Swim Lane Diagram
You can move objects in a Swim Lane diagram by clicking and dragging objects to the location that you want. You can change the order of swim lanes on your diagram from the Display tab of the Diagram Properties dialog.
You can also resize objects when you move the cursor over the object until you see a double-headed arrow, and then click and drag to resize.
Create an Organization Chart
Add an organization chart to any model to provide a graphical view of an organization's structure. You must first create the necessary role groups, roles, and resources in order to create an organization chart.
Additional DFD Features 35

Organization Visualization
To create an organization chart
1. Click Add Organization Chart from the Diagram menu.
The Organization Chart Wizard - Step 1 of 3 dialog opens.
2. Complete the following information in this dialog, and then click the Next button:
Name
Specifies the name of the new organization chart.
Role Group
Specifies the role group.
Click the Role Group Dictionary button to either add or edit a role group.
Note: When you open the Role Group Dictionary, the Organization Chart Wizard closes.
Role
Specifies the role.
Click the Role Dictionary to add or edit a role.
Note: When you open the Role Dictionary, the Organization Chart Wizard closes.
Resource
Specifies the resource.
Click the Resource Dictionary button to add or edit a resource.
Note: When you open the Resource Dictionary, the Organization Chart Wizard closes.
Author
(Optional) Specifies the organization chart author.
The Organization Chart Wizard - Step 2 of 3 opens.
36 Design Guide

Organization Visualization
3. Complete the following information in the dialog:
Role Group for the next level
Specifies the role group containing the roles for the second level of the organization chart.
Available Role / Resources
Specifies the role and resource combinations available for selection.
Click the role and resource combinations you require, and click Add to move it into the Selected Group/Role/Resources list.
Selected Group/Role/Resources
Specifies all the role and resource combinations that you moved from the Available Role / Resources list.
Select a role and resource combination in this list and click Remove to move the role and resource combination back into the Available Role / Resources list. To change the order of this list use the up and down arrow buttons.
Click Next.
The Organization Chart Wizard - Step 3 of 3 opens.
4. Select the following organization chart display and style options as needed for your environment, and then click Finish:
Drawing
Specifies the following drawing options:
Show boxes
Specifies to display roles as graphical boxes in the organization chart.
Show Role Group Name
Specifies to display the role group name in each organization chart box.
Show Role Name
Specifies to display the role name in each organization chart box.
Show Resource Name
Specifies to display the resource name in each organization chart box.
Border
Specifies the following border options:
Include Kit
Specifies to include the diagram kit in the organization chart.
Include title
Specifies to include the diagram title area in the organization chart.
Additional DFD Features 37

Organization Visualization
Box Size
Specifies the following box size options:
Fit each box to text
Enables automatic adjustment of each box to the amount of text in the box.
One size per row
Enables automatic adjustment of each box within any row to be the same size.
The box with the most amount of text is used to size all boxes in a row.
All one size
Enables automatic adjustment of each box in the organization chart to be the same size.
The box with the most amount of text is used to size each box in the organization chart.
Draw Style
Specifies the following draw style options:
Standard
Enables boxes in the organization chart to be drawn according to the options selected in the Drawing group box.
Bitmap
Enables role bitmaps in the organization chart boxes to be drawn.
You can view bitmaps in the organization chart only if you first assign bitmaps to roles in the Role Dictionary.
Shape
Enables role shapes in the organization chart boxes to be drawn.
You can view shapes in the organization chart only if you first assign shapes to roles in the Role Dictionary.
Your organization chart opens in the diagram workspace.
Note: You can change any of these options later in the Style tab in the Organization Chart Properties dialog.
38 Design Guide

Organization Visualization
Move Organization Chart Objects
You can move objects in an organization chart by clicking and dragging objects right on the diagram workspace.
To move objects in an organization chart
1. Click Open from the File menu and select the model that contains the organization chart that you need to edit.
The model opens in the diagram workspace.
2. Open the organization chart that you need to edit, single-click each object, drag it to its new location in the organization chart, and then release the mouse button.
Note: The cursor changes to a thick black arrow to show you when you can release the mouse button.
The object appears in its new location.
Example: Organization Chart Object Movement
In the following illustration, the organization chart object Sales Assistant--Joe Russo needs to be moved from Operations Manager--Lisa Elliot to Sales Manager--George White:
Additional DFD Features 39

Organization Visualization
Example: Organization Chart Object Movement Completion
In the following illustration, the movement of the organization chart object Sales Assistant--Joe Russo from Operations Manager--Lisa Elliot to Sales Manager--George White was completed:
40 Design Guide

Index
A activity decomposition • 22 arrows • 10, 21
D data flow diagram
data flow diagram, creating • 15, 16 data flow diagram, defined • 7 data flow diagram, example • 16
data store data store, data flow diagram • 9, 18
DFD model DFD model, creating • 15, 16 DFD model, defined • 7 DFD model, example • 16
E external reference
external reference, data flow diagram • 9, 19
M modeling methods
modeling methods, DFD • 7
O organization charts • 28, 35
S swim lane diagrams • 27, 34
Index 41