
Allan Fulton Irrigation and Water Resources Advisor ...
25
Allan Fulton Irrigation and Water Resources Advisor University of California Cooperative Extension Tehama, Glenn, Colusa, and Shasta Counties [email protected] 1
Transcript of Allan Fulton Irrigation and Water Resources Advisor ...

Allan FultonIrrigation and Water Resources AdvisorUniversity of California Cooperative ExtensionTehama, Glenn, Colusa, and Shasta [email protected]
1

Provide background information regarding the establishment of the Tehama Colusa Canal Authority (TCCA)
Explain how the TCCA supports sustainable groundwater conditions through conjunctive water use
2

It’s Construction Sacramento River
Division Central Valley Project
Authorized 1950 (President Truman)
Reaches 111 miles Total – 140 miles of
canals and service outlets Corning Canal finished
1959 TCC constructed in eight
reaches (phases) TCC finished in 1980
3

Today Spans four counties 17 Central Valley
Project contractors Joint Powers Authority $250 million annually
in crop revenues $1 billion annual
contribution to the regional economy
4
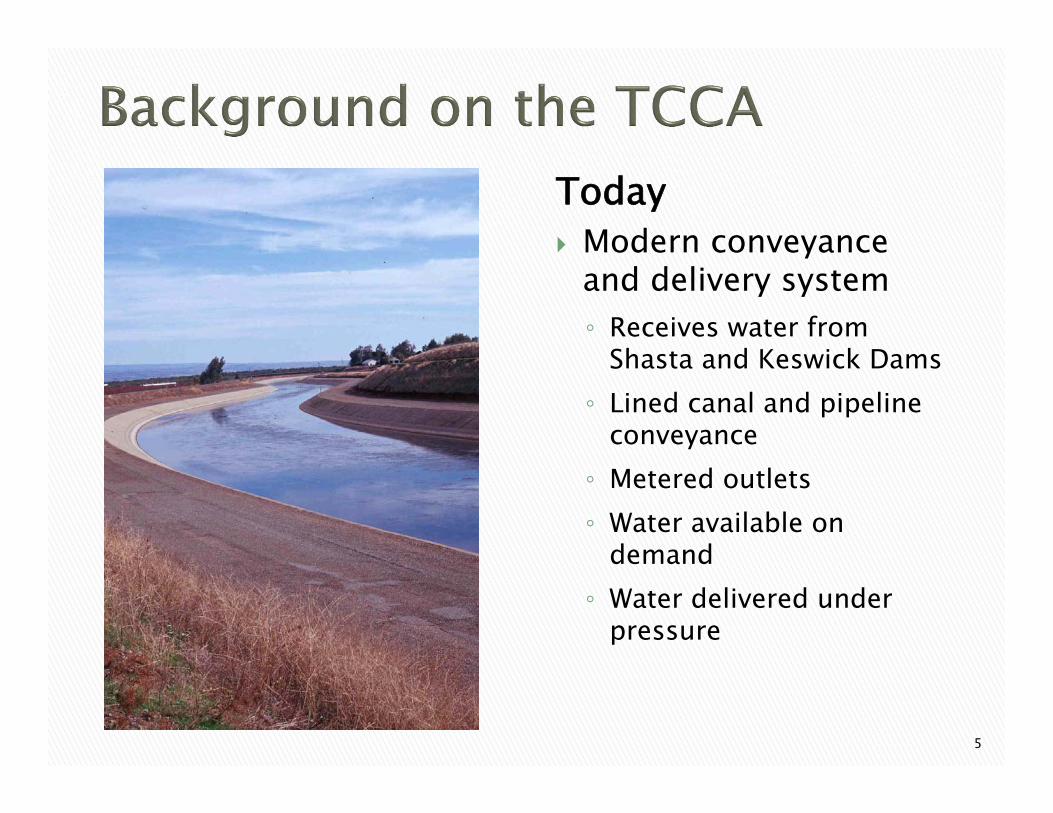
Today Modern conveyance
and delivery system◦ Receives water from
Shasta and Keswick Dams◦ Lined canal and pipeline
conveyance ◦ Metered outlets◦ Water available on
demand◦ Water delivered under
pressure
5
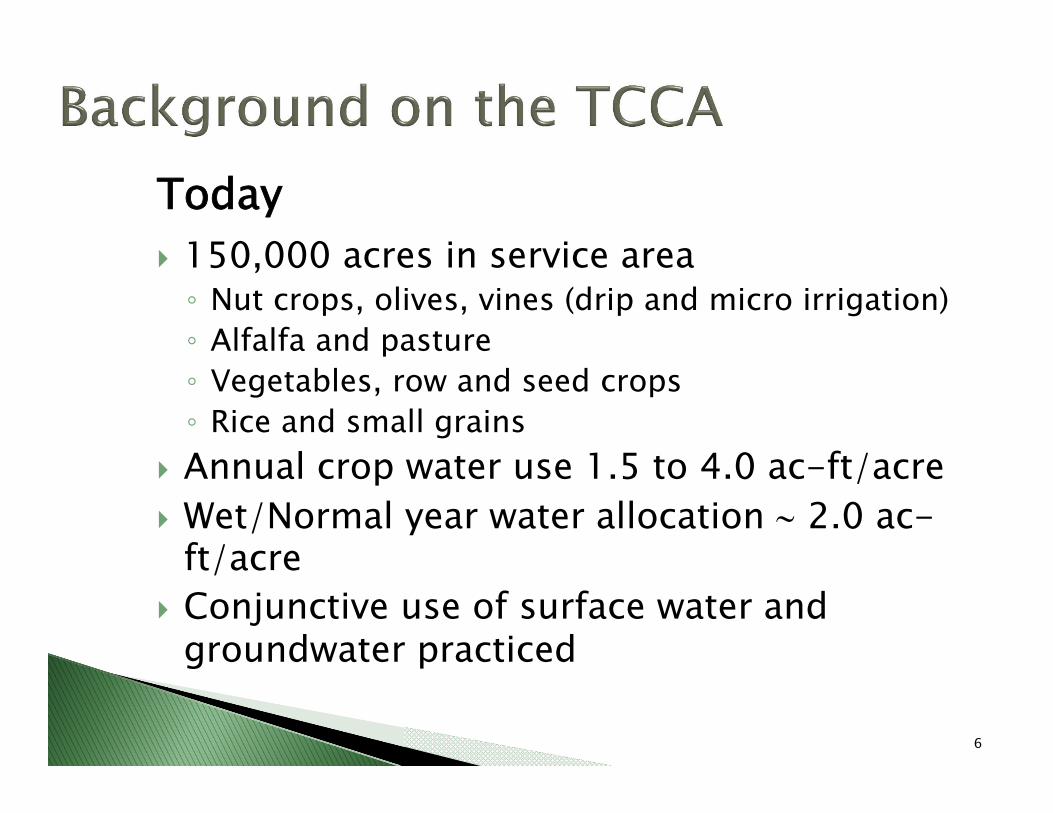
Today 150,000 acres in service area◦ Nut crops, olives, vines (drip and micro irrigation)◦ Alfalfa and pasture◦ Vegetables, row and seed crops◦ Rice and small grains
Annual crop water use 1.5 to 4.0 ac-ft/acre Wet/Normal year water allocation 2.0 ac-
ft/acre Conjunctive use of surface water and
groundwater practiced
6

What is conjunctive water use ?
A water resource management approach that recognizes a natural hydrologic connection between surface water and groundwater and tries to understand and utilize it so the overall water supply is used more efficiently.
Using surface and groundwater together◦ Improve availability and
reliability◦ Manage water supplies for
multiple beneficial uses◦ Economical and practical
Small to large scale Short, annual, or long
cycle Involves balancing
groundwater recharge and extraction (recovery)
Natural and/or active
7

Groundwater extraction (pumping)◦ Substantial acreage under drip and microirrigation
In-lieu recharge◦ Substitute surface water for groundwater and reduce
extraction Groundwater recharge◦ Percolation of surface water from flood or furrow
irrigation◦ Percolation from conveyance facilities (relatively low for
TCC)
8
9

0
10
20
30
40
50
60
70
80
90223
233
243
253
263
273
283
293
303
313
Mar
-73
Mar
-75
Mar
-77
Mar
-79
Mar
-81
Mar
-83
Mar
-85
Mar
-87
Mar
-89
Mar
-91
Mar
-93
Mar
-95
Mar
-97
Mar
-99
Mar
-01
Mar
-03
Mar
-05
Mar
-07
Mar
-09
Mar
-11
Mar
-13
Water Surface Elevation and Depth for State Well Number 24N03W17M001M (West of Corning)
Depth
to Water (ft.)
Measurement Date
Ground Surface Elevation 313 ft above sea level
25 feet increase in groundwater
level.
10

-100
-90
-80
-70
-60
-50
-40
-30
-20
-10
0
100
110
120
130
140
150
160
170
180
190
Mar
-73
Mar
-76
Mar
-79
Mar
-82
Mar
-85
Mar
-88
Mar
-91
Mar
-94
Mar
-97
Mar
-00
Mar
-03
Mar
-06
Mar
-09
Mar
-12
Elev
atio
n (ft
. abo
ve s
ea le
vel)
Measurement Date
Ground Surface Elevation 189.5 ft above sea level
Water Surface Elevation and Depth for State Well Number 20N04W12F002M. (West of Artois)
Depth
to Water (ft.)
60 feet increase in groundwater
level.
11

-90
-80
-70
-60
-50
-40
-30
-20
-10
0
80
90
100
110
120
130
140
150
160
170
Mar
-65
Mar
-68
Mar
-71
Mar
-74
Mar
-77
Mar
-80
Mar
-83
Mar
-86
Mar
-89
Mar
-92
Mar
-95
Mar
-98
Mar
-01
Mar
-04
Mar
-07
Mar
-10
Mar
-13
Elev
atio
n (ft
. abo
ve s
ea le
vel)
Measurement Date
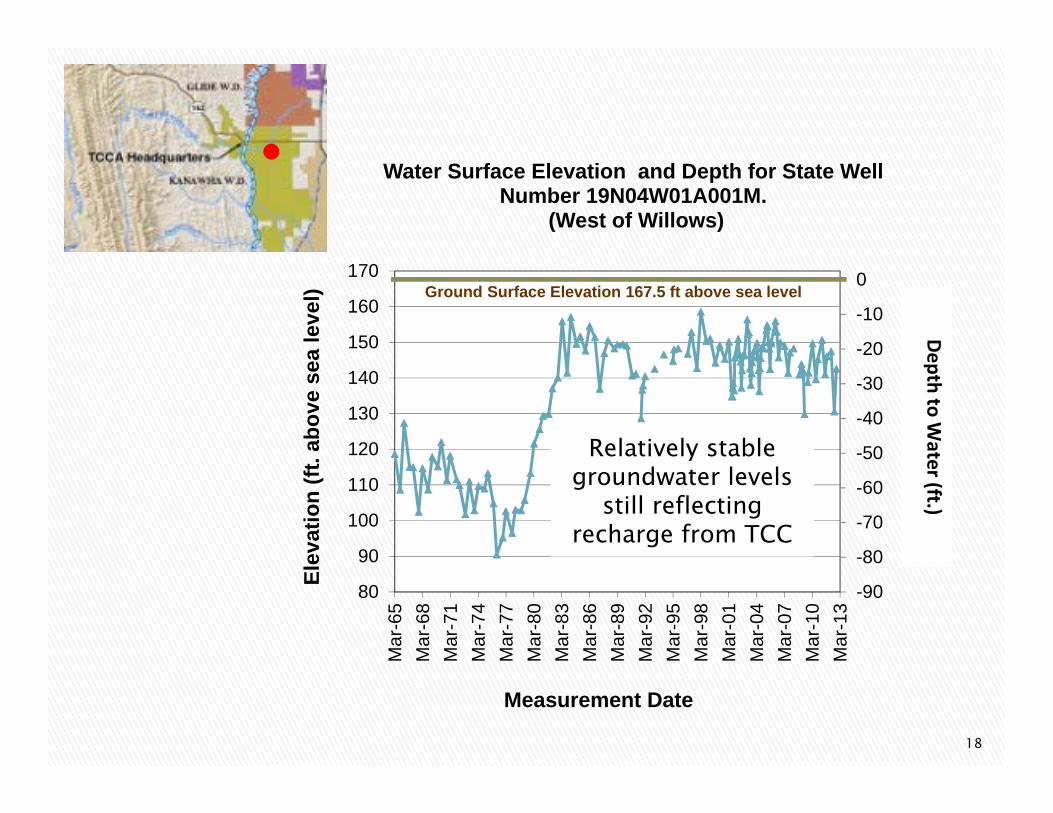
Water Surface Elevation and Depth for State Well Number 19N04W01A001M.
(West of Willows)
Ground Surface Elevation 167.5 ft above sea level
Depth
to Water (ft.)
50 feet increase in groundwater
level.
12

01020304050607080901001101201301401501601701806
162636465666768696
106116126136146156166176186
Mar
-65
Mar
-68
Mar
-71
Mar
-74
Mar
-77
Mar
-80
Mar
-83
Mar
-86
Mar
-89
Mar
-92
Mar
-95
Mar
-98
Mar
-01
Mar
-04
Mar
-07
Mar
-10
Mar
-13
Depth
to Water (ft.)
Measurement Date
Water Surface Elevation and Depth for State Well Number 13N02W04G001M (West of Arbuckle)
Ground Surface Elevation 186 ft above sea level
40 feet increase in groundwater
level.
13
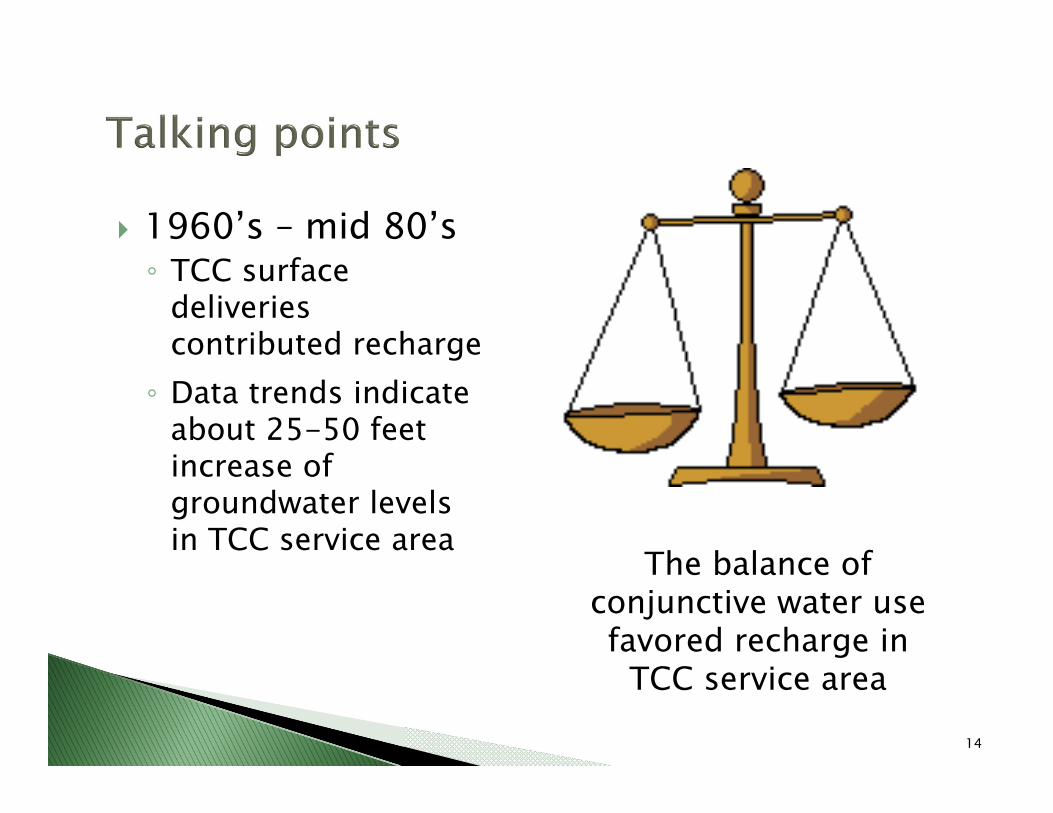
1960’s – mid 80’s◦ TCC surface
deliveries contributed recharge◦ Data trends indicate
about 25-50 feet increase of groundwater levels in TCC service area
The balance of conjunctive water use favored recharge in
TCC service area
14
15

0
10
20
30
40
50
60
70
80
90223
233
243
253
263
273
283
293
303
313
Mar
-73
Mar
-75
Mar
-77
Mar
-79
Mar
-81
Mar
-83
Mar
-85
Mar
-87
Mar
-89
Mar
-91
Mar
-93
Mar
-95
Mar
-97
Mar
-99
Mar
-01
Mar
-03
Mar
-05
Mar
-07
Mar
-09
Mar
-11
Mar
-13
Water Surface Elevation and Depth for State Well Number24N03W17M001M (West of Corning)
Depth
to Water (ft.)
Measurement Date
Ground Surface Elevation 313 ft above sea level
Groundwater levels gradually declining since late 1980’s. New lows?
16

-100
-90
-80
-70
-60
-50
-40
-30
-20
-10
0
100
110
120
130
140
150
160
170
180
190
Mar
-73
Mar
-76
Mar
-79
Mar
-82
Mar
-85
Mar
-88
Mar
-91
Mar
-94
Mar
-97
Mar
-00
Mar
-03
Mar
-06
Mar
-09
Mar
-12
Elev
atio
n (ft
. abo
ve s
ea le
vel)
Measurement Date
Ground Surface Elevation 189.5 ft above sea level
Water Surface Elevation and Depth for State Well Number 20N04W12F002M. (West of Artois)
Depth
to Water (ft.)
Groundwater levels indicate more variability
and reflect effect of drought and other
factors. Declining in last decade.
17
-90
-80
-70
-60
-50
-40
-30
-20
-10
0
80
90
100
110
120
130
140
150
160
170
Mar
-65
Mar
-68
Mar
-71
Mar
-74
Mar
-77
Mar
-80
Mar
-83
Mar
-86
Mar
-89
Mar
-92
Mar
-95
Mar
-98
Mar
-01
Mar
-04
Mar
-07
Mar
-10
Mar
-13
Elev
atio
n (ft
. abo
ve s
ea le
vel)
Measurement Date
Water Surface Elevation and Depth for State Well Number 19N04W01A001M.
(West of Willows)
Ground Surface Elevation 167.5 ft above sea level
Depth
to Water (ft.)
Relatively stable groundwater levels
still reflecting recharge from TCC
18

01020304050607080901001101201301401501601701806
162636465666768696
106116126136146156166176186
Mar
-65
Mar
-68
Mar
-71
Mar
-74
Mar
-77
Mar
-80
Mar
-83
Mar
-86
Mar
-89
Mar
-92
Mar
-95
Mar
-98
Mar
-01
Mar
-04
Mar
-07
Mar
-10
Mar
-13
Depth
to Water (ft.)
Measurement Date
Water Surface Elevation and Depth for State Well Number 13N02W04G001M (West of Arbuckle)
Ground Surface Elevation 186 ft above sea level
Groundwater levels declining since about
2000. New lows?
19
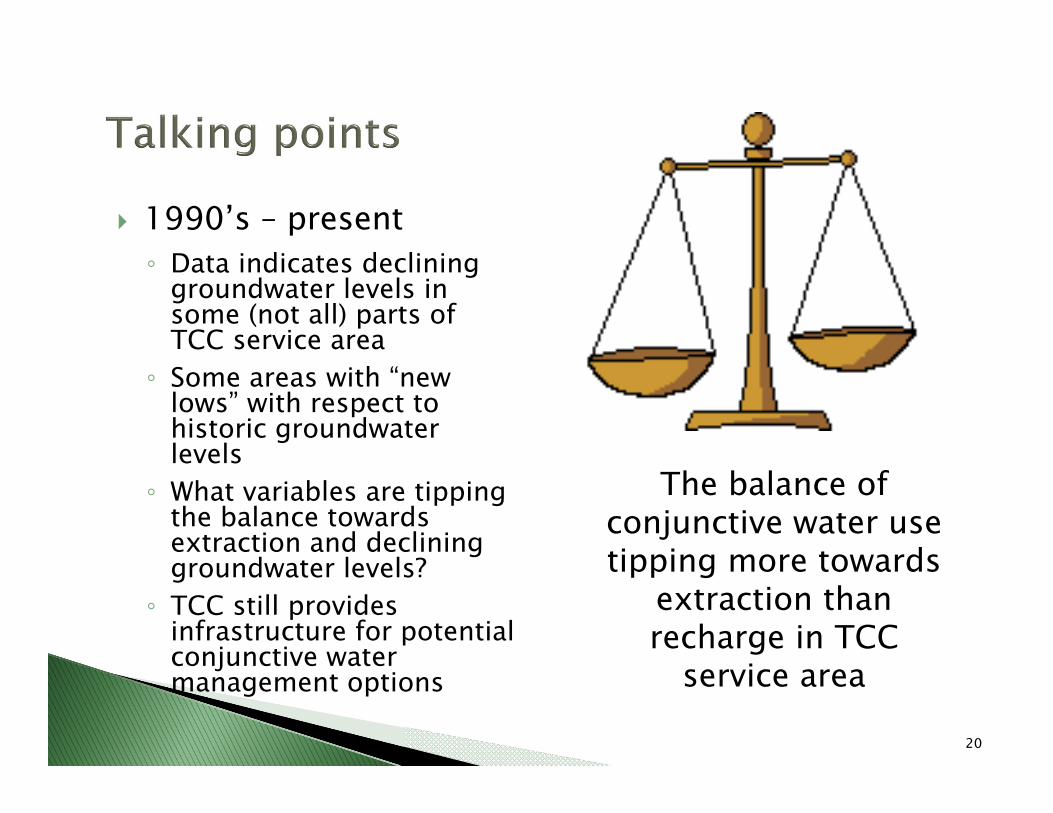
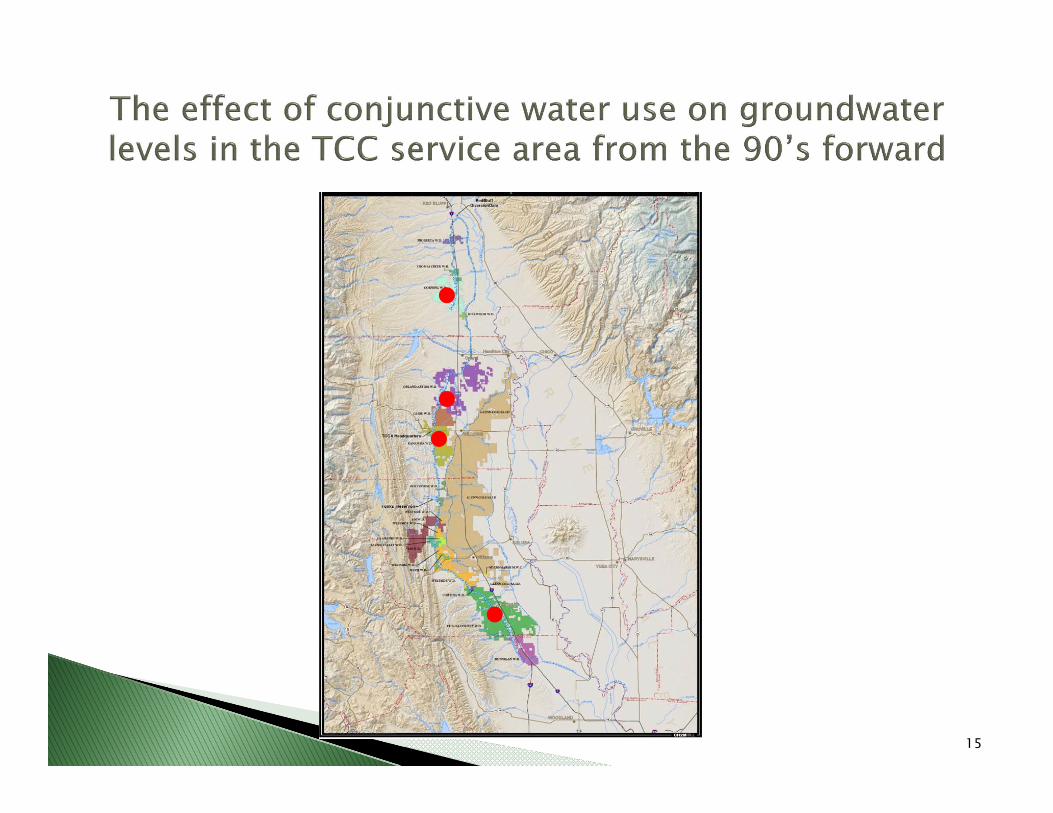
1990’s – present◦ Data indicates declining
groundwater levels in some (not all) parts of TCC service area
◦ Some areas with “new lows” with respect to historic groundwater levels
◦ What variables are tipping the balance towards extraction and declining groundwater levels?
◦ TCC still provides infrastructure for potential conjunctive water management options
The balance of conjunctive water use tipping more towards
extraction than recharge in TCC
service area
20
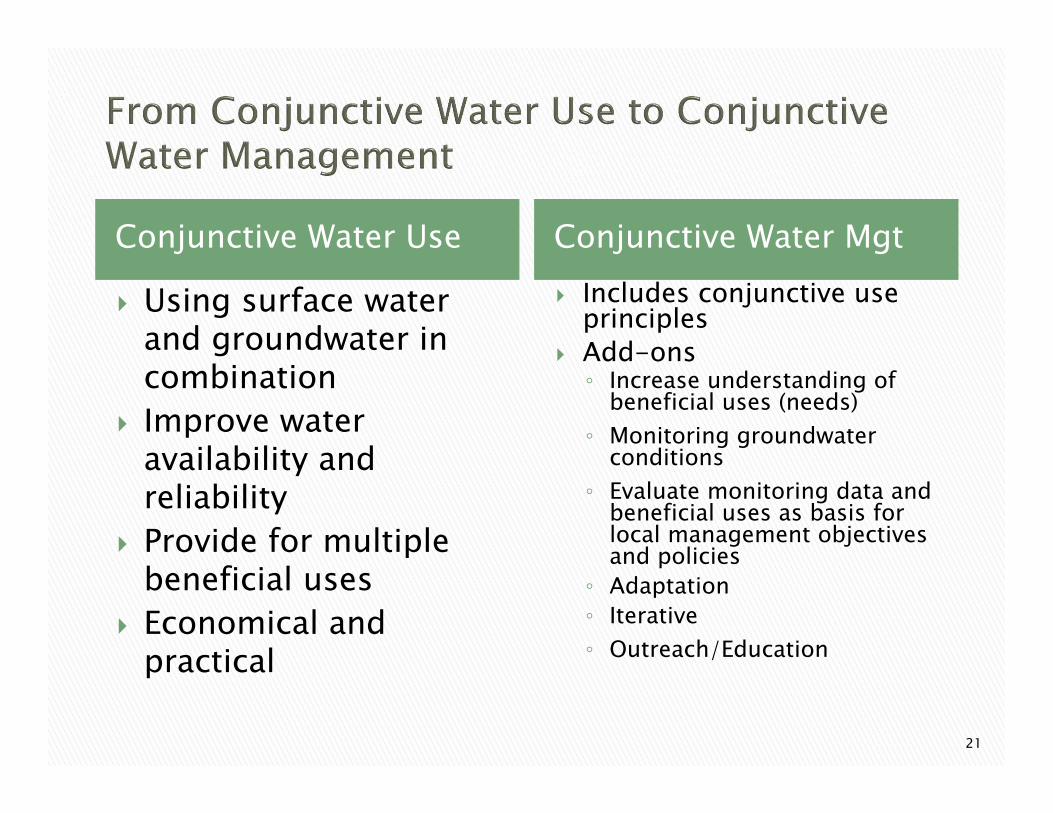
Conjunctive Water Use Conjunctive Water Mgt
Using surface water and groundwater in combination
Improve water availability and reliability
Provide for multiple beneficial uses
Economical and practical
Includes conjunctive use principles
Add-ons◦ Increase understanding of
beneficial uses (needs)◦ Monitoring groundwater
conditions◦ Evaluate monitoring data and
beneficial uses as basis for local management objectives and policies
◦ Adaptation◦ Iterative◦ Outreach/Education
21

0102030405060708090100110120130140147.5
157.5167.5177.5187.5197.5207.5217.5227.5237.5247.5257.5267.5277.5287.5
Nov
-73
Nov
-75
Nov
-77
Nov
-79
Nov
-81
Nov
-83
Nov
-85
Nov
-87
Nov
-89
Nov
-91
Nov
-93
Nov
-95
Nov
-97
Nov
-99
Nov
-01
Nov
-03
Nov
-05
Nov
-07
Nov
-09
Nov
-11
Measurement Date
Water Surface Elevation and Depthfor State Well Number 22N03W30C001M
Ground Surface Elevation 287.5 feet above sea level
Depth
to Water (ft.)
Current Stage 1 & 2 Alert levels
Current Stage 3 Alert level
22
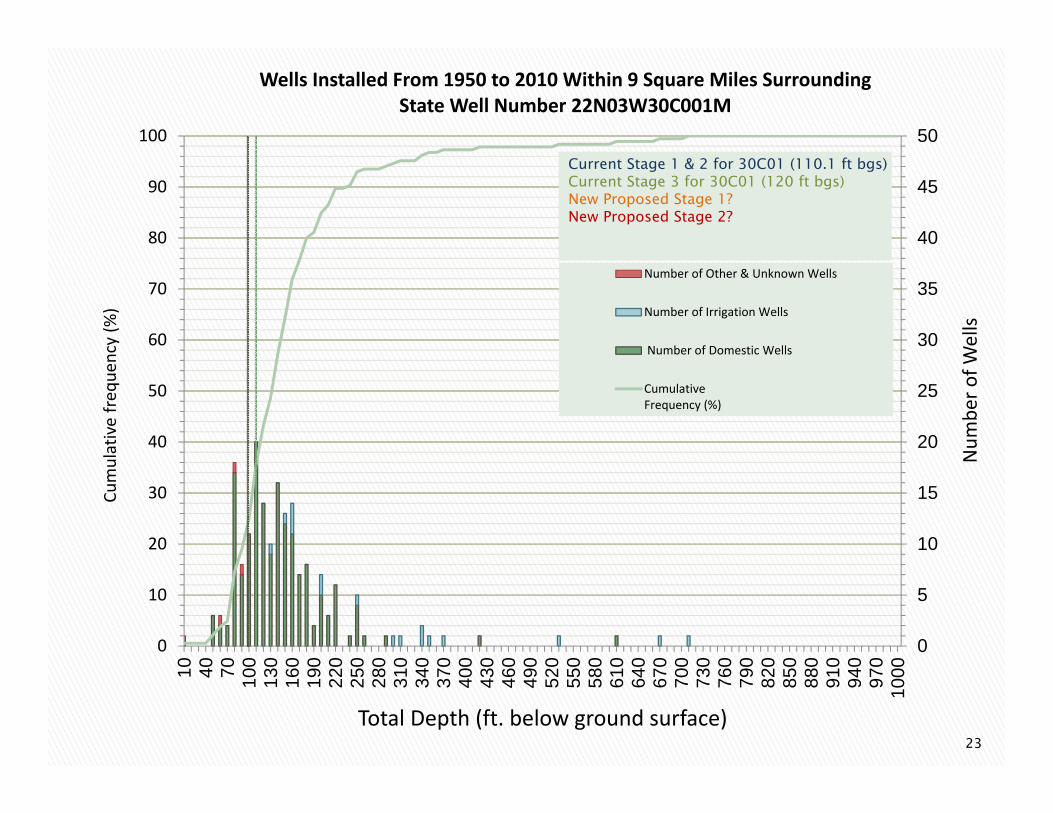
Example Basin Management Objective (BMO) in Glenn County and consideration of more than
one beneficial use
0
10
20
30
40
50
60
70
80
90
100
10 40 70 100
130
160
190
220
250
280
310
340
370
400
430
460
490
520
550
580
610
640
670
700
730
760
790
820
850
880
910
940
970
1000
0
5
10
15
20
25
30
35
40
45
50Cu
mulative freq
uency (%
)
Total Depth (ft. below ground surface)
Num
ber o
f Wells
Wells Installed From 1950 to 2010 Within 9 Square Miles Surrounding State Well Number 22N03W30C001M
Number of Other & Unknown Wells
Number of Irrigation Wells
Number of Domestic Wells
CumulativeFrequency (%)
Current Stage 1 & 2 for 30C01 (110.1 ft bgs)Current Stage 3 for 30C01 (120 ft bgs)New Proposed Stage 1?New Proposed Stage 2?
23

Portrayal of well density in Butte and Tehama Counties
Challenges to conjunctive water management◦ Providing for multiple beneficial uses◦ Balancing utilization of water to
support thriving economies with preservation of water and natural resources
Leading variables influencing conjunctive water management◦ Competition for surface water
Sources for local management Sources for export
◦ Drought◦ Local land use changes and planning◦ Capacity to engage in monitoring, data
evaluation, local oversight, and decision making Trust and commitment to local water management Institutional and economic barriers
◦ Others?
Butte County
TehamaCounty
24