All-Cause Costs Increase Exponentially with … AMERICAN JOURNAL OF MANAGED CARE® Supplement VOL....
16
June 2017 Vol. 23 • No. 10, Sup. All-Cause Costs Increase Exponentially with Increased Chronic Kidney Disease Stage Supplement to The American Journal of Managed Care ® © 2017 Clinical Care Targeted Communications Group, LLC › Cost as it Relates to Stages of Chronic Kidney Disease › Economic Burden of Chronic Kidney Disease › Readmission as Cost Driver HIGHLIGHTS SUPPLEMENT THE AMERICAN JOURNAL OF MANAGED CARE ® ®
-
Upload
trankhuong -
Category
Documents
-
view
215 -
download
1
Transcript of All-Cause Costs Increase Exponentially with … AMERICAN JOURNAL OF MANAGED CARE® Supplement VOL....
June 2017
Vol. 23 • No. 10, Sup.
All-Cause Costs Increase Exponentially with Increased Chronic Kidney Disease Stage
Supplement to The American Journal of Managed Care® © 2017 Clinical Care Targeted Communications Group, LLC
› Cost as it Relates to Stages of Chronic Kidney Disease
› Economic Burden of Chronic Kidney Disease
› Readmission as Cost Driver
HIGHLIGHTS
S U P P L E M E N TTHE AMERICAN JOURNAL OF MANAGED CARE®
®
JUNE 2017 www.ajmc.com
All-Cause Costs Increase Exponentially with Increased Chronic Kidney Disease Stage
This supplement was sponsored by Relypsa, Inc., a Vifor Pharma Company. Medical writing support was provided by Impact Communication Partners, Inc, New York, NY.
Opinions expressed by authors, contributors, and advertisers are their own and not necessarily those of Clinical Care Targeted Communications Group, LLC, the editorial staff, or any member of the editorial advisory board. Clinical Care Targeted Communications Group, LLC, is not responsible for accuracy of dosages given in articles printed herein. The appearance of advertisements in this publication is not a warranty, endorsement, or approval of the products or services advertised or of their effectiveness, quality, or safety. Clinical Care Targeted Communications Group, LLC, disclaims responsibility for any injury to persons or property resulting from any ideas or products referred to in the articles or advertisements.

THE AMERICAN JOURNAL OF MANAGED CARE® Supplement VOL. 23, NO. 10 S161
All-Cause Costs Increase Exponentially with Increased Chronic Kidney Disease Stage
TABLE OF CONTENTS
Participating Faculty S162
Report
All-Cause Costs Increase Exponentially with Increased Chronic Kidney Disease Stage S163
Ladan Golestaneh, MD, MS; Paula J. Alvarez, RPh, MPH, MBA; Nancy L. Reaven, MA; Susan E. Funk, MBA, FACHE; Karen J. McGaughey, PhD; Alain Romero, PhD; Melanie S. Brenner, PharmD, BCPS; and Macaulay Onuigbo, MD, MSc, MBA
A Supplement to The American Journal of Managed Care® PROJ A777
OVERVIEW
This supplement to TheAmerican Journal of Managed Care® evaluates the cost of chronic kidney disease on US health plans, and how the eco-nomic burden increases with each stage of chronic kidney disease.
June 2017
Vol. 23 • No. 10, Sup.
S U P P L E M E N TTHE AMERICAN JOURNAL OF MANAGED CARE®
®

S162 JUNE 2017 www.ajmc.com
FA C U LT Y &DISCLOSURE
Signed disclosures are on file at the office of The American Journal of Managed Care®, Cranbury, New Jersey.
FACULTYPaula J. Alvarez, RPh, MPH, MBADirectorManaged Care Health Outcomes - EastRelypsa, Inc., a Vifor Pharma CompanyRedwood City, CA
Melanie S. Brenner, PharmD, BCPSHealth Economics and Outcomes Research
LiaisonOpko Health, IncMiami, FL
Susan E. Funk, MBA, FACHESenior Vice President of Data AnalyticsStrategic Health ResourcesLa Cañada, CA
Ladan Golestaneh, MD, MSAssociate Professor of Clinical MedicineDepartment of Medicine (Nephrology);Director of ESRD ServicesMontefiore Medical CenterAlbert Einstein College of MedicineBronx, NY
Karen J. McGaughey, PhDProfessorDepartment of StatisticsCalifornia Polytechnic State UniversitySan Luis Obispo, CA
Macaulay Onuigbo, MD, MSc, MBAAssociate Profesor of MedicineMayo ClinicRochester, MN;Attending NephrologistMayo Clinic Health System;ProfessorCollege of BusinessUniversity of Wisconsin MBA ConsortiumEau Claire, WI
Nancy L. Reaven, MAPresidentStrategic Health ResourcesLa Cañada, CA
Alain Romero, PhDVP, Head of Medical & Scientific AffairsRelypsa, Inc., a Vifor Pharma CompanyRedwood City, CA
FACULTY DISCLOSURESThese faculty report relationships with the following organizations:
Paula J. Alvarez, RPh, MPH, MBAEMPLOYMENTRelypsa, Inc., a Vifor Pharma Company which has a product that treats hyperkalemia
Melanie S. Brenner, PharmD, BCPSEMPLOYMENTPreviously employed by Relypsa, Inc., a Vifor Pharma Company which has a product that treats hyperkalemia
Susan E. Funk, MBA, FACHECONSULTANCY OR PAID ADVISORY BOARDSRelypsa, Inc., a Vifor Pharma Company, through contract with Strategic Health Resources, Inc
RECEIPT OF PAYMENT FOR INVOLVEMENT IN THE PREPARATION OF THIS MANUSCRIPTAnalysis presented in the manuscript was funded by Relypsa, Inc., a Vifor Pharma Company
Ladan Golestaneh, MD, MSMEETING/CONFERENCE ATTENDANCERelypsa, Inc., a Vifor Pharma Company
Karen J. McGaughey, PhDCONSULTANCY OR PAID ADVISORY BOARDSRelypsa, Inc., a Vifor Pharma Company, through contract with Strategic Health Resources, Inc
RECEIPT OF PAYMENT FOR INVOLVEMENT IN THE PREPARATION OF THIS MANUSCRIPTStatistical consulting fees from Strategic Health Resources, Inc
Macaulay Onuigbo, MD, MSc, MBAHONORARIARelypsa, Inc., a Vifor Pharma Company
LECTURE FEES FOR SPEAKING AT THE INVITATION OF CORPORATE SPONSORRelypsa, Inc., a Vifor Pharma Company
Nancy L. Reaven, MACONSULTANCY OR PAID ADVISORY BOARDSRelypsa, Inc., a Vifor Pharma Company, through contract with Strategic Health Resources, Inc
RECEIPT OF PAYMENT FOR INVOLVEMENT IN THE PREPARATION OF THIS MANUSCRIPTStatistical consulting fees from Strategic Health Resources, Inc
Alain Romero, PhDEMPLOYMENTRelypsa, Inc., a Vifor Pharma Company, which has a product that treats hyperkalemia
EDITORIAL & PRODUCTION
Senior Vice President, Managed MarketsJeff Prescott, PharmD
Clinical Team LeadMichael R. Page, PharmD, RPh
Senior Clinical Projects ManagerIda Delmendo
Clinical Projects ManagerMichelle LaPlante
Project ManagerJessica Toye
Copy ChiefJennifer Potash
Copy EditorMaggie Shaw
Clinical Assistant EditorAngelia Szwed
Assistant EditorJessica Kinsella
DesignerJulianne Costello
SALES & MARKETING
Senior National Account Manager Gabrielle Consola
National Account Managers Michael CostellaElise Maier
OPERATIONS & FINANCE
Vice President of FinanceLeah Babitz, CPA
Accountant Katherine Wyckoff
Circulation DirectorJonathan Severn
CORPORATE
Chairman and CEOMike Hennessy, Sr
Vice Chairman Jack Lepping
PresidentMike Hennessy, Jr
Chief Financial Officer Neil Glasser, CPA/CFE
Chief Marketing OfficerWarren Dardine
Chief Digital Strategy OfficerSteve Ennen
Vice President of Editorial Services and Production Kerrie Keegan
Vice President of Digital MediaJung Kim
Chief Creative OfficerJeff Brown
Director of Human ResourcesShari Lundenberg
Copyright © 2017 by Clinical Care Targeted Communications Group, LLC
THE AMERICAN JOURNAL OF MANAGED CARE® Supplement VOL. 23, NO. 10 S163
C hronic kidney disease (CKD) is a common disorder
and has become a major public health concern in the
United States, affecting an estimated 13.6% of the adult
population.1,2 Simulation models predict that CKD
prevalence in adults aged ≥30 years will increase to 14.4% by 2020
and 16.7% by 2030.3 CKD patients, even in early disease stages, carry
a disproportionate burden of cardiovascular morbidity, mortality,
healthcare utilization, and costs.4-10
The economic burden of CKD is substantial. According to the
US Renal Data System, in 2013 among fee-for-service Medicare
patients, total medical costs were $50.4 billion for CKD (excluding
end-stage renal disease [ESRD]), and another $30.9 billion for the
ESRD patient population.2 In multiple studies, costs for CKD patients
were higher than for those without CKD, matched for age and
comorbidity, with costs increasing by disease stage and presence
of comorbid diabetes mellitus (DM).11-14 Data from commercial
insurance databases show that both inpatient (IP) and outpatient
(OP) costs contribute significantly to total CKD costs.11
Clinical practice guidelines published by the National Kidney
Foundation–Kidney Disease Outcomes Quality Initiative, and
more recently by Kidney Disease: Improving Global Outcomes,
classify CKD by its stage of severity and provide specific therapeutic
recommendations for reducing disease progression.15-17 Several
interventions addressing potentially modifiable risk factors have
been associated with decreased healthcare utilization in the CKD
population, including use of renin-angiotensin-aldosterone
inhibitors (RAASis), correction of volume overload, and proper
nutrition.12,18 However, rates of attainment of recommended blood
pressure targets and other treatment goals remain low.19,20
In this study, we used a large electronic medical records (EMR)
database to evaluate all-cause costs, as well as factors contributing to
costs, at progressive CKD stages. We hypothesized that all-cause costs
increase by CKD stage, and we hoped to identify major cost drivers to
recognize opportunities for cost reductions. We further hypothesized
that other factors, such as hyperkalemia, may contribute to cost
independently through increased and repeated laboratory testing, more
frequent provider office visits, as well as subsequent hospitalizations.
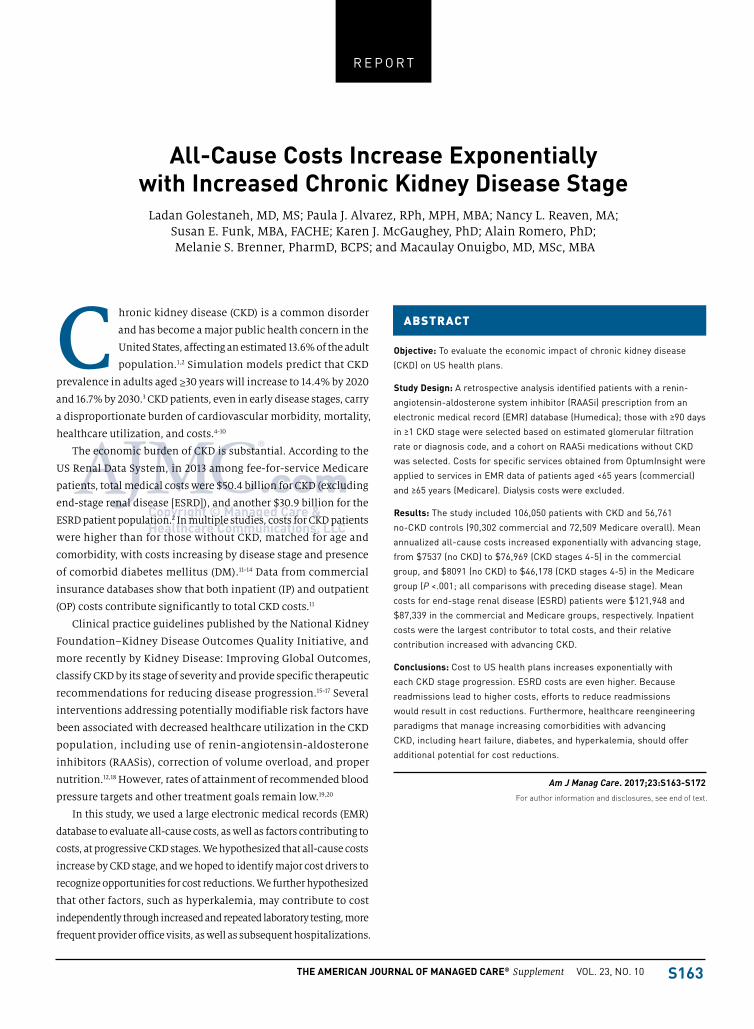
Objective: To evaluate the economic impact of chronic kidney disease
(CKD) on US health plans.
Study Design: A retrospective analysis identified patients with a renin-
angiotensin-aldosterone system inhibitor (RAASi) prescription from an
electronic medical record (EMR) database (Humedica); those with ≥90 days
in ≥1 CKD stage were selected based on estimated glomerular filtration
rate or diagnosis code, and a cohort on RAASi medications without CKD
was selected. Costs for specific services obtained from OptumInsight were
applied to services in EMR data of patients aged <65 years (commercial)
and ≥65 years (Medicare). Dialysis costs were excluded.
Results: The study included 106,050 patients with CKD and 56,761
no-CKD controls (90,302 commercial and 72,509 Medicare overall). Mean
annualized all-cause costs increased exponentially with advancing stage,
from $7537 (no CKD) to $76,969 (CKD stages 4-5) in the commercial
group, and $8091 (no CKD) to $46,178 (CKD stages 4-5) in the Medicare
group (P <.001; all comparisons with preceding disease stage). Mean
costs for end-stage renal disease (ESRD) patients were $121,948 and
$87,339 in the commercial and Medicare groups, respectively. Inpatient
costs were the largest contributor to total costs, and their relative
contribution increased with advancing CKD.
Conclusions: Cost to US health plans increases exponentially with
each CKD stage progression. ESRD costs are even higher. Because
readmissions lead to higher costs, efforts to reduce readmissions
would result in cost reductions. Furthermore, healthcare reengineering
paradigms that manage increasing comorbidities with advancing
CKD, including heart failure, diabetes, and hyperkalemia, should offer
additional potential for cost reductions.
Am J Manag Care. 2017;23:S163-S172
For author information and disclosures, see end of text.
R E P O R T
All-Cause Costs Increase Exponentially with Increased Chronic Kidney Disease Stage
Ladan Golestaneh, MD, MS; Paula J. Alvarez, RPh, MPH, MBA; Nancy L. Reaven, MA; Susan E. Funk, MBA, FACHE; Karen J. McGaughey, PhD; Alain Romero, PhD; Melanie S. Brenner, PharmD, BCPS; and Macaulay Onuigbo, MD, MSc, MBA
ABSTRACT

S164 JUNE 2017 www.ajmc.com
R E P O R T
METHODS
Study Population and CohortsWe queried the Humedica (Boston, Massachusetts) database EMRs
covering approximately 7 million patients during 2007 to 2012 and
selected patients with ≥1 RAASi prescription before July 1, 2009 (index
date).21 Study patients were persons receiving care from providers in
integrated health delivery networks across the United States, includ-
ing those insured by private insurance, Medicare, Medicaid, other
health insurance, or uninsured. The data were inclusive of services
provided in hospitals as well as office and OP care. Medication data
included written prescriptions and medication administrations
that occurred in-clinic and/or in-hospital. We required postindex
evidence of new, sustained, or progressive CKD (stages 2, 3a, 3b, or
4-5) or ESRD identified by estimated glomerular filtration rate (eGFR)
or diagnosis code (definitions in Supplementary Item S1). Patients
were included in the analysis of each postindex CKD stage lasting ≥90
days. Additionally, patients without evidence of CKD or ESRD during
the study period (2007-2012) and with ≥90 days of postindex data
were included as a no-CKD comparison group. Patients with ESRD
before the index date and those receiving the above-recommended
RAASi dosing at index were excluded from the current analyses.
Demographic and clinical characteristics (with the exception of
sex, race, and region) were evaluated for each patient at the onset of
each included CKD stage. Comorbidities were identified by single
occurrence of any indicator in pre-stage data using diagnosis codes,
laboratory values, or hypoglycemic medications (Supplementary
Item S2). RAASi prescriptions were classified by dose level at the
beginning of each CKD stage as “maximum” (recommended labeled
dose; see Supplementary Item S3), “submaximum” (any lesser
amount), or “discontinued” (>390 days elapsed since most recent
prescription). OP diuretic therapy during the 12-month period
before the stage start date was categorized hierarchically as loop
diuretic, other diuretic, or none. Visit frequency was characterized
as infrequent (0-1 visit) or frequent (≥2 visits) based on the number
of office/clinic visits in the 12-month period concluding each stage.
Patients were assigned by pre-index age to 2 categories for
modeling insurance coverage: Medicare (aged ≥65 years) and
commercial (aged <65 years, or unspecified).
Classification of Services and MedicationsIn the EMR data, healthcare services were grouped by calendar day
and classified as IP or emergency department (ED) visits or by type
of OP services. OP prescriptions were identified by generic name of
the primary ingredient, regardless of dose, brand, or formulation.
Cost of Services and Medications in Claims DataAverage health plan allowed cost was obtained from 2013 commercial
insurance and Medicare claims data (OptumInsight, Minneapolis, MN)
representing payments made by health insurers exclusive of patient
liability, as follows: per IP day for surgical and nonsurgical admissions
with various comorbidities; per visit for multiple types of hospital/
facility OP visits; per calendar day for physician services in office and
hospital; and per filled prescription (along with percent refills) for 120
medications accounting for approximately 75% of all postindex OP
prescriptions. Costs were normalized to 2016 US dollars at 3% per annum.
All-Cause Costs: Application Cost in Claims Data for Services and Prescriptions Identified in EMRAverage allowed cost per service in commercial and Medicare
insurance claims was applied to each service event occurring during
each CKD stage among patients in the commercial and Medicare
groups, respectively. Average cost per day of hospital care plus IP
physician care was applied to each IP day, distinguishing medical
and surgical admissions and patient comorbidities. The cost applied
to hospital OP and ED visits included both hospital and physician
services. Cost per visit was applied to each office, home health, or
laboratory visit. OP dialysis services in patients without evidence of
kidney transplant were excluded from ESRD costs due to significant
underrepresentation in the source data. Average cost per written
prescription, including initial fill of prescription and refills, was
applied to each evaluated medication; the average cost per prescrip-
tion of these drugs, weighted at actual usage in the data set, was
applied to prescriptions of drugs for which specific cost data were
not acquired. IP pharmacy costs were captured in the cost per IP day.
Descriptive AnalysesEach CKD stage (including no-CKD and ESRD) was analyzed separately
within the commercial and Medicare groups. The primary analysis
assessed mean annualized all-cause cost per patient in total for IP,
ED, and OP services, and for OP medications, comparing each CKD
stage with the preceding stage. In consideration of clinical interest in
hyperkalemia as a potential driver of avoidable cost, particularly in IP
admissions and readmissions, additional analyses were conducted on
this variable. A secondary analysis examined the frequency and cost
contribution of IP readmissions within 30 days, segmented by whether
or not hyperkalemia was identified during the original hospital stay.
The cost contribution of readmissions was evaluated as the percentage
of total IP costs derived from IP days in 30-day readmissions.
Statistical AnalysesAnalysis of variance was performed in a mixed model with repeated
measures to evaluate the statistical significance of observed differ-
ences in mean annualized total costs between each CKD stage and
the preceding stage by payer group. Multivariate regression assessed
predictors of cost within each CKD stage and payer group, with
minor exclusions (unknown/other region; RAASi above maximum
recommended dose; missing age/sex; kidney transplant patients in

THE AMERICAN JOURNAL OF MANAGED CARE® Supplement VOL. 23, NO. 10 S165
COSTS INCREASE WITH INCREASED CKD STAGE
ESRD). The dependent variable of total annualized cost + $1 during
each CKD stage and for the postindex period in the no-CKD cohort
was log-transformed due to skew. Independent variables, evaluated
with a stepwise selection procedure (alpha = .05), included age
(continuous), sex, region, all defined comorbidities (heart failure [HF],
DM, hypertension, cardiovascular disease [CVD], and hyperkalemia),
RAASi therapy (maximum or submaximum dose vs discontinued),
visit frequency (frequent/infrequent), and diuretics (loop/other/
none). Interaction terms (selected a priori for clinical significance)
included HF with hyperkalemia and RAASi therapy with specified
comorbidities (DM, CVD, hypertension, and hyperkalemia).
A post hoc analysis of the multiple regression findings compared
predicted annual cost of patients with and without hyperkalemia
by modeling costs associated with variables not involving hyper-
kalemia at their mean values in each payer group and CKD stage,
and variables involving hyperkalemia at their mean value among
comparator group patients who had hyperkalemia.
P values <.05 were considered significant. All statistical analyses
were performed using SAS/STAT software, version 9.2 (SAS Institute,
Cary, NC).
RESULTS
Patient Demographics and Clinical CharacteristicsThe study population included 162,811 individuals, including 106,050
patients analyzed in at least one stage of CKD or ESRD and 56,761
no-CKD controls. Of these, 90,302 were included in the commercial
group (mean age 53.7 years, 50% female, 61% from South region) and
72,509 were in the Medicare group (mean age 76.0 years, 58% female,
54% from South region) (Table). Patients in the no-CKD subgroup
were younger than those with CKD in both insurance groups. The
prevalence of all comorbidities except hypertension increased with
advancing CKD stage. There was an even more pronounced increase in
hyperkalemia, with 56% of commercial patients and 58% of Medicare
patients with CKD stages 4-5 experiencing hyperkalemia, and even
higher rates among ESRD patients. Across nearly all CKD stages, at
least 85% of patients had ≥2 office/clinic visits in the measured year.
Prescribing patterns of RAASi as well as type of diuretic therapy
differed by CKD stage but were comparable between the commercial
and Medicare groups (Table). Overall, 15% to 19% of patients with
CKD had been discontinued from RAASi therapy, with rates reaching
28% and 27% among ESRD patients in the commercial and Medicare
groups, respectively. Prescriptions for loop diuretics were more
common as CKD progressed.
Annualized Total Cost per Patient, by CKD StageTotal all-cause costs increased exponentially as CKD progressed in both
commercial and Medicare groups, with the slope of the cost increase
steeper in the commercial versus the Medicare cohort (Figure 1). For
patients aged <65 years, modeled at commercial insurance payment
rates, average annualized cost per patient rose 57% or more with each
CKD stage. Among patients aged ≥65 years, modeled at Medicare rates,
average annualized cost per patient climbed 68% or more as patients
progressed into CKD stages 4-5 or ESRD (excluding dialysis cost),
while increasing 45% or less with progression into stages 3a and 3b.
Commercial insurance costs exceeded Medicare costs in each CKD stage.
Cost by Medical Service Category in Each CKD StageThe drivers of increasing costs with advancing CKD were consistent
between commercial and Medicare patients (Figure 1). Rising IP
costs accounted for at least 80% of the cost increase observed
with disease progression into CKD stages 3b, 4-5, and ESRD, while
medications contributed ≤5% of the change at each of those stages.
The pattern differed in early-stage disease: between no-CKD and CKD
stage 2, medications accounted for 18% to 19% of the cost increase,
while OP costs accounted for 21% and 27% of the cost increase in
the commercial and Medicare groups, respectively.
Multivariate Analysis of Cost Predictors Multivariate regression within each payer by CKD stage evaluated
predictors of medical costs, which were largely consistent in pattern
between the commercial and Medicare cohorts (Table S1). Important
predictors of cost included office/clinic visit frequency ≥2 and
comorbidity status, especially CVD and HF, which were consistent
predictors of higher costs in each CKD stage as well as in ESRD. Diabetes
was a less powerful predictor of costs than most other comorbidities,
and it was omitted due to nonsignificance when evaluated in ESRD.
Interestingly, diagnosed hypertension was consistently associated
with lower costs in both populations. Continued RAASi therapy at
maximum or submaximum doses contributed modestly to lower
costs among patients with early-stage CKD, and to higher costs in
Medicare patients without CKD. The impact of gender on costs was
inconsistent across payers and disease stages.
A post hoc analysis using results of the multiple regressions
compared predicted annual cost of patients with and without a
history of hyperkalemia. Modeled costs were higher with a history
of hyperkalemia in all disease groups (P <.001 in all CKD stages;
P <.01 in ESRD) (Table S1). Annual costs for patients with a history of
hyperkalemia were 38% higher in CKD stages 4-5 and 57% higher in
ESRD compared with patients without hyperkalemia in the commercial
group; they were 22% and 26% higher, respectively, in the Medicare
group (Figure 2). In CKD stages 2, 3a, and 3b, a history of hyperkalemia
contributed 16% to 18% higher annual costs in commercial patients
and 7% to 11% higher annual costs in Medicare patients.
Costs of 30-Day Readmission RatesAs noted earlier, IP services were a major contributor to total costs
in each CKD stage. Notably, 30-day hospital readmission rates

S166 JUNE 2017 www.ajmc.com
R E P O R T
TABLE. Demographic and Baseline Characteristics by Commercial Group (A) and Medicare Group (B).
A. Commercial (aged <65 years)
CKD Stage: No-CKD Stage 2 Stage 3a Stage 3b Stages 4–5 ESRD Totala
N 52,175 28,540 6315 3963 3734 1197 90,302
Age, mean (SD)b 51.0 (9.17) 57.5 (7.05) 58.6 (7.00) 57.9 (7.42) 57.0 (8.01) 55.9 (9.04) 53.7 (8.98)
Gender, n (%)
Male 25,280 (48) 14,343 (50) 3511 (56) 2170 (55) 1954 (52) 624 (52) 45,086 (50)
Female 26,819 (51) 14,069 (49) 2766 (44) 1762 (44) 1732 (46) 562 (47) 44,930 (50)
Race, n (%)
African American 4865 (9) 5052 (18) 1365 (22) 876 (22) 894 (24) 316 (26) 12,138 (13)
Caucasian 28,486 (55) 14,003 (49) 2789 (44) 1713 (43) 1461 (39) 421 (35) 46,535 (52)
Other/Unknown 18,824 (36) 9485 (33) 2161 (34) 1374 (35) 1379 (37) 460 (38) 31,629 (35)
Comorbidities, n (%)
Diabetes 16,692 (32) 11,962 (42) 3465 (55) 2459 (62) 2458 (66) 815 (68) 34,135 (38)
Heart Failure 1489 (3) 2011 (7) 825 (13) 800 (20) 1049 (28) 398 (33) 5320 (6)
Cardiovascular Disease 11,958 (23) 10,718 (38) 3033 (48) 2190 (55) 2357 (63) 813 (68) 27,728 (31)
Hypertension 45,001 (86) 26,377 (92) 5850 (93) 3682 (93) 3440 (92) 1107 (92) 80,118 (89)
Hyperkalemia 4551 (9) 5411 (19) 1906 (30) 1660 (42) 2099 (56) 795 (66) 13,762 (15)
RAASi Dose Level, n (%)c
Maximum 8256 (16) 6159 (22) 1545 (24) 994 (25) 876 (23) 248 (21) 16,715 (19)
Submaximum 36,187 (69) 17,878 (63) 3801 (60) 2318 (58) 2148 (58) 607 (51) 59,609 (66)
Discontinued 7556 (14) 4371 (15) 943 (15) 629 (16) 689 (18) 339 (28) 13,632 (15)
B. Medicare (aged ≥65 years)
CKD Stage: No-CKD Stage 2 Stage 3a Stage 3b Stages 4–5 ESRD Totala
N 4586 43,024 15,001 12,651 10,014 1440 72,509
Age, mean (SD)b 71.4 (4.85) 75.1 (5.93) 77.9 (5.99) 78.7 (6.20) 78.9 (6.15) 77.5 (6.27) 76.0 (6.24)
Gender, n (%)
Male 4353 (95) 14,436 (34) 6669 (44) 5764 (46) 4594 (46) 681 (47) 30,382 (42)
Female 233 (5) 28,588 (66) 8332 (56) 6887 (54) 5420 (54) 759 (53) 42,127 (58)
Race, n (%)
African American 138 (3) 3504 (8) 1713 (11) 1542 (12) 1425 (14) 285 (20) 7031 (10)
Caucasian 2743 (60) 26,138 (61) 8824 (59) 7198 (57) 5298 (53) 636 (44) 42,797 (59)
Other/Unknown 1705 (37) 13,382 (31) 4464 (30) 3911 (31) 3291 (33) 519 (36) 22,681 (31)
Comorbidities, n (%)
Diabetes 1632 (36) 16,674 (39) 6951 (46) 6449 (51) 5750 (57) 949 (66) 30,809 (42)
Heart Failure 268 (6) 4082 (9) 2894 (19) 3445 (27) 3932 (39) 643 (45) 11,078 (15)
Cardiovascular Disease 2114 (46) 22,462 (52) 9965 (66) 9077 (72) 7785 (78) 1173 (81) 41,852 (58)
Hypertension 3844 (84) 39,558 (92) 13,951 (93) 11,795 (93) 9254 (92) 1348 (94) 66,140 (91)
Hyperkalemia 562 (12) 8336 (19) 4773 (32) 5303 (42) 5819 (58) 1044 (73) 19,374 (27)
RAASi Dose Level, n (%)c
Maximum 809 (18) 8995 (21) 3548 (24) 2990 (24) 2144 (21) 275 (19) 15,544 (21)
Submaximum 3098 (68) 26,640 (62) 8907 (59) 7508 (59) 5911 (59) 773 (54) 44,296 (61)
Discontinued 662 (14) 7182 (17) 2476 (17) 2087 (16) 1910 (19) 386 (27) 12,416 (17)
CKD indicates chronic kidney disease; ESRD, end-stage renal disease; RAASi, renin-angiotensin-aldosterone system inhibitor.aTotal population represents unique patients and does not foot to sum of Ns by stage because patients could contribute data in more than one stage of CKD. For total population characteristics, each patient was evaluated as of the first included CKD stage or the index date (No-CKD). Totals by sex exclude patients who lack data on gender and age for privacy reasons (n=286; included in the larger commercial group). bAge at each stage was computed from birth year; patients born before 1924 were designated 1924 for privacy reasons.cPatients on higher-than-recommended dose of RAASi (n=346 commercial, n=353 Medicare) were excluded from the Table.

THE AMERICAN JOURNAL OF MANAGED CARE® Supplement VOL. 23, NO. 10 S167
COSTS INCREASE WITH INCREASED CKD STAGE
increased steadily as disease progressed in the
commercial and Medicare cohorts (Figure 3).
Readmissions contributed substantially to total
IP costs, representing 35% to 36% of total IP costs
among ESRD patients and 18% to 33% of such
costs among patients with CKD stages 3a, 3b,
and 4-5 (Figure 4). In comparison, costs associ-
ated with 30-day readmissions represented
10% to 12% of total IP costs for patients in the
no-CKD cohort. Post hoc univariate analysis
found a trend towards higher rates of 30-day
readmission following hospital admissions
in which hyperkalemia occurred; this trend
reached statistical significance in several CKD
subgroups, including stage 2 (P <.001) and
ESRD (P = .048) in the commercial cohort and
no-CKD (P = .003), stage 2 (P <.001), and stage
3b (P <.001) in the Medicare cohort.
Average Length of Hospital StayIn both the commercial and Medicare groups,
average length of hospital stay (ALOS) increased
with each stage of CKD (Figure 4). ALOS in 30-day
readmissions exceeded the ALOS of nonreadmis-
sions by 0.8-1.1 days in the commercial group,
0.5-0.9 days in the Medicare group in stages
other than ESRD, and 0.2 (commercial) to 0.4
(Medicare) days in ESRD.
DISCUSSIONThese results demonstrate that costs increase
exponentially with advancing CKD stage in
patients prescribed RAASi in the commercial and
Medicare groups. Importantly, costs increased
significantly with each disease stage, even at early
stages. The cost increase with advancing CKD
in the commercial group was greater than the
cost increase in the Medicare group, particularly
from stage 3a through ESRD. The reasons for the
disproportionate increase between insurance
groups warrant further investigation but likely
reflect, at least in part, lower levels of federal
government reimbursement, along with slightly
higher IP readmission rates in the commercial group. IP costs were the
key driver of the cost increase, becoming a larger proportion of total
costs for each successive CKD stage. Moreover, 30-day readmissions
were a key driver of IP costs, as the percentage of IP stays resulting
in readmission increased steadily with each CKD stage. Costs for OP
services, ED use, and medications also increased incrementally with
CKD disease stage, albeit to a much smaller extent than IP costs. The
cost increases with increasing CKD stage are consistent with observa-
tions showing that age-standardized mortality, cardiovascular events,
and hospitalization rates increase dramatically as eGFR declines.6
FIGURE 1. Mean Annualized Costs by Medical Service Category and CKD Stage by Commercial Group (A) and Medicare Group (B).
A. Commercial group.
B. Medicare group.
CKD indicates chronic kidney disease; ED, emergency department; ESRD, end-stage renal disease; IP, inpatient; OP, outpatient; Rx, prescription. All Comparisons P<.0001. Total Costs and costs by service category have been rounded to the nearest dollar.
1 column
0
$40,000
$20,000
$60,000
$80,000
$100,000
$120,000
$140,000
Ave
rage
Per
Pat
ient
A
nnua
l Cos
t
Commercial (aged <65 years)
$7357$16,770
$26,842
$43,547
$76,969
$121, 948
0
$40,000
$20,000
$60,000
$80,000
$100,000
$120,000
$140,000
Ave
rage
Per
Pat
ient
A
nnua
l Cos
t
Medicare (aged ≥65 years)
$8091$14,493
$20,965$27,433
$46,128
$87,339
No-CKD
n = 52,175
Stage 2
n = 28,540
Stage 3a
n = 6315
Stage 3b
n = 3963
Stages 4–5
n = 3734
ESRD w/o
Dialysis
n = 1197
■ Rx $1022 $2645 $3535 $4382 $4992 $5067
■ OP $4055 $5952 $7503 $8666 $10,374 $15,359
■ ED $629 $1033 $1541 $1784 $2232 $2850
■ IP $1830 $7140 $14,263 $28,716 $59,370 $98,672
CKD Stages
No-CKD
n = 4586
Stage 2
n = 43,024
Stage 3a
n = 15,001
Stage 3b
n = 12,651
Stages 4–5
n = 10,014
ESRD w/o
Dialysis
n = 1440
■ Rx $934 $2153 $2629 $2976 $3597 $4193
■ OP $4689 $6426 $7386 $8043 $9169 $11,589
■ ED $312 $605 $861 $1096 $1344 $1782
■ IP $2156 $5309 $10,088 $15,319 $32,018 $69,775
CKD Stages

S168 JUNE 2017 www.ajmc.com
R E P O R T
The high costs associated with
CKD underscore the need to iden-
tify interventions and strategies for
reducing costs. Identifying reliable
drivers of costs associated with CKD
stage progression is important for
informing health policy, as it pro-
vides more accurate attributes of the
determinants of healthcare utilization
within a diverse population. Based
on our results, identifying drivers of
hospital admissions and readmissions
may be key because some may be
preventable. Hospitalization risk
with CKD is disproportionate with
advancing CKD, reflecting the burden
of complications due to kidney dis-
ease,14 although some studies do show
a plateau effect on cost in advanced
stages due to a survivor effect, in
which the sickest and most costly die
sooner than other patients.11 In one
study, patients with higher CKD stage,
despite their increased complex-
ity, had higher risk of potentially
preventable hospitalizations than
those without CKD, with the most
frequent admission diagnoses being
hyperkalemia, HF, and volume over-
load.18 Hospitalization risk, as well as
adverse outcomes, were attenuated
in CKD patients who had regular
follow-up with measurements of
serum creatinine; this difference was
evident in stage 3a but not in the more
advanced stages.6 More aggressive
CKD management may also reduce
hospitalizations; for example, use
of angiotensin-converting enzyme
inhibitors (ACEis) was associated with
reduced hospitalization risk in CKD,12
but these and other RAASi were unde-
rutilized in large cohort studies due
to concerns about hyperkalemia.21-24
Readmissions were identified as a
key driver of costs in our study. CKD is
an independent risk factor for higher
30-day readmission rates in a variety of
settings, including after percutaneous TAB
LE
S1.
Pre
dict
ors
of T
otal
Ann
ualiz
ed C
ost (
log-
tran
sfor
med
) by
CK
D S
tage
in th
e C
omm
erci
al G
roup
(A) a
nd M
edic
are
Gro
up (B
).
A. C
omm
erci
al C
ohor
t
Com
mer
cial
Pay
er: M
ulti
vari
ate
Regr
essi
on o
f Spe
cifie
d Co
vari
ates
Cova
riat
e
R2
= .1
459
No-
CKD
R2
= .1
459
CKD
2R
2 =
.137
0CK
D3a
R2
= .1
348
CKD
3bR
2 =
.139
7CK
D 4
–5R
2 =
.114
4ES
RD
Estim
ate
P v
alue
Estim
ate
P v
alue
Estim
ate
P v
alue
Estim
ate
P v
alue
Estim
ate
P v
alue
Estim
ate
P v
alue
Age
.004
28<.
0001
-.00
41<.
0001
-.00
772
.000
3-.
0057
1.0
303
-.00
765
.007
2x
x
Sex
- Fe
mal
e (M
ale)
a.2
5103
<.00
01.2
3334
<.00
01.2
0836
<.00
01.1
3371
.000
6.1
024
.023
2x
x
Reg
ion-
Mid
wes
t (So
uth)
a-.
3359
2<.
0001
-.28
937
<.00
01-.
296
<.00
01-.
3953
7<.
0001
-.50
987
<.00
01-.
3461
7.0
001
Reg
ion-
Nor
thea
st (S
outh
)a-.
3975
3<.
0001
-.31
998
<.00
01-.
2281
4<.
0001
-.33
597
<.00
01-.
5316
8<.
0001
-.25
362
.091
9
HF
.146
24<.
0001
.208
74<.
0001
.401
89<.
0001
.500
01<.
0001
.357
64<.
0001
.245
.144
8
DM
.221
51<.
0001
.212
93<.
0001
.297
42<.
0001
.004
8.9
612
.366
23<.
0001
xx
HTN
-.21
201
<.00
01-.
2234
5<.
0001
-.13
819
.016
8-.
2038
1.0
088
-.19
088
.026
1x
x
CVD
.217
13<.
0001
.289
19<.
0001
.462
94<.
0001
.460
92<.
0001
.594
25<.
0001
.410
14<.
0001
HK
.114
28<.
0001
.127
65<.
0001
.145
68<.
0001
.163
17<.
0001
.322
3<.
0001
.290
22.0
039
RA
ASi
- M
ax/S
ubm
ax (D
isco
ntin
ued)
a-.
0324
1.3
21-.
2222
<.00
01-.
0960
6.0
287
-.27
924
.000
8x
xx
x
Diu
retic
- L
oop
(Diu
retic
- N
one)
a.2
3589
<.00
01.2
6491
<.00
01.1
2607
.007
5x
xx
xx
x
Diu
retic
- O
ther
(Diu
retic
- N
one)
a.0
0111
.917
2-.
0225
6.1
142
-.07
277
.033
8x
xx
xx
x
Visi
t (In
freq
uent
) a.8
4206
<.00
01.6
2599
<.00
01.5
2682
<.00
01.5
1386
<.00
01.3
7336
<.00
01.2
6286
.032
4
HF
by H
K in
tera
ctio
nx
x.2
9285
<.00
01x
x
x
x.3
8424
.046
2
RA
ASi
by
DM
inte
ract
ion
.124
51<.
0001
.162
57<.
0001
xx
.306
15.0
045
xx
xx
RA
ASi
by
CVD
inte
ract
ion
.077
76.0
166
.145
26<.
0001
xx
xx
xx
xx
RA
ASi
by
HF
inte
ract
ion
xx
xx
xx
xx
xx
xx
RA
ASi
by
HK
inte
ract
ion
xx
xx
xx
xx
xx
xx
RA
ASi
by
HTN
inte
ract
ion
.084
84.0
128
xx
xx
xx
xx
xx
(con
tinue
d)

THE AMERICAN JOURNAL OF MANAGED CARE® Supplement VOL. 23, NO. 10 S169
COSTS INCREASE WITH INCREASED CKD STAGE
coronary intervention,25 acute
myocardial infarction,26 total hip
arthroplasty,27 or treatment for
HF.28 Notably, a significant pro-
portion of readmissions among
CKD patients may be avoidable.
For example, in a tertiary medical
center in Boston, 2398 of 10,731
consecutive adult discharges
(22.3%) were followed by readmis-
sion within 30 days, including
410 of 1776 patients (23.1%) with
CKD.29 In the CKD cohort, nearly
half of the readmissions were
classified as potentially avoidable,
most frequently with primary
readmission diagnoses of HF,
infection, renal failure, and
ischemic heart disease. Taken
together, these findings support
guideline recommendations that
efforts to reduce hospitalizations
and readmissions in CKD patients
should focus on the management
of associated comorbid condi-
tions, particularly CVD.16,17 By
extension to the present results,
these efforts should translate into
substantial cost reductions. One
approach for reducing 30-day
readmissions may be to assess
CKD stage from available labora-
tory data to identify high-risk
patients. Such patients may
benefit from a postdischarge
kidney disease clinic, which has
not been endorsed thus far by
guidelines but could hold great
potential for reducing some of
the iatrogenic drivers of CKD, as
well as help to tailor care around
the dynamic needs of patients
during such a crucial time.
The cost increases with
advancing CKD stage also
underscore the need to identify
interventions that will slow pro-
gression at earlier disease stages.
Several lifestyle interventions TAB
LE
S1.
Pre
dict
ors
of T
otal
Ann
ualiz
ed C
ost (
log-
tran
sfor
med
) by
CK
D S
tage
in th
e C
omm
erci
al G
roup
(A) a
nd M
edic
are
Gro
up (B
). (c
ontin
ued)
B. M
edic
are
coho
rt
Med
icar
e Pa
yer:
Mul
tiva
riat
e Re
gres
sion
of S
peci
fied
Cova
riat
es
Cova
riat
e
R2
= .1
082
No-
CKD
R2
= .0
866
CKD
2R
2 =
.091
1CK
D3a
R2
= .0
904
CKD
3bR
2 =
.082
7CK
D 4
–5R
2 =
.057
3ES
RD
Estim
ate
P v
alue
Estim
ate
P v
alue
Estim
ate
P v
alue
Estim
ate
P v
alue
Estim
ate
P v
alue
Estim
ate
P v
alue
Age
.007
92.0
218
.005
05<.
0001
-.00
344
.022
8-.
0059
.000
5-.
0071
2.0
004
xx
Sex
- Fe
mal
e (M
ale)
a-.
2902
8.0
001
.047
06<.
0001
.072
9<.
0001
xx
xx
xx
Reg
ion-
Mid
wes
t (So
uth)
a-.
0872
9.0
559
-.22
706
<.00
01-.
1644
8<.
0001
-.27
445
<.00
01-.
3643
1<.
0001
-.28
745
.001
2
Reg
ion-
Nor
thea
st (S
outh
)a-.
2734
3<.
0001
-.19
568
<.00
01-.
101
<.00
01-.
1834
2<.
0001
-.22
43<.
0001
-.26
529
.020
6
HF
xx
.224
14<.
0001
.318
91<.
0001
.308
4<.
0001
.281
22<.
0001
.505
55<.
0001
DM
.144
01<.
0001
.087
99.0
003
.158
2<.
0001
.172
04<.
0001
.153
56<.
0001
xx
HTN
-.15
591
.000
6-.
3154
7<.
0001
-.25
358
<.00
01-.
2359
8<.
0001
-.28
531
<.00
01x
x
CVD
.213
1<.
0001
.227
77<.
0001
.368
03<.
0001
.380
64<.
0001
.333
45<.
0001
.213
64.0
41
HK
xx
.080
64<.
0001
.069
76.0
002
.103
39<.
0001
.130
73<.
0001
.229
62.0
085
RA
ASi
- M
ax/S
ubm
ax (D
isco
ntin
ued)
a.2
4253
<.00
01-.
2390
0<.
0001
xx
xx
xx
xx
Diu
retic
- L
oop
(Diu
retic
- N
one)
a.1
7107
.013
3.1
3263
<.00
01.0
6517
.010
8.0
8772
.001
5-.
0074
2.8
068
xx
Diu
retic
- O
ther
(Diu
retic
- N
one)
a.0
4581
.210
4-.
0490
9<.
0001
-.15
277
<.00
01-.
1065
9<.
0001
-.07
591
.022
1x
x
Visi
t (In
freq
uent
)a.8
1071
<.00
01.5
7055
<.00
01.4
7036
<.00
01.4
2729
<.00
01.3
638
<.00
01.4
152
.000
6
HF
by H
K in
tera
ctio
nx
xx
xx
xx
x.1
5165
.003
xx
RA
ASi
by
DM
inte
ract
ion
xx
.104
89<.
0001
xx
xx
xx
xx
RA
ASi
by
CVD
inte
ract
ion
xx
.095
85.0
002
xx
xx
xx
xx
RA
ASi
by
HF
inte
ract
ion
xx
xx
xx
xx
xx
xx
RA
ASi
by
HK
inte
ract
ion
xx
xx
xx
xx
xx
xx
RA
ASi
by
HTN
inte
ract
ion
.084
84.0
128
xx
xx
xx
xx
xx
CK
D in
dica
tes
chro
nic
kidn
ey d
isea
se; C
VD, c
ardi
ovas
cula
r di
seas
e; D
M, d
iabe
tes
mel
litus
; ESR
D, e
nd-s
tage
ren
al d
isea
se; H
F, h
eart
failu
re; H
K, h
yper
kale
mia
; HTN
, hyp
erte
nsio
n; R
AA
Si, r
enin
-ang
iote
nsin
-ald
o-st
eron
e sy
stem
inhi
bito
r.a B
asel
ine
valu
es fo
r m
ultip
art v
aria
bles
: Sex
= M
ale;
Reg
ion
= So
uth;
Vis
it =
Infr
eque
nt; L
oop
diur
etic
= N
one;
Oth
er d
iure
tic =
non
e.

S170 JUNE 2017 www.ajmc.com
R E P O R T
are recommended, including weight management, smoking
cessation, exercise, dietary sodium restriction, and drug interven-
tions targeting key risk factors such as elevated blood pressure
and lipid and blood glucose levels.5 Blood-pressure control with
antihypertensive medications is the foundation for managing CKD
and for reducing cardiovascular risk. ACEi or angiotensin receptor
blockers (ARBs) are recommended for CKD patients, particularly
those with proteinuria.16,17 In a recent meta-analysis, use of ACEi
or ARBs in CKD patients was associated with reduced risk of renal
failure and adverse CVD outcomes compared with antihypertensive
controls or placebo.30 However, use of RAASi in recommended
doses is often limited by risk of hyperkalemia, resulting in either
subtherapeutic dosing or avoidance of these agents even when
clinically indicated.31-33 In previous communications, we showed
that RAASi therapy at guideline-recommended doses was generally
associated with lower adverse-outcome rates and costs, compared
with subtherapeutic doses or discontinuation in CKD patients with
commercial insurance or Medicare.21,22
In the multivariate regression analyses, the strongest predictor
of costs was having ≥2 healthcare visits per year, which was reported
for a large majority of patients in both cohorts. The assessment of
0-1 visit compared with ≥2 visits appears reasonable because it may
distinguish between patients who do not versus do know they have
CKD. Furthermore, it is possible that patients who are noncompliant
may cost less, as they do not utilize the healthcare system as much
as compliant patients might. The presence of comorbid CVD and HF
were strong predictors of higher costs, especially in patients with CKD
stage 3a or higher. These findings are consistent with other studies
showing the cost impact of comorbid conditions on CKD,34,35 as well
as the impact of these comorbidities on hospitalization rates.6,18
Hyperkalemia contributed modestly, but significantly, to higher costs
at every stage of CKD. The cost contribution of hyperkalemia was
FIGURE 2. Percentage Difference in Predicted Annual Cost With Versus Without Hyperkalemia.a
CKD indicates chronic kidney disease; ESRD, end-stage renal disease; RAASi, renin-angiotensin-aldosterone system inhibitor. aAdjusted for age, sex, region, comorbidities, RAASi and diuretic therapies, and clinically significant interactions in multivariate regression analyses.
0%
10%
20%
30%
40%
50%
60%
ESRDStages 4–5Stage 3bStage 3aStage 2No-CKD
57%
26%
38%
22%18%
11%16%
7%
17%
8%12%
0%
Commercial Medicare
Percent Increase in Predicted Annual Cost per Patient With Hyperkalemia
FIGURE 3. Percentage of IP Hospital Stays Resulting in Readmissions Occurring Within 30 Days of Discharge.
CKD indicates chronic kidney disease; ESRD, end-stage renal disease; IP, inpatient.
26.4%23.6%23.5%
21.4%20.6%18.6%
16.8%15.9%13.4%13.2%
9.9%8.2%
Commercial Medicare
30-Day Readmissions, by Payer and CKD Stage
0%
5%
10%
15%
20%
25%
30%
ESRDStages 4–5Stage 3bStage 3aStage 2No-CKD
$0
$40,000
$20,000
$60,000
$80,000
$100,000
$120,000
0.0
3.02.01.0
5.04.0
6.07.08.09.0
Ann
ualiz
ed C
ost (
USD
)A
verage Length of Stay (days)
Commercial
No-CKD Stage 2
Cost per patient of IP care, less readmissions Cost per patient of IP readmissions within 30 daysALOS of non-readmissions ALOS of readmissions within 30 days
Stage 3a Stage 3b Stages 4–5 ESRD w/o Dialysis
$1830 $7140$14,263
$28,716
$59,370
$98,672
4.14.8
5.1
6.37.2
7.9
3.23.7
4.35.3
6.4
7.7
Medicare
No-CKD Stage 2 Stage 3a Stage 3b Stages 4–5 ESRD w/o Dialysis
$2156 $5309 $10,088 $15,319
$32,018
$69,775
4.3 4.7 5.05.7
6.4
8.2
3.6 3.84.4 4.8
5.9
7.9
FIGURE 4. Annualized Cost per Patient of IP Care, Showing the Contribution of Readmissions Within ≥30 Days, and ALOS for Readmis-sions Occurring Within 30 Days of Discharge Versus Other IP Admissions.
ALOS indicates average length of stay; CKD, chronic kidney disease; ESRD, end-stage renal disease; IP, inpatient.

THE AMERICAN JOURNAL OF MANAGED CARE® Supplement VOL. 23, NO. 10 S171
COSTS INCREASE WITH INCREASED CKD STAGE
generally consistent across early stages of CKD, but then increased
dramatically by CKD stages 4-5, and even more so in ESRD.
LimitationsSeveral study limitations should be recognized. First, consistent
with the retrospective design, the diagnosis of CKD stage depended
upon diagnosis codes and the frequency of eGFR measurements in
real-world clinical practice. Therefore, there may have been limitations
in the timing (ie, onset, duration) of CKD stages and, consequently,
in costs attributed to specific stages. Second, the costs attributed to
ESRD excluded dialysis costs, which could not be captured in the
Humedica database. Costs in ESRD are likely to be higher than those
reported here. The additional annual cost of dialysis is estimated to
be at least $29,000 per Medicare patient2; for commercial patients
it is approximately 4 times higher than the Medicare rate, or about
$120,000 per patient, based on revenue reported by DaVita (DaVita
Inc, Denver, Colorado).36 Third, these data are not a longitudinal
study of CKD progression; rather, they provide a cross-sectional
snapshot of the costs within a disease stage and the costs associated
with transitioning to the next disease stage. Because the accuracy of
cost estimates increases with longer time frames, we used a 90-day
minimum duration for capturing costs. The disease stage ended only
if the patient progressed to the next greater stage, or if the study end
date was reached. Fourth, the study population had already received
a prescription of RAASi therapy based on the selection criteria,
and consequently may not represent the general CKD population,
but rather a sample generally engaged with the healthcare system,
possibly providing a selection bias towards better outcomes. Finally,
the commercial and Medicare cohorts were overrepresented by
patients from the South region, which may have impacted costs as
well as the generalizability of the study results to the US population.
CONCLUSIONSIn summary, costs increased exponentially with advancing CKD in
patients who were prescribed RAASi therapy. IP costs were the key
driver of total costs, becoming increasingly more important with
each successive CKD stage. Readmissions increased in frequency with
each CKD stage, contributing substantially to the cost increases. In
comparison, pharmacy costs were found to be only a small contributor
to the higher costs with advancing CKD stage. Based on these findings,
efforts to slow CKD progression and reduce hospitalization/readmission
rates may be expected to result in cost reductions. Although RAASi
are recommended in CKD and do reduce hospitalizations, their full
benefit is often limited by hyperkalemia. Efforts to design care with
a focus on managing the burden of increasing comorbidities with
advancing CKD—including HF, diabetes, and hyperkalemia—and
implementing strategies to decrease CKD progression are clinically
worthwhile and should offer the potential for cost reductions. ■
ACKNOWLEDGMENTSThis study was sponsored by Relypsa, Inc., a Vifor Pharma Company. Medical writing support was provided by Impact Communication Partners, Inc, New York, New York.
Author affiliations: California Polytechnic State University, San Luis Obispo, CA (KJM); Mayo Clinic, Rochester, MN (MO); Mayo Clinic Health System, Eau Claire, WI (MO); Montefiore Medical Center, Albert Einstein College of Medicine, Bronx, NY (LG); Opko Health, Inc, Miami, FL (MSB); Relypsa, Inc., a Vifor Pharma Company, Redwood City, CA (PJA, AR); Strategic Health Resources, La Cañada, CA (SEF, NLR); University of Wisconsin MBA Consortium, Eau Claire, WI (MO).
Funding sources: This supplement was sponsored by Relypsa, Inc., a Vifor Pharma Company. Medical writing support was provided by Impact Communication Partners, Inc, New York, NY.
Author disclosures: Dr Alvarez and Dr Romero report that they are employed by and previously owned stock in Relypsa, Inc., a Vifor Pharma Company; Dr Brenner reports that she is a former employee of and previ-ously owned stock in Relypsa, Inc., a Vifor Pharma Company; Ms Funk, Ms Reaven, and Dr McGaughey report having served as a consultant or having received payment for participating in an advisory board for Relypsa, Inc., a Vifor Pharma Company, through a contract with Strategic Health Resources; Ms Funk reports having received payment for involvement in the preparation and analyis of data for this manuscript from Relypsa, Inc., a Vifor Pharma Company; Dr Golestaneh reports having received travel expenses and meeting/conference attendance for Relypsa, Inc., a Vifor Pharma Company; Dr McGaughey and Ms Reaven report having received payment for involvement in the preparation of a manuscript and for statistical consulting from Strategic Health Resources; Ms Reaven reports that she is the owner of Strategic Health Resources, a consulting firm which has done business with Relypsa, Inc., a Vifor Pharma Company. Dr Onuigbo reports having received honoraria from Relypsa, Inc., a Vifor Pharma Company, for consultancies or paid advisory boards, lecture fees for speaking at the invitation of a commercial sponsor, and for travel expenses and meeting/conference attendence.
Author information: Acquisition of data (SEF, NLR); analysis and inter-pretation of data (PJA, MSB, SEF, LG, KJM, MO, NLR, AR); concept and design (PJA, MSB, SEF, LG, KJM, MO, NLR, AR); critical revision of the manuscript for important intelectual content (PJA, MSB, SEF, LG, MO, NLR, AR); draft-ing of the manuscript (PJA, SEF, LG, MO, NLR); statistical analysis (KJM); supervision (LG, MO).
Address correspondence to: [email protected].
REFERENCES1. Coresh J, Selvin E, Stevens LA, et al. Prevalence of chronic kidney disease in the United States. JAMA. 2007;298(17):2038-2047. doi: 10.1001/jama.298.17.2038.2. Saran R, Li Y, Robinson B, et al. US Renal Data System 2015 annual data report: epidemiology of kidney disease in the United States. Am J Kidney Dis. 2016;67(3 suppl 1):S1-S434. doi: 10.1053/j.ajkd.2015.12.014.3. Hoerger TJ, Simpson SA, Yarnoff BO, et al. The future burden of CKD in the United States: a simulation model for the CDC CKD Initiative. Am J Kidney Dis. 2015;65(3):403-411. doi: 10.1053/j.ajkd.2014.09.023.4. Couser WG, Remuzzi G, Mendis S, Tonelli M. The contribution of chronic kidney disease to the global burden of major noncommunicable diseases. Kidney Int. 2011;80(12):1258-1270. doi: 10.1038/ki.2011.368.5. Gansevoort RT, Correa-Rotter R, Hemmelgarn BR, et al. Chronic kidney disease and cardiovascular risk: epi-demiology, mechanisms, and prevention. Lancet. 2013;382(9889):339-352. doi: 10.1016/S0140-6736(13)60595-4.6. Go AS, Chertow GM, Fan D, McCulloch CE, Hsu CY. Chronic kidney disease and the risks of death, cardio-vascular events, and hospitalization. N Engl J Med. 2004;351(13):1296-1305. doi: 10.1056/NEJMoa041031.7. Honeycutt AA, Segel JE, Zhuo X, Hoerger TJ, Imai K, Williams D. Medical costs of CKD in the Medicare population. J Am Soc Nephrol. 2013;24(9):1478-1483. doi: 10.1681/ASN.2012040392.8. Brantsma AH, Bakker SJ, Hillege HL, et al. Cardiovascular and renal outcome in subjects with K/DOQI stage 1-3 chronic kidney disease: the importance of urinary albumin excretion. Nephrol Dial Transplant. 2008;23(12):3851-3858. doi: 10.1093/ndt/gfn356.9. Gullion CM, Keith DS, Nichols GA, Smith DH. Impact of comorbidities on mortality in managed care patients with CKD. Am J Kidney Dis. 2006;48(2):212-220. doi: 10.1053/j.ajkd.2006.04.083.10. Anavekar NS, McMurray JJ, Velazquez EJ, et al. Relation between renal dysfunction and cardiovascular outcomes after myocardial infarction. N Engl J Med. 2004;351(13):1285-1295. doi: 10.1056/NEJMoa041365.11. Smith DH, Gullion CM, Nichols G, Keith DS, Brown JB. Cost of medical care for chronic kidney disease and comorbidity among enrollees in a large HMO population. J Am Soc Nephrol. 2004;15(5):1300-1306. doi: 10.1097/01.ASN.0000125670.64996.BB.12. Khan SS, Kazmi WH, Abichandani R, Tighiouart H, Pereira BJ, Kausz AT. Health care utilization among patients with chronic kidney disease. Kidney Int. 2002; 62(1):229-236.

S172 JUNE 2017 www.ajmc.com
R E P O R T
13. Wyld ML, Lee CM, Zhuo X, et al. Cost to government and society of chronic kidney disease stage 1-5: a national cohort study. Intern Med J. 2015;45(7):741-747. doi: 10.1111/imj.12797.14. Mix TC, St. Peter WL, Ebben J, et al. Hospitalization during advancing chronic kidney disease. Am J Kidney Dis. 2003;42(5):972-981. doi: http://dx.doi.org/10.1016/j.ajkd.2003.06.001.15. Kidney Disease Outcomes Quality Initiative. K/DOQI clinical practice guide-lines on hypertension and antihypertensive agents in chronic kidney disease. Am J Kidney Dis. 2004;43(suppl 5):S1-S290.16. Kidney Disease: Improving Global Outcomes (KDIGO) CKD work group. KDIGO 2012 clinical practice guideline for the evaluation and management of chronic kidney disease. Kidney Inter Suppl. 2013;3(1):1-150. http://kdigo.org/home/guidelines/ckd-evaluation-management/.17. Inker LA, Aster BC, Fox CH, et al. KDOQI US commentary on the 2012 KDIGO clinical practice guideline for the evaluation and management of CKD. Am J Kidney Dis. 2014;63(5):713-735. doi: 10.1053/j.ajkd.2014.01.416.18. Wiebe N, Klarenbach SW, Allan GM, et al; Alberta Kidney Disease Network. Potentially preventable hospitalization as a complication of CKD: a cohort study. Am J Kidney Dis. 2014;64(2):230-238. doi: 10.1053/j.ajkd.2014.03.012.19. Kuznik A, Mardekian J, Tarasenko L. Evaluation of cardiovascular disease burden and therapeutic goal attainment in US adults with chronic kidney disease: an analysis of national health and nutritional examination survey data, 2001-2010. BMC Nephrol. 2013;14:132. doi: 10.1186/1471-2369-14-132.20. Foster MC, Rawlings AM, Marrett E, et al. Cardiovascular risk factor burden, treatment, and control among adults with chronic kidney disease in the United States. Am Heart J. 2013;166(1):150-156. doi: 10.1016/j.ahj.2013.03.016.21. Epstein M, Alvarez PJ, Reaven NL, et al. Evaluation of clinical outcomes and costs based on prescribed dose level of renin-angiotensin-aldosterone system inhibitors. Am J Manag Care. 2016;22(suppl 11):S311-S324.22. Epstein M, Reaven NL, Funk SE, McGaughey KJ, Oestreicher N, Knispel J. Evaluation of the treatment gap between clinical guidelines and the utiliza-tion of renin-angiotensin-aldosterone system inhibitors. Am J Manag Care. 2015;21(suppl 11):S212-S220.23. Krantz MJ, Ambardekar AV, Kaltenbach L, Hernandez AF, Heidenreich PA, Fonarow GC; Get With the Guidelines Steering Committee and Hospitals. Patterns and predictors of evidence-based medication continuation among hos-pitalized heart failure patients (from Get With the Guidelines–Heart Failure). Am J Cardiol. 2011;107(12):1818-1823. doi: 10.1016/j.amjcard.2011.02.322.24. Bailie GR, Eisele G, Liu L, et al. Patterns of medication use in the RRI-CKD study: focus on medications with cardiovascular effects. Nephrol Dial Transplant. 2005;20(6):1110-1115. doi: 10.1093/ndt/gfh771.25. Khawaja FJ, Shah ND, Lennon RJ, et al. Factors associated with 30-day readmission rates after percutaneous coronary intervention. Arch Intern Med. 2012;172(2):112-117. doi: 10.1001/archinternmed.2011.569.26. Chen HY, Tisminetzky M, Lapane KL, et al. Decade-long trends in 30-day rehospitalization rates after acute myocardial infarction. J Am Heart Assoc. 2015;4(11). pii: e002291. doi: https://doi.org/10.1161/JAHA.115.002291.27. Miric A, Inacio MC, Namba RS. The effect of chronic kidney disease on total hip arthroplasty. J Arthroplasty. 2014;29(6):1225-1230. doi: 10.1016/j.arth.2013.12.031.28. Perkins RM, Rahman A, Bucaloiu ID, et al. Readmission after hospitalization for heart failure among patients with chronic kidney disease: a prediction model. Clin Nephrol. 2013;80(6):433-440. doi: 10.5414/CN107961.29. Donzé J, Lipsitz S, Bates DW, Schnipper JL. Causes and patterns of readmis-sions in patients with common comorbidities: retrospective cohort study. BMJ. 2013;347:f7171. doi: https://doi.org/10.1136/bmj.f7171.30. Xie X, Liu Y, Perkovic V, et al. Renin-angiotensin system inhibitors and kidney and cardiovascular outcomes in patients with CKD: a Bayesian network meta-analysis of randomized clinical trials. Am J Kidney Dis. 2016;67(5):728-741. doi: 10.1053/j.ajkd.2015.10.011.31. Epstein M. Hyperkalemia as a constraint to therapy with combination renin-angiotensin system blockade: the elephant in the room. J Clin Hypertens (Greenwich). 2009;11(2):55-60. doi: 10.1111/j.1751-7176.2008.00071.x.32. Yildirim T, Arici M, Piskinpassa S, et al. Major barriers against renin-angiotensin-aldosterone system blocker use in chronic kidney disease stages 3-5 in clinical practice: a safety concern? Renal Fail. 2012;34(9):1095-1099. doi: 10.3109/0886022X.2012.717478.33. Chang AR, Sang Y, Leddy J, et al. Antihypertensive medications and the prev-alence of hyperkalemia in a large health system. Hypertension. 2016;67(6):1181-1188. doi: 10.1161/HYPERTENSIONAHA.116.07363.34. Vupputuri S, Kimes TM, Calloway MO, et al. The economic burden of pro-gressive chronic kidney disease among patients with type 2 diabetes. J Diabetes Complications. 2014;28(1):10-16. doi: 10.1016/j.jdiacomp.2013.09.014.35. Ozieh MN, Dismuke CE, Lynch CP, Egede LE. Medical care expenditures asso-ciated with chronic kidney disease in adults with diabetes: United States 2011. Diabetes Res Clin Pract. 2015;109(1):185-190. doi: 10.1016/j.diabres.2015.04.011.36. 2016 Form 10-K. DaVita HealthCare Partners Inc website. http://investors.davitahealthcarepartners.com/. Accessed May 23, 2017.
SUPPLEMENTARY ITEM S3. Evaluated RAASi Drugs.
Evaluated RAASi drugs and their maximum recommended doses, listed in alphabetical order:
aliskiren, 300 mg eprosartan, 800 mg perindopril, 8 mg
azilsartan, 80 mg fosinopril, 40 mg quinapril, 80 mg
benazepril, 80 mg irbesartan, 300 mg ramipril, 10 mg
candesartan, 32 mg lisinopril, 40 mg spironolactone, 200 mg
captopril, 450 mg losartan, 100 mg telmisartan, 80 mg
enalapril, 40 mg moexipril, 30 mg trandolapril, 8 mg
eplerenone, 100 mg olmesartan, 40 mg valsartan, 320 mg
RAASi indicates renin-angiotensin-aldosterone system inhibitor.Aliskiren/valsartan formulated 150 mg–160 mg (a partial dose of each of 2 RAASi drugs) was considered a partial dose (submaximum).
SUPPLEMENTARY ITEM S2. Identification of Comorbidities.
Comorbidities were identified by single occurrence of any indicator in prestage data using International Classification of Diseases, Ninth Edition (ICD-9-CM), diagnosis codes, and other indicators as follows:
• Diabetes mellitus (includes both type I and type II): any occurrence of ICD-9 -CM diagnosis codes 250.xx, 357.2, 362.0x, or 366.41; glycated hemoglobin ≥6.5%; or any outpatient prescription for a diabetes medication
• Heart failure: any occurrence of ICD-9-CM diagnosis codes 398.91, 402.x1, 404.x3, 425.xx, 428.xx, or V42.1; or a left ventricular ejection fraction <40%
• Hypertension: any occurrence of ICD-9-CM diagnosis codes 362.11, 401.x–405.x, 437.2
• Cardiovascular disease: any occurrence of ICD-9-CM diagnosis codes 404.x1, 410–414, 420–421, 423–424, 426–427, 429, 430–438, 440–444 (except 440.1, 442.1), 447 (except 447.3), 451–453, 557, 785.0–785.3, V42.2, V43.3, V45.0, V45.81, V45.82 and V53.3
• Hyperkalemia: single occurrence of serum potassium ≥5.1 mEq/L, in any setting of care
SUPPLEMENTARY ITEM S1. Renal Condition Definitions.
Chronic kidney disease (CKD):
• CKD stage 2: International Classification of Diseases, Ninth Edition, Clinical Modification (ICD-9-CM), code 585.2 or single estimated glomerular filtration rate (eGFR) (60–89)
• CKD stage 3a: single eGFR (45–59)
• CKD stage 3b: single eGFR (30–44)
• CKD stage 4: ICD-9-CM code 585.4 or single eGFR (15–29)
• CKD stage 5: ICD-9-CM code 585.5 or single eGFR (11–15)
End-stage renal disease (ESRD):
• ESRD: ICD-9 code 585.6 or single eGFR (≤10)

SUPPLEMENT POLICY STATEMENTStandards for Supplements to The American Journal of Managed Care®
All supplements to The American Journal of Managed Care® are designed to facilitate and enhance ongoing medical education in various therapeutic disciplines. All Journal supplements adhere to standards of fairness and objectivity, as outlined below. Supplements to The American Journal of Managed Care® will:
I. Be reviewed by at least one independent expert from a recognized academic medical institution.
II. Disclose the source of funding in at least one prominent place.
III. Disclose any existence of financial interests of supplement contributors to the funding organization.
IV. Use generic drug names only, except as needed to differentiate between therapies of similar class and indication.
V. Be up-to-date, reflecting the current (as of date of publication) standard of care.
VI. Be visually distinct from The American Journal of Managed Care®.
VII. Publish information that is substantially different in form and content from that of the accompanying edition of The American Journal of Managed Care®.
VIII. Prohibit excessive remuneration for contributors and reviewers.
IX. Carry no advertising.
Publisher’s Note: The opinions expressed in this supplement are those of the authors, presenters, and/or panelists and are not attributable to the sponsor or the publisher, editor, or editorial board of The American Journal of Managed Care®. Clinical judgment must guide each professional in weighing the benefits of treat-ment against the risk of toxicity. Dosages, indications, and methods of use for products referred to in this supplement are not necessarily the same as indicated in the package insert for the product and may reflect the clinical experience of the authors, presenters, and/or panelists or may be derived from the professional literature or other clinical sources. Consult complete prescribing information before administering.