All -1/99 - ETEC - Department of Energy ETEC Closure Project · · 2012-02-08DOCUMENT TITLE, c e...
53
OP RPekw&I Intarntw „sl NUMBER REV LTR 'CHG NO . NOC1TI 00 0 SUPPORTING DOCUMENT 99 3 MM .' F _,,,,,, s,rPM Gm AP O CH G SEE SL DO UMENT 'VP E PROGRAM TITLE Technical Infor lio n leaith, Safety and Radiati on Services KEY NO'"S Radiation Exposure , Effluents Licensed Fa iliti s DOCUMENT TITLE , c e ORIG'NAL ISSUE DATE Annual Review of Ra diologi cal Controls - 1976 GO NO . SiA NO . PAGE 1 O F 94132 000 2 21 TOTAL PAGE S PREPARED BY . DATE DEPT MAIL ADDR RE _ .~ R . S . Hart - 731 3905 SECUR'TY C_ASS :FICATION 1 ICHECK ONE BOX ONLYi ' !CHECK ONE Box ONLY ! IR&D PROGRAM' YES NO 1 : YES. ESTER TPA NO . DOE :)Do RESTRICTE D APPROVALS DATE UYCL _ j DATA CONT . J DEFENSE C ] _ - . __ : • - < - _~ - Iti FO . SECRE T ~ 1 A l L -1/ AUTHORIZED DAT E l - 9 9 CLASSIFIE R D :STRIBUTION ABSTRAC T NAME MAI L ^DDR Data on exposures of employees to internal and externa l *1 Aubuchon, D . KA47 radiation, releases of radioactivity in effluents , * Berger, S . J805 in-plar .t airborne radioactivity, and environmenta l * Buttrey, K . LA15 radioactivity are reviewed for calendar year 1976 . * Hart, R . 380 5 * Hartzier, R . 3902 his sa!mary will be used in conjunction with subsequen t ' IC_-hishia n * e s K V . 4 L83 rears results to determine if : ;1 ; there are any upwar d , * ! Kittinger W NBG2 trendsir . exposures or effluent releases , 12) exposure o r . . * 'Montfor d ; tf LBO1 effluent releases could be reduced under the ALARA con - , * ~MC n ir w 1020 ceps, and (3 equipment for effluent and exposure contro l l, . * Healy, C . N806 is Derforminc properly . * Remiey M . NB0 8 , * !Roberson, 0 . KA0 sma'1 increase in personnel radiation exposure s Spec h Tutte, 5 N 3 over 19 .'•5 occurred, which is _ mainly attributabl e abl e l Tu R . ,2 8 1 T to increased DO activities . However, all exposure s n er , * I Walter J 006 T 006 remained we,l below established limits . , . . cPfo+,, r . a !1i ; N813 his report satisfies License Condition Number 23 o f * .Baum e~isteerr,r . 3810 Special Nuclear Materials License No . SNM-21 . RESERVED FOR PROPRIETARV1LEv4 _ NO-ICES 731-G .271 ;ebs/jjs - COMPLETE DOCUMEN T NO ASTERiSK .' : .LE PAGE :SUMMAR Y OF CHA'.GE PAGE ONL" - =W U FORM 734 .C REV . 7-7E
Transcript of All -1/99 - ETEC - Department of Energy ETEC Closure Project · · 2012-02-08DOCUMENT TITLE, c e...

OPRPekw&I Intarntw „sl
NUMBER REV LTR 'CHG NO .
NOC1TI 000SUPPORTING DOCUMENT 99 3MM .' F_,,,,,, s,rPM Gm AP O CHGSEE SL
DO UMENT 'VP EPROGRAM TITLE
Technical Infor lionleaith, Safety and Radiati on Services KEY NO'"S Radiation Exposure ,
Effluents Licensed Fa iliti sDOCUMENT TITLE
, c eORIG'NAL ISSUE DATE
Annual Review of Radiologi cal Controls - 1976
GO NO . SiA NO . PAGE 1 O F
94132 000 221TOTAL PAGE S
PREPARED BY . DATE DEPT MAIL ADDR RE _ .~
R . S . Hart - 731 3905 SECUR'TY C_ASS :FICATION 1
ICHECK ONE BOX ONLYi ' !CHECK ONE Box ONLY !IR&D PROGRAM' YES NO 1 : YES. ESTER TPA NO . DOE :)Do RESTRICTE D
APPROVALS DATE UYCL _j DATA
CONT . J DEFENSE C]_ - . __ : • - < - _~ - Iti FO .SECRE T
~ 1 AlL
-1/ AUTHORIZED DATEl-
99CLASSIFIE R
D:STRIBUTION ABSTRAC T
NAME MAIL
^DDR Data on exposures of employees to internal and externa l
*1 Aubuchon, D . KA47 radiation, releases of radioactivity in effluents ,
* Berger, S . J805 in-plar.t airborne radioactivity, and environmenta l
* Buttrey, K . LA15radioactivity are reviewed for calendar year 1976 .
* Hart, R . 3805
* Hartzier, R . 3902 his sa!mary will be used in conjunction with subsequent'IC_-hishia n* esK V . 4L83
rears results to determine if : ;1 ; there are any upward,* ! Kittinger W NBG2
trendsir. exposures or effluent releases , 12) exposure o r. .* 'Montford
; tfLBO1
effluent releases could be reduced under the ALARA con -,* ~MCn ir w 1020 ceps, and (3 equipment for effluent and exposure contro ll, .* Healy, C . N806
is Derforminc properly.
* Remiey M . NB08,* !Roberson, 0 . KA0 sma'1 increase in personnel radiation exposure sSpec h
Tutte,5
N 3over 19 .'•5 occurred, which is _ mainly attributabl eabl el
Tu R. ,28 1
T to increased DO activities . However, all exposuresner ,* I Walter J
006T006 remained we,l below established limits ., . .
cPfo+,, r. a !1i ; N813 his report satisfies License Condition Number 23 o f
* .Baume~isteerr,r . 3810 Special Nuclear Materials License No . SNM-21 .
RESERVED FOR PROPRIETARV1LEv4 _ NO-ICES
731-G .271;ebs/jjs -
COMPLETE DOCUMEN T
NO ASTERiSK.':.LE PAGE :SUMMAR YOF CHA'.GE PAGE ONL"
- =WU
FORM 734.C REV. 7-7E

AT4 Rockwell Internationa l
Energy Systems Group
CO "v'TENTS
tF- NOIIT_!990003PAGE - 2
Pag e
INTRUU ',:Ci ION. . . . . . . . . . . . . . . . . . . . . . . . . . . . . . . . . . . . . . . . . . . .
PERSONNEL DOSIMETRY . . . . . . . . . . . . . . . . . . . . . . . . . . . . . . . . . . . .
iNJTL„ Data . . . . . . . . . . . . . . . . . . . . . . . . . . . . . . . . . . . . .
5 . in-Vivo Lung Scans . . . . . . . . . . . . . . . . . . . . . . . . . . . . . . . .
C . Bioassays . . . . . . . . . . . . . . . . . . . . . . . . . . . . . . . . . . . . . . . . .
H. RAD:ATION!RAD;IOACTIVITY MEASUREMENTS . . . . . . . . . . . . . . . . . . .
Area . . . . . . . . . . . . . . . . . . . . . . . . . . . . . . . . . . . . . . . . . . . . . .
Air . . . . . . . . . . . . . . . . . . . . . . . . . . . . . . . . . . . . . . . . . . . . . . .
Special Air Samples - Building OSS . . . . . . . . . . . . . . . .
III . E FLUENT MONITORING . . . . . . . . . . . . . . . . . . . . . . . . . . . . . . . . . . . .
Facility Ventilation . . . . . . . . . . . . . . . . . . . . . . . . . . . . . .
B . Liquid ''astes . . . . . . . . . . . . . . . . . . . . . . . . . . . . . . . . . . . . .
IV . ENVIRONMENTAL MONITORING . . . . . . . . . . . . . . . . . . . . . . . . . . . . . . .
A . Introduction . . . . . . . . . . . . . . . . . . . . . . . . . . . . . . . . . . . . . .
B. Sum;nary . . . . . . . . . . . . . . . . . . . . . . . . . . . . . . . . . . . . . . . . . . .
V . UNUSUAL EVEN`S . . . . . . . . . . . . . . . . . . . . . . . . . . . . . . . . . . . . . . . . .
Vi . SUMMARY/TRENDS - EXPOSURE, EFFLUENTS . . . . . . . . . . . . . . . . . . .
VIi . ANTICIPATED ACTIVITIES DURING NEXT REPORTING PERIOD . . . .
REFERENCES . . . . . . . . . . . . . . . . . . . . . . . . . . . . . . . . . . . . . . . . . . . . . . . . . . . . . . .
ADPENDIX - PERSONNEL MONITORING PROGRAM . . . . . . . . . . . . . . . . . . . . . . . . . .
FORM 719? REF'-'-7B

014
Rockwell International
Energy Systems Group
rFIGURES
NO NOOITI9900333PAGE . 3
Figure No . Page
personnel Annual Exposure ;Whole Body) - 197.6 . . . . . . . . . .
TABLES
Table No . ?age
1 Whole Body Doses - 1- 976 . . . . . . . . . . . . . . . . . . . . . . . . . . . . . . . .
2(a Bioassays - Statistical Su!imary - 19,16 . . . . . . . . . . . . . . . . .
2 ;b: Bioassays - Detailed Listing - 19076 . . . . . . . . . . . . . . . . . . . .
3 Working AreaWorking ilnterior ; Air Samples - 1976 . . . . . . . . . . . . .
4 Air Samples, NMDF - Bldg . C55 - 1-976 . . . . . . . . . . . . . . . . . . .
Radioactivity Contained in Atmosphericall yDiscnarged Effluents Released to UnrestrictedAreas - 1976 . . . . . . . . . . . . . . . . . . . . . . . . . . . . . . . . . . . . . . . . . . .
6 Liquid Effluent Radioactivity Discharged t oSanitary Sewer - 1976 . . . . . . . . . . . . . . . . . . . . . . . . . . . . . . . . . .
7 Soil, Radioactivity Data - 1976 . . . . . . . . . . . . . . . . . . . . . . . . .
B Vegetation Radioactivity Data - 1970' . . . . . . . . . . . . . . . . . . .
9 NDFL Process Water Radioactivity Data - 1976 . . . . . . . . . . .
I3 Bell Creek and RocKetdyne SSFL Retention PondRadioactivity Data - 1976 . . . . . . . . . . . . . . . . . . . . . . . . . . . . . .
ii Ambient Air Radioactivity - 1976 . . . . . . . . . . . . . . . . . . . . . . .
12 Site Amtient Radiation. Dosimetr_: Data - 1976 . . . . . . . . . . .
A-1 Filter Ratios As A Function of Effective X-RayEnergy for R-D Plastic . . . . . . . . . . . . . . . . . . . . . . . . . . . . . . . . .
A-2 Film Correction Factors . . . . . . . . . . . . . . . . . . . . . . . . . . . . . . . .
A-3 Sunnary of Bioassay Services Available From ,United States Testing Comoany, Inc . . . . . . . . . . . . . . . . . . . . .
FORM 719 .D REV . 7-78

QRockwell International
Energy Systems Group
INTRODUCTION
PA GE
N001T199003 34
As set forth in the Energy Systems Group's special material
licensee as Condition 23 : "s formal annual report shall be made to the
radioisotope review committee of the NSRP reviewing employee exposures
and effluent release data to determine (1) if there awe any upward
trends developing in personnel exposures for identifiable categories of
workers or types of operations or effluent releases, (2i if exposures
and effluents might be lowered under the conceot of "as low as reason-
ably acnievabiie" . and 031 if equipment for effluent and exposure control
is being properly used, maintained and inspected . This report shall
include review of other required audits and inspections performed during
the Past twelve months and review of the data from the following areas :
Employee exposures ; bioassay results ; effluent releases ; in-plant air-
borne radioactivity and environmental monitoring .
This report presents an historical basis for the identification of
trends .* it should be noted that in some instances both 4RC licensed and
nor-NRC licensed activities take place in the same building . In these
cases, certain measurements (e .g ., ventilation air exhaust radio-
activity cannot be separated for each type of activity . When this
occurs, the values are reported unmodified as measured and are con-
servatively attributed wholly to licensed activities .
The following ESG facilities and operations are specifically covered
in this report :
1,` Fuel Fabrications - Building 001 and supporting operations in
Buildings 001 and 004, De Soto Facility, Canoga Park, Californi a
One initial report in this series was issued for the Calendar Year 1975'" '
Foac' 7 :9-p?h "r-fl

01% Rockwell Interna tional
Energy Systems Group
ti0 N001 7i 990C'C3PAGE 5
2 ; Atorrics International Not Laboratory - Building 020, Santa
Susana =field Laboratories, Santa Susana , Californi a
3 ; Nuclear Material Development Facility - Building 055, Santa
Susana Field Laboratories, Santa Susana, Californi a
FORM 719-° REV . 7 .96

0 Rockwell Internaiona!
Energy Systems Group
No NO0171 :°000S
PAGE .
PERSO NNEL DOSIMETRY
Personnel dosimetry techniques generally consist of two types :
Those wnic i- measure incident radiation on the body fro .: external sources
(e .g ., °ilr badges ; and those which measure internal body organ accumula-
tions of radioactivity via inhalation , ingestion, or possibly through
cuts or puncture wounds (e . g ., urinalysis) . An attempt has been made to
separate the exposure nodes as much as possible along these lines to ;
permit an evaluation of the more significant exposure routes, and
(2i. to allow a differen tiation between those exposure sources which are
external and contro llable in the future and those which may continue to
irradiate the body for some time period, regardless of future efforts
(i .e ., internal body deposits' .
A . FILM/TLD DATA
Personnel external radiatio n exposures for the pertinent activities
or the year are presented in Table I where the number of individuals with
a specific annual dose is shown along witr: the percentage of employees
witr each annual dose value or less and the man- .are- contributed by eacr
dose value . These same data are plotted or Figure 1 on a log - probability
scale .* The average annual dose was approximately 200 mRem .
B . IN-v_`da LUNG SCAN S
Measurements are made periodically of the total radioactive lung
burden for specific radioisotopes of those employees who have been or
potentially were exposed to radioactive aerosols in the respirably-sized
particle range . These measurements are accomplished through the use of a
whole body counter .** During the year , 54 lung scans were made for uranium
Data which have a normal probability distribution appear as a straightline wher plotted on this type of scale .
**Relgesor. Nuclear Services, Inc ., Pleasanton , Californi a
F0RM 7 '9-P RE V . 7-76

O f Rockwell International
•• Energy Systems Group
NO NGOI T : 990003PAGE .
TABLE
WHOLE BODY DOSES - 197 6
Sheet 1 of 3
Dose P CPPop .Dos e
(:.Rem ; (eeople ; (cum . peo . * (cur: . . `r) (man-Rem ;
4.58 0 .05 5
10 30 41 17 .08 0 .300
15 "c"c 63 26.25 0 .33 0
20 14 77 31 .1/ 0 .280
25 15 92 38 .33 0 .37 5
30 13 105 43.75 0 .390
35 8 13 47 .08 0 .280
40 12 125 52.08 0 .480
45 8 133 55 .42 0 .360
50 134 55 .83 0.050
55 8 142 59 .16 0.400
65 143 59 .58 0.06570 4 147 61 .25 C .280
75 3 150 62.50 0-22-5-
80, 4 154 64 .17 0 .320
85 1 155 64 .58 0 .085
90 - 156 65 .00 0 .090
95 2 158 65 .83 0 .190
100 4 162 67 .50 0 .400
135 1 163 67 .92 0 .105
110 3 166 69 .17 0 .330
115 3 169 70 .42 0 .345
125 4 173 72.08 0 .500
130 2 175 72 .92 0 .260
14C 1 176 73 .33 0 .140
145 3 179 74.58 0 .435
160 i 180 75 .00 0 .160
165 - 181 75 .42 0 .165
*Cumulative people , with annual dose s indicated valu e
FORM 7'9-' REV . 7-7E

0D
Rockwell International
Energy Systems Group
NC NOC'_ :990333PAGE . 8
-ABLE 1
WHOLE BODY DOSES - 1_976
Sheet 2 of 3
Dose P CPPop .Dos e
; Rem) ; people) cum . peo .) ,cu-.n . (man-Rem ;.
175 1 182 715 .83 0 .17 5
185 1 183 76 . 25 0 . 1 85
190 - 184 76 .67 0 .190
195 1 185 77 .08 0• .195
200 1 186 77 .50 0 .200
205 2 188 78 .33 0 .41 0
220 i 189 78 .75 0 .220
230 1 190 79 .17 0 .230
250 1 191 79 .58 0 .250
255 1 192 80 .00 0 .255
270 i 193 80 . 42 0 .270
275 2 195 81 .25 0 .550
280 2 11 97 82 . 08 0 .560
290 1 198 82 .50 0 .290
300 2 200 83 .33 0 .600
310 201 83 .75 0 .31 0
315 1 202 84 .17 0 .315
320 1 203 84 .58 0 .320
325 1 204 85 . 00 0 .325
350 1 205 85 .42 C .350
393 2 207 86 .25 0 .780
415 1 208 86 .67 0 .41 5
470 209 87 . 08 0 .470
485 1 210 87 .50 0 .485
510 1 21 : 87 .92 0 .51 0
515 1 212 88 .33 0 .51 5
530 21"s 88 .75 0 .530
731-6 .271
FOR4 ite o REV. 7 .?a

04, Rockwell International
Energy Systems Group
hG "33F 990033
PAGE 9
TABLE i
WHOLE BODY DOSES - 1976
Sheet 3 of 3
Dose CFPop .
Dos enRer) (people) cu:.i . peo . ; ;cu- . !! an-Re-
550 1 214 89 .17 0 .550
610 1 215 89 . 58 0 .61 0
615 i 216 93 .00 C .61 5
620 _ 217 90 . 42 0 .620
630 _ 218 90 . 83 0 .630
635 1 219 91 . 25 0 .639-
66:5 1 22C 91 . 67 3 .665
670 1 221 92 .08 0 .67 0
680 222 92 . 50 0 .680
775 1 223 92 .92 C .775
835 1 224 93 .33 0 .83 5
895 ~ 225 93 . 75 0 .89 5
920 1 226 94 .17 0 .920
980 1 227 94 . 58 0 .980
1015 1 228 95 .00 1 .01 5
1115 1 229 95 .42 1 .11 5
1200 1 230 95 .83 1 .200
1390 1 231 96 .25 1 .390
11 430 232 96 .67 1 .430
1470 i 233 97 .08 1 .470
1600 1 234 97 .50 1 .600
1655 1 235 97 . 92 1 .655
1675 1 236 98 .33 1 .675
1690 1 237 98 .75 1 .690
1830 1 238 99 .17 - 1 .830
2030 1 239 99 .58 2 .030
2055 1 240 100 2 .055
TOTAL Man-Rem 47 .575573:-6 .27 1
FORM 719- P REV 7-78

nl Q, In r . IL) 19 V P)
OI
b ;
1 a)
C) CTC)' rt). .ri
C,
LI I
O,LULi
m
N
II
i
Nirl rr) N IU IA Y n) IV
a, La 11 4, IA V a )
"l UI O) I' . IL) In .} In LVL
i 101. N W r, w Lit •t In
01309 9tr
( IUouw) sisw
( IIT IX) N V, U) 4 N N
, , la Ni invN 0 . 1 1 1 1 ' I , I N II IIII I'iSI'IJAJ •)UIL% All IIUVUUUJ d/1
LL,
LLi
V "`
In

Rockwell Intemational 63Energy Systems Group PAGE .
deposition . Nine of the scans (on seven different individuals ; showed
positive results (Table 2A) .
BIOASSAYS
Bioassays nor-ally consist of analysis of urine and occasionally
of fecal samples . Personnel whose work assignments potentially expose
them to respirable - sized radioactive aerosols are routinely checked in
this manner . Normally, urinalyses are performed quarterly and fecal
analyses only when gross internal contamination is suspected . The
techniques employed are described in the appendix . A statistical
summary of the positive results for 1976 appears in Table 2A, while a
detailed listing of the positive results is shown ir, Table 2B .
FORM 719--= REV 7 -78

,T, Rockwell intemetional
Energy Systems Grout,
NO NOD!. 1993003
RAGE _ 2
TABLE 2A
BIOASSAYS - STATISTICAL SUMMARY - :47 6
.eas,;releent** ype**Tota lTests
Tcta lPositiveResults
TotalIndividual s
With Positiv eResults*
iU OF 419 24 24
U UR 415 7 0
GA iA `J O O
uA 1B 161 O :1
GA 2B 2 0 U
GB H 38 1 1
uGB G 1 v OPu A 38 1
Fp 1 5 2 2
3A 169 10 6
PP 3B 171 6
SR-90 2 2 2
U-235 IV 54 9
*Tests were repeated on some individuals wno showed positive results
** U = uranium
OF = uraniur..'- fluorometric
UR = uranium - radiometric
G = gross alph a
GB = gross beta
gross ciutOnium.
FP = fission products
`7LG = uranium, in-vivo lung count
Note
See Appendix for description of various bioassay type s
F:RV 719-° REV . 7-72

TA13LE ? B
POSITIVE BIOASSAY RESULT SUMMARY - 1976(Sheet 1 of 4 )
IIRS Sample Analysis Results Per Specific Equivalen tNumber Dale Type i Volume Analyzed 1500 mR-day Radionuclide MPBR %
1292 02/12/76 IVLC 38 ug 11235 10 .6% MPL B1292 03/29/76 IJ-LIF 0.0005 ug 0 .75 ug ll 0 .7 5129? 06/21/76 U-LJF 0.0001 ug 1 4 8% MPL3 U235 . .1292 06/29/76 IVLC 53 ug
3999 08/30/76 U-UF 0.0(103 ug 0.45 ug 4 50235 .3999 02/04/77 TVLC 0 ug
3897 10/25/76 U-FP3A 13. 9 dpm 104 dpm MFP (Sr9g) 21 . 73897 11/08/76 IJ-FP3A 3 .06 dpm MFP (Sr13
)3897 11/22/76 LJ-FP38 15 .4 dpm 132 dpm MFP (Cs)3
0 .0?3897 12/16/76 LI-1P38 3 .63 dpm MFP
1 7(Cs )2 r
4015 02/10/76 IVLC 52 u31
14 5% MPLB4015 06/30/76 IVLC
g0 ug l 2
.
1215 05/17/76 li-IUF 0.0004 ug 0.75 uU LI 0 .7 51215 08/23/76 U-UF 0 ug U
4148 07/19/76 U-LIF 0 .0005 ug 0.75 ug ll 0 .7 54148 11/22/76 U-UF 0 .0005 ug 0 .75 ug U 0 .7 54148 01/ 13/77 LI-11F 0 ug U
23 53969 02/09/76 TVLC 96 ugL1235 26 .8% MPLB
3969 06/29/76 IVI.C 26 ug 1 .2% MPL D3969 02/03/77 TVLC 0 ug L123
5r
1584 08/25/76 11-11R 2 .74 dpm 33 6 dpm 14 61584 11/ 22/76 U-IIR 0 dpm
.(1235
.
1584 08/25/76 1J-UF 0 .0006 ug 0 .90 ug LI 0 . 91584 11/22/76 U-LIF 0 .0002 ug LI

TABLE. 28
POSITIVE BIOASSAY RCSUI . T SUMMARY - 1976(Sheet 7 of 4 )
HAS Sample Analysis Results Per Specific EquivalentNumber Date Type + Volume Analyzed 1500 mR -day Radionuclide MPBB %
4025 03/15/766 U-11F 0 .0004 ug4025 06/02/76 U-11F 0 .000?
2040 06/29/76 TVLC 16 ug2040 05/03/78 IVLC 0 ug
3757 05/17/76 U-l1F 0 .0006 ug
0863 03/08/76 U-UF 0.0004 ug0863 04/30/76 U-OF 0 .0001 ug0863 06/21/76 l1-UF 0 .0004 ug0863 09/20/76 I1-1JF 0 ug
1863 05/04/76 11-UF 0 .0005 ug1863 08/16/76 U-UF 0 ug1863 05/04/76 U-1IR 1 .25 dpm1863 09/28/76 U-UR 0 .4 dpm1863 08/16/76 (1-UR 1 .0 dpm1863 09/28/76 11-UR 0.4 dpm
0178 01/76/76 1J-1JF 0 .0003 ug0178 08/23/76 U-UF 0 .0001 ug
4154 09/ 20/ 76 II-UR' 1 .40 dlnn4154 10/26/76 U-LIR 0 dpm4154 09/20/76 U-UF 0 .0003 ug4154 10/26/76 11-UF 0 ug
0.60 ug lI 0.6U
23 535 6.4% MPLB11 2
0 .90 ug 0 0 .9
0.60 ug LI 0 .6U
0.60 ug 11 0.6I I
0.75 ug U 0.75I1 5
18 .8 dpm 11735 H .2.
113515.0 dpm IJ235 6.5
0 .45 ug U 0.451.1
30 dpm 235235 13 .0
0.45 ug U 0.4511
fl l
n

TABLE 2 0
POSITIVE BIOASSAY RESIJL'I SUMMARY - 1976(Sheet 3 of 4 )
II&S Sample Analysis _ Results Per Specific EquivalentNumber pate 'type f Volume Analyzed' ' 1500 m12-day Radionuclide MPBB %
1731 01/19/76 1.1-11F 0.0013 ug 1 .95 ug II 1.951731 08/23/76 1.1-LIF 0.0001 ug Ii
3698 08/23/76 lJ-UF' 0 .0005 ug 0.75 ug U 0.753698 09/27/76 U-IUF 0.0007 ug 11
3986 02/10/76 IVLC 52 ug 11735 14 . 5% MPLB3986 09/23/76 IVLC. 0 ug 1123'
3888 04/23/76 U-UR 0 .0007 ug 1 .05 ug 11 1 .0523 5 4059 12/10/76 11-UR 1.11 dpm 16 .7 dpm 11 .35 7 . 3
4059 01/03/77 U-UR 0.24 dpm U235
4059 12/10/76 U-11F 0.0013 ug 1 .95 ug U 1.954059 01/03/77 II-11F 0 . 0001 ug U
3981 05/18/76 U-UF 0.0003 ug 0.45 ug I1 0.453981 08/11/76 I1-UP 0.0009 ug 1.35 ug 11 1.353981 09/20/76 0-I.IF 0 ug 11
4016 02/07/76 IVLC 52 ug 11235 14 . 5% MP1 .B
0606 05/24/76 11-11R 1 .04 dpm 15.7 dpm 11735 6 . 80606 08 / 16/ 76 II-OR 0.11 dpm 11235
3955 05/ 18/76 U-UR 0.53 dpm 1 .95 dpm U235 3 .43955 08/20/76 U-OR 0.22 dpm 11235
4007 05/02/76 U-UF 0.0005 ug 0.75 ug II 0.754007 08/23/76 U-IIF 0.0002ug U

TARI.F 273
POSITIVE BIOASSAY RESULT SUMMARY - 1976(Sheet 4 of 4 )
IIRS Sample Analysis Results Per Specific Equivalen tNumber Date Type + Volume Analyzed 16(70 mR-day Radionuclide MPBB X,
4028 01/75/76 lJ-Pu 0 .120 dpm 0 . 180 dpm Pu 0 .15402.8 02/ 29/76 U-Pu 0 . 126 dpm 239
Pu4028 11/07/76 ll-Pu 0 dpm Pu13
9
3946 05/ 03/76 U- 111' 0 .0004 ug 0.60 ug ll 0 .603946 05/28/76 U -UF 0 ug U
4020 05/17/76 lJ-UF 0 .0005 ug 0 .75 ug 1 1 0 .754020 06/18/76 U-OF 0 .0001 ug U
3656 01 /19/76 U- UF 0.001 ug 1 . 5 ug I1 1 . 53656 09/ 14/76 U-UF 0 .0007 ug 1 .05 ug U 1 .053656 10/14/76 l1-UF 0 . 0004 ug 0 . 60 ug U 0 .603656 10/14/76 1 J-UIK 0 .37 dpm 0235
2757 05/03 / 76 U-UF 0 .0004 ug 0 .60 ug U 0 .60275 7 11/01/ 76 U-UF 0 .0001 ug U
4134 06/28/76 Il-UF 0 . 0007 ug 1 /05 ug Il 1 .054134 08/20/76 U-UF 0 ug 11
r33949 02/09/76 IVLC 38 tag U r'. 10 .6% MPLB
3949 02/03/77 TVLC 0 ugU23 5
* - Positive resul t
4 - U-UF Urine - Fluorometric Analysis for UraniumI1-UR - Urine - Radiometric: Analysis for UraniumF- OF = Fecal - Fluorometric Analysis for UraniumF-UR = Fecal - Radiometric Analysis for Uraniu m11-Pu Urine - Autoradiographic Analysis for PlutoniumLI-FP3A- 8 = Urine - Radiometric Analysis for Fission ProductsIVLC In - Vivo Lung Count
'nw0C)C7W

Rockwell International NO 10. U^ 17 :
Energy Systems Group PAGE 17
H . ON-SITE RADIATION/RADIOAC'IVITY LEVEL S
Radiation and/or radioactivity level measurements normally consist
of three aspects : general area , air, and water.
A . AREA
Radiation exposure rates in working and storage areas are periodically
measured with portable survey instruments . The results of these surveys
are used to establish the necessary posting requirements and for control-
ling personnel exoosure . Film badges are mounted in selected location s
to provide an additional record of exoosure, integrated over quarterly
Periods .
B . AIR
Radioactivity in air is measured by fixed-location air samples and
air monitors and by lapel (breathing zone) air samples . Table 3
presents a summary of the fixed sampler results .
FO M 71's D DE' 7 -72

01% Rockwell International
Ene+gy Systems Grout
NO J9'9000.3
=AGE 18
TABLEI 3
INTERIOR (WORKING AREA) AIR SAMPLING SUMMARY - 197 6
Aloha Beta, gamma_ICI /CC %
3 : : i iding : rea Max . Av . Max . Av .
01-fuel fab . 5x10-11 9x10-12 ** **
04-cnem . labs
020-AIHL
NS NS*
NS
6x10-12
NS
3x10¹²
055-NMDr 8 .9x10-13 -3x10-13
** **
*Because of the nature of materials in use , alpha activity is notnormally assessed in Building 02 0
**Because o ` the nature of materials in use , beta activity is not normallyassessed in Buildings 01 and 05 5
Notes : Based on materials in use , the most restrictive M?C's in eachfacility would be :
Bldg . 001 : 1xiC-10 C` (U-235 )
Bld 020 10y
1 ;S 90 )g . : x Cc r-
Bldg . 050 : 2x10 '~ i:cc Pu-239 ; n
NS = Not Samoled
In Building 020, the measurements shown were made in arestricted access area .
Fc~%' 719-P RE% 7-7e

,j, Rockwell Inte rnational
Energy Systems Group
N O
AGE -
qOS1 19933 , S
1 9
the ATR fuel fabrication area o Building 001, about 5C indi-
viduals wore personal ( lapel) air samplers during the year . The average
reading of these samplers waste 5.0x10 ;0 µ Ci/hr-cc for a forty-hr work
week . The maximum weekly reading was 3 .4x10-9 µ Ci/ hr-cc . The permis-
sible limit i s 4x1 S ACi/hr-cc for the material in use . Fixed location
air monitors in the area ( 13 locations ) averaged 3 .5x,10-" , 'hr-cc ,-c
wit! tie highest single sample being 2.1x13 uC'./hr-cc .
Special Air Sampling - Building 05 5
.n Building 055, air samples are routinely taken near a number of
points adjacent to the glove box train as well as other pertinent
locations (stack, etc .) . These data are tabulated in. Table 4 in
descencinc order of magnitude and the date ( week)of each meas urement is
notes . In this manner, any unusual release i s more apparent . However,
an inspection. o' the data in Table 4 leads to the conclusio n that the
values are distributed i t ar. essentia l ly random manner, with no one week
standing out . Thus , is is concluded that no unusua l: releases occurred
during the year .
F.RV 7'9-= REV . 7.7E

Rockwell International
Ere,gy Systems Group
°1 990333
PAGE 20
TABLE 4
AIR SAMPLES, NMOF - BUILDING 055, 1976
Max . Curl: . Week Exp . *Sampling Location µCi-hr/cc Week Ending
GBR-3.': 1 .8-12 10/ 8GBR-_5A 1 .8-12 9/ 3
G3R-18S 1 .5-_2 7/3 0GBR-24NE 1 .5-12 1 2
^3R-1A - - 1 .2-12 10/12, 11/19GBR-3S 1 .2-12 9/17, 10/18GBR-5S 1 .2-12 5/28, 9/17GBR-6N 1 .2-12 5/14, 7,123, 7/30, 8/27GBR-15S 1 .2-12 2/1 0GBR-21S 1 .2-12 5/7, 7/30GBR-24SW 1 .2-12 / 9GBR-26S 1 .2-12 4/23, 10/18GBR-27N 2-12 8/13Filter Roorr. 1 .2-12 8/1 3Eberline "A" 1 .2-12 ? 2/23
Cher Lab . 8 .9-13 6/11, 8/13, 10/2 211/22, 12/2 3
GBR-4N 8 .9-13 7•/23GBR-BN 8 9-'3 9/24.GBR-19S 8 .9-13 3/26, 10/22GBR-20S 8 .9-13 2/20, 9 / 3, 12/1 7GBP -27S 8 9-13 5/28 7/30. . , ,
1 1/19, 12/1 0
SS Vault 5 .9-13 5/21, 9/24 ,10/8, 10/2 2
Support, Area 5.9-13 11/19, 11/24Stack 5 .9-13 4/30 10/1 7
Radeco "3' 3-13
,
-/ 9, 1/30, 2/20 ,9/17, 11/ 5, 12/28
*Maxir u ;- permissible exposure = x 10 µCi-hr/cc, aloha
731-C 2' _
FOF': 7 :9-= REV . '-?2

TABLE 5
RADIOACTIVITY CONiFNT OF AIMOSPIIIRICA11 Y DiSCIIARGID EfrI .Llf. NT' RELEASEDTO UNRESTRICTED AREAS - 197 6
ApproximateEffluent
Point of Vol yneBuilding Release (ft )
001 Stack Exit 2 .4 x 1010
004 Stack Exit 6 .9 x 1010
020 Stack Exit 2 .1 x 1010
022 Stack Exit 1 .0 x 1010
055 Stack Exit 1 .6 x 1010
ActivityMonitored
a
r?
ApproximateMinimum
DetectionLimit
(µ.Ci/mD.)
1 .7 x 10-1 6
5 .5 x 10-16
Sampling PeriodAnnual* MaximumAverage Observed
Concentration Concentration(/ACi/nil) (/LCi/m?)
<9.4 x 10⁻¹⁴ 8.3 x 30 13
<2 .5 x 10-1.4 2 .3 x 10-13
TotalRadioactivityReleased
(Ci )
<6 .4 x 10- 5
<1 .7 x 10- 5
4 .5 x 10-16 <4 .1 x 10-15 9 .3 x 10-14 <8 .1 x 10-6
/3 1 .6 x 10 -15 <:4 .5 x 10-15 2 .5 x 10 14 <8 .9 x 10- 6
= 9.7 x 1() 17 c2 .6 x 10-16
48 3 .1 x 10-16 9 .8 x 10-15
a 3.0 x 10⁻¹⁶ <8 .1 x 10-16/3 9 .7 x 10-
16<3 .6 x 10
1 5
a 2.6 x 10⁻¹⁶ <3 .4 x 10-16
1 .6 x 1.0-15 <1 .5 x 10-7
3 .2 x 1014 5 .8 x 10-6
8 .3 x 10 15 <2 .3 x 10-7
1 .9 x 10-14 <1 .1 x 10-6
7 .1 x 10-16 <1 .5 x 10- 7
Total <1 .1 x 10
Annual average ambient airradioactivity concentration - 1976
a
13<6,6 x I0-15
<1 .0 x 10-1.3
-4
*Effluent radioactivity is generally less than ambient air radioactivity . 731-G .2.71

,1` Rockwell Interna tional NO NOC, 1 990003
•• Energy Systems Group°AG_ 22
:11 . EFFLUENT MONITORING
FACILITY VENTILATIO N
Ventilation discharge air is continuously sampled at points down-
st-earr of the exhaust filters provided, prior to exiting the facility
system . hus, these measurements provide a record of radioactive
aerosols that were actually discharged from the facility by tnis route
curling the year . A portion of the discharged air is continuously drawn
via a side-stream through a high e-ficiency filter medium which collects
any particulate aerosols entrained in the sample . Table 5 presents a
summary of average and maximum radioactivity concentrations measured in
these systems during 1976 .
3 . L :QJ :G WASTES
All liquid wastes from buildings which may contain significant
amounts of radioactivity are drained to hold-up tanks where they are
sampled and the contents assessed for radioactivity prior to disposi-
tion . if the activity is below the prescribed limits NO CFR 20), it is
then discharged to the sanitation sewers . if, however, these limits are
exceeded, the waste material is pumped out and disposed through the use
of a commercial radioactive material disposal service . During the
period in question, the liquid wastes which were discharged to the sewer
system are summarized in Table 5 .
FORM 719 ° REV 7 7e

TAB(.r 6
LIQUID r. NUBF RADIOACTIVITY DISCIIARGLI)'rc) SANITARY SEWER - 19/ 6
oint or
ApproximateeffluentVolume ctivity
ApproximateMinimumDetection
Limit
Annua lAverage
Concentration
Sampl eMaximumObserved
Concentration
Tota lRadioactivityReleased
Building Release (gal) Monitored (p.Ci/m0) (µC1/m0) (iCi/m0) (Ci )
001 Retention 13,500 a 1 .2 x 10-9 1 .4 x 10 7 4 .4 x 107 - 67 .3 x 1 0
Tank g7 7p 4 .1 x 10- 1 .1 x 10- 2 .3 x 10- 5 .7 x 10- 6
004 Proportiona lSampler
1,253,000 a 1 .2 x 10-9
9
<3 .2 x 10-8
81 .4 x
-710
7
<1 .5 x 10- 4
9 4 .1 x 10 x`7 .3 x 10- 3 .7 x 111 <3 .3 x 10- 4
020* --- 0
055* --- 0
*All liquid radioactive wastes from these facilities are solidified and land buried as dry waste at a n.pp p
The maximum permissible concentrations for discharge to the sewer are 8 x 10⁻⁴ 110/1110(1 and 1 . x 10-3 µCi/m .0/3.riate disposal sitea ro
m
/31-G .271

0 Rockwel! International
Energy Systems Group
r
I :̀-P,OJX-10N
NO
PAGE .
IV . ENVIRONMENTAL MON1TORING*
ii0C_T1990'003
24
Environmental and facility effluent radioactivity monitoring at
Ato^ics International is performed by the Radiation and Nuclear Safety
Grou_ c- the dealt', Safety, and Radiatior Services Department . Soil,
vegetation, and surface water are routinely sampled to a distance o f
IO mi from Atomics International sites . Continuous ambient air sampling
and therrroiu-inescent dosir-etry is performed on-site for monitoring
airborne radioactivity and site ambient radiation levels . Radioactivity
in effluents discharged to the atmosphere from Ator!ics international
facilities is continuously sampled and monitored, to assure that the
amounts and concentrations released to unrestricted areas are within
appropriate limits, and to identify processes which may require additional
engineering safeguards to minimize radioactivity levels in such effluents .
In addition, selected nonradicactive constituents in surface water dis-
charged to unrestrictec areas are determined .
B . SUMMARY
Inc random variations observed in the environmental monitoring data
indicate that no significant local source of artificial radioactive
material existed in the environs . Additionally, the similarity between
on-site and off -site results further substantiate that the contribution
to general enb'iro nnental radioactivity due to operations at Atomics
international is essentially zero .
The environmental radioactivity measured and reported herein is
attributed to natural sources and to continued fallout of radioactive
material from foreign atmospheric testing of nuclear devices .
*A separate and comprehensive environmental radioactivity and facilityeffluent report i s issued annually . he material in this section waslargely abstracted from the report for 1976.` '
FOP V 71? - RE . 7-78

Iil Rockwell Interna tional
Energy Systems Group
NO "'Q' 1110010003.
PAGE - 2
The sampling and analytic methods used in the environmental monitoring
prograr for radioact ive materials are described in Reference 2 .
The average radioactivity concentrations in local soil , vegetation,
surface water, and ambient air for 1976 are presented in Tables 7 through 1 1 .
in calculating the averaged concentration value for the tables, those
indivicwa : samples having radioactivity levels less than . their rinim-r
detection levels !N-.DL) are assured to have a concentration equal to the
MDL . This method of data averaging , required by ERDA Manual Chapter 0513,
affords a significan t level of conservatisr in the data , as evident i n
the tables, in that most radioactivity concentrations are reported as
"less than." (K) values . Thus , for measurements in which some apparent
radioactivity concentrations are below the MOL, the true averaged value
is somewhat less than the value reported .
The maxi-um level of radioactivity detected for a single sampie is
reported because of its significance in indicating the existence of a
major episode or area-wide location of radioactive material deposition .
None of the maximur observed values , which occurred randomly during this
year, show a great increase over the average values beyond natural
variability . This indicates that no significant event occurred, locally
or worldwide , which resulted in a marked increase it local radioactive
material: deposition .
The results reported in, Tables 7 and B show no significant difference
between on.-site and off- site samples . The detected activity is due to a
variety of naturally occurring radionuclides, and to radioactive fallout
resulting frog dispersal of nuclear weapons materials and fission products
`by atmospheric testing . Naturally occurring radionucludes include : Be,B7
K`C., Rb , Sml ', and the uraniur and thorium series (including the noble
gas radon and its radioactive daughters ) . Radioactivity from fallout
consists primarily of the fission products Sr90 -y90, Cs137, and pm147
and also 1;235 and ?u-3 g
FOO 719.- Rek 7-78

02, Rockwell International
Energy Systems Group
NO NODI : 99OUc3
PAGE 26
TABLE 7
SOIL RADIOACTIVITY DATA - 197 6
Gross Radioactivity; .:CijGm ;
MaximumNumber Annual Average Value Observe d
Area Activities Sample ( 95% Confidence L evel ; Value*
On-Site a 144 ( 5 .6 = 1 .5 ))• 10-' 8 .4 x 10-7
3 144 (2.5 0 .1) 10- 3 .2 x 10- 5
Off-Site a 48 (5.6 - 1 .5) 10- 1 .0 x 1O_6
48 (2.4 . 0 .1 ; 10-5 3 .0 x 10-5
*Mlaxir lum value observed for single sample .
TABLE 8
VEGETATION RADIOACTIVITY DATA - 1 976
Gross Radioactivity(N.Ci /gm)
Dry Weight AshAnnual Maximur
Number Average Annual Average Value ObservedArea Activity Sample Value ( 95` Confidence Leve l ; Vaiue*
On-Site a 144 (<3 .1 = 2 .6) 1C-8 (<1 .9 T 1 .6 1 10 -' 1 .2 x 10-6
L' 144 (2 .5 = 0 .1) 10-5 (1 .70 = 0 . 031 10-4 2 .99 x 10-
Off-Site 48 (<4 . 4 = 3 .3 ; 10-€ (<2 .2 t 1 .7) 10- 1 8 .4 x 10- '
g 48 (3 .0 - 0 .0;10-0 (1 .41 = C .03) 10-4 2 .74 x 1C- 4
*Maximurr value observed for single sample .
731-G .271 -
FORM 719 -o REV 7-7E

,IS Rockwell International
Energy Systems Group
NO 'OC_TI990•0C3DAGE 27
TABLE 9
NDFL PROCESS WATER RADIGACTIV_7TY DATA - 197 E
Gross Radioactivity4 C i /m,2( ,
Max t^!G*Number Averace Value Observed
Area Activity Samples fa z' Confidence Level) Valu e
24 (<2 .5 z 2 .9) 10-10 4 .2 x 10-10
24 12 .0 _ 0 .7) 110-9 2 .5 x i0-9
*Naxlmum value observed for single sample .
731-G .27 1
Fc--RM 799-- aE V . 7.75

Rockwell Interna tional
Energy Systems Group
,yo . NOOITI99OC03
PAGE . 28
TABLE i 0
BELL CREEK AND ROCKETDYNE SSFL RETENTION PONDRADIOACTIVITY DATA - 197 6
gross RadioactivityMaximum
Number Average Value Observed = o fArea Activ'.ty Samples (95`_ Confidence Level) Val ue* Guide**
Bell Creek a 12 (3 .8 1 .3) 10-7 9 .1 x 10- NAMud No . 54 -5 _
'(Ci/cr•) w 12 (2 .3 = 0 .1) 10 3 .0 x 10 `+ A
SSFL Pond a :2 (5 .4 - 1 .5) 10-7 7 .7 x 10-7 NAMud No . 5 5
Ci ;gm) ;3 12 (2 .5 = C .1) 10 b 2.6 x 10_3 N A
Bell Creek 12 (<1 .7 - 1 .6)7
10 3 .2 x7?
10-' NAVegetationNo . 54
Ci/gm ash )( ,•3 12 (1 .64 = 0 .03 ) 1O 2 51 x 10~ NAr .
Bell Creek a 12 •'<3 .4 t 3 .i) 1_0-8 7 .0 x 1C-8 NAVegetation.No . 54(LCi/gm dry 12 (3 .2 = 0 .1. 10-5 4 .6 x 10- NAweight )
Bell Creek a 12 (<2 .5 = 2 .4) 1010 2 .8 x 10- <C .006Water No . 1 6loci/C) Q 12 (2 .2 0 .8) 10 2 .9 x 104 0 .7
SSFL Pond a 12 (<2 .4 2 .9) 10-10 <2 .4 x 10-10 0 .006Water No . 6 c
-o
-(adi/mr) 12 (a .3 = 0 .8) 10 5 .5 x 10 1 . 4
SSFL Pond a 12 (<2 .8 = 3 .0) 10 10 5 .s" x 109 <0 .007Water No . 12 g -(uCi/mr) 12 (4 .4 = 0 .8) 10 7 .0 x
y10 1 . 5
*Maximum val ue observed for si ngle sample .
**Guide : 4 x 10⁻⁶ AC i,/m:ea, 3 x 10⁻⁷ uCi!r:<$ 10 CFR 20 Appendix B
NA = Net appl icable, no Guide v alue having been established .
731-G .27
FC?M 719-F o_V 7 .7€

,l, Rockwell International
Energy Systems GrouD
.Il vi-t
J_ I--10n 0003VQ - .1 J
PAGE 29
-A3LE 1 1
AMBIENT AIR RADIOACTI V ITY DATA - 1976
MaximumNumber Average Value Observed ` of
Area Activity Samples ( 95% Confidence Level ) Value- Guide**
Headquarters a 719 (<6 .7 = 8 .4) 1015 1 .4 x 10-i3 5 .22
yiCi/ • Y ** 719 (<9 . = 1 .0) 10 i4 7 x 10-12 3 .032
NDFL .1 2520 (<6 .5 = 7 .2` 10 155 .3 x 10-1
4
(,(rCi/rx; 3 ' *** 2520 (< 1 .1 = 0 .2 ) 1 0 13 3 .4 x 1o-12 3 . 7
*.Maximum value observed or single sample .
**Guide : Headquarters - 3 x 10 12FCi/mile (o) ; 3 x 10⁻¹⁰ pCi/mx ; ,y)(4 f
NDFL - 6 x 10 1c .Ci/mx (o) ; 3 x l3 Ci/mi L(, y )3Wttiriminum Detectable 'r evel (MR ) ; 5 . 6 x 1C -1 µC'. ;-:, Individual sample s
with activity levels of C to 5 .6 x 10 10 µ Ci/m2 are recorded and averaged as
5 .6 x 10 1~µCi/mx .*** Minimum Detectable Level (N.DL) 1 .2 x 10 i4 µ Ci/sI - Individual dail y
samples with activity levels o f 0 to 1 .2 x 1014µCi /mr . Indicated
average values are uoper limits, since some data were below the
minimlum detection limits .
FORS: 7+9-' REV . 7-78

014 Rockwell International
Energy Systems Group
NwOOIT19oDJ .. n :K 1:1'i .,
30?A E
Drocess water used at the NOEL is obtained from Ventura County Water
District No . 8 , which also supplies nearby communities , and is distributed
on-site by the same piping system previously used when process water was
obtained from. on-site wells . Conversion was completed during 1969 .
Pressure is provided by elevated storage tanks and storage reservoirs .
Water from the pipe syste€ is sampled monthly a= two locations . The
average process water radioactivity concentration is presented in Table 9 .
Surface waters discharged from NDFL facilities and the sewage plant
effluent drain southward i nto a retention pond on Rocketdyne property .
When full, the pond may be drained into Bell Creek, a tributary of the
Los Angeles River in the San Fernando Valley, Los Angeles County .
Pursuant to the reouirements of Los Angeles Regional Water Quality
Control Board Resolution 66-49 of September 21, 1966, a sampling station
for evaluatin; environmental radioactivity in Bell Canyon was established
in. 1966 approximately 2 .5 mi downstream front the southern Rockwell Inter-
national Corporation boundary . Samples, obtained and analyzed monthly,
include stream bed mud , vegetation , and water . Average radioactivity
concentrations in Rocketdyne ponds and Bell Creek samples are presented
in Table 10 .
Comparison of the radioactivity concentrations in water from the
ponds and from Bell Creek with that of the supply water shows no
significant variation in either alpha or beta activity .
The surface water (NDFL) and the ambient air- radioactivity Guide
values selected for each site are the most restrictive limits for those
radionuclides currently in use at Al facilities . The identity of all
such radionuclides is known, irrespective of concentration . Accordingly,
for NOEL surface water, the Guide values of 4 x 1Q-6 µ Ci/ mbo and
3 x 10⁻⁷ pti!r;.Y Q for pu23' and for 90 , respectively, are appropriate .
FORV. 7l 9 a REV . 77 -7E

Rockwell InternationalEnergy Systems Groav
tiJ 31031 990Or. 3
PAGE - 31
The corresoondincly most restrictive Guide value for Headquarters waste-
water radioactivity discharged to the sanitary sewers, a controlled
area, is 8 x 10⁻⁴ r.Ci/mkaand 1 x 10 .Cil.-11R, for U-235 and Co6"
respectively . For NDFL ambient air radioactivity is due to work with
unencapsulated plutonium at this site . The Guide value o f
3 x 1G-171/4C4/m.901, for Sr 0, is due to the presence of fission products
in irraciated nuclear fuel at the site . The Guide value o f
3 x 1_G-1c ,iCi/mia for 4eadquarters ambient air radioactivity is due to
work with unencapsulatea uranium (including depleted uranium) at this
facility. The Guide value of 3 x 10⁻¹⁰ MCi/mI $ for Co6C, for Head-
quarters ambient air radioactivity is appropriate since it is the most
restrictive limit for beta emitting radionuclides present at the facility .
Guide value percentages are not presented for soil or vegetation data
since no concentration. Guide values have been established for these
media .
Ambient air sampling for long-lived particulate alpha and beta radio-
activity is performed continuously with automatic sequential samplers at
both the Headquarters and NDFL sites . Air is drawn through Tyoe HV-70
filter riedia which are periodically analyzed, after a minimum 120-h decay
period to eliminate the naturally occurring radon particulate daughters,
for long-lived radioactivity . The average concentrations of alpha and
beta ambient air radioactivity are presented separately in Table 11 .
Radioactivity levels observed in environmental samples for 1976,
reported in Tables 7 through 11, compare closely with levels reported for
recent years . Local environmental radioactivity levels, which result
primarily from beta-emitting radionuclides, and have shown the effect of
fallout during past extensive atmospheric testing of nuclear devices,
have decreased, and_nave been generally constant during the pas t
several years . The effects of recent, althougn infrequent, foreign
atmospheric nuclear tests occasionally continue to be observable in
daily ambient air radioactivity levels ; however, the long-term effect s
on surface air sample radioactivity levels are not discernible . The continued
FC ~4' 77S f PEv ; .,e

,•j, Rockwell International
Energy Systems G roup
O'O T990003NO ~w;1_ ~
32
relative constancy in current environmental radioactivity is due
primarily to the dominance of naturally occurring radionuclides in the
environment and to the longer-lived fission product radioactivity from
fallout .
Site ambient radiation monitoring is performed with several types
of TLC's . Each oosineter packet includes a single calcium, fluoride
(CaF2 :Mn) low background bulb-type chip dosimeter which produced the data
used in this report, a single calcium fluoride (CaF2 :Mn) bare chip dosi-
meter, and two calcium. sulfate (CaSO4 :Dy) low background powder-type
dosimeters . The additional chip dosimeter is used for continued develop-
cent of 7L0 dosimetry programs at Al . The powder dosimeters, supplied
and evaluated by a commercial radiation dosimetry laboratory, are use d
as oackup to the low background bulb-type dosimeter . The dosimeter sets
are placed at selected locations on or near the perimeters of the Head-
quarters and NLDF sites . Each dosimeter, sealed in a light-proof energy
compensation shield, is installed in a polyethylene -container mounted at
each location . The dosimeters are exchanged and evaluated quarterly .
There are iC on-site monitoring locations . Three additional dosimeter
sets are located off-site at locations up to 10 rni from the sites and
similarly evaluated to determine the local area ambient radiation level,
which averaged 0 .0095 mRem,%h for 1976 . The average radiation dose rate
and equivalent annual dose monitored at each dosimeter location are
presented in Table 12 .
The table shows that radiation dose rates and equivalent annual
doses monitored on-site (average = 95 .5 mRem) are nearly identical to
levels monitored at three widely separated off-site locations (average =
93 .6 miRem) . These data include the natural background radiation component,
which exists as a consequence of cosmic radiation, radionuclides in the
soil, and radon and thoron in the atmosphere , in addition to radioactive
fallout from nuclear weapons tests . Locally, this is approximatel y
FQ .M -,a-. =- '.'e'

Rockwell International
Energy Systems Group
YO . Nor1T g9O?C3
PAGE . 33
TABLE 12
SITE Ahl?'EN- RADIATION DOSIMETRV DATA - 197 6
Dosimeter Averaoe Dose RateEquivalent
Annual Dos eLocation (mRem/h) (mRem !
'LD-I Headquarters 0 .010 88
TLD-2 Headquarters 0 .008 70
TLD-3 Headquarters 0 .011 96
TLD-! Headquarters 0 .011 96
TLD-5 NOEL 0 .012 105
TL3-6 NO'L 0 .013 11 4
TLD-7 NDFL 0 .014 123
TL"u-8 NOEL 0 .012 105
TLD-9 NOEL 0 .008 70
TLJ-1 0 NDFL 0 .010 88
TLD-11 Off-Site 0 .010 88
-LD-12 Off-Site 0 .012 105
TLD-13 Off-Site 0 .010 88
731- :7 .27 1
Fa.AN 7199-F REV 7.78

,j` Rockwell International
Energy Syste ,Energy s Group
N3OiT 993303PAG E 34
i 00 mRe fyr or-0 .011 mRe /h . The small variability observed in the
data is attributed to differences in elevation and geologic conditions
at the various dosimeter locations . Since the data for the on-site and
off-site locations are nearly identical, it is considered that no measur-
able radiation exposure to the general population or to individuals in
uncontrolled areas resultea from Al operations .
Fo?N 715 -F REV 7-78

Rockwell International
• Energy Systems Group
i . UNUSUAL EVENT S
A . BUILDING 001 - ATR X-RAY BOOTH
TI9 nI4 i. ~~ 4 .1 .7V V.7
a 35
On May 26, 1976, some men were discovered doing work atop the roof
of the ATR radiographic room while X-ray operations were in progress . in
reconstructing the incident, it was learned that the dose rate in the
area where the men were working was Generally less than 2 rR/h with the
nighest spot being about = mR/h . Since the machine had only been on a
total of 6 .routes, the maximum possible dose was 0 .4 mR, which is negli-
gible .
Steps to establish closer liaison between personnel working on/
around radiation producing devices and personnel or whoa the work is
being performed will be established to avoid such future inciden_s .`b '
B . BUILDING 301 - ATR POWDER ROOM
On June 17, 1976, a can of -3 kg of recycled UAlx briquets was dropped
and the briquets momentarily ignited , and then extinguished themselves .
However , some amount of the uranium oxide was dispersed as an aerosol .
Nasal swipes were obtained from all who had been in the room . Only one
measurable swine was obtained (-20 dpm/100 cr2? . Some protective clothing
contamination occurred . 'i nvolved personnel submitted urinalysis samples .
Additional instruction was given on this operation which should help to
prevent future such incidents. (6 11
BUILDING 001
On August 26, 1-976, a sealed transfer can containing uranium fines
was inadvertently dropped to the floor while being transferred from the
SNP. Vault Weigh Room to the Head-in Process Room .. The drop resulted in
the autoignition of the contained fines . A very limited amount of uranium
dispersal occurred before an inverted 5- gal can was placed over the transfer
FD?\' ;ly> REv`- 'Je

Olt Rockwell Intemanonal
Energy Systems Group
N0C1T I993OOC3
3 6
can . A floor smear survey revealed 200 dpm / 100 cm„2 present in an area
immediately adjacen. to the incident . Nasal swipes were taken which
showed a maximum of 11 dp, a . A small finger cut also occurred during
the incident . A wound smear revealed - 40 dpm , alpha and was successfully
decontaminated to 0 . The five personnel involved were requested to submit'7 '
bioassay specimens .` '
0. BUILDING 001 - ATR FLUOROSCOPE ROOM
On November 3, 1976, an inadvertent exposure occurred to the operator
of a fluoroscope machine while performing routine operations on an ATR fuel
plate . Apparently, the machine had been still operating during the time a
plate was being removed, with the window-door open . With the machine shut
down, a mock repeat of the incident was carried out . The time was noted as
12 seconds . Radiation readings were =hen taken with the machine on at the
same settings with the window-door open . By duplicating the operator's
motions as close as possible , the following doses were estimated :( '
Conservative estimated head dose - 2 .4 R
Conservative estimated eye dose - 1 R
Probable head dose 0 .8 R
Probable eye dose 0 .3 R
The automatic interlock switch that failed to function, causing the
beam to stay on, was examined and found to have a faulty spring in the
open position inside the switch . This was repaired, and two new micro
shutoff switches and spare Darts ordered . As an additional safety device,
a radiation rate meter with loudspeaker volume control was installed with
the probe positioned at the operator's head level . This will give the
operator a sound alarm in the event he does not see the light .
E . BUILDING 004
(None )
FCOV77S.-FIEV 7-78

Rockwell International
Energy Systems Grou p
F . BUILDING 020
(None ;
G . BUILDING 055
(None ;
Np_? -T 900303
37
FQFV 719-° REV . 7-78

,I` Rockwell International
Energy Systems Grow
PC NOO1TI990003
PAGE 38
SUMMARY/TRENDS - EXPOSURES, EFFLUENT S
All personnel and environmental exposures, and effluent releases to
uncontrolled areas for 1976, were below the allowable limits . The 1975
reporti3' established baseline data for identification of trends in
succeedinc years . Comparing the 1976 measurements to those of 1975, the
following is noted :
Total Man-Rem (whole body) : 26 .700 (1975) ; 47 .575 (1976)
Comment : An inspection of the source for the majority o f
this increase leads to the conclusion that it
arose largely with an increased level of D&D
activities .
2) Bioassay
Total Assessments (all types) 1483 (1975) 1442 (1976)
Total Positive Results 57 64
Total Individuals with Positive Results 47 58
Co,- ent : There would not appear to be a significant increase
in the number of positive tests, although there were
a few more such tests and individuals with positive
results .
3) Building Discharge Ai r
Radioactivity in building discharge air remained well below
established limits . The largest change was from Building 020,
where the total 8, a activity discharged decreased from
6 .7 x 10 3 Ci in 1975 to 5 .8 x 10-6 Ci in 1976 .
4) Environmental Monitoring
r genera . comparison of the site environmental monitoring
results for the current and previous years (soil, vegetation,
process water, Bel : Creek mud and water, and SSFL pond water )
FOR V 7' 9--° REV . 7-7e

/k, Rockwell Interna tional
Energy Systems Group
r, C. 10C1i1990003'AG E . 3 9
reveals no significant differences . Also, ambient air radio-
activity did not vary significantly between the two years .
The general background radiation (13 stations, see Table 121
was 0 .012 mRem/h (1976) and 0 .011 mRen/h (1975) .
The overall conclusion is that no increase in radiological impact
of :he environs occurred in 1976 . Personnel exposures did increase
somewhat, primarily due to D&D activities, although they still remained
well within the prescribed limits .
FO- W '.19-°REV 7-Te

Rockwell International
Energy Systems Group
NO
PACE
MOO l T i 9900 C3
VII . ANTICIPATED ACTIVITIES DURING NEXTREPORTING PERIOD (1977 )
A . BUILDING 001 (FUEL FABRICATION FACILITY)
Continued fabrication of ATR fuel elements .
B . BUILDING 004 (HOT ANALYTICAL CHEMISTRY )
Continued routine analytical chemical processes and analytical
chemistry of 93% U-235 enriched ATR fuel elements .
C. BUILDING 020 (HOT LABORATORY )
Continued preparation for decladding of irradiated fuel
elements from HNPF . Continued decladding of SRE Core II fuel .
D . BUILDING 055 (NMDF )
it is currently planned to remove all plutonium from the facility
early in the year and then to proceed with decontamination of the glove
boxes .
P . .̂a 71 e_P 3E ._'-7e

,l, Rockwell International
♦♦ Energy Systems Group
REFERENCES
NO N;001T1990003GE 41
'_ . G .S . Nuclear Regulatory Co~lmissior - Special Nuclear MaterialsLicense No . SNM-21 , USNRC ;September 15, 1977 )
2 . "Atomics International Environmental Monitoring and FacilityEffluent Ann ;i al Report - 1976," J . 0 . Moore, AI -77-14, AtorricsInternationa l
_ . "Annual Review of Radiological Controls - 1975," R . S . Hart,N0017I990002, Ato .ics International ;July 2, 1979 `
4 . Code of Federal Regulations , 10 Energy, Part 20, as revised,January 1979
IL, "ATR X-Ray Booth Incident," R. J . Tuttle from R . R . Garcia,Rockwell international, July 3, 197 6
6 . IL, "AIR Powder Room Incident ," R . J . Tuttle from R . R . Garcia,Rockwell International , June 28, 197 5
7 . I "Incident Report - SNM Transfer Can Drop C/001," R . J . Tuttlefrom F . E. Begley, Rockwell international, September 2, 1976
8 . IL, "ATR Fluoroscope Incident ," R. J . Tuttle from J . H . Wallace,Rockwell International, November 16, 1976
FCQ 715' REV '-7e'

Olt Rockwell International
Energy Systems Group
hC NO01Ti990103PAGE 42
APPENDIX
PERSONNEL MONITORING PROGRAM
Film badges are furnished by a vendor service, the Radiation Detection
Company . Kodak type-F personnel monitoring film. is used . The film badge
holder is equipped with plastic, aluminum, cadmium, and lead shields, as
well as an "open window" behind which the film is unshielded . Evaluation
of radiation dose on the basis of film density requires an interpretation
of the type and energy of the radiation involved . This interpretation is
made by evaluating the differences in the film densities behind these
various shields .
Two separate calibration energies are used to determine X-ray and
ga ma doses on the basis of film densities : ;1)r0150
gamma rays, and
1%2) 35 keV X-rays obtained from 80 kVp X-rays filtered with 2 nu! Al .
The effective energy of X-ray or gamma radiation is determined on the
basis o= the ratios of open window film density to film densities under
the different filters as indicated in Table A-1 . If the effective energy
of the radiation is determined as =70 keV, the 35 keV X-ray calibration
data are used . In this case, the fiirr density of the open window are a
is converted to dose by means of the 35 keV calibration curve . A
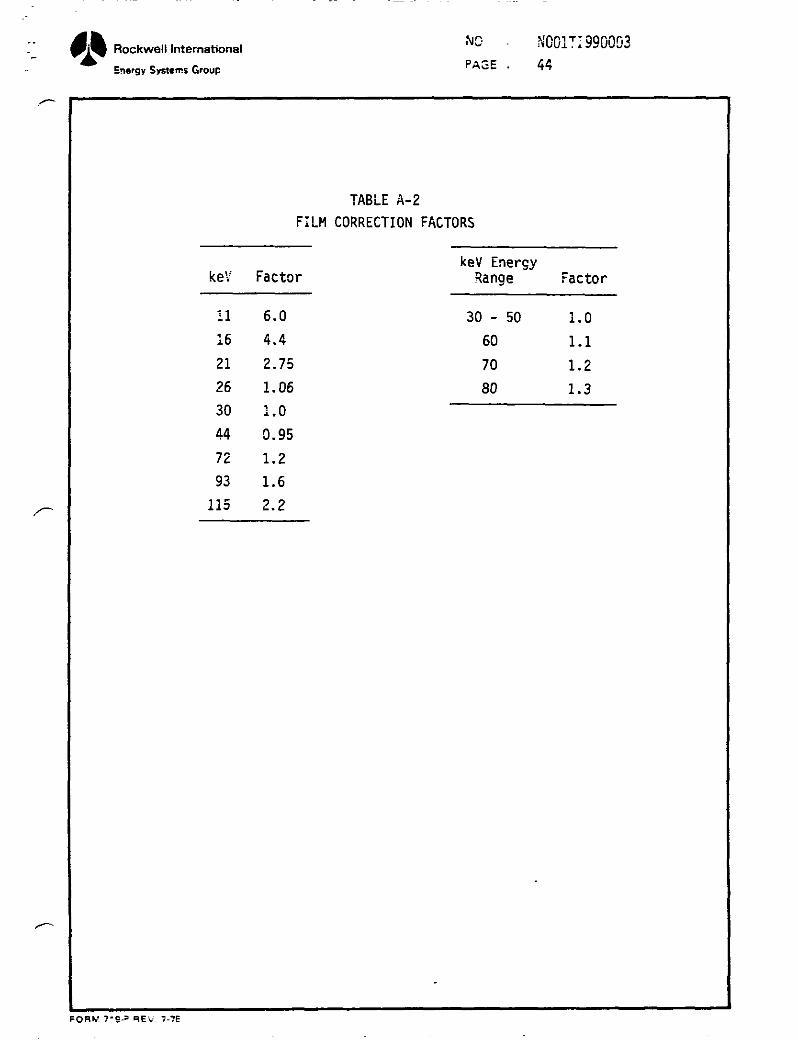
correction factor is then applied as determined from Table A-2 . For
example , if the effective energy is 30-50 kV, the correction factor is
1 .0 . If the effective energy is 60 keV, the correction factor is 1 .1,
etc . If the effective energy of the radiation is above 70 keV, the Co60
data are used and the density of the film behind the Pb filter is converted
to dose by means of the Co60 calibration curve .
Beta dose calculations are made by subtracting the density of the
filmm located behind the plastic shield from the density of the film
behind the open window , multiplying the remainder by a beta factor, an d
FOP Y. ?19 .- R t v . 7-?s

,+
+(, Rockwell International
Energy Systems Group
NO N001 T19900013PAGE 43
TABLE A- 1
FILTER RATIOS AS A FUNCTION OF AFFECTIV EX-RAY ENERGY FOR R-D PLAS TIC BADGE
Ratiospen Window Open Window Upen Window .. pen 'in ow
keV to Al to Plastic to rd tc Pb
11 15 1 .8 -- --
16 2 .5 1 .2 -- --
27 2 .2 1 .'- -- --
23 1 .9 1 .05 -- - -
25 1 .E 1 .05 40 --
30 1 .5 1 .05 31 --
35 1 .25 1 .0 8 .0 --
t4 1 .10 1 .0 7 .0 23
72 1 .05 1 .0 3 .3 10
93 i .0 - .0 2 .1 6 . 5
115 1 .0 1 .0 2 .0 5 . 4
Note : Filter ratios apply only to linear portion of characteristi ccurve which is up to about a net density of 1 .0 . I f higherdensities are encountered , then the ratio of apparent dosesas determined from the characterist ic curve must be used .
731-G . 271
FORM 7 19-F REV 7-7E
,, Rockwell International
• Energy Systems Group
tiv N, 00 1 T :J900J.''.
PAGE 44
TABLE A-2
FILM CORRECTION FACTORS
ke` FactorkeV EnergyRange Factor
1 1 6 .0 30 - 50 1 . 0
16 4 .4 60 1 . 1
21 2 .75 70 1 . 2
26 1 .06 80 1 . 3
30 1 . 0
44 0 .95
72 1 . 2
93 1 . 6
115 2 . 2
FORM Yg? REY ---7E

Rockwell International
• Energy Systems Group
NC 1001T111990003PAGE 4 5
converting to dose by means of the Co60 calibration curve . Each beta
factor is specific to a single, known radionuclide . If the radionuclide
is unknown, a factor of 1 .3 is applied .
Eastman type NTP. nuclear track plate film is used for fast neutron
monitoring . The filr is calibrated with a Dolonium-beryllium neutron
source . high energy neutron exposures are interpreted by counting the
number of proton recoil tracks in 25 fields of view under high-power
microscopy and assigning a dose on the basis of the total number of
tracks observed .
Thermal neutron exposure is determined to be present when the film
density under the cadmiu m filter is 1 . 25 times the film density under
the lead filter . When such is the case , both density readings are
converted to dose from the 0060 calibration curve and the dose from the
lead filter density is then subtracted frorr the dose obtained from. the
cadmium filter density . half of the remainder is converted directly to
case in rem .
All personnel film badges are processed routinely by the Al film
badge vendor (Radiation Detection Company) according the the methods
described above .
Certain operations, such as hot cell entries, which pose a high
exposure potential, require the use of special badges, which are badges
worn for a single operation in place of personal badges . When special
badges are required, two badges are worn by each individual . Special
badges are evaluated according to the method previously described ;
however, the average reading of the two badges is recorded as the dose .
All special badges are processed at Al by the Radiation and Nuclear
Safety Group .
FOPV 7-9-z REV . 7-78

NO N001 17 19 910003Rockwell International
Energy Systems Group 'AGE
-A
I-
In the event of an accidental criticality incident, the filr.. badge
holder also contains additional components for the measuring of the hig h
level gama and neutron exposures generally associated with this typ e
of incident . Excessive film blackening (from gamma radiation) may
prevent the microscopic enumeration of proton recoil tracks . Therefore ,
aneutron exposures above 10 rad are determined by means of act)( tion
analysis of sulfur pellets, gold and indium foils, and a copper washe r
which are incorporated into the film holder .
HIGh LEVEL NEUTRON DETECTORS
MaximumMaterial Dimensions Energy Detected Sensitivity-n/cm '
Indium 0 .70 in . x Thermal to 2 .0 ev Approximately 10 40 .70 in . x0 .005 in .
Sulfur (Four pills of 2 .9 MeV and above 5 x 1C79/32-in . diam-eter) C.25 gmtota l
Copper Circular Washer 2 .0 eV to 1 .0 MeV
Gold 0.25 in. x 1 .0 MeV to 2 .9 MeV 2 x 10⁶;bare) 0 .25 in . x
0 .005 in .
The very high thermal neutron sensitivity of indium makes i t
extremely useful as an exposure indicator . In the event of an acci -
dental criticality the high energy neutrons will be moderated and
reflected by the body, thereby producing thertai and intermediate energ y
neutrons that will activate the indium . By using a G .M. survey instru -
ment, those exposed can be detected for -5 hr following an incident .
FOP'' 715? REV . :-7Q
Rockwell Internationalh0 N00IT1 9930C3
-- Energy Systems Group PAGE - 4 7
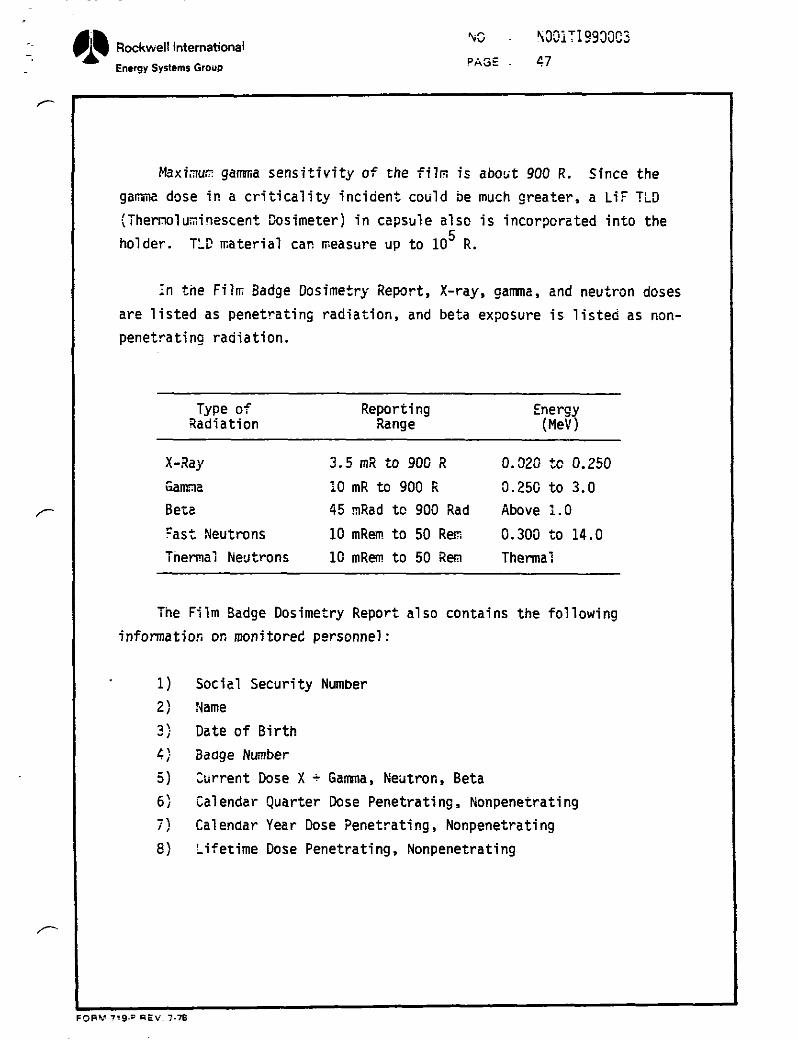
Maximum gamma sensitivity of the film is about 900 R. Since the
gamma dose in a criticality incident could be much greater, a LIE TO
(Thermolu;inescent Dosimeter) in capsule also is incorporated into the
holder . TLD material can measure up to 105 R .
in the Film Badge Dosimetry Report, X-ray, gamma, and neutron doses
are listed as penetrating radiation, and beta exposure is listed as non-
penetrating radiation .
Type of Reporting EnergyRadiation Range (Me:' )
X-Ray 3.5 mR to 900 R 0 .020 to 0 .250
Gamma 10 mR to 900 R 0 .250 to 3 .0
Beta 45 mRad to 900 Rad Above 1 . 0
Fast Neutrons 10 mRem to 50 Re^: 0.300 to 14 .0
Thermal Neutrons 10 mRem to 50 Rem Thermal
The Film Badge Dosimetry Report also contains the following
information or. monitored personnel :
1) Social Security Number
2) Name
3) Date of Birth
4) Badge Number
5) Current Dose X = Gamma , Neutron, Bet a
6) Calendar Quarter Dose Penetrating, Nonpenetrating
Calendar Year Dose Penetrating, Nonpenetratin g
8) Lifetime Dose Penetrating, Nonpenetratin g
FOR47`9 REV-7-79

Rockwell International
Energy Systems Group
r,~; N0O1TT_990003
PA3 E 48
At the end of the year, Radiation Detection also sends an individual
ERDA For-i-5 on each person on the film badge roster with a summary of the
above information .
ANALYTICAL PROCEDURE SUMMARY FOR BIOA SSAY BY URINALYSI S
The following summary of analytical procedures is limited to the
most frequently performed urinalyses for radioactive material .
Uranium-radiometric and Fiuorometric (UR, UF )
Uranium is extracted from an acidic solution of ashed urine using
aluminum nitrate, tetrapropyl ammonium hydroxide, and methyl isoburyl
ketone . The uranium is recovered by back extracting into water by
evaporating to ketone . The water solution is planchetted for alpha
counting for the UR analysis . Fluorometric analysis requires that an
appropriate aliquot of the water solution be removed prior to
plancnetting for pelletizing with NaF-LiF . The pellet is then analyzed
for uranium with a fiuorometer .
Mixed Fission Products (FPI )
Mixed fission products will precipitate from a basic oxalate media .
By adjustment of ph and oxalate concentrations, those elements which are
amp'noteric or which form oxalate complexes in the form of excess oxalate,'•
will also precipitate . Alkali metals such as Cs`37 will not precipitate .
Also, volatile fission products such as I13? will be lost .
The precipitate is washed with•NaOH and water and planchetted for
counting .
FORV 7 a=V.':E

No N001TI9900C3Rockwell Internationa l0i PAGE 40,Eeergy Systems Group
Mixed Fission. Products (FP2 )
Same extraction procedure as FP1, however, the soluble oxalate
precipitates are gar ma counted for Cs137 and other gamma emitters . The
results -ro,-. its FPI analysis and the FP2 analysis are sunned and
reported as a single value .
Mixes Fission Products (FP3 )
Same as FP2 except that the oxalate insoluble results will be
reported separately as FP3a and the oxalate soluble results will be
reported separately as FP3b .
Plutonium (PUA, PUB )
After reduction to plutonium (III) and (IV) with hydroxylamine
hydrochloride, plutonium is precipitated with lanthanu^ f luoride . This
isolates the plutonium from most elements, including uranium , except
thorium, the rare earths, and actinides .
After oxidation of plutonium with sodium nitrate in acid media,
extraction of plutonium is carried out with 0 .5 M thenoyltrifluoro
acetone in xylene . Following extraction, the aqueous solution containing
plutonium is neutralized and concentrated by heating . After oxidation
of the plutonium in a basic media, it is eiectrodeposited on a stainless
steel disc . The plutonium. activity is determined by autoradiography (PUA)
for greater sensitivity, or counted for alpha radiation with a proportional
counter (PUB) .
Gross Beta, High Level (GBH )
The gross sample is evaporated to dryness, followed by organic
digestion by hydrogen peroxide and nitric acid . The natural radioactiv e
FORV. 7 t5-° REV. 7 .5

OW4 Rockwell International
•• Energy Systems Group
Nil
PAGE
r;0 _-snAn1' 3
isotope of potassium (K40) correction is deterr.ined by diluting the
ashed salts to a known volume, and removing an aliquot for flame spectro-
photometry . The remaining solution is evaporated to near dryness,
planchetted, and counted for beta radiation with a proportional counter .
The radioactivity in the urine sample due to K40 is subtracted from the
gross count .
Gross Alpha (GA.1a )
Specific for uraniur and/or plutonium which is extracted fror ached
urine salts using aluminum nitrate , tetrapropylammonium hydroxide, and
methyl isobutyl ketone . Transuranics do not extract to any appreciable
extent . Uranium and/or plutonium are recovered by back extracting into
water by evaporating the ketone . The uranium and/or plutonium are
electrodeposited on a stainless steel disc and autoradiographed .
Gross Alpha (GA1b )
Same as GAla except the extraction solution is planchetted and
counted for alpha radiation with a proportional counter .
Gross Alpha (GA2)
Specific for all alpha emitters . Metabolized actinides are cohverted
to states suitable for coorecipitation with alkaline earth phosphates by
digesting the gross urine sample in 10"~ nitric acid . The actinides are
coprecipitated with calciutr phosphate by neutralizing the acid solution
with ammonia . The precipitate is washed , planchetted , and counted for
alpha radiation with a proportional counter .
A summary of the bioassay services provided by the United States
Testing Company, Inc . is shown in Table A-3 .
FORM 719-F F. EV , .7E

TABL '1-3(Sheet. )f 3 )
SUMMARY OF BIOASSAY SERVICES AVAILAB LE FROM UNITED STATES TESTI NG COMPANY, INC .
Analysis 1'yl~e Li sting CodeAnalysi s
Seecific ForSensitivity /1500 r il l
Fluorometric Uranium UF' Normal or Depleted 0 .3µgUraniu m
Radiometric Uranium Ult Enriched Uranium 7 . 5 dprr i
Fission Products (1) FY I I 1 bl I trise u e oxa a es 30 1' pillincluding alkalineearths, transitionelements, lanthanides,antimony, phosphates .Excludes solubleoxalates 1 .0 . Cs 1 37
Fission Products (2) FP 2 Same as F1' I plus 60 dpmgamma scan o nsoluble oxalates .
Remar k s
Volatile fission product slost .
Results combined intosingle value for report.Volatile fission product slost .
Fission Products (3 )
Tritiu m
Plutonium (A)
insoluble and solubleoxalate resultsreported separatelyas FP 3a and FP 31)respectively .
Accuracy at Minimu mMinimum Volum eSensitivity RecLired
t 50% 10 ni l
+ 50% 100 til l
+- 50% 200 ml
+ 50i0 300 ml
FP 3 Same as FP 2 with 30 dpm F133a + 50 %
113 Tritium
PU A Plutonium
60 dptn F'133b
300 nil Volatile fission productslost .
2. 25 x 10 6()pm
4 50% 10 ril l
0 . 0495 dprn F 50% 1000 r il l Greater accuracy tha nPU 13 analysis .
U, . . ,
O
CDW

• , TABLE '3 Page 2(Sheet 2 _e 3 )
SUMMARY OF BIOASSAY SERVICES AVAILABLE FROM UNITED STATES TESTING COM PANY, INC .
Analysis Tye Listing CodeAnalysi s
-131mcific For
Accuracy atSensitivity/ Minimu m150 0 ml Sensitivity__
Mininnur rVolum eRequired
Plutonium (B) PU B
Plutonium (B) (Optional) PU B
Plutoniu m
Plutonium
0 .0495 dpm 1- 75 %
0 . 75 dpm 1± 10 () %alpha counting
1000 rml
1000 ml
Strontium-90 SR90 Strontium-90 30 dpm ± 50% 200 ml
Tho rium TH Thorium 0 .99µg 500/6 1000 rnl
Gross Beta-high G13I ILevel
All beta
emitters excepthalogens
750 dprn t 75% 50 in[
Gross Alpha (la) GALA Uranium andPlutonium
1 .5 clprn 1 50% 100 ril l
Gross Alpha (1b) GALB Uranium an dPlutonium
9 dpm f 50% 100 rill
Re mark s
Double precipitations,washes and extr cctiowiare eliminated for (asteranalysis at reducedaccuracy .
Sample proportionalcounted for Alpha--radiation for imrnec .liatceresult . Sample may belater autoractiographed .
K40 correcte d
Saneple , electrodepositeclon SS disc andauto radiographed .
Sample planchclted endproportional countedfor alpha .
..oN C)0 ~fD - '
W

TABII ')-3(Sheet 3 of 3) Page 3
SUMMARY OF BIOA SSAY SERVICES AVAILABLE FROM UNITED STATES TESTING CO M PANY, INC ,
Accuracy at Minilnu mAnalysis Sensitivity / Minimum Volum e
Analysis Type Listing Code Specific For 1500 in[ Sen sitivity Iteyuired
Gross Alpha (2) GAZ All other alpha 1 5 dprn + 50% 100 mlemitters includingTh, Ia, U, Np ,Pu, Am, (:rn, Po ,and Ra
Iodine-I 31 1 131 Iodine - I 31 300 dprn ± 50% 250 rnl
R emark s
Sample planchetted andproportional countedfor alpha
Decay corrected tosampling date.