Aligning School Finance with Student...
34
1 Aligning School Finance with Student Performance Allan Odden, University of Wisconsin-Madison, CPRE Prepared for the WA House K-12 Finance Workgroup June 7, 2004
Transcript of Aligning School Finance with Student...

1
Aligning School Financewith Student Performance
Allan Odden, University of Wisconsin-Madison, CPRE
Prepared for the WA House K-12 Finance WorkgroupJune 7, 2004

2
Resource Materials
Odden & Picus, School Finance: A Policy Perspective, 3e, McGraw Hill, 2004Odden & Archibald, Reallocating Resources, Corwin Press, 2001Goertz & Odden, School-Based Financing, Corwin Press, 1999Odden & Busch, Financing School for High Performance, Jossey Bass, 1998Odden & Kelley, Paying Teachers for What They Know and Do, Corwin Press, 2002CPRE case studies on our CPRE site:– www.wcer.wisc.edu/cpre
Ongoing research on school finance adequacy (AR, AZ, KY), school cost structures, the costs of effective professional development, and new forms of teacher compensation
3
Evolution of School FinanceEquity (most of 20th century)– Variation in per-pupil expenditures– Uneven distribution of property tax base
Productivity (1990s)– Linkage between level and use of funds and student
achievementAdequacy (now and in the future)– Will improve equity too but requires more effective
use of resources and adequate funding so schools can teach students to state performance standards

4
Key Questions re a State’s School Finance System
How equitable is it?– How equal is spending per pupil?– To what degree are spending differences linked to property
wealth differences?– Washington is quite good on these issues.
How adequate is it? (The alignment issue.)– What does it take to address adequacy: more effective uses of
education dollars, restructuring and reallocation, performance pay for teachers, and adequate funding levels?
– What does the state “get” for this shift – hopefully more effective use of all resources and higher levels of student achievement.
What is the political viability of any proposed changes?
5
Shift to Adequacy“Squares” with WA’s Performance Goals
Message of Standards-Based Education Reform Goal – Teach students to high standards
» Requires a doubling or tripling of results!– To accomplish this goal, need to focus on instructional,
staffing, management and other strategies that combined will boost student performance
– Begin to do this with extant money, so ….» Imperative first to use current money better
– Adequacy sets the stage for:» Determining how to use all dollars more effectively» Identifying evidence based practices that should lead to
restructuring and resource reallocation» Figuring out how performance pay for teachers could accelerate
this agenda» Asking if there is an adequate level of funding
6
How Finance Can Support Performance
Provide adequacy and improve equityRepositions school finance from technical arena of formulas to supportive center of the education system -- NRC panel report What “works,” how to get this into districts and schools, and yes, “how much does it cost?”What is needed to teach all students to performance levels, including both extant and any new resources, which often is proposed but not always is needed: New Jersey and Connecticut
7
Key Alignment and Resource Use StrategiesState provides the broad school finance context for districts and schools to meet state student performance goals – probably through a foundation type of formulaDistricts provide schools an adequate amount via needs-based funding formula, support restructuring and reallocationSchools reallocate dollars to more effective, school-wide, evidence-based educational strategiesSystem reinforces these school finance shifts with incentives and strategies to improve instructional quality so teachers can successfully teach students to standards – including new forms of compensation
8
How Most States Approach AdequacyFirst by identifying the most appropriate finance structure – a foundation program, which is the structure in WashingtonSecond, by “rushing” to conduct an “adequacy” study, which too often just produces a higher foundation expenditure number
9
A Better ApproachAsk hard questions about various evidence-based strategies that produce improvements in student learning – what worksHave districts and schools ask these same questions resource reallocation phase– Sunset uses of resources without evidence on
effectiveness– Shift those resources to evidence based practices– Conduct a professional development fiscal audit
Rethink teacher compensation structures
10
At some point, the state will ….Need to conduct some version of an adequacy study to focus on evidence-based practices– Schools and districts need to do the same thing
Be careful how this is done
11
School Finance Adequacy and Teacher Compensation
Rapidly emerging connectionAccomplishing the goals of standards-based education reform requires a quality teacher in every classroomOne major aspect of providing these quality individuals is the level and structure of teacher pay
12
Compensation Link to State School Finance Structure
Some states want to link a two-tiered teacher licensure system to broader knowledge and skills and to an altered salary scheduleSome states use a teacher salary schedule to allocate funds (ID, WA)Adequacy school finance systems calculate numbers of teachers & usually use a steps and lanes salary schedule to “price” each teacher
13
Problem of single salary schedule for all three strategic linkages:– Neither years of experience nor education degrees are
strongly linked to teacher effectiveness– Provides no clear career path for teachers; defines no stages
of professional growth; no “fast track” mechanism– Single salary lacks policymaker confidence as a mechanism
for higher levels of teacher pay –don’t get anything
So look to some performance pay structures
14
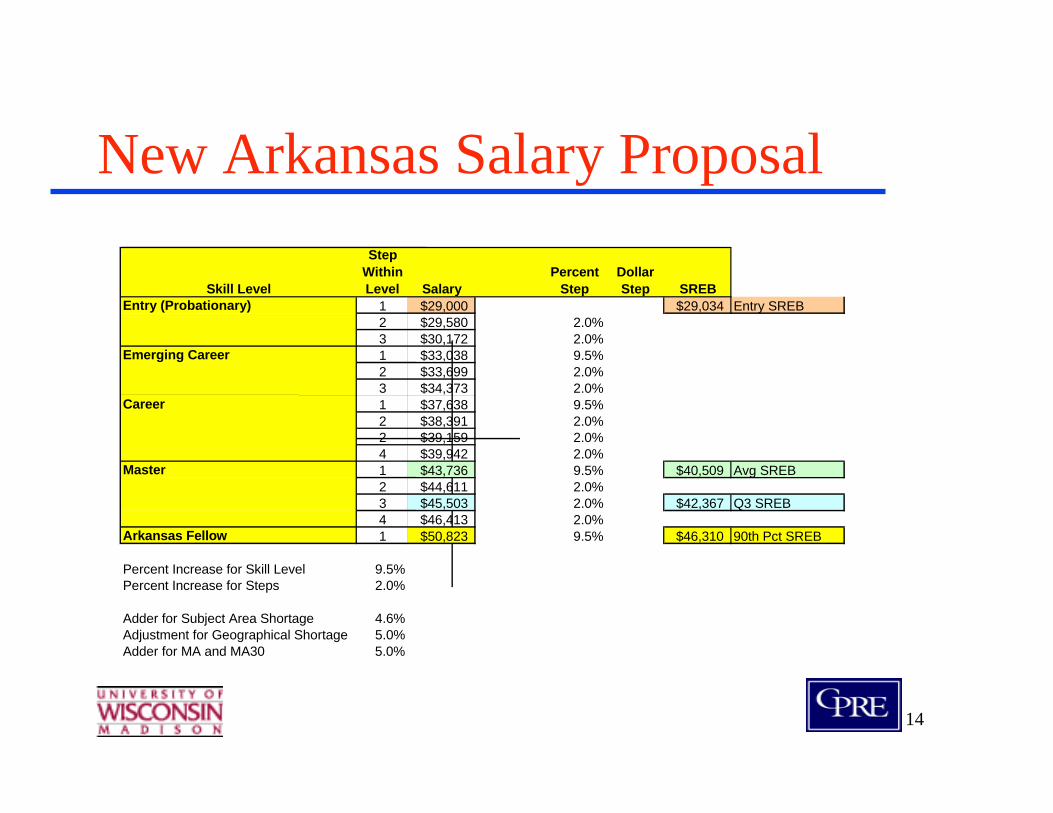
Skill Level
Step Within Level Salary
Percent Step
Dollar Step SREB
Entry (Probationary) 1 $29,000 $29,034 Entry SREB2 $29,580 2.0%3 $30,172 2.0%
Emerging Career 1 $33,038 9.5%2 $33,699 2.0%3 $34,373 2.0%
Career 1 $37,638 9.5%2 $38,391 2.0%2 $39,159 2.0%4 $39,942 2.0%
Master 1 $43,736 9.5% $40,509 Avg SREB2 $44,611 2.0%3 $45,503 2.0% $42,367 Q3 SREB4 $46,413 2.0%
Arkansas Fellow 1 $50,823 9.5% $46,310 90th Pct SREB
Percent Increase for Skill Level 9.5%Percent Increase for Steps 2.0%
Adder for Subject Area Shortage 4.6%Adjustment for Geographical Shortage 5.0%Adder for MA and MA30 5.0%
New Arkansas Salary Proposal
15
Key Characteristics of Arkansas Proposal
Tied to two-tier licensure– Emerging career is professional licensure via PRAXIS III– Career, Master and Fellow will be linked to more rigorous
performance assessmentsMajor pay increases are based on teacher knowledge and skills or instructional performance: 9.5 %Step increases within categories are few in number and provide only 2% hikesAdders for subject area shortages (math, science) and geography (inner city and rural sparsity) and degrees: MA and MA+ 30 only
16
Overall SuggestionAcross the country, the “old” funding arguments have little play – keep up with inflation, tweak the formula, etc.Adequacy raises a series of new issues and changes the nature of the debatePerformance pay proposals do the same thingBoth could shift WA school finance deliberations to a new arena, which includes many issues – early childhood, student achievement, school finance structure, needs-based funding formula, uses of resources, and even responses to NCLB – by shifting to an adequacy approach
17
Four Approaches to Defining Adequacy
Successful district Cost function Professional judgment Evidence-based
18
States Have Taken Many Approaches
Successful district approach – expenditures where students meet performance targets (IL, OH, KS)Economic cost function – research NY, WI, TX, IL, NB Professional judgment on quality inputs – WY, MD, KY, SC, NY, MS, NB, KS, MT – 2nd generation approaches neededEvidence-based” approach – NJ, KY, AR, AZ

19
Adequacy Across the USUse in New Jersey in 1998 found that money was adequate and had to be used more effectivelyAdequacy study in Maryland lead to that state’s SFR in 2003, hiking aid by $1-$2 billionStudies recently completed in North Dakota, Montana, Kansas, Nebraska, New York, Kentucky (3 studies), Arkansas, and IllinoisOngoing adequacy studies in Arizona, New Jersey, South Carolina and Texas, and probably other states Special legislative session in Arkansas and appointment of court master
20
The particular approach mattersSuccessful district leads to a low cost figure, but not relevant to many districtsCost function – economists love it – leads to an average figure for the average district, but 2-3 times that for large districts, like Seattle, cause of the weak link between current spending and performanceProfessional judgment – very high figure and many non evidence based proposalsEvidence-based – the most modest approach, each element back by evidence on effectiveness, usually paired with performance pay for teachers as well, which none of the other approaches have proposed
21
Successful District
Use expenditure and achievement data to identify “successful” districtsEliminate “unusual” districts from analysis Find districts that achieve the desired performance levelDetermine average expenditures per pupil – Student characteristic adjustments – District characteristic adjustments – Cost adjustments
This is the “adequate” funding level
22
Successful DistrictAdvantages: – Links expenditures per pupil and desired student outcomes – Relatively simple and straightforward – Draws from actual state districts
Disadvantages: – Too many “atypical” districts excluded from analysis– Successful districts are usually relatively homogeneous– Results are difficult to “adjust” for larger (>2500 students) urban
and poorer rural areas– Results can be manipulated
Does not identify the educational delivery system
23
Cost FunctionEconomic approach using regression analysis to identify the cost to produce an outcomeExpenditures per pupil are the dependent variableIndependent variables– Desired performance level – Characteristics of students – Characteristics of districts
Per pupil expenditure varies with desired performance levelResults are an average expenditure level and an overall cost adjustment
24
Cost FunctionAdvantages: – Clearly links expenditures to desired results– Accounts for most key factors that impact costs
Disadvantages: – Very complex – Not used to make policy in any state today– Assumes existing resources are not reallocated– Does not offer any insights into strategies for the delivery of
educational services
25
What An Adequacy Study Needs to Do
Identify educational delivery strategies that can produce desired results Determine the resources needed– Detailed specifications of resources needed to support the delivery
strategies– Development of prototype designs for elementary, middle and high
schools– Designs must be supported by research and evidence-based best practices
that produce improvements in student learningThis requires much more detailed specifications and costing thanare typically found in general education reform recommendations
26
Professional Judgment
Education professionals make judgments on what is needed at the school level to teach students to proficiency standardsPanels of teachers and administrators identify the resource needs for prototypical elementary, middle and high schoolsState panels review and revise the proposals of various local/regional panelsState panels also create prototypical district design
27
Professional Judgment
Advantages: – Draws from the expertise of educational professionals– Proposals are tailored to the context of each state
Disadvantages: – No clear link to student learning gains– Tendency to “game” the system– Many panel members are not able to identify
“evidence” or “research” that supports their proposals
28
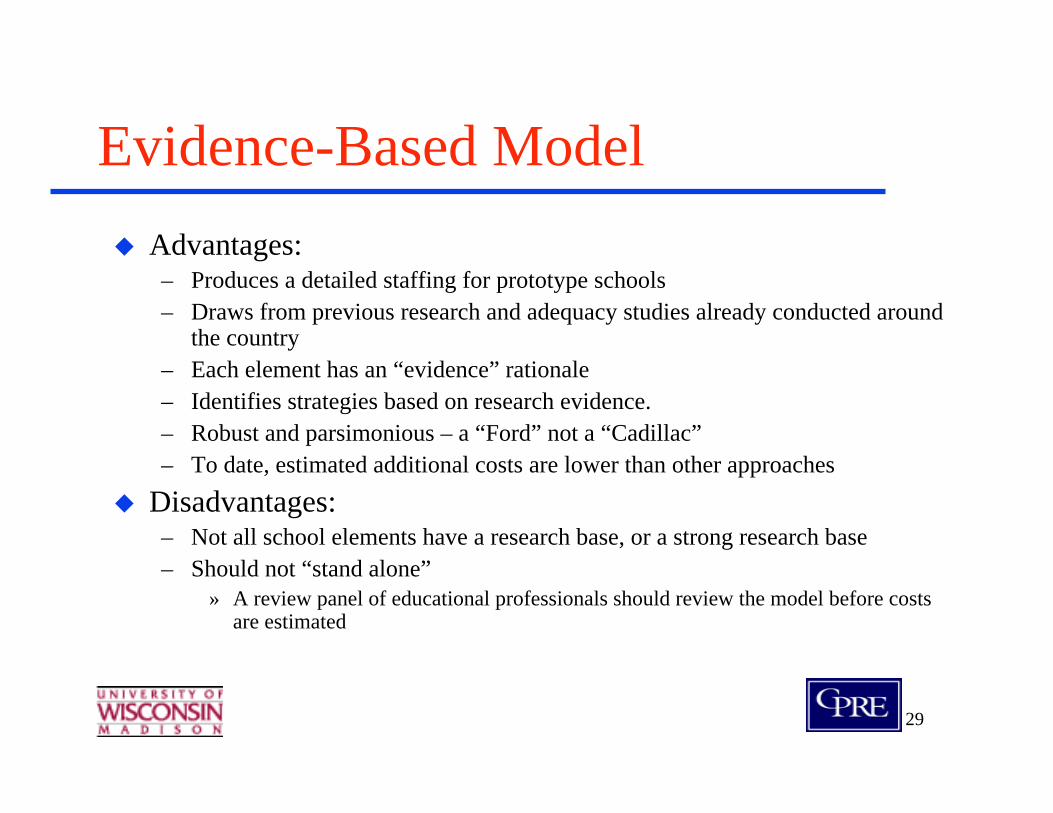
Evidence-Based ModelDraws from research and evidence-based best practices Identifies educational delivery strategies are linked to studentlearning gainsAttempts to “back” each resource recommendation with reference to research and/or best practicesDraws from the best of current research and practice Can also draw from a synthesis of the best professional judgmentpanelsEstimates the cost of the resources identified “Squares” with the evidence-based practice required by No Child Left Behind
29
Evidence-Based ModelAdvantages: – Produces a detailed staffing for prototype schools – Draws from previous research and adequacy studies already conducted around
the country – Each element has an “evidence” rationale– Identifies strategies based on research evidence. – Robust and parsimonious – a “Ford” not a “Cadillac”– To date, estimated additional costs are lower than other approaches
Disadvantages: – Not all school elements have a research base, or a strong research base– Should not “stand alone”
» A review panel of educational professionals should review the model before costs are estimated
30
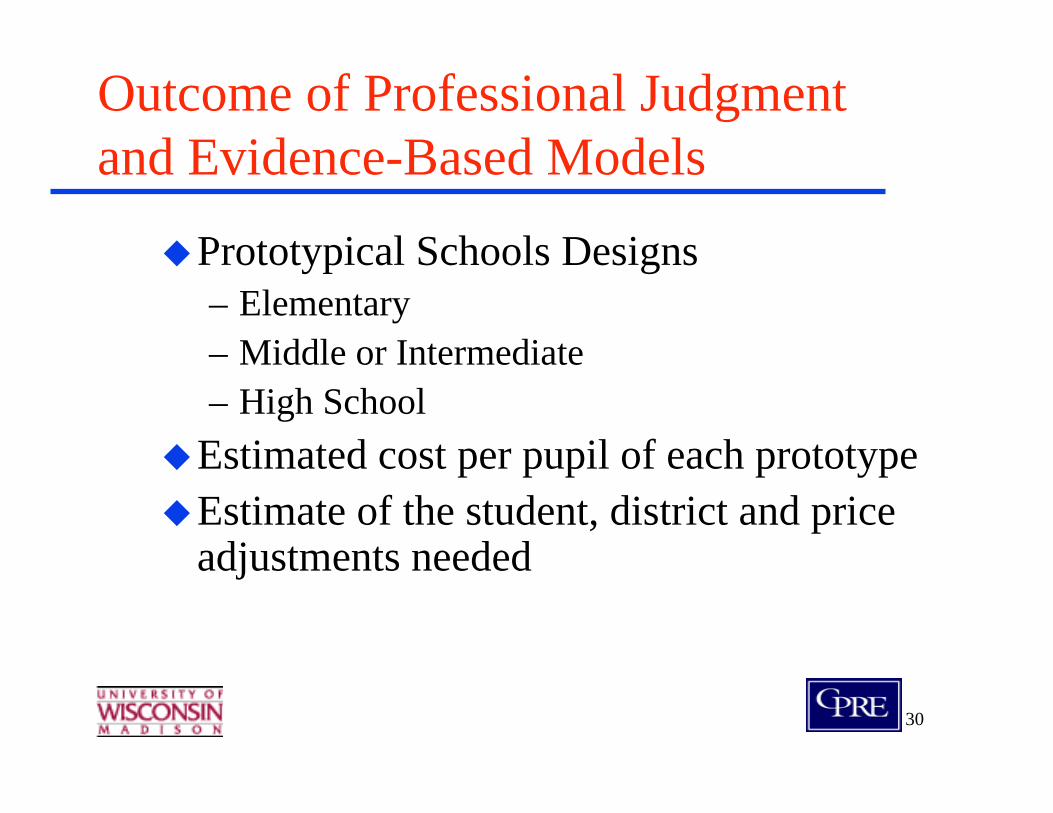
Outcome of Professional Judgment and Evidence-Based Models
Prototypical Schools Designs – Elementary– Middle or Intermediate – High School
Estimated cost per pupil of each prototype Estimate of the student, district and price adjustments needed
31
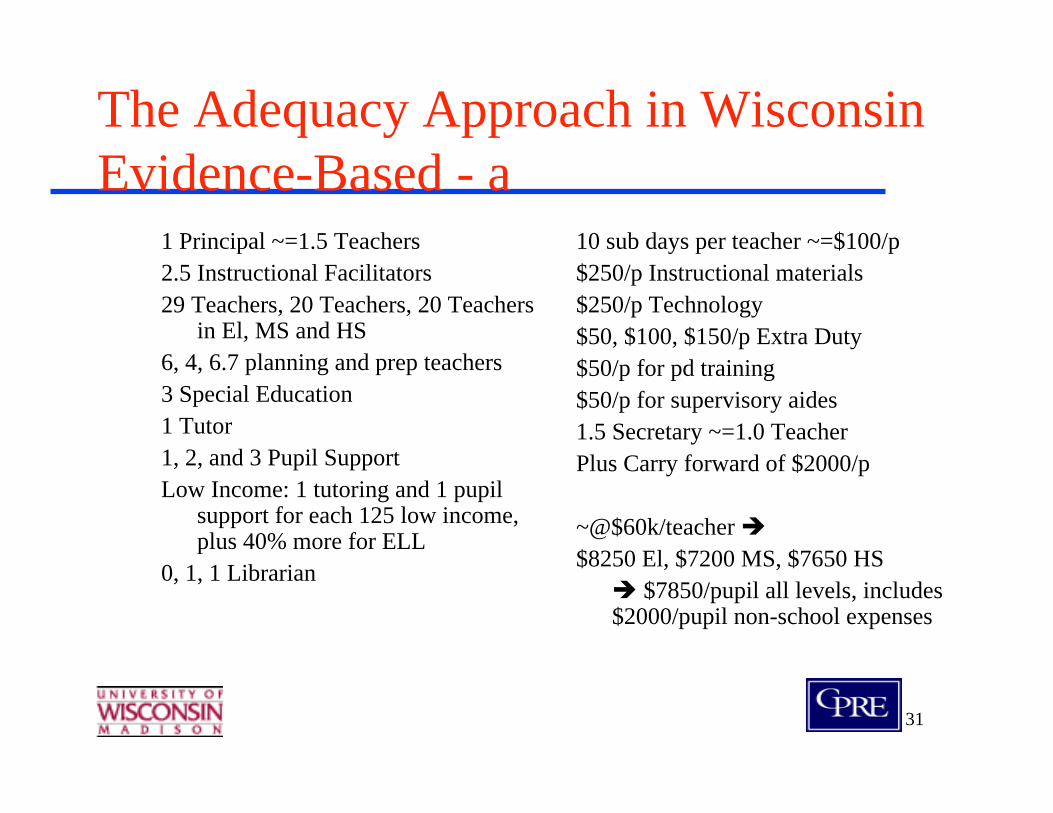
The Adequacy Approach in Wisconsin Evidence-Based - a
1 Principal ~=1.5 Teachers2.5 Instructional Facilitators29 Teachers, 20 Teachers, 20 Teachers
in El, MS and HS6, 4, 6.7 planning and prep teachers3 Special Education1 Tutor1, 2, and 3 Pupil SupportLow Income: 1 tutoring and 1 pupil
support for each 125 low income, plus 40% more for ELL
0, 1, 1 Librarian
10 sub days per teacher ~=$100/p$250/p Instructional materials$250/p Technology$50, $100, $150/p Extra Duty$50/p for pd training$50/p for supervisory aides1.5 Secretary ~=1.0 TeacherPlus Carry forward of $2000/p
~@$60k/teacher $8250 El, $7200 MS, $7650 HS
$7850/pupil all levels, includes $2000/pupil non-school expenses
32
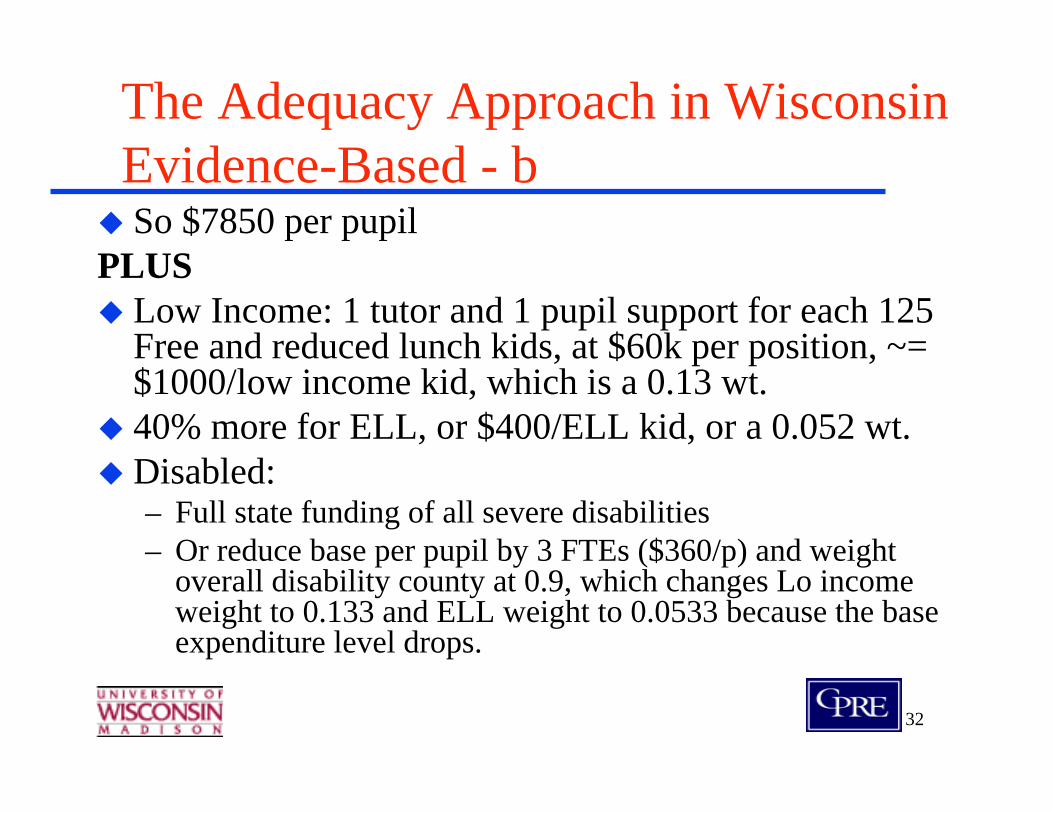
The Adequacy Approach in Wisconsin Evidence-Based - bSo $7850 per pupil
PLUSLow Income: 1 tutor and 1 pupil support for each 125 Free and reduced lunch kids, at $60k per position, ~= $1000/low income kid, which is a 0.13 wt.40% more for ELL, or $400/ELL kid, or a 0.052 wt.Disabled:– Full state funding of all severe disabilities– Or reduce base per pupil by 3 FTEs ($360/p) and weight
overall disability county at 0.9, which changes Lo income weight to 0.133 and ELL weight to 0.0533 because the base expenditure level drops.
33
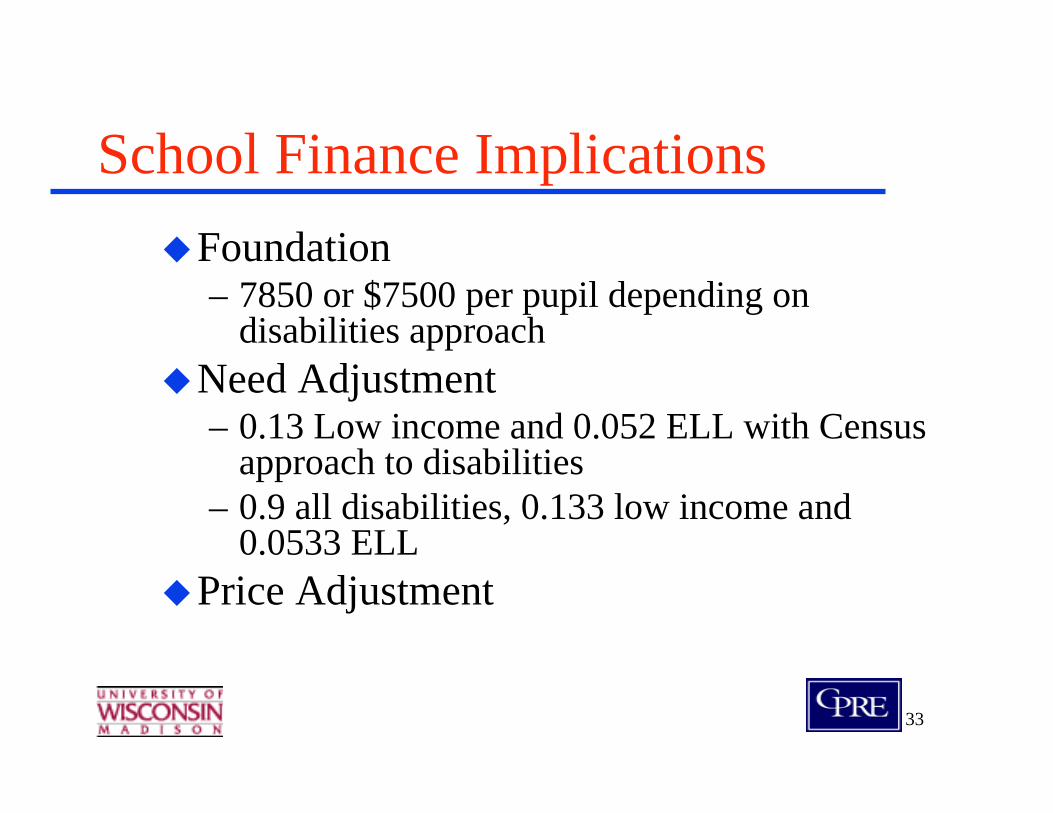
School Finance ImplicationsFoundation– 7850 or $7500 per pupil depending on
disabilities approachNeed Adjustment– 0.13 Low income and 0.052 ELL with Census
approach to disabilities– 0.9 all disabilities, 0.133 low income and
0.0533 ELLPrice Adjustment
34
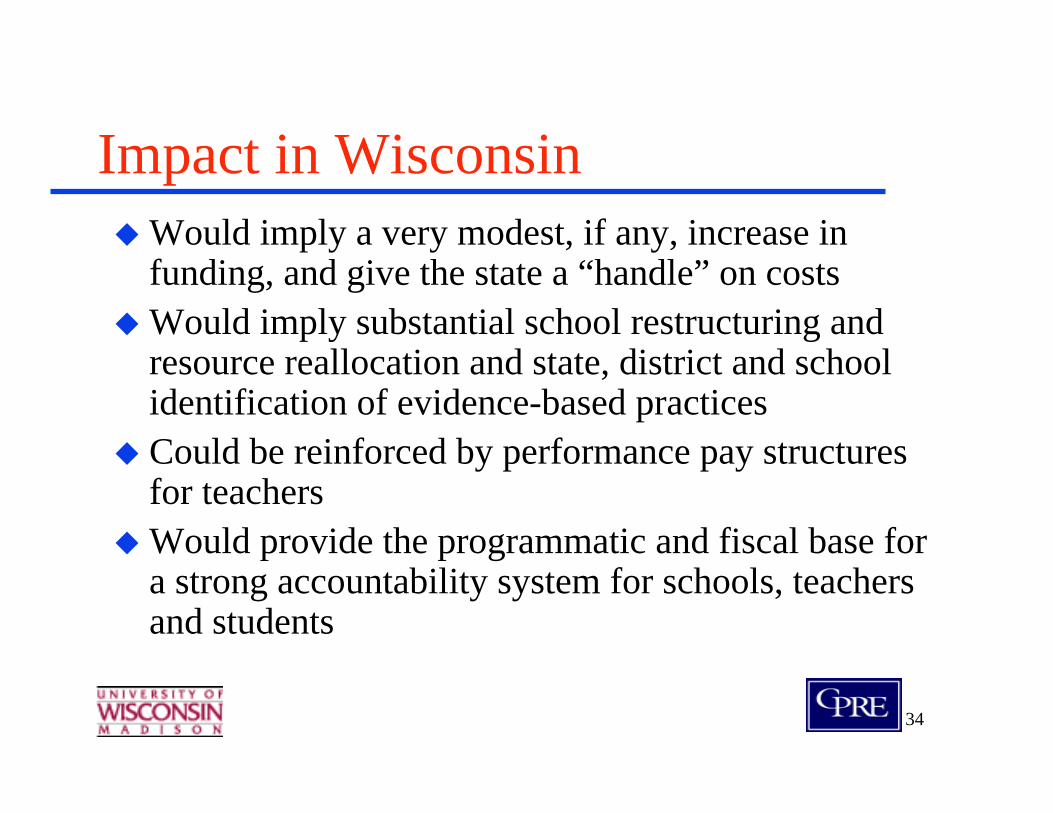
Impact in WisconsinWould imply a very modest, if any, increase in funding, and give the state a “handle” on costsWould imply substantial school restructuring and resource reallocation and state, district and school identification of evidence-based practicesCould be reinforced by performance pay structures for teachersWould provide the programmatic and fiscal base for a strong accountability system for schools, teachers and students