Aligning objectives - Overseas Development Institute · Aligning objectives International climate...
31
Aligning objectives International climate commitments and national energy strategies December 2016 ODI Insights Andrew Scott Laurie van der Burg Sejal Patel
Transcript of Aligning objectives - Overseas Development Institute · Aligning objectives International climate...

1 ODI Insights
Aligning objectives International climate commitments and national energy strategies
December 2016ODI Insights
Andrew Scott
Laurie van der Burg
Sejal Patel

2 ODI Insights
AcknowledgementsWe would like to acknowledge, with gratitude, the comments on an earlier draft from reviewers Ann Gardner, Ilmi Granoff and Darius Nassiry. We are also grateful for the comments and support of Shelagh Whitley, head of ODI’s Climate and Energy Programme. Claire Bracegirdle and Holly Combe provided editing support.
Insights project introductionODI Insights is a series of research papers, policy briefings and outreach activities that address urgent and unresolved development priorities and challenges. As well as reaching new audiences, the aim of Insights is to ensure that ODI’s high-quality research and analysis influences policy debates, providing innovative practical solutions to existing and emerging problems.
Aligning objectives: international climate commttments and national energy strategies 3
Contents
Acknowledgements 2
Insights project introduction 2
1. Key findings 5
2. Introduction 7
3. Methodology 10
4. Energy objectives in the NDCs 11
5. Energy objectives in national plans 14
6. Conclusion 22
References 24
Annex: Key indicators for selected countries 29
4 ODI Insights
List of figures, tables and boxes
Figures
Figure 1: Timeline for increasing ambition in NDCs 7
Figure 2: Percentage change in emissions 2010-2030 for selected developing countries 8
Figure 3: Growth in generation capacity and GHG emissions to 2030 17
Figure 4: Changes in proportions of fossil fuel and renewable generation capacity in national plans 18
Figure 5: Installed capacity (MW) in Pakistan in 2010 and 2030 19
Figure 6: Installed capacity (MW) in Tanzania in 2012 and 2030 20
Tables
Table 1: Summary of energy commitments identified in NDCs of all selected countries 11
Table 2: Summary of national energy objectives of all 30 countries reviewed 14

5 ODI Insights
1. Key findings
1 Defined in this paper as low-income, lower middle-income and upper middle-income countries, as classified by the World Bank (World Bank, 2016).2 In this paper, we use the term Nationally Determined Contribution throughout to refer to NDCs and Intended Nationally Determined Contributions
(INDCs). Upon ratification, a country’s INDC becomes its NDC unless it submits one separately.
The Paris Agreement came into force on 4 November 2016. Its parties have committed to contribute to the goal of keeping the average global temperature rise well-below 2°C, and to pursue efforts to keep the rise to 1.5°C. The contributions pledged by governments do not put the world on a path towards a well-below 2°C average temperature rise. Indeed, analysis for the 2016 Emissions Gap Report suggests that these contributions would lead to a rise between 2.9°C and 3.4°C (UNEP, 2016). This means ambitions for emission reductions need to be quickly raised if we are to avoid dangerous climate change in the second half of the century.
Achieving the well-below 2ºC change goal will mean decarbonising the world’s energy systems before the end of the century. Energy production and consumption account for about two-thirds of global greenhouse gas emissions (IPCC, 2014). Electricity generation, which accounts for 38% of energy emissions (IEA, 2016b), needs to be decarbonised by the middle of the century (Climate Action Tracker, 2016a). To transition to lower-carbon energy systems, renewable energy sources need to be substituted for carbon-intensive ones, such as coal, oil and natural gas, and the efficiency of energy production and consumption must be improved.
Although global energy-related emissions need to eventually be reduced to zero, energy consumption in developing countries1 needs to increase. The International Energy Agency (IEA) expects energy consumption in non-OECD countries to increase by 55% between 2013 and 2040 (IEA, 2015b). Though this may be an overestimate (IEF, 2016; Roberts, 2015), the focus of developing country energy policies and plans is to meet their rapidly growing demand for energy. In doing so, some countries will increase their energy-related emissions. This raises questions about the coherence between governments’ international pledges on greenhouse gas emission reductions and their national energy policy objectives.
Countries’ pledged contributions to global emission reduction are set out in their Nationally Determined Contributions (NDCs).2 Most NDCs cover energy-related emissions, and increases in the use of renewable energy are included in the NDCs of 108 countries (Stephan, et
al., 2016). However, NDCs do not all include action to reduce energy emissions. When they do, they may not be specific about the action to be taken to address energy emissions, and the action included does not necessarily address emissions from all energy sources.
This paper assesses the extent to which national plans and objectives for the development of energy systems in developing countries contribute to their NDCs. This includes national objectives towards the energy targets of the Sustainable Development Goals (SDGs). The key questions addressed relate to whether there is coherence between NDCs and plans for the development of the energy sector:
• How will NDCs contribute to national energy policy objectives, and vice versa? • Can national energy objectives help increase the emission reduction ambition of NDCs?There are three main conclusions from the analysis.
Energy emissions should be included in all NDCs. A review of the NDCs and national energy objectives of 30 developing countries indicates that plans to deliver NDCs have yet to be fully formulated. Only half of the NDCs feature action to reduce energy-related emissions (i.e. emissions from fuel combustion, fuel extraction and energy production, and energy consumption for domestic transport). In all of the NDCs reviewed, there are objectives for renewable energy, focused on the power sector. However, they are unspecific about plans for fossil fuel energy and thermal generation capacity. In developing countries, where the demand for energy is growing rapidly, any increase in the proportion of renewables, or a large one in renewable electricity capacity, does not necessarily mean that emissions from electricity will be reduced.
The partial coverage of energy emissions in NDCs can be addressed by including action to mitigate emissions from energy production and consumption in all NDCs. This should be based on realistic but ambitious energy development plans and be done when the NDCs are reviewed during the facilitative dialogue, under the Paris Agreement, in 2018.

Aligning objectives: international climate commttments and national energy strategies 6
Energy sector plans, SDG implementation plans and NDCs should be aligned. Action to address energy-related greenhouse gas emissions should be consistent with plans to expand energy production and consumption. This would help ensure that NDCs include all opportunities to reduce energy-related emissions. Greater integration across the energy sector in national energy planning would facilitate alignment of NDCs with energy development objectives.
Developing countries need international support to revise national energy plans and enable them to plan for low-carbon energy systems. The absence of actions to reduce energy emissions from many NDCs, along with any lack of detail they provide about the action to be taken, may be because the information is not yet available. This can partly be explained by the limited capacity of developing countries to undertake the necessary analysis. Similarly, there may be limited capacity for a) integrated approaches to the development of energy systems and b) planning for a transition to
low-carbon energy systems. Many developing countries have relied on international support to prepare NDCs and reports to the United Nations Framework Convention on Climate Change (UNFCCC), as well as to develop their energy sector policies and plans. This will continue to be required for developing countries’ preparation of policies and plans for the transition to low-carbon energy systems. The imperative of reducing global emissions suggests that this support should be provided immediately.
The need for decarbonisation in the energy systems of developing countries raises questions about global equity in the implementation of the Paris Agreement. Although many developing country NDCs include energy-related emission reductions relative to a business as usual (BAU) trajectory, their total emissions from energy use may still be increasing. Further research on how their national energy plans can be linked to NDCs would help inform this debate and expectations regarding what should be included in NDCs.
Solar panels at a thermo-solar power plant, Mali. Credit: World Bank

7 ODI Insights
2. Introduction
3 COP decisions 1/CP.19 and 1/CP.20.
Having concluded the landmark Paris Agreement at the end of 2015, with entry into force less than a year later, attention is now focused on its implementation. Delivery of the action pledged by national governments in their NDCs will form a critical part of this.
In the months leading up to the Paris Agreement, countries were asked to submit a statement of their intended contribution to the reduction of global greenhouse gas emissions – their Intended Nationally Determined Contributions – to the UNFCCC.3 The majority of countries did this before the Paris Agreement. Upon ratification, countries have an opportunity to offer a new or revised contribution as their NDC. If they do not make a new submission, the original becomes the registered NDC, as has occurred with most ratifications to date.
In 2018, the Paris Agreement will provide an opportunity for countries to review progress towards the well-below 2°C goal. This ‘facilitative dialogue’ is also intended to inform the next submission of NDCs in 2020. These may simply take the form of updates of the NDC already submitted. However, from this point, pledged mitigation contributions should all relate to a timeframe up to 2030 (with some of those submitted in 2015 having a timeframe up to 2025). Countries are also expected to submit their long-term decarbonisation plans by 2020. The agreement provides for a review and update of NDCs every five years, with the expectation that they will become successively more ambitious. The first stocktake is scheduled for 2023, followed by the submission of new NDCs by 2025, as shown in Figure 1.
Delivery of nationally determined contributions
Inevitably, the NDCs have attracted much attention. Because those submitted do not all follow the same format or articulate their objectives in the same way, representations and summaries of their contents have been prepared by a number of organisations (e.g. ICF International, 2016; World Bank, 2016). Analysis of the NDCs has largely focused on two questions. The first is whether the emission reductions pledged will be big enough in aggregate to put the world on a pathway to the well-below 2°C goal (e.g. Climate Action Tracker, 2016a; Hof et al., 2015). It is now well established that this will not be the case (IEA, 2015; ETC, 2016; UNEP, 2016). The second main focus of analysis has been the level of investment required to deliver the NDCs, and how this might be financed (Helme et al., 2015; Amponin and Evans, 2016).
Detailed analysis of the NDCs of individual countries has concentrated on a limited number, mostly the large emitters. Carbon Action Tracker’s assessment of individual NDCs (Climate Action Tracker, 2016) includes 31 countries, along with the EU’s submission of a single NDC on behalf of all of its member states. An analysis by Day et al. (2015) covers seven countries and the EU, while Ecofys (ETC, 2016) includes 16, plus the EU.
These analyses take account of national policies, in order to assess the ambition of emission reductions, how the co-benefits of mitigation might incentivise mitigation action, and how the NDCs can accelerate the transition to low-carbon energy systems, respectively.
Figure 1: Timeline for increasing ambition in NDCs
Paris Agreement comes into
force
Facilitative dialogue
Progresson SDGs at
GeneralAssembly HighLevel PoliticalForum (HLPF)
UpdatedNDCs
submitted
Last year for emissions to peak fora 2°C rise
1st Global stocktake
Progresson SDGs at
GeneralAssembly HLPF
RevisedNDCs
submitted
Progresson SDGs at
GeneralAssembly HLPF
2nd Global stocktake
RevisedNDCs
submitted
End ofSDGs
period
2016 2017 2018 2019 2020 2021 2022 2023 2024 2025 2026 2027 2028
Aligning objectives: international climate commttments and national energy strategies 8
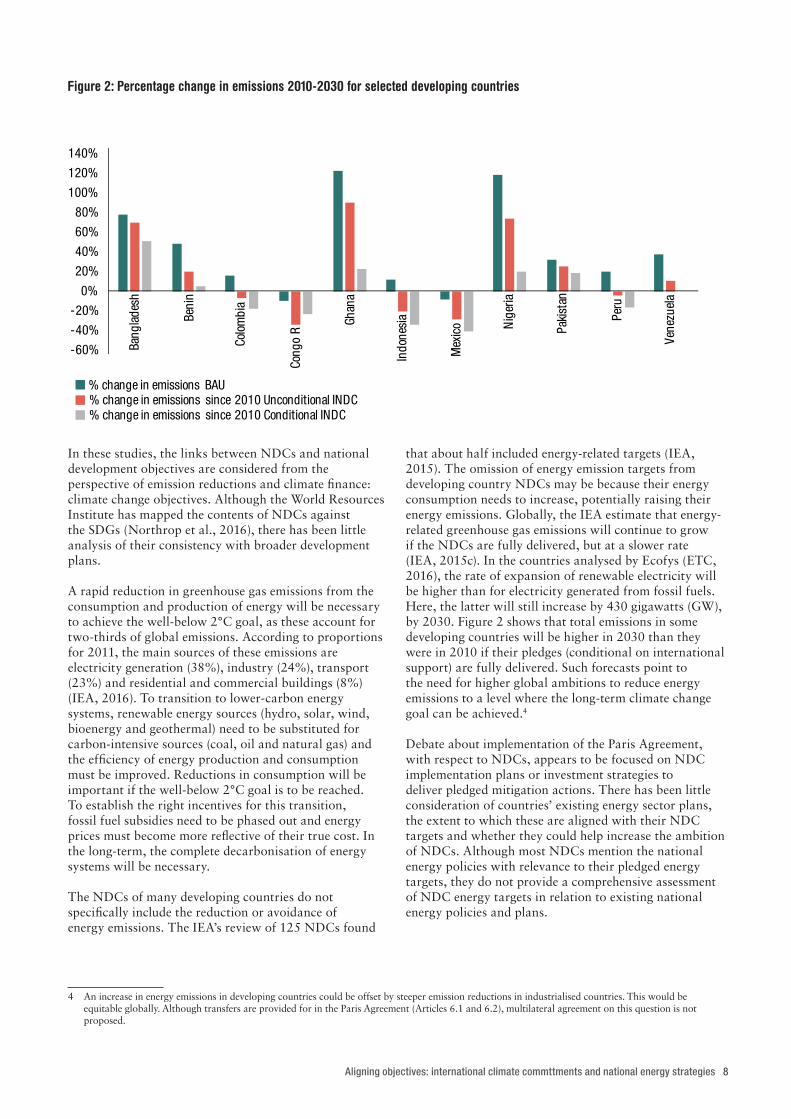
In these studies, the links between NDCs and national development objectives are considered from the perspective of emission reductions and climate finance: climate change objectives. Although the World Resources Institute has mapped the contents of NDCs against the SDGs (Northrop et al., 2016), there has been little analysis of their consistency with broader development plans.
A rapid reduction in greenhouse gas emissions from the consumption and production of energy will be necessary to achieve the well-below 2°C goal, as these account for two-thirds of global emissions. According to proportions for 2011, the main sources of these emissions are electricity generation (38%), industry (24%), transport (23%) and residential and commercial buildings (8%) (IEA, 2016). To transition to lower-carbon energy systems, renewable energy sources (hydro, solar, wind, bioenergy and geothermal) need to be substituted for carbon-intensive sources (coal, oil and natural gas) and the efficiency of energy production and consumption must be improved. Reductions in consumption will be important if the well-below 2°C goal is to be reached. To establish the right incentives for this transition, fossil fuel subsidies need to be phased out and energy prices must become more reflective of their true cost. In the long-term, the complete decarbonisation of energy systems will be necessary.
The NDCs of many developing countries do not specifically include the reduction or avoidance of energy emissions. The IEA’s review of 125 NDCs found
4 An increase in energy emissions in developing countries could be offset by steeper emission reductions in industrialised countries. This would be equitable globally. Although transfers are provided for in the Paris Agreement (Articles 6.1 and 6.2), multilateral agreement on this question is not proposed.
that about half included energy-related targets (IEA, 2015). The omission of energy emission targets from developing country NDCs may be because their energy consumption needs to increase, potentially raising their energy emissions. Globally, the IEA estimate that energy-related greenhouse gas emissions will continue to grow if the NDCs are fully delivered, but at a slower rate (IEA, 2015c). In the countries analysed by Ecofys (ETC, 2016), the rate of expansion of renewable electricity will be higher than for electricity generated from fossil fuels. Here, the latter will still increase by 430 gigawatts (GW), by 2030. Figure 2 shows that total emissions in some developing countries will be higher in 2030 than they were in 2010 if their pledges (conditional on international support) are fully delivered. Such forecasts point to the need for higher global ambitions to reduce energy emissions to a level where the long-term climate change goal can be achieved.4
Debate about implementation of the Paris Agreement, with respect to NDCs, appears to be focused on NDC implementation plans or investment strategies to deliver pledged mitigation actions. There has been little consideration of countries’ existing energy sector plans, the extent to which these are aligned with their NDC targets and whether they could help increase the ambition of NDCs. Although most NDCs mention the national energy policies with relevance to their pledged energy targets, they do not provide a comprehensive assessment of NDC energy targets in relation to existing national energy policies and plans.
Figure 2: Percentage change in emissions 2010-2030 for selected developing countries
-60%
-40%
-20%
0%
20%
40%
60%
80%
100%
120%
140%
% change in emissions BAU% change in emissions since 2010 Unconditional INDC% change in emissions since 2010 Conditional INDC

9 ODI Insights
Meeting the sustainable development goals
The national energy policy priorities of developing countries are to:
• expand energy supply and consumption • ensure security of supplies while keeping energy prices are as low as possible • provide access to modern energy services for all their citizens.
Under the Paris Agreement, they must also consider their energy-related greenhouse gas emissions.
They are also expected to reflect the Sustainable Development Goals (SDGs) in their national energy policy objectives. Adopted in 2015, two months before the Paris Agreement, the global SDGs include the following targets to be achieved by 2030:
a) ensure universal access to affordable, reliable and modern energy services b) increase the share of renewables in the global energy mix c) double the rate of improvement in energy efficiency d) rationalise inefficient fossil fuel subsidies.
The targets on renewables and energy efficiency for the energy SDG (SDG 7) are directly relevant to the climate change goal of the Paris Agreement. However, the share of renewables in total primary energy supply needs to increase at a faster rate than total energy consumption, to ensure an overall reduction in energy emissions. The International Energy Agency estimate that, in 2014, the supply of renewable energy increased by 2.7% on the previous year, while demand increased by 1.1% (IEA, 2016b). However, renewables accounted for only 14% of global energy supply. The SDG energy efficiency target calls for a rate of improvement of 2.6% a year (SE4All, 2015), which is also the rate necessary to achieve the 2°C maximum temperature rise goal, though not sufficient by itself to achieve it (IEA, 2016a).
The SDG target of universal access to modern energy services by 2030 is usually interpreted to mean that everybody should have access to electricity and use safe and clean fuels for cooking. Currently, around 1.1 billion people, globally, do not have access to electricity, while 2.9 billion depend on unsafe traditional fuels and technologies for their cooking energy. The vast majority of people without access to modern energy services live in sub-Saharan Africa and south Asia. The Global Tracking Framework (SE4All, ibid.) found that the rate of growth in access to electricity is close to the rate necessary for access to become universal (0.6% a year, compared with the 0.7% a year required), but the rate of improvement in access to non-solid fuels is far from what is required (1.7% growth a year).
Achieving the development objectives of SDG 7 will contribute to the delivery of NDCs with energy targets. Actions to implement these NDCs can, in turn, contribute
to the achievement of SDG 7. In countries that have not included renewables or energy efficiency in their NDCs, action directed towards SDG 7 may point to their inclusion in revised NDCs. Similarly, NDC commitments to phase out fossil fuel subsidies would contribute to the achievement of SDG target 12c, and vice versa. Along with SDG 7’s energy implications, energy production and consumption will be particularly affected by action towards SDG 8 (growth and employment), SDG 9 (infrastructure, industrialization and innovation) and SDG 11 (sustainable cities consumption) (UNEP, 2016).
The effectiveness of national energy policy will play a decisive role in achieving the objectives of both the Paris Agreement and the SDGs. However, most countries have yet to revise either their energy sector plans in response to the global SDGs or, indeed, the Paris Agreement. This can be expected when they next revise their national development or energy sector plans, though there is no international obligation for governments to do so. As national energy objectives are revised and national SDG targets are adopted, it will be critical to coordinate and align actions for decarbonising energy to meet parallel NDC and SDG targets. When national energy policymaking or efforts to meet the NDCs and the SDGs are not aligned, the respective climate and energy objectives in the Paris Agreement and the SDGs may be undermined.
Increasing the ambitions of Nationally Determined Contributions
The timetable for the revision of NDCs is depicted in Figure 1. Global progress on the SDGs will be presented every four years to the High Level Political Forum under the UN General Assembly, but these reviews will not require revisions to national SDG targets. Figure 1 also shows that 2020 is the year when global emissions must peak in order to achieve the well-below 2°C long-term goal (UNEP, 2016). One of the strengths of the Paris Agreement is the provision for periodic review and revision of NDCs, but this may be too late to secure the necessary increase in mitigation ambition.
All opportunities to increase the ambition of NDCs need to be taken. The facilitative dialogue around these contributions in 2018 will present the first opportunity under the Paris Agreement. The revision of national energy sector plans and objectives will provide other openings. Lack of coordination or disjuncture between NDCs, national SDG targets, and national energy sector policies and plans could make it more difficult to raise mitigation ambitions. Accordingly, this paper assesses the links between developing countries’ NDCs and their national energy policy objectives, including those relating to the SDGs and the extent to which their plans for energy sector development contribute to NDCs. It also considers how much they could contribute to revised, more ambitious NDCs.

Aligning objectives: international climate commttments and national energy strategies 10
3. Methodology
5 One of the selected countries, Nicaragua, did not submit an NDC, so we reviewed 29 NDCs. We kept Nicaragua in the selection of countries as some NDCs, including Nepal’s, also selected, do not include specific mitigation objectives.
The key questions in the study underpinning this paper related to coherence between NDCs and energy sector plans, the contribution of NDCs to development objectives and whether national energy plans could help increase the ambition of NDCs. To address these, this study undertook a rapid review of the NDCs and national energy objectives of 30 developing countries. This identified the content of their NDCs related to energy production and consumption, which was then compared with the main objectives identified in their current energy policies and plans. NDCs and national energy policies often contain high level vision-type objectives. Our analysis focused on more specific energy objectives, particularly targets for emission reduction, renewable energy and fossil fuels, along with projections for the power mix.
The countries included in this study were selected to ensure a balance across regions and different energy contexts. The selection process began with the collection of the most recent data for key indicators for all developing countries (i.e. low-, lower middle-income and upper middle-income countries). The indicators used were:
• population without electricity • population relying on traditional use of biomass • energy imports • energy intensity • renewable energy consumption • percentage share of global greenhouse gas (GHG) emissions.
The data for each indicator for all developing countries were ranked, identifying countries at the top, bottom and middle (e.g. countries with large, medium and small populations without access to electricity). A preliminary list of countries included those appearing in these rankings across the indicators. The final list of 30 countries was generated after ensuring a reasonable balance across regions and country income groups. This approach led to the selection of nine countries in Latin America and the Caribbean, eight in South and South East Asia and 13 in sub-Saharan Africa. In terms of country income group, there were seven low-income, 11 upper middle income and 12 lower middle income countries. Together, these countries account for 63% of the world’s population lacking access to electricity and 23% of the world’s total greenhouse gas emissions. The data for the countries eventually selected are presented in Annex 1.
The NDCs, along with national energy policy and plan documents for the thirty selected countries, were reviewed to identify policy objectives and targets for the energy sector.5 The NDCs and national policies and plans
were located and accessed online. In addition, the study reviewed the analysis and information provided in other cross-country studies or databases (e.g. REN21, Climate Action Tracker, Ecofys, Globe Climate Legislation, Climatescope, IRENA and IEA). Data on greenhouse gas emissions came from the World Resources Institute’s CAIT Climate Data Explorer (World Resources Institute, 2016) and the factsheets published by the Australian-German Climate and Energy College (Climate Energy, 2016). A number of limitations in the NDCs and national energy policies complicate and constrain the analysis. First, there is no standardised format for the NDCs and they often do not provide directly comparable information. They also do not necessarily cover the same sectors or use the same baselines for emission reduction commitments. Along with this, they have different time horizons (e.g. 2025 and 2030). In many cases, the underlying assumptions are not presented. Those NDCs including specific energy sector targets use a variety of metrics. Similarly, national energy policies and plans use various metrics and cover different periods of time. This complicates comparisons between countries and can limit what can be compared.
Secondly, most of the NDCs that incorporate energy sector targets do not provide a comprehensive picture of plans for the sector. Emission reduction targets in NDCs that are relative to BAU trajectories may accompany increases in total energy emissions. If a country’s NDC understates actual renewable energy development or overlooks fossil fuel production and use, it may not provide an accurate insight into a country’s progress on decarbonisation in the energy sector. For example, when the NDC’s energy content is focused in renewable energy plans and no information is included in strategies for oil, natural gas or coal production and consumption, it is difficult to assess whether the NDC’s emission reduction targets for the energy sector are realistic or likely to be achieved. It is also the case that approaches to national energy policymaking are often fragmented, with limited integration between plans for renewable energy development, energy efficiency, fossil fuel development and wider emission reduction plans. This makes it difficult to obtain a comprehensive understanding of plans for the energy sector. Examples of misalignment within national energy policies were found in this study. This occurred when parallel policies set different targets for the share of renewable energy in the energy mix by a certain date.
Despite these limitations, the NDCs and national energy plans do give an indication of the policy levers in each country, level of ambition and foreseen progress.
11 ODI Insights
4. Energy objectives in the NDCsIn this section, we consider how energy features, both in the NDCs generally and those of our selected countries.
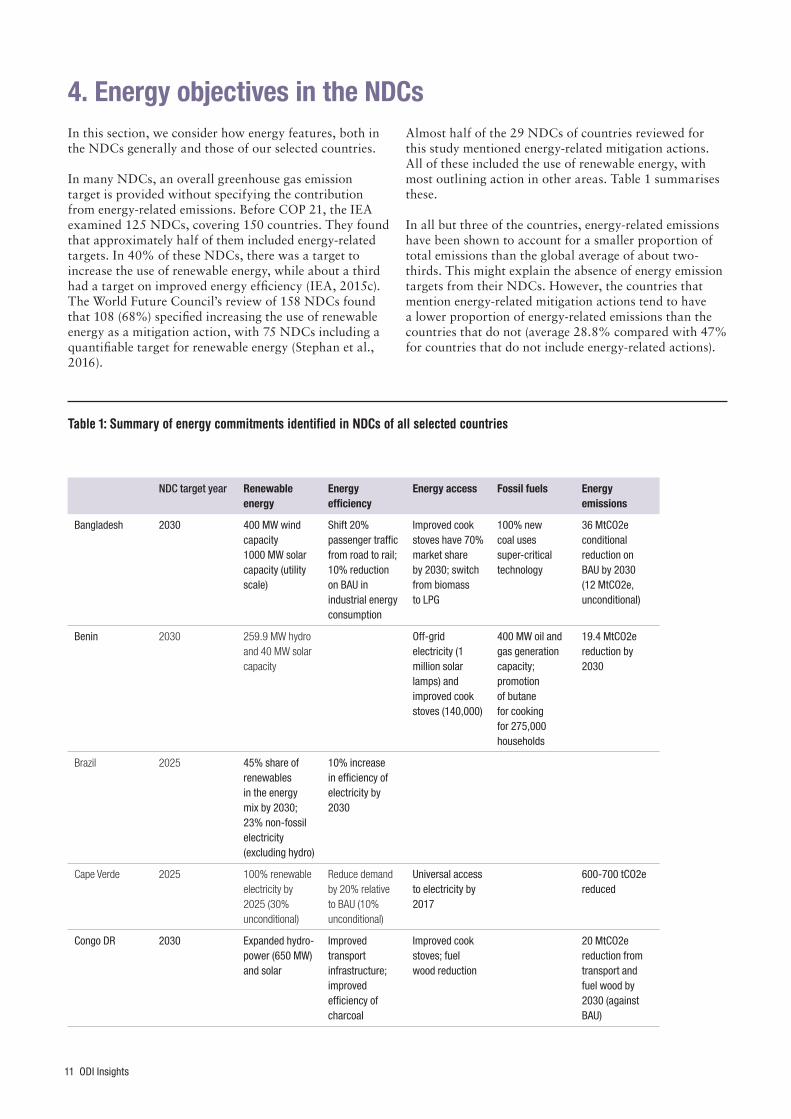
In many NDCs, an overall greenhouse gas emission target is provided without specifying the contribution from energy-related emissions. Before COP 21, the IEA examined 125 NDCs, covering 150 countries. They found that approximately half of them included energy-related targets. In 40% of these NDCs, there was a target to increase the use of renewable energy, while about a third had a target on improved energy efficiency (IEA, 2015c). The World Future Council’s review of 158 NDCs found that 108 (68%) specified increasing the use of renewable energy as a mitigation action, with 75 NDCs including a quantifiable target for renewable energy (Stephan et al., 2016).
Almost half of the 29 NDCs of countries reviewed for this study mentioned energy-related mitigation actions. All of these included the use of renewable energy, with most outlining action in other areas. Table 1 summarises these.
In all but three of the countries, energy-related emissions have been shown to account for a smaller proportion of total emissions than the global average of about two-thirds. This might explain the absence of energy emission targets from their NDCs. However, the countries that mention energy-related mitigation actions tend to have a lower proportion of energy-related emissions than the countries that do not (average 28.8% compared with 47% for countries that do not include energy-related actions).
Table 1: Summary of energy commitments identified in NDCs of all selected countries
NDC target year Renewable energy
Energy efficiency
Energy access Fossil fuels Energy emissions
Bangladesh 2030 400 MW wind capacity1000 MW solar capacity (utility scale)
Shift 20% passenger traffic from road to rail;10% reduction on BAU in industrial energy consumption
Improved cook stoves have 70% market share by 2030; switch from biomass to LPG
100% new coal uses super-critical technology
36 MtCO2e conditional reduction on BAU by 2030 (12 MtCO2e, unconditional)
Benin 2030 259.9 MW hydro and 40 MW solar capacity
Off-grid electricity (1 million solar lamps) and improved cook stoves (140,000)
400 MW oil and gas generation capacity;promotion of butane for cooking for 275,000 households
19.4 MtCO2e reduction by 2030
Brazil 2025 45% share of renewables in the energy mix by 2030; 23% non-fossil electricity (excluding hydro)
10% increase in efficiency of electricity by 2030
Cape Verde 2025 100% renewable electricity by 2025 (30% unconditional)
Reduce demand by 20% relative to BAU (10% unconditional)
Universal access to electricity by 2017
600-700 tCO2e reduced
Congo DR 2030 Expanded hydro-power (650 MW) and solar
Improved transport infrastructure;improved efficiency of charcoal
Improved cook stoves; fuel wood reduction
20 MtCO2e reduction from transport and fuel wood by 2030 (against BAU)

Aligning objectives: international climate commttments and national energy strategies 12
NDC target year Renewable energy
Energy efficiency
Energy access Fossil fuels Energy emissions
Ghana 2030 Renewable energy share 10% by 2030; installed capacity (small hydro, wind, solar – utility scale and mini-grids)
200,000 solar home systems; 2 million efficient cook stoves
50% LPG adoption for cooking; switch to gas from oil for power generation
India 2030 40% of installed power capacity by 2030 from non-fossils (including nuclear)
Emissions intensity of GDP reduced by 33% to 35% by 2030 below 2005; promotion of energy efficiency
New, more efficient and cleaner technologies in thermal power generation
Lao DPR 2015-2030 30% renewable share of energy consumption by 2025; biofuels 10% share transport fuel; 5.5 GW hydropower capacity by 2020
90% access to electricity by 2020
1.468 MtCO2e reduction by 2025 from new renewables;63 ktCO2 saving per year from access to electricity
Malaysia 2030 45% reduction in energy intensity by 2030 (relative to 2005)
Mauritius 2030 Expand renewable electricity
Promotion of energy efficiency; smart grids
Switch to LNG
Nigeria 2030 13 GW solar PV capacity (off-grid)
30% energy efficiency improvement by 2030
Off-grid PV End gas flaring by 2030. Efficient gas generation. Biodiesel fuel blending
Senegal 2030 500 MW installed capacity (wind, solar, biomass), and 200 GWh hydropower by 2025
Energy efficiency promotion in buildings, industry, lighting and appliances
Improved stoves; bio-digesters; 5000 villages connected through solar mini-grids
Switch from coal to gas in power generation
7.5 MtCO2e reduction against BAU by 2030
Tanzania 2030 Renewable energy installed capacity
Promotion of energy efficiency
Natural gas installed capacity
Zambia 2030 Renewable energy in rural areas; biomass
Switching to lower carbon fuels
Source: NDCs available at http://www4.unfccc.int/ndcregistry/Pages/Home.aspx Note: The table includes only the 14 that include energy-related actions in their NDCs, out of the 29 NDCs reviewed.

13 ODI Insights
When energy is mentioned in an NDC as a sector for mitigation action, it is either:(a) a general statement about the action that will or might be taken (b) a specific target for energy production or consumption(c) a target for energy emission reductions.
Only the last of these provides a very clear indication of the mitigation contribution, with four to six of the 29 NDCs reviewed for this study including a quantifiable energy emissions target. Cape Verde, for example, estimates that its 100% renewable electricity objective will produce annual savings of 600 to 700 tCO2e. The absence of quantitative energy emission targets in NDCs limits comparative and overall assessment.
Some NDCs contain more than one kind of statement about the mitigation contribution from energy. Here, we consider mitigation actions relating to renewable energy, fossil fuels, energy efficiency and energy access.
Renewable energy objectives in the NDCs include: • the share of renewables in the overall energy mix (TPES)• the share of installed generation capacity, electricity generated, renewable energy or technology-specific capacity (MW) • the expanded use of general renewable energy or specific renewable energy sources.
NDCs vary in the specificity of their renewable energy objectives. Quantitative renewables targets can be found in 75 NDCs, but around a third of those indicating an intention to increase the use of renewable energy do not provide quantifiable targets (Stephan et al., 2016).
With the exceptions of Malaysia and Mozambique, action to increase the use of renewable energy is included in almost all of the NDCs reviewed for this study with an energy-related mitigation objective. The focus in 10 of these is on renewable energy in the power sector, with actions to increase either a) the renewable proportion of electricity generated or generation capacity or b) actions to invest in renewable generation capacity. Globally, the power sector accounted for about 38% of energy emissions in 2011 (Benoit, 2016), more than other categories of energy emission. The focus on renewables in the power sector may also be explained by the existing global trend towards renewables, stimulated by a steep reduction in their cost. According to the IEA, renewables are expected to account for 60% of the growth in power capacity over the next five years (IEA, 2016c). Ecofys (ETC, 2016) found that renewable energy will account for one third of the world’s electricity in 2030, compared with 20% today.
Though many NDCs are specific about the expansion of renewable electricity generation capacity, or the share of renewables in the overall energy mix, the majority are unspecific about fossil fuels (Stephan et al., 2016). Few countries indicate plans in their NDC to reduce coal-fired power, lower methane emissions or phase out
fossil fuel subsidies (IEA, 2015c). However, emissions from currently operating coal-fired power stations alone would exceed the total that could be emitted without overshooting the 2°C goal (Climate Analytics, 2016). Ecofys (ETC, 2016) found that, under current policies, developing countries would expand total fossil fuel power capacity, but suggested that the actual increase may be smaller than projected, with planned declines in coal-fired generation capacity estimated to be 160 GW, but 280 GW of new capacity committed. We can note that only South Africa and Mexico indicate the use of carbon capture and storage (CCS) as a mitigation action.
Few NDCs include actions to reduce energy emissions from transport, buildings or industry (ETC, 2016). The Democratic Republic of Congo (Congo DR) and Nigeria mention transport emissions without providing a specific target. The former indicated a 20 MtCO2e reduction from transport and wood fuel consumption, but without disaggregating between the two sources. Ethiopia’s NDC shows that energy-related emissions from industry and transport will be reduced, compared with BAU, in 2030. However, these emissions will be 75 MtCO2e higher than in 2010 and will account for about half of Ethiopia’s total emissions in 2030.
The NDCs of 79 developing countries mention energy efficiency (Höhne et al., 2016). The analysis of 16 INDCs by Ecofys (ETC, 2016) found that energy efficiency improvements would contribute about 24% of total emission reductions. Energy productivity would improve by 1.8% a year on average. There is recognition from 143 INDCs (88%) that improvements in energy efficiency or energy intensity constitute action that would contribute to emission reductions (IEA, 2016a). Few of the countries selected for this study set specific targets for energy efficiency or intensity, with this also applying to energy demand more generally. However, India and Malaysia present their overall contribution in terms of energy intensity, while Brazil specifies a 10% gain in energy efficiency. Cape Verde pledges to reduce energy demand relative to business as usual.
Five of the NDCs reviewed for this study (Benin, Congo DR, Ghana, Nigeria and Senegal) include mitigation actions related to the development objective of access to modern energy services. These include the expansion of off-grid electricity (particularly solar PV), the promotion of LPG for cooking and the dissemination of improved cook stoves. Benin estimates that reductions in the use of wood fuel could contribute emission savings of 1.3%.
Globally, energy production and consumption account for about two-thirds of total emissions and, in most countries, energy-related emissions are significant. Energy-related emissions account for less than 10% of the total in only four of the countries selected for this study: Cape Verde, Congo DR, Lao PDR and Mozambique. The absence of energy emission targets from many NDCs might therefore be addressed when the NDCs are reviewed during the facilitative dialogue scheduled to begin in 2018 (see Figure 1).

14 ODI Insights
5. Energy objectives in national plansIn this section, we review the energy objectives and targets of 30 selected countries to understand how these existing targets relate to their pledges in the NDCs. We focus on four aspects of energy policy: electricity generation, renewable energy, energy efficiency and access to modern energy services. Electricity generation is the largest category of energy emissions globally and the demand for electricity in developing countries is growing faster than it is for other forms of energy (IEA, 2015b). Renewable energy, energy efficiency and energy access are included the SDG energy targets.
Fossil fuels are produced in 23 of the selected countries, with net exports in nine (IEA Energy Statistics, 2016). Although policy objectives for fossil fuel production were not a particular focus of the analysis, domestic consumption of fossil fuels is largely covered by the four areas reviewed. Table 2 presents the objectives and targets
identified for each of the 30 countries reviewed.
Most national governments have a variety of objectives and targets for the development of their energy systems. For example, there may be objectives for the power sector, the overall energy mix, renewable energy, and for energy efficiency or intensity. Some have objectives for per capita energy consumption and the level of electrification. This variety is a result of the fragmentation of energy policymaking, with different departments responsible for different parts of the energy system or different energy sources. Another consequence is that the periods covered by different policies and plans may vary, which can lead to uncertainty about energy objectives. To make matters more complicated for cross-country comparisons, the metrics used for energy objectives and targets can differ within and between countries.
Table 2: Summary of national energy objectives of all 30 countries reviewed
Generation capacity Renewable energy Energy efficiency Access to energy
Bangladesh 39 GW installed capacity by 2030
10% final energy by 2020; 10% of electricity generation by 2020
20% saving on primary and secondary energy by 2030
100% access to electricity by 2021
Benin 843 MW solar PV capacity by 2030
24.6% of final energy by 2025
Improved efficiency of charcoal production; promotion of efficient lighting; introduction of energy efficiency into building codes
100% access to electricity by 2025
Brazil 221 GW by 2030 45% final energy by 2030; 23% of electricity generation by 2030
NDC targets 10% efficiency improvements in the power sector; new energy efficiency standards in industry and transport sectors
Cape Verde 50% of electricity generation by 2020; 100% by 2035
Reduce losses on grid to 8% Eradication of three stones stove for cooking by 2020 and make the use of wood energy choice in 2030
Colombia 4208 - 6675 MW additional capacity (depending on scenario)
6.5% grid connected by 2020; 30% off-grid by 2020
Sectoral targets for 2015: housing (9.21% saving), industry (3.68%), services (2.66%), and transport (1.29%)
By 2019, 99.37% access to electricity in areas served by the grid and 75.49% in areas off the grid
Congo R 3 GW installed capacity in 2014
85% of electricity generation by 2025
42% electrification rate in 2015
Congo DR Expand hydropower capacity 85% electricity from hydro in 2025 (15% from gas)
Reduce per capita fuel wood consumption by 50%, between 2010 and 2030

Aligning objectives: international climate commttments and national energy strategies 15
Generation capacity Renewable energy Energy efficiency Access to energy
Costa Rica 5 GW installed capacity in 2030
100% of electricity generation by 2021
Education strategy on energy efficiency
Dominican Republic 24,658 GWh by 2030 under BAU
25% of electricity generation by 2025
97% electrification rate in 2015.
Ethiopia 22 GW by 2030 Energy efficiency to reduce demand by 30%
90% access to electricity by 2020
Ghana 5,000 MW installed capacity by 2020
Increase share of renewables in final energy by 10%, by 2030 (from 2010); 10% share of electricity generation by 2020
Encourage energy efficiency and conservation
100% access to electricity by 2020; 50% LPG penetration by 2020
India 746 GW of installed capacity by 2030
40% share of electricity generation by 2030
National Mission on Enhanced Energy Efficiency to promote energy efficiency in industry, transport,buildings and appliances
100% access to electricity by 2017
Indonesia 703,000 TWh in 2030 25% of primary energy by 2025; 26% share of electricity generation by 2025
1% p.a. decrease in energy intensity, to 2025
93% access to electricity by 2020
Jamaica Gas-fired 320 MW combined-cycle power plant, and a 124 MW diesel generator, by 2030
20% final energy by 2030 100% access by 2015
Lao PDR 13 GW installed capacity in 2030
30% final energy by 2025 90% electrification rate by 2020
Malaysia 25 GW installed capacity in 2013.4 GW renewable capacity by 2030
16% share of electricity generation by 2030, 15% by 2050
Mauritius 35% share of electricity generation by 2025
Reduce energy consumption in buildings by 10% by 2020. 35% efficiency gain in transport by 2025
95% access to electricity by 2015
Mexico 25% share of power generation by 2018; 30% by 2021; 35% by 2024
Energy Transition Law requires the government to develop clear energy efficiency and clean energy goals for the next 15 and 30 years
Mozambique 3 GW installed capacity in 2014
25.6% by 2025
Nepal 10 GW hydropower capacity by 2030.200 MW grid-connected solar PV capacity
50% share of final energy consumption by 2030
1.6% rate of improvement in energy intensity by 2030; 100% penetration of energy efficient lights and appliances
100% access to electricity by 2025; traditional stoves completely replaced by improved cook stoves by 2030
Nicaragua 2340 MW installed capacity in 2030
74% share of electricity generation by 2018; 91% by 2027
100% access to electricity by 2030

16 ODI Insights
Generation capacity Renewable energy Energy efficiency Access to energy
Nigeria 33 GW installed capacity by 2020
18% of planned capacity for 2020; 20% of capacity by 2030
Increase energy efficiency by at least 50% by 2030
100% access to electricity by 2030. 80% of traditional fire wood consumption replaced by improved cook stove technology by 2030
Pakistan 163 GW by 2030 Minimum production of 9,700 MW by 2030
80% penetration of energy efficient appliances and products
73% electrification rate in 2015
Peru 10 GW installed capacity in 2014; 12 GW by 2030
40% share of electricity generation by 2021; 60% share by 2025
95% access to electricity by 2021
Philippines 18 GW installed capacity in 2014
40% share of electricity generation by 2020
Energy Efficiency Action Plan 2015-20, with 39 initiatives for all sectors
90% access to electricity by 2017
Senegal 990 MW installed capacity in 2014
20% share of electricity generation by 2017
77% access to electricity by 2016
South Africa 46 GW installed capacity in 2014
9% share of electricity generation by 2030
Energy efficiency improvements in the power sector, lighting, electric motors and appliances
95% access to electricity by 2030
Tanzania 8.99 GW installed capacity in 2030
14% share of electricity generation in 2015
2.6% p.a. rate of improvement in energy efficiency
75% access to electricity by 2033; over 75% of population with access to modern cooking solutions
Venezuela, RB 25 GW installed capacity in 2014
65% share of electricity generation in 2016
Zambia 2 GW installed capacity in 2014; 4 GW by 2030
100 MW from solar, 200 MW from small hydro and 100 MW from biomass by 2030; dissemination of 500,000 solar home systems and installation of 350,000 solar water heaters in order to reduce the demand load by 150 MW
26% electrification rate in 2015
Sources: Accord Fintech, 2015; Burnard et al., 2016; Carbon Brief, 2015; Climate Action Tracker, 2016a; Colombian National Gazette, 2011; Comisión Nacional De Energia, Dominican Republic, 2004, 2012; Costa, 2015; Department for Energy, Philippines, nd; Department of Energy, South Africa, 2010, 2013; Department of Environmental Affairs, South Africa, nd; Director General of Electricity, Indonesia, 2015; Director of Forestry and Water Resources Conservation, Indonesia, 2015; ECREEE, nd; Energy Commission, Ghana, 2006; Federal Democratic Republic of Ethiopia, nd, 2012, 2015; Garnaik, 2008; Global Climate Change Alliance, 2016; González, 2015; Grantham Institute Global Climate Legislation Database, 2016; Herreraa, 2015; Hossain, nd; IEA, 2015c, 2015e, 2015; IEA and IRENA, 2016; Instituto Costarricense de Electricidad, 2014; International Monetary Fund, 2013; IRENA, 2012a, 2012b, 2013a, 2013b, 2015b; Kouphokham, 2012; Mahman, 2015; MINAM, 2010, 2016; Ministerio de Ambiente y Energia, Costa Rica, 2015; Ministério da Energia, Mozambique, nd; Ministerio de Energia y Minas, Nicaragua, 2016; Ministerio de Energía y Minas, Peru, nd; Ministerio de Minas y Energía, Colombia, 2006; Ministry of Energy, Green Technology and Water, Malaysia, 2008, 2015; Ministry of Energy and Mining, Jamaica, 2009; Ministry of Environment and Sustainable Development, Mauritius, 2013; Ministry of Power, Energy and Mineral Resources, Bangladesh, 2013; Ministry of Power, Nigeria, 2015; Ministry of Water and Power, Pakistan, 2013; Muzeya, 2015; National Planning Commission, Nepal, 2015; National Planning Commission, Nigeria, nd; National Planning Department, Zambia, 2014; National Transmission and Despatch Company Limited, 2011; NgouBou, 2013; Nigeria Vision 2020 Program, 2009; Planning Commission, Pakistan, 2007; Prime Minister’s Department, Malaysia, 2010; Republic of Mauritius, 2011, 2014; Secretaria de Planejamento e Desenvolvimento Energético, Brazil, 2015; SE4All, 2015, nd; Siliya, 2015; Tamang, 2013; Tettey, nd; UNEP DTU, 2016; Unidad de Planeación Minero Energética, Colombia, 2015; United Republic of Tanzania, 2015; Vallejo, 2014; Worldwatch Institute, 2016.

Aligning objectives: international climate commttments and national energy strategies 17
One certainty is that a critical objective for energy policy in developing countries is to ensure that the rapidly growing demand for energy can be met. The IEA estimate that global energy demand will increase by about a third between 2013 and 2040 (IEA, 2015b).6 Almost all this growth will be in non-OECD countries, which are expected to increase their consumption by 55%. Energy consumption in Africa is expected to be 75% higher in 2040 (IEA, 2015b).
Growth in the consumption of energy is largely determined by economic and population growth. Governments’ medium-term plans to meet growing demand are based on their expectations for economic growth It is for this reason that they often are formulated in terms of alternative scenarios (e.g. with high, medium and low economic growth rates). The use of scenarios and projections rather than specific targets suggests there may be a degree of flexibility in energy plans, which could accommodate higher ambition in NDCs.
A further policy priority for most governments is to ensure the security of energy supplies. This is often balanced with the objective to keep down the cost of energy for consumers. In the power sector, for example, there may be an emphasis on a ‘least-cost’ plan for the expansion of the sector, combined with an intention to rely on domestic energy resources. The environmental dimension of the energy policy trilemma tends to be given less emphasis.
Renewable energy and electricity generation
Over 170 countries, including 117 developing countries, had targets for renewable energy at the end of 2015 (Höhne et al., 2016). Previous Overseas Development
6 Under the IEA’s New Policies Scenario, which is based on pledges in the Cancun climate change agreement, energy consumption grows by 9% (IEA, 2016b). All of the IEA scenarios depend on assumptions made about economic growth, policy changes and technology development.
7 The eight countries depicted in Figure 4 are those for which reliable data about generation capacity are available. They are not intended to be representative of the 30 included in the study, or of developing countries per se.
Institute (ODI) analysis of national objectives in 75 countries (Scott and Lucci, 2015), found that fewer than a third of countries had a target specifying the proportion of renewables in their total final energy consumption, the indicator used by the Sustainable Energy for All initiative. A similar number of countries had a new renewables target (i.e. excluding large-scale hydropower) for the proportion of renewables in the energy mix or total primary energy supply. The most frequently found renewable energy target (in 49 of 75 countries) was for the proportion of electricity generated from renewable sources (Scott and Lucci, ibid.).
There are plans in all the countries selected for this study to expand electricity generation capacity. In some cases, generation capacity needs to increase to meet unmet demand today as well as growth in future demand. Bangladesh, for example, aims to triple its installed generation capacity by 2030, while Pakistan aims to increase its capacity more than six-fold. Ethiopia intends to go further, increasing generation capacity eight-fold in order to export renewable electricity to its neighbours, with its NDC noting that its exports of renewable electricity will reduce emissions in other countries. A critical question is whether this intended expansion of electricity generation is compatible with pledges to reduce emissions. Figure 3 compares the percentage growth in generation capacity to 2030 in five countries with the percentage change in emissions pledged in their NDC. In all five, generation capacity will increase by much more than emissions.
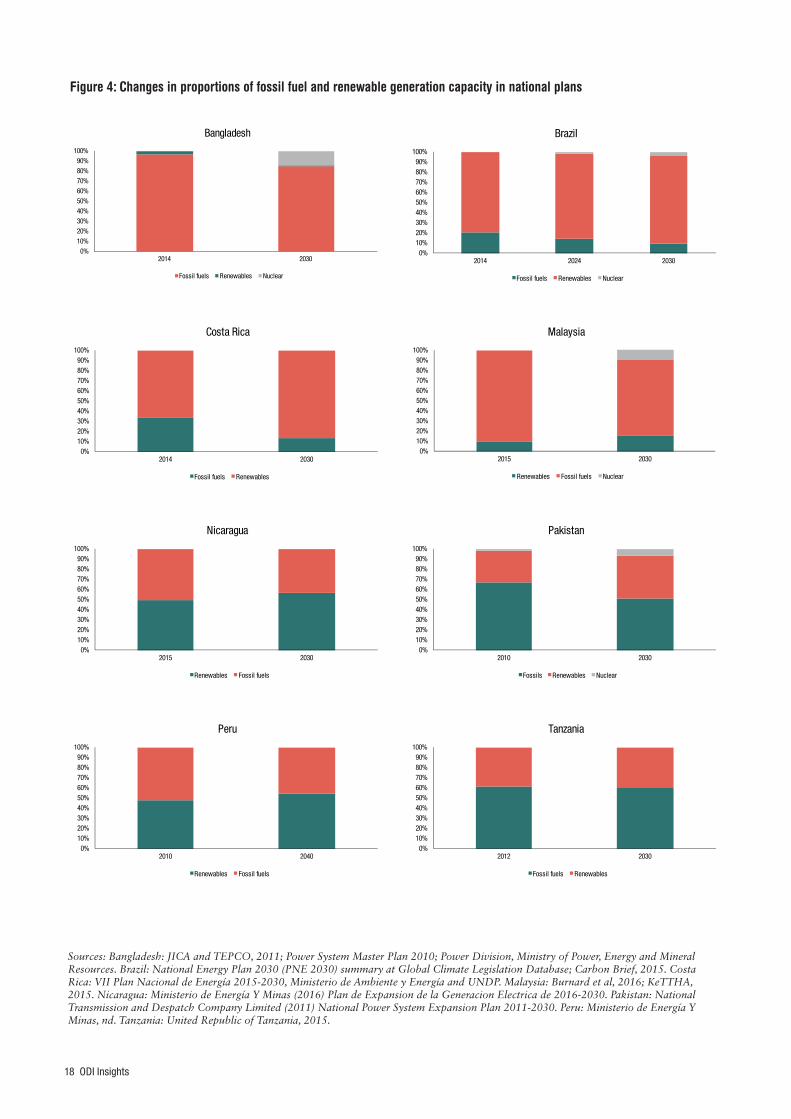
The intended change in the proportions of renewable and fossil fuel generation capacity in eight countries is shown in Figure 4.7 With the exceptions of Bangladesh
Figure 3: Growth in generation capacity and GHG emissions to 2030
-100%
0%
100%
200%
300%
400%
500%
600%
700%
Bangladesh Ghana Nigeria Pakistan Peru
Growth in generation capacity Growth in emissions (after NDC)
18 ODI Insights
Figure 4: Changes in proportions of fossil fuel and renewable generation capacity in national plans
Sources: Bangladesh: JICA and TEPCO, 2011; Power System Master Plan 2010; Power Division, Ministry of Power, Energy and Mineral Resources. Brazil: National Energy Plan 2030 (PNE 2030) summary at Global Climate Legislation Database; Carbon Brief, 2015. Costa Rica: VII Plan Nacional de Energía 2015-2030, Ministerio de Ambiente y Energía and UNDP. Malaysia: Burnard et al, 2016; KeTTHA, 2015. Nicaragua: Ministerio de Energía Y Minas (2016) Plan de Expansion de la Generacion Electrica de 2016-2030. Pakistan: National Transmission and Despatch Company Limited (2011) National Power System Expansion Plan 2011-2030. Peru: Ministerio de Energía Y Minas, nd. Tanzania: United Republic of Tanzania, 2015.
0%10%20%30%40%50%60%70%80%90%
100%
2014 2030
Bangladesh
Fossil fuels Renewables Nuclear
0%10%20%30%40%50%60%70%80%90%
100%
2014 2024 2030
Brazil
Fossil fuels Renewables Nuclear
0%10%20%30%40%50%60%70%80%90%
100%
2014 2030
Costa Rica
Fossil fuels Renewables
0%10%20%30%40%50%60%70%80%90%
100%
2015 2030
Malaysia
Renewables Fossil fuels Nuclear
0%10%20%30%40%50%60%70%80%90%
100%
2015 2030
Nicaragua
Renewables Fossil fuels
0%10%20%30%40%50%60%70%80%90%
100%
2010 2030
Pakistan
Fossils Renewables Nuclear
0%10%20%30%40%50%60%70%80%90%
100%
2010 2040
Peru
Renewables Fossil fuels
0%10%20%30%40%50%60%70%80%90%
100%
2012 2030
Tanzania
Fossil fuels Renewables

Aligning objectives: international climate commttments and national energy strategies 19
and Costa Rica, this figure suggests that, on the basis of current plans, there will not be a dramatic shift towards renewable electricity capacity by 2030.8 A shift towards fossil fuel generation is shown in Bangladesh, while there is a demonstrable shift towards renewables in Costa Rica. Although the latter has an objective to achieve 100% renewable electricity by 2021, according to current projections, about 13% of planned generation capacity in 2030 will be fossil fuel-based (Instituto Costarricense de Electricidad, 2014). Although the fossil fuel proportion of total generation capacity in a country may not change significantly before 2030, the total capacity can increase. Fossil fuel generation capacity itself will therefore increase, with obvious implications for greenhouse gas emissions.
The effect of the planned expansion of fossil fuel generation capacity on total greenhouse gas emissions depends on the fossil fuels and technologies that will be deployed. Bangladesh, for example, is planning to triple its generation capacity by 2030, to 30,600 MW. Half of this capacity will be coal-fired and 25% gas-fired. Total fossil fuel capacity will be approximately 250% higher than in 2014 and, according to one analysis, energy-related emissions in Bangladesh will increase by 264% between 2011 and 2030 (Hossain, nd). The NDC estimates that BAU emissions from the power sector will increase by 336% between 2011 and 2030. The total conditional commitment to reduce these emissions will still result in an increase of over 250%.
The implications of plans to expand coal-fired generation are illustrated by the example of Pakistan. Figure 5 shows
8 2040 in the case of Peru.
the composition of installed capacity in Pakistan in 2010 and what is proposed for 2030. The share of renewables is expected to increase from 30% to 41%, largely through a six-fold increase in hydropower capacity (National Transmission and Despatch Company Limited, 2011). Fossil fuel capacity will increase from 14.4 GW to 56.7 GW, with new coal-fired capacity accounting for a third of the total capacity in 2030. This suggests that emissions from power generation could increase at a higher rate than installed capacity and reach 40-50% of the country’s total emissions, assuming the draft 5% unconditional reduction is adopted and achieved.
Pakistan’s generation plans recognise the climate change challenge, indicating that climate compatibility will be achieved through the use of carbon capture and storage (CCS) technology (Planning Commission, 2007). However, CCS technology is technologically and commercially unproven in operating power stations (Pickard and Granoff, 2015). Reliance on CCS to achieve emission reduction objectives would be aspirational rather than practical, and highlights the question of the likelihood of some countries’ energy plans being realised in practice.
Bangladesh and Pakistan are not the only countries selected for this study to plan to expand coal-fired generation capacity. According to End Coal (nd), 23 of the 30 countries had new coal plants announced, in development or under construction in July 2016. This includes seven countries that are currently without coal-fired power stations. This includes Tanzania, which is also planning a five-fold increase renewable electricity
Figure 5: Installed capacity (MW) in Pakistan in 2010 and 2030
0
20000
40000
60000
80000
100000
120000
2010 2030
Oil Gas Coal Imports Hydro Wind Nuclear
Source: National Transmission and Despatch Company Limited, 2011.

20 ODI Insights
capacity (see Figure 6). However, the share of renewables in total capacity will be approximately the same (36.2%, compared with 38.4% in 2012). Fossil fuel generation capacity will increase five-fold to 5,460 MW, including coal-fired plants with a combined capacity greater than Tanzania’s total installed capacity in 2012. A five-fold increase in emissions from power generation would add around 14 MtCO2e a year to the country’s emissions in 2030, accounting for a significant proportion of the 121.5 MtCO2e increase implied by the NDC.
It is clear from the analysis of national energy objectives for generation capacity that an increase in the proportion of renewables, or a large increase in renewable electricity capacity, would not necessarily lead to a decrease in emissions from electricity generation by 2030. Objectives for the share of renewables and renewable generation capacity feature in many NDCs, but they can also be consistent with increases in fossil fuel generation, which could lock-in emissions and dependency on fossil fuels for three or four decades.Energy efficiency
By the end of 2015, 67 developing countries had adopted energy efficiency targets (Höhne et al., 2016). Approximately two-thirds of these are sector-specific, most commonly for lighting (26%) and buildings (21%), with one-third cross-sectoral. They vary in timing and level of ambition, and in the way energy efficiency will be measured (e.g. savings in consumption, improvements in energy intensity or adoption of energy efficient products).
Most of the countries included in this study have a broad energy policy or vision statement that mentions energy efficiency. Over half have energy efficiency targets of some
kind (see Table 2). Four countries have a national strategy or plan for energy efficiency (Bangladesh, India, Nigeria and Colombia), while Ethiopia is planning to reduce energy demand, relative to business as usual.
The IEA (2016a) concludes that government policy has been fundamental to improvements in energy efficiency, particularly the adoption of statutory standards (e.g. for vehicle fuel economy and emissions). The adoption of energy efficiency targets in developing countries has been quite recent, but there is scope to strengthen efforts to improve energy efficiency in most countries and to include these actions in NDCs. For example, 10 countries included in this study (Benin, Colombia, Costa Rica, Ethiopia, Ghana, Indonesia, Nepal, Pakistan, Philippines and South Africa) have national energy efficiency objectives, including some that are not quantifiable, but do not mention action on energy efficiency in their NDC.
Access to modern energy services
Access to electricity is very close to universal in six of the 30 countries selected for this study. In the others, the level of access ranges from less than 10% (Congo DR) to over 90% in Cape Verde, Dominican Republic, Jamaica and Peru. In most countries that have not yet achieved universal access, there is a national target for electrification. Some of these targets have dates before 2030 because their planning cycle does not coincide with the SDG target year. Although most countries are aiming to achieve universal access before 2030, some are not planning to achieve it until later (e.g. Tanzania and Mozambique).
Decentralised (off-grid) renewable electricity is the ‘least-cost’ option for providing access in most rural and remote
Figure 6: Installed capacity (MW) in Tanzania in 2012 and 2030
0
1000
2000
3000
4000
5000
6000
7000
8000
9000
2012 2030
Gas Diesel Coal Hydro Solar Wind Biomass cognition Other
Source: Ministry of Energy and Minerals, 2015.

Aligning objectives: international climate commttments and national energy strategies 21
areas. In some countries, the access to electricity objective is linked to renewable energy. The provision of universal access to electricity will not make a significant difference to greenhouse gas emissions (IEA, 2015d), and therefore to NDC pledges.
Access to safe and clean (non-solid) fuels for cooking and heating is much lower than access to electricity in every selected country, yet few have a national policy or target for cooking energy. However, the global SE4All initiative, launched in 2011, has encouraged more countries to
adopt an objective for access to modern cooking energy services. Those countries included in this study that have adopted an SE4All Action Agenda tend to have a target for improved cooking energy (e.g. Cape Verde, Ghana, and Nigeria). The adoption of cleaner fuels, such as LPG, and improved cook stoves will be of great benefit to people’s health, as well as playing a role in reducing emissions. Indeed, the NDCs of Benin and Senegal include action on clean cooking fuels, with Benin’s NDC pointing to a 1.3% reduction in total emissions through the promotion of improved cook stoves.
Wind turbine, India. Credit: The Danish Wind Industry Association

22 ODI Insights
6. ConclusionsCollectively, the pledges contained in NDCs do not promise enough mitigation action to achieve the well-below 2°C goal of the Paris Agreement. Fortunately, the agreement provides for the five-yearly review of pledges, with the expectation of increasing ambition in successive NDCs. The first full revision of NDCs is scheduled for 2023 (see Figure 1). This may be too late to raise NDCs’ mitigation ambitions enough to ensure a pathway towards well-below 2°C. Therefore, every opportunity needs to be taken to encourage an increase in national emission reduction contributions. The facilitative dialogue, due to begin in 2018, is the first formal opportunity to do this and should be used to ensure that maximum action is pledged by all countries.
Increasing the ambition of pledges in the NDCs can firstly be achieved by including all planned actions that contribute to mitigation. In this paper, we have focused on energy-related emissions. The NDCs of countries that do not yet specify mitigation actions in the energy sector (e.g. 16 out of the 30 selected countries in this study), can include them in future. NDCs that do not include concrete or comprehensive energy emission targets can provide estimates of energy emission reductions, based on planned changes in energy production and consumption. This will require further detailed analysis of energy plans and forecasts, along with their associated emissions, by many countries that have not included energy emission reductions in their NDCs.
The principal objective for energy policy in developing countries is to ensure that the rapidly growing demand for energy can be met. The demand for electricity is growing fastest and there are plans to expand electricity generation capacity in all thirty of the developing countries included in our analyses. In 19, there are plans to invest in coal-fired generation, according to End Coal (nd). This would potentially lock-in reliance on fossil fuels for decades and contribute to the increase in total emissions that some countries expect in 2030 after full delivery of their current NDC. However, those NDCs reviewed in this study that mention fossil fuel generation only refer to efficiency and switching to lower-carbon fuels (see Table 1).
National energy policy frameworks can be complex and fragmented, and are not necessarily linked to climate change policies and plans. Almost every country has a policy or strategy for the development of renewable energy, though each of these may be defined differently. However, renewable energy is only part of the energy mix. Growth in the consumption of fossil fuels remains part of the strategy and plan in many developing countries, while industrialised (high-income) countries will also have fossil fuels as part of their energy mix. This growth in fossil fuel use may not be reflected in developing countries’ NDCs – only nine of the 29 NDCs reviewed include mitigation actions relating to fossil
fuels (see Table 1). This raises questions about coherence between energy development plans and climate change objectives in NDCs and highlights the importance of their alignment.
In developing countries where the demand for energy is growing rapidly, an increase in the proportion of renewables – or a large increase in renewable electricity capacity – does not necessarily mean that emissions from electricity generation will decrease. Both of these objectives feature in NDCs and the SDGs, but they can also be consistent with increases in fossil fuel emissions. NDCs should therefore reflect a comprehensive assessment of emissions from all elements of the national energy system if they are to provide a clear picture of the country’s overall contribution to global emission reductions. In some countries, this analysis has yet to be undertaken.
A growing number of developing countries have objectives for energy efficiency, with these included in some NDCs. However, they are often not quantified and their emission reduction contribution cannot be estimated. One challenge presented is finding out how to best measure a) energy efficiency in buildings, industry and transport and b) the related emission reduction gains (ETC, 2016). Energy efficiency improvements will contribute about 24% of global emission reductions, according to the analysis by Ecofys (ETC, 2016). There is scope for more NDCs to include energy efficiency objectives, as well as opportunities for them to better quantify energy efficiency mitigation actions. Thorough assessment of countries’ energy efficiency potential and cost-effective energy efficiency options will be required.
About ten years ago, around half of developing countries had a national access to electricity target (Legros et al., 2009). Most developing countries now have this in place, reflecting the higher priority that is now given to energy access. However, this does not mean that the global target of universal access by 2030 will be realised everywhere. In contrast, access to modern energy services for cooking is the largest single use of energy in most low-income countries, but a policy objective in only a few of them. Yet, the widespread adoption of improved cook stoves and LPG would reduce emissions, contribute to the SDG 7 target and make a significant contribution to people’s health status and the related SDG 3. The mitigation contribution may be small, and universal access to modern energy services will make only a small difference for climate change objectives globally, but this mitigation contribution can be included in NDCs, as Benin and Senegal have done.
The fastest growth in demand for energy in developing countries is for electricity. All the countries included in this study are planning for large and rapid expansion in generation capacity. In some countries, an expansion of
Aligning objectives: international climate commttments and national energy strategies 23
fossil fuel generation is planned, potentially locking-in reliance on fossil fuels for decades. However, complete decarbonisation of the world’s electricity systems by mid-century will be essential to achieve the well-below 2°C goal (IEA, 2015a). This calls for more ambitious NDC pledges and further action by countries, particularly those planning large increases in fossil fuel generation capacity, which will significantly increase energy-related emissions.
This will require the thorough review of power sector plans, not least to take account of the recent change in the relative prices of renewable electricity and fossil fuel generation. Large-scale solar PV plants are now the ‘least-cost’ option for electricity generation in many developing countries (IEA and NEA, 2015; IRENA, 2015). In some places, plans are being changed, as shown by the 14% reduction in the total capacity of coal plants in the pre-planning stages in the first half of 2016 (End Coal, nd). However, many developing countries have relied on international support to prepare NDCs and reports to the UNFCCC, as well as for the development of energy sector policies and plans. International support will be required to enable developing countries to prepare policies and plans for a transition to low-carbon energy systems. The imperative of reducing global emissions
from 2020 suggests that this support should be provided immediately.The provision of support to reduce energy-related emissions in developing countries, where energy consumption needs to grow, does not affect the imperative for industrialised countries to rapidly decarbonise their energy systems. However, the need for decarbonisation in the energy systems of developing countries does raise questions about global equity in implementation of the Paris Agreement. Further research on how national energy plans can be linked to NDCs would help inform this debate.
The review and revision cycle for NDCs is outlined in the Paris Agreement, though the details have yet to be elaborated. Parties to the agreement will also be reporting internationally on progress towards the SDGs. Progress on national SDG energy targets will simultaneously constitute movement towards the NDC (provided it includes action on energy emissions). It will be important, therefore, to avoid duplication of effort for resource-constrained developing country governments. At both the national and international level, the delivery of the NDCs and achievement of the SDGs need to be seen, together, as a single agenda.
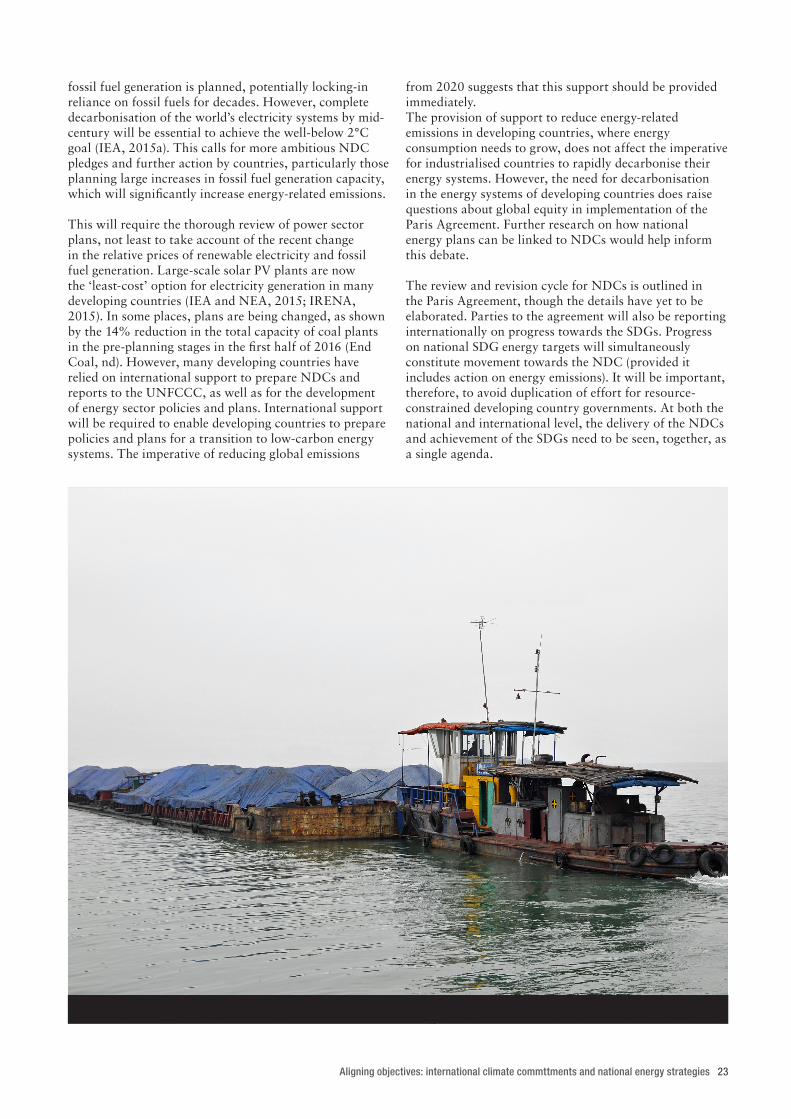
Barge carrying coal, Vietnam. Credit: Dennis Jarvis
24 ODI Insights
ReferencesAccord Fintech (2015) Power sector in India: All you wanted to know in 5 points, Financial Express, 19 October 2015.
(http://www.financialexpress.com/economy/power-sector-in-india-all-you-wanted-to-know-in-5-points/153547/). Accessed 3 December 2016.
Amponin., J. and Evans, J. (2016) Assessing the Intended Nationally Determined Contributions of ADB Developing Members. Mandaluyong: Asian Development Bank.
Benoit, P. (2016) ‘Energy and Climate: From Paris to Marrakesh and Beyond’. Presentation given in Marrakesh, 8 September 2016. Paris: International Energy Agency.
Burnard, K., Hsieh, S., Razali, N., Baruya, P., Nguyen, N. and Nguyen, C. (2016) Reducing emissions from fossil-fired generation Indonesia, Malaysia and Viet Nam. Paris: International Energy Agency.
Carbon Brief. (2015) Analysis: Brazil’s climate pledge represents slight increase on current emissions, 29 September 2015. Various locations: Carbon Brief. (https://www.carbonbrief.org/analysis-brazils-climate-pledge-represents-slight-increase-on-current-emissions). Accessed 3 December 2016
Climate Action Tracker. (2016a) ‘Tracking (I)NDCs: Assessment of mitigation contributions to the Paris Agreement’. Various locations: Climate Action Tracker.
Climate Action Tracker. (2016b) ‘The ten most important short-term Steps to limit warming to 1.5°C’. Various locations: Climate Action Tracker.
Climate Analytics. (2016) Implications of the Paris Agreement for Coal Use in the Power Sector. Berlin: Climate Analytics.
Climate Energy. (2016) ‘NDC & INDC Factsheets’. Melbourne: The University of Melbourne (http://www.climate-energy-college.net/ndc-indc-factsheets).
Colombian National Gazette (2011) National Development Plan. Policy N. 1450. 16 June. Bogota: Colombian National Gazette. (http://www.secretariasenado.gov.co/senado/basedoc/ley/2011/ley_1450_2011.html).
Comisión Nacional De Energia, Dominican Republic. (2012) Status and Outlook of the Renewable Energies in the Dominican Republic. Washington: Global Workshop on Clean Energy Development. (https://www.usea.org/sites/default/files/event-/Dominican%20Republic%20Country%20Presentation_0.pdf). Accessed 5 December 2016.
Comisión Nacional de Energía, Dominican Republic. (2004) Plan Energético Nacional 2004-2015. Santo Domingo: Comisión Nacional de Energía. (http://www.cne.gob.do/wp-content/uploads/2015/05/Plan-Energe%CC%81tico-Nacional-2000-2015.pdf). Accessed 3 December 2016.
Costa, A. (2015) Renewable Energy and Energy Efficiency in Cabo Verde.Praia: Direção de Energia. (http://www.ccila-portugal.com/fileadmin/ahk_portugal/IMAGENS_CCILA/SEDE/ME_Cabo_
Verde/Anildo_Costa.pdf). Accessed 3 December 2016.End Coal. (2016) ‘Proposed Coal Plants by Country (MW) - July 2016’. End Coal. (http://endcoal.org/
global-coal-plant-tracker/) Day, T., Höhne, N. and Gonzales, S. (2015) Assessing the missed benefits of countries’ national contributions:
Quantifying potential co-benefits. Cologne: New Climate Institute.Department for Energy, Philippines. (nd) Philippine Energy Plan 2012-2030. Manila: Department for Energy. https://
www.doe.gov.ph/sites/default/files/pdf/pep/2012-2030_pep.pdf. Accessed 3 December 2016.Department of Energy, South Africa. (2010) Policy to support the Energy Efficiency and Demand Side Management:
Program for the Electricity Sector through the Standard Offer Incentive Scheme. Pretoria: Department of Energy. http://www.energy.gov.za/files/policies/Energy_Efficiency_and_Demand_Side_Management_Policy.pdf Accessed 5 December 2016.
Department of Energy, South Africa. (2013) Integrated Resource Plan for Electricity (IRP) 2010-2030: Update Report 2013. Pretoria: Department of Energy. http://www.doe-irp.co.za/content/IRP2010_updatea.pdf. Accessed 5 December 2016.
Department of Environmental Affairs, South Africa. (nd) National Climate Change Response White Paper. Pretoria: Department of Environmental Affairs. https://www.environment.gov.za/sites/default/files/docs/nccr_whitepaper.pdf. Accessed 5 December 2016.
Director General of Electricity, Indonesia. (2015) Power Policy and National Development Plan in Indonesia. Bangkok: Symposium on Sustainable Power Supply Mix in the Future 20 November 2015. (http://www.eri.chula.ac.th/eri-main/wp-content/uploads/2015/11/S1-2_Mr._Jarman_MEMR_final_rev.pdf). Accessed 3 December 2016.
Director of Forestry and Water Resources Conservation, Indonesia. (2015) Medium Term Development Plan: RPJMN 2015-2019. Jakarta: Director of Forestry and Water Resources Conservation. (http://www.unorcid.org/upload/BAPPENAS_Forestry_and_Water_Ressources_UNORCID_Dialogue_Series_9_March_2015.pdf). Accessed 5 December 2016.

Aligning objectives: international climate commttments and national energy strategies 25
ECREEE. (nd) Summary of Cape Verde Renewable Energy Plan. Praia: ECOWAS Centre for Renewable Energy and Energy Efficiency. (http://www.ecowrex.org/system/files/documents/2011_summary-of-cape-verde-renewable-energy-plan_ecreee.pdf). Accessed 3 December 2016.
Energy Commission, Ghana. (2006) Strategic National Energy Plan 2006-2020. Accra: Energy Commission. (http://www.energycom.gov.gh/files/snep/MAIN%20REPORT%20final%20PD.pdf). Accessed 3 December 2016.
Energy Transitions Commission (ETC). (2016) Pathways from Paris: Assessing the INDC Opportunity. Various locations: Energy Transitions Commission and Ecofys.
Federal Democratic Republic of Ethiopia (nd) Ethiopia’s Climate-Resilient Green Economy: Green economy strategy. Addis Ababa: Federal Democratic Republic of Ethiopia. (http://www.undp.org/content/dam/ethiopia/docs/Ethiopia%20CRGE.pdf). Accessed 4 December 2016.
Federal Democratic Republic of Ethiopia (2012) Scaling-Up Renewable Energy Program Ethiopia Investment Plan (Draft Final). Addis Ababa: Ministry of Water and Energy. (https://www.oecd.org/env/cc/TADELE_FDRE%20Ethiopia%20Scaling%20-%20Up%20Renewable%20Energy%20Program%202012.pdf). Accessed 4 December 2016.
Federal Democratic Republic of Ethiopia. (2015) The Second Growth and Transformation Plan (GTP II) (2015/16-2019/20) (Draft). Addis Ababa: Federal Democratic Republic of Ethiopia. (https://www.africaintelligence.com/c/dc/LOI/1415/GTP-II.pdf). Accessed 4 December 2016.
Garnaik, S.P. (2008) National Mission for Enhanced Energy Efficiency. New Delhi: Ministry of Environment, Forest and Climate Change (MoEFCC), Government of India (http://www.moef.nic.in/downloads/others/Mission-SAPCC-NMEEE.pdf).
Global Climate Change Alliance (2016) Global Climate Change Alliance for Mauritius. Various locations: GCCA. (http://www.gcca.eu/national-programmes/africa/global-climate-change-alliance-for-mauritius). Accessed 4 December 2016.
González, A. (2015) El plan de desarrollo del sistema eléctrico venezolano omite flagrantemente el pensamiento y legado del ex-presidente Hugo Chávez. aporrea, 3 November 2015. http://www.aporrea.org/energia/a216535.html. Accessed 3 December 2016.
Government Information Service, Mauritius. (2015) A Climate Change Bill to better address effects of climate change is in the pipeline. Port Louis: Government Information Service. (http://www.govmu.org/English/News/Pages/A-Climate-Change-Bill-to-better-address-effects-of-climate-change-is-in-the-pipeline.aspx). Accessed 4 December 20126.
Grantham Institute Global Climate Legislation Database. (2016a) [Brazil] National Energy Plan 2030 (PNE 2030). London: Grantham Institute. (http://www.lse.ac.uk/GranthamInstitute/law/national-energy-plan-2030-pne-2030/). Accessed 3 December 2016.
Grantham Institute Global Climate Legislation Database. (2016b) Mozambique. 2013-2025 National Strategy for Climate Change (ENMC). London: Grantham Institute. (http://www.lse.ac.uk/GranthamInstitute/law/2013-2025-national-strategy-for-climate-change-enmc/). Accessed 3 December 2016.
Helme, N., Blandford, L. and Pitt, H. (2015) Converting Intended Nationally Determined Contributions into Action. Washington, D.C.: Centre for Clean Air Policy.
Herreraa, H. (2015) A Brief Overview of Mexico’s Energy Transition Act. Various locations: haynesboone. (http://www.haynesboone.com/alerts/a-brief-overview-of-mexicos-energy-transition-act). Accessed 3 December 2016.
Hof, A., van Soest, H., van den Berg, M., Sytze de Boer, H., den Elzen, M., Harmsen, M., Roelfsema, M. and van Vuuren, D. (2015) Raising the ambition level of INDCs allows for a smoother energy transition: Assessment of the implications of INDCs for achieving the 2 °C climate goal. The Hague: PBL Netherlands Environmental Assessment Agency.
Höhne, N., Hagemann, M., Kuramochi, T., Gonzales, S., Sterl, S. and Day, T. (2016) Renewable energy and energy efficiency in developing countries: contributions to reducing global emissions. Nairobi: The 1 Gigaton Coalition and UN Environment Programme (UNEP).
Hossain, I. (nd) ‘Mitigation in Bangladesh’s INDC’. Dhaka: Energy and Power (http://ep-bd.com/online/details.php?cid=12&id=19215).
ICF International. (2016) Analysis of Intended Nationally Determined Contributions (INDCs). Washington D.C.: USAID Resources to Advance LEDS Implementation (RALI) Program.
IEA. (2015a) Energy Technology Perspectives 2015: Mobilising Innovation to Accelerate Climate Action. Paris: International Energy Agency.
IEA. (2015b) World Energy Outlook 2015. Paris: International Energy Agency. IEA. (2015c) Energy and Climate Change: World Energy Outlook Special Briefing for COP21. Paris: International
Energy Agency.IEA. (2015d) Energy and Climate Change: World Energy Outlook Special Report. Paris: International Energy Agency.IEA. (2015e) Indonesia 2015 - Energy Policies Beyond IEA Countries. Paris: International Energy Agency. (https://www.
iea.org/publications/freepublications/publication/Indonesia_IDR.pdf) Accessed 5 December 2016.IEA. (2015) India Energy Outlook. Paris: International Energy Agency. (http://www.worldenergyoutlook.org/media/
weowebsite/2015/IndiaEnergyOutlook_WEO2015.pdf). Accessed 3 December 2016.

26 ODI Insights
IEA. (2016a) Energy Efficiency Market Report 2016. Paris: International Energy Agency.IEA. (2016b) World Energy Outlook 2016. Paris: International Energy Agency.IEA. (2016c) Renewable Energy Medium Term Market Report 2016. Paris: International Energy Agency.IEA and IRENA (2016) Joint Policies and Measures database. Various locations: International Energy Agency and
International Renewable Energy Agency. https://www.iea.org/policiesandmeasures/. IEA and NEA. (2015) Projected Costs of Generating Electricity. 2015 Edition. Paris and Boulogne-Billancourt:
International Energy Agency and Nuclear Energy Agency.IEF. (2016) ‘A Comparison of Recent IEA and OPEC Outlooks’. Introductory Paper for Sixth IEA-IEF-OPEC Symposium
on Energy Outlooks. Riyadh: International Energy Forum.Instituto Costarricense de Electricidad (ICE). (2014) Plan De Expansion de la Generacion Electrica Periodo 2014-2035.
San José: Instituto Costarricense de Electricidad.International Monetary Fund (2013) Democratic Republic of the Congo: Poverty Reduction Strategy Paper, IMF
Country Report No. 13/226. Washington: International Monetary Fund. (https://www.imf.org/external/pubs/ft/scr/2013/cr13226.pdf). Accessed 4 December 2016.
IPCC. (2014) ‘Summary for Policymakers’, in Climate Change 2014: Mitigation of Climate Change. Contribution of Working Group III to the Fifth Assessment Report of the Intergovernmental Panel on Climate Change. Cambridge and New York: Cambridge University Press.
IRENA. (2012a) Mozambique: Renewables Readiness Assessment 2012. Abu Dhabi: International Renewable Energy Agency. (http://www.irena.org/DocumentDownloads/Publications/IRENA%20Mozambique%20RRA.pdf). Accessed 5 December 2016.
IRENA. (2012a) Senegal: Renewables Readiness Assessment 2012. Abu Dhabi: International Renewable Energy Agency. (http://www.irena.org/DocumentDownloads/Publications/IRENA%20Senegal%20RRA.pdf) Accessed 6 December 2016.
IRENA. (2013a) Zambia Renewables Readiness Assessment 2013. Abu Dhabi: International Renewable Energy Agency. http://www.irena.org/documentdownloads/publications/rra_zambia.pdf. Accessed 5 December 2016.
IRENA. (2013b) West African Power Pool: Planning and Prospects for Renewable Energy. Abu Dhabi: IRENA. (http://www.irena.org/DocumentDownloads/Publications/WAPP.pdf#page=37). Accessed 5 December 2016.
IRENA. (2015a) Renewable Power Generation Costs in 2014. Abu Dhabi: International Renewable Energy Agency.IRENA (2015b) Nicaragua Renewables Readiness Assessment. Abu Dhabi: International Renewable Energy Agency.
(http://www.irena.org/DocumentDownloads/Publications/IRENA_RRA_Nicaragua_ES_2015_EN.pdf). Accessed 5 December 2016.
Kouphokham, K. (2012) Overview of the Lao Power Development Program. Phnom Penh: 2nd EAS Energy Efficiency Conference. (http://www.eria.org/events/2.%20Mr.Khamso%20Kouphokham%20-%20Overview%20of%20the%20Lao%20Power%20Development%20Program.pdf). Accessed 3 December 2016.
Legros, G., Havet, I., Bruce, N. and Bonjour, S. (2009) The Energy Access Situation in Developing Countries. New York and Geneva: United Nations Development Programme (UNDP) and World Health Organisation (WHO).
Mahman, S. (2015) Energie Durable pour Tous (SE4ALL) Agenda d’Actions Bénin. Praia: ECREE. (http://www.ecreee.org/sites/default/files/events/presentation_se4all_action_agenda_benin.pdf). Accessed 3 December 2016.
MINAM (2010). Plan de Acción de Adaptación y Mitigación frente al Cambio Climático. Resolución Ministerial N° 238-2010-MINAM. El Peruano, 2 December 2010. Lima: Ministerio del Ambiente (http://www.bdlaw.com/assets/htmldocuments/Peru%20-%20RM_238-2010-minam1.pdf). Accessed 5 December 2016.
MINAM (2016). Plan Estratégico Sectorial Multianual del Sector Ambiental. Lima: Ministerio del Ambiente (http://www.minam.gob.pe/wp-content/uploads/2016/07/RM-N°-174-2016-MINAM.pdf). Accessed 5 December 2016.
Ministerio de Ambiente y Energia, Costa Rica. (2015) VII Plan Nacional de Energía 2015-20. San Jose: Ministerio de Ambiente y Energia and UNDP. (http://www.minae.go.cr/recursos/2015/pdf/VII-PNE.pdf). Accessed 3 December 2016.
Ministério da Energia, Mozambique. (nd) Estratégia de Desenvolvimento de Energias Novas e Renovaveis (EDENR) Para o Período de 2011 – 2025. Maputo: Ministério da Energia. (https://energypedia.info/images/f/fa/PT-Estrategias_de_Desenvolvimento_de_E._Novas_e_Renovaveis-Ministerio_da_Energia.pdf). Accessed 5 December 2016.
Ministerio de Energia y Minas, Nicaragua. (2016) Plan de Expansion de la Generacion Electrica de 2016-2030. Managua: Ministerio de Energia y Minas. (http://www.mem.gob.ni/media/file/PLAN%20DE%20EXPANSION/Plan_Indicativo_de_Expansion_de_la_Generacion_Electrica_.pdf). Accessed 3 December 2016.
Ministerio de Energía Y Minas, Peru. (nd) Plan Energético Nacional 2014-2025. San Borja: Ministerio de Energía Y Minas (http://www.minem.gob.pe/_publicacion.php?idSector=10&idPublicacion=489).
Ministerio de Minas y Energía, Colombia. (2006) Plan Energético Nacional 2006-2025: Contexto y Estrategias. Bogota: Ministerio de Minas y Energía. (http://www.upme.gov.co/Docs/PLAN_ENERGETICO_NACIONAL_2007.pdf). Accessed 5 December 2016.
Aligning objectives: international climate commttments and national energy strategies 27
Ministry of Energy, Green Technology and Water. (2008) National Renewable Energy Policy and Action Plan. Kuala Lumpur: Ministry of Energy, Green Technology and Water (http://seda.gov.my/go-home.php?omaneg=00010100000001010101000100001000000000000000000000&s=31). Accessed 9 December 2013.
Ministry of Energy, Green Technology and Water (KeTTHA). (2015) ‘Power Policy and National Development Plan, presentation’. Putrajaya: KeTTHA (http://www.eri.chula.ac.th/eri-main/wp-content/uploads/2015/11/S1-3_Ketta_v2_new.0.pdf)
Ministry of Energy and Mining, Jamaica. (2009) Jamaica’s National Energy Policy 2009-2030. Kingston: Ministry of Energy and Mining.
Ministry of Environment and Sustainable Development, Mauritius. (2013) Maurice Ile Durable: Policy, Strategy and Action Plan. Port Louis: Ministry of Environment and Sustainable Development. (http://www.govmu.org/portal/sites/mid/file/full%20report%20midpolicy.pdf). Accessed 4 December 2016.
Ministry of Power, Energy and Mineral Resources, Bangladesh. (2013) ‘Action Plan for Energy Efficiency and Conservation’. London: London School of Economics and Political Science.
Ministry of Power, Nigeria. (2015) National Renewable Energy and Energy Efficiency Policy (NREEEP). Abuja: Federal Republic of Nigeria. http://www.power.gov.ng/download/NREEE%20POLICY%202015-%20FEC%20APPROVED%20COPY.pdf Accessed 4 December 2016.
Ministry of Water and Power, Pakistan (2013) National Power Policy 2013. Islamabad: Ministry of Water and Power. (http://www.ppib.gov.pk/National%20Power%20Policy%202013.pdf). Accessed 3 December 2016.
Muzeya, L. (2015) Energy Policy in Zambia. GRIPS Policy Design and Implementation in Developing Countries, 24 July 2015. http://www.grips.ac.jp/teacher/oono/hp/course/student_slides/2015/lufunda_energy.pdf. Accessed 3 December 2016.
National Planning Commission, Nepal. (2015) Sustainable Development Goals 2016-2030: National (Preliminary) Report. Kathmandu: National Planning Commission. (http://www.npc.gov.np/images/download/23rd_Jan_final_for_print_Sustainable_Development_Goals.pdf). Accessed 3 December 2016.
National Planning Commission, Nigeria. (nd) Nigeria Vision 20:20. Abuja: National Planning Commission. (http://www.nationalplanning.gov.ng/images/docs/NationalPlans/nigeria-vision-20-20-20.pdf). Accessed 4 December 2016.
National Planning Department, Zambia. (2014) Revised Sixth National Development Plan 2013-2016. Lusaka: National Planning Department. http://www.gwp.org/Global/Activities/Impact%20Stories/Supporting%20documents/Revised%20Sixth%20National%20Development%20Plan.pdf. Accessed 5 December 2016.
National Transmission and Despatch Company Limited. (2011) National Power SystemExpansion Plan 2011 – 2030. Final Report, Annexure 2: Generation Planning, prepared by SNC-Lavalin. Lahore:
National Transmission and Despatch Company Limited.NDC. (2016) ‘NDC Registry’. Bonn: NDC (http://www4.unfccc.int/ndcregistry/Pages/Home.aspx).NgouBou, L. (2013) Rapport national. Brazzaville: Ministère de l’Energie et de l’Hydraulique. Nigeria Vision 2020 Program. (2009) Report of the Vision 2020 National Technical Working Group On Energy
Sector. Abuja: Nigeria Vision 2020 Program. (http://www.nationalplanning.gov.ng/images/docs/NationalPlans/energyntwgreport.pdf). Accessed 4 December 2016.
Northrop, E., Biru, H., Lima, S., Bouye, M. and Song R. (2016) Examining the Alignment Between the Intended Nationally Determined Contributions and Sustainable Development Goals. Washington D.C.: World Resources Institute (http://www.wri.org/sites/default/files/WRI_INDCs_v5.pdf).
Pickard, S. and Granoff, I. (2015) Can carbon capture and storage justify new coal-fired electricity? Briefing. London: Overseas Development Institute (ODI).
Planning Commission. (2007) Pakistan in the 21st Century: Vision 2030. Islamabad: Planning Commission, Government of Pakistan.
Prime Minister’s Department, Malaysia. (2010) Tenth Malaysia Plan 2011-2015. Kuala Lumpur: Prime Minister’s Department. (http://onlineapps.epu.gov.my/rmke10/img/pdf/en/foreword.pdf). Accessed 5 December 2016.
Republic of Mauritius. (2011) Energy Efficiency Act 2011, Act 3/2011. Port Louis: Republic of Mauritius. (http://publicutilities.govmu.org/English/Legislation/Documents/Energy%20Efficiency%20Act%202011.pdf). Accessed 4 December 2016.
Republic of Mauritius (2014) Energy Strategy 2011 – 2025: Action Plan Update. Port Louis: Republic of Mauritius. (http://publicutilities.govmu.org/English/publications/Documents/Updated%20Action%20Plan%20of%20the%20Energy%20Strategy%202011%20-2025.PDF). Accessed 4 December 2016.
Republic of Senegal. (2014) Plan Senegal Emergent. Dakar: Republic of Senegal.(http://www.gouv.sn/IMG/pdf/PSE.pdf) Accessed 6 December 2016.Roberts, D. (2015) ‘The International Energy Agency consistently underestimates wind and solar power. Why?’ New
York: Vox (http://www.vox.com/2015/10/12/9510879/iea-underestimate-renewables).Secretaria de Planejamento e Desenvolvimento Energético, Brazil. (2015) Plano Decenal de Expansão de Energia 2024.
Brasilia: Ministério de Minas e Energia. (http://www.epe.gov.br/PDEE/Relat%C3%B3rio%20Final%20do%20PDE%202024.pdf). Accessed 3 December 2016.

28 ODI Insights
Scott, A. and Lucci, P. (2015) ‘Universality and Ambition in the Post-2015 Development Agenda: A Comparison of Global and National Targets’, Journal of International Development 27(6): 752–775.
SE4All. (2015) Progress Toward Sustainable Energy 2015. Global Tracking Framework Report. Vienna and Paris: Sustainable Energy for All (SE4All) and International Energy Agency.
SE4ALL (nd) Nigerian Sustainable Energy for All (SE4ALL) Action Agenda Energy Mix Chart. Abuja: Ministry of Power and UNDP. (http://www.power.gov.ng/Press%20Release/ENERGY%20MIX%20CHART.pdf). Accessed 3 December 2016.
Siliya, D. (2015) Ministerial Statement on the Power Deficit. Lusaka: Ministry of Energy and Water Development, Zambia. http://www.parliament.gov.zm/sites/default/files/images/publication_docs/Ministerial%20Statement%20on%20Power%20Deficit%20Final.pdf. Accessed 3 December 2016.
Stephan, B., Schurig, S. and Leidreiter, A. (2016) What Place for Renewables in the INDCs? Hamburg: World Future Council.
Tamang, J. (2013) Philippine Energy Sector Plans and Programs 2013-2030. Pasay City: National Government-Local Government Joint Energy Forum. http://ppei.dilg.gov.ph/sites/default/files/1.%20Phil%20Energy%20Sector%20Plans%20and%20Programs_1.pdf. Accessed 3 December 2016.
Tettey, G. (nd) Sustainable Energy for All (SE4ALL) Action Agenda for Ghana. Praia: ECREEE. (http://www.ecreee.org/sites/default/files/events/sustainable_energy_action_plan_ghana.pdf). Accessed 3 December 2016.
UNEP (2016) The Emissions Gap Report 2016: A UNEP Synthesis Report. Nairobi: UNEP.UNEP DTU (2016) Ghana’s Low Carbon Development Strategy (LCDS): Facilitating Implementation and Readiness for
Mitigation (FIRM). Accra: Ministry of Environment, Science, Technology and Innovation. Unidad de Planeación Minero Energética, Colombia. (2015) Plan de Expansión de Referencia Generación – Transmissión
2015-2029. Bogota: Ministerio de Minas y Energía. (http://www.upme.gov.co/Docs/Plan_Expansion/2016/Plan_Expansion_GT_2015-2029/Plan_GT_2015-2029_VF_22-12-2015.pdf). Accessed 3 December 2016.
United Republic of Tanzania, Ministry of Energy and Minerals. (2015) Tanzania’s SE4All Action Agenda. Dar es Salaam: Ministry of Energy and Minerals (http://www.se4all.org/sites/default/files/TANZANIA_AA-Final.pdf).
Vallejo, C. (2014) 2010-2030 Energy Forecast for the Dominican Republic, Cross Border Transactions, 15 May 2014. Various locations: Manatt. (https://www.manatt.com/insights/newsletters/cross-border-transactions/dominican-republic-%E2%80%93-2010-2030-energy-forecast-for). Accessed 3 December 2016.
World Bank. (2016) ‘Intended Nationally Determined Contributions (INDCs)’. Washington D.C.: World Bank (http://spappssecext.worldbank.org/sites/indc/Pages/INDCHome.aspx).
World Bank. (2016) ‘World Bank Country and Lending Groups’. Washington D.C.: World Bank (https://datahelpdesk.worldbank.org/knowledgebase/articles/906519-world-bank-country-and-lending-groups).
World Resources Institute. (2016) ‘CAIT Climate Data Explorer’. Washington D.C: World Resources Institute (http://www.wri.org/our-work/project/cait-climate-data-explorer).
Yeo, S. (2015) ‘Analysis: Brazil’s climate pledge represents slight increase on current emissions’. Paris: Carbon Brief (http://www.carbonbrief.org/analysis-brazils-climate-pledge-represents-slight-increase-on-current-emissions).
Worldwatch Institute (2016) Jamaica’s Electricity Mix in 2030: The Role of Renewables and Natural Gas. Washington: Worldwatch Institute. (http://www.worldwatch.org/jamaica%E2%80%99s-electricity-mix-2030-role-renewables-and-natural-gas). Accessed 3 December 2016.
Coun
try
Inco
me
grou
p (W
orld
Ba
nk C
ount
ry a
nd
Lend
ing
Grou
ps)
GDP
per
Capi
ta
(PPP
) (20
13)
(cur
rent
in
tern
atio
nal
$) -
WDI
, 20
16
Popu
latio
n w
ithou
t el
ectr
icity
(m
illio
ns)
(201
3) -
WEO
, 20
15
Popu
latio
n re
lyin
g on
tr
aditi
onal
us
e of
bi
omas
s (m
illio
ns)
(201
3) -
WEO
, 20
15
Ener
gy
impo
rts,
net
(%
of e
nerg
y us
e) (2
013)
- W
DI, 2
016
Ener
gy
inte
nsity
(T
PES/
GDP)
(to
e/$1
000
2005
USD
) (2
013)
- IE
A,
2013
Rene
wab
le
ener
gy
cons
umpt
ion
(% o
f tot
al
final
ene
rgy
cons
umpt
ion)
(2
012)
- W
DI,
2016
Rene
wab
le
elec
tric
ity
outp
ut (%
of
tota
l el
ectr
icity
ou
tput
) (2
012)
- W
DI,
2016
% s
hare
of
glob
al G
HG
emis
sion
s (in
clud
ing
land
use
ch
ange
and
fo
rest
ry)
(201
2) -
WRI
CA
IT
Bang
lade
shLo
wer
-mid
dle-
inco
me
2843
.24
6014
017
.94
0.35
38.3
01.
580.
399
Beni
nLo
w-in
com
e19
31.9
37.
39.
70.
450.
67
50.5
70.
610.
046
Braz
ilUp
per-
mid
dle-
inco
me
1581
6.80
110
13.8
80.
2543
.63
82.4
73.
830
Cape
Ver
deLo
wer
-mid
dle-
inco
me
6344
.34
00.
2..
....
0.00
0.00
1
Colo
mbi
aUp
per-
mid
dle-
inco
me
1272
7.10
17
-296
.71
0.15
26.2
779
.55
0.42
0
Cong
o DR
Low
-inco
me
696.
9861
.464
-0.0
21.
09
95.9
699
.56
0.03
7
Cong
o R
Low
er-m
iddl
e-in
com
e59
50.4
72.
63.
3-5
.13
0.28
48
.19
61.1
80.
423
Cost
a Ri
caUp
per-
mid
dle-
inco
me
1438
6.90
00
49.0
50.
1738
.62
91.8
40.
010
Dom
inic
an R
epub
licUp
per-
mid
dle-
inco
me
1234
7.82
01
86.3
90.
1513
.19
10.6
90.
066
Ethi
opia
Low
-inco
me
1376
.96
71.2
89.1
0.05
1.73
93
.49
99.4
00.
302
Ghan
aLo
wer
-mid
dle-
inco
me
3968
.06
7.3
21.4
-0.0
70.
45
49.4
967
.12
0.12
4
Indi
aLo
wer
-mid
dle-
inco
me
5089
.58
237
841
31.7
60.
5238
.99
15.6
26.
065
Indo
nesi
aLo
wer
-mid
dle-
inco
me
9672
.60
....
-107
.80
0.47
37.0
611
.43
4.16
2
Jam
aica
Uppe
r-m
iddl
e-in
com
e87
25.1
70
082
.54
0.27
14.6
68.
790.
020
Lao
PDR
Low
er-m
iddl
e-in
com
e47
99.8
31
4..
....
0.00
0.07
6
Mal
aysi
aUp
per-
mid
dle-
inco
me
2341
8.83
00
-12.
320.
436.
807.
380.
910
Mau
ritiu
sUp
per-
mid
dle-
inco
me
1774
8.17
00
0.84
0.16
..
00.
012
Mex
ico
Uppe
r-m
iddl
e-in
com
e16
248.
80..
..-1
3.19
0.18
9.35
15.0
31.
573
Moz
ambi
que
Low
-inco
me
1069
.50
15.7
24.8
-0.5
4
0
.96
88.4
499
.86
0.12
1
Nepa
lLo
w-in
com
e21
75.6
47
2215
.73
0.91
84.7
299
.47
0.08
5

Aligning objectives: international climate commttments and national energy strategies 29
Coun
try
Inco
me
grou
p (W
orld
Ba
nk C
ount
ry a
nd
Lend
ing
Grou
ps)
GDP
per
Capi
ta
(PPP
) (20
13)
(cur
rent
in
tern
atio
nal
$) -
WDI
, 20
16
Popu
latio
n w
ithou
t el
ectr
icity
(m
illio
ns)
(201
3) -
WEO
, 20
15
Popu
latio
n re
lyin
g on
tr
aditi
onal
us
e of
bi
omas
s (m
illio
ns)
(201
3) -
WEO
, 20
15
Ener
gy
impo
rts,
net
(%
of e
nerg
y us
e) (2
013)
- W
DI, 2
016
Ener
gy
inte
nsity
(T
PES/
GDP)
(to
e/$1
000
2005
USD
) (2
013)
- IE
A,
2013
Rene
wab
le
ener
gy
cons
umpt
ion
(% o
f tot
al
final
ene
rgy
cons
umpt
ion)
(2
012)
- W
DI,
2016
Rene
wab
le
elec
tric
ity
outp
ut (%
of
tota
l el
ectr
icity
ou
tput
) (2
012)
- W
DI,
2016
% s
hare
of
glob
al G
HG
emis
sion
s (in
clud
ing
land
use
ch
ange
and
fo
rest
ry)
(201
2) -
WRI
CA
IT
Bang
lade
shLo
wer
-mid
dle-
inco
me
2843
.24
6014
017
.94
0.35
38.3
01.
580.
399
Beni
nLo
w-in
com
e19
31.9
37.
39.
70.
450.
67
50.5
70.
610.
046
Braz
ilUp
per-
mid
dle-
inco
me
1581
6.80
110
13.8
80.
2543
.63
82.4
73.
830
Cape
Ver
deLo
wer
-mid
dle-
inco
me
6344
.34
00.
2..
....
0.00
0.00
1
Colo
mbi
aUp
per-
mid
dle-
inco
me
1272
7.10
17
-296
.71
0.15
26.2
779
.55
0.42
0
Cong
o DR
Low
-inco
me
696.
9861
.464
-0.0
21.
09
95.9
699
.56
0.03
7
Cong
o R
Low
er-m
iddl
e-in
com
e59
50.4
72.
63.
3-5
.13
0.28
48
.19
61.1
80.
423
Cost
a Ri
caUp
per-
mid
dle-
inco
me
1438
6.90
00
49.0
50.
1738
.62
91.8
40.
010
Dom
inic
an R
epub
licUp
per-
mid
dle-
inco
me
1234
7.82
01
86.3
90.
1513
.19
10.6
90.
066
Ethi
opia
Low
-inco
me
1376
.96
71.2
89.1
0.05
1.73
93
.49
99.4
00.
302
Ghan
aLo
wer
-mid
dle-
inco
me
3968
.06
7.3
21.4
-0.0
70.
45
49.4
967
.12
0.12
4
Indi
aLo
wer
-mid
dle-
inco
me
5089
.58
237
841
31.7
60.
5238
.99
15.6
26.
065
Indo
nesi
aLo
wer
-mid
dle-
inco
me
9672
.60
....
-107
.80
0.47
37.0
611
.43
4.16
2
Jam
aica
Uppe
r-m
iddl
e-in
com
e87
25.1
70
082
.54
0.27
14.6
68.
790.
020
Lao
PDR
Low
er-m
iddl
e-in
com
e47
99.8
31
4..
....
0.00
0.07
6
Mal
aysi
aUp
per-
mid
dle-
inco
me
2341
8.83
00
-12.
320.
436.
807.
380.
910
Mau
ritiu
sUp
per-
mid
dle-
inco
me
1774
8.17
00
0.84
0.16
..
00.
012
Mex
ico
Uppe
r-m
iddl
e-in
com
e16
248.
80..
..-1
3.19
0.18
9.35
15.0
31.
573
Moz
ambi
que
Low
-inco
me
1069
.50
15.7
24.8
-0.5
4
0
.96
88.4
499
.86
0.12
1
Nepa
lLo
w-in
com
e21
75.6
47
2215
.73
0.91
84.7
299
.47
0.08
5
Annex: Key indicators for selected countries

30 ODI Insights
Coun
try
Inco
me
grou
p (W
orld
Ba
nk C
ount
ry a
nd
Lend
ing
Grou
ps)
GDP
per
Capi
ta
(PPP
) (20
13)
(cur
rent
in
tern
atio
nal
$) -
WDI
, 20
16
Popu
latio
n w
ithou
t el
ectr
icity
(m
illio
ns)
(201
3) -
WEO
, 20
15
Popu
latio
n re
lyin
g on
tr
aditi
onal
us
e of
bi
omas
s (m
illio
ns)
(201
3) -
WEO
, 20
15
Ener
gy
impo
rts,
net
(%
of e
nerg
y us
e) (2
013)
- W
DI, 2
016
Ener
gy
inte
nsity
(T
PES/
GDP)
(to
e/$1
000
2005
USD
) (2
013)
- IE
A,
2013
Rene
wab
le
ener
gy
cons
umpt
ion
(% o
f tot
al
final
ene
rgy
cons
umpt
ion)
(2
012)
- W
DI,
2016
Rene
wab
le
elec
tric
ity
outp
ut (%
of
tota
l el
ectr
icity
ou
tput
) (2
012)
- W
DI,
2016
% s
hare
of
glob
al G
HG
emis
sion
s (in
clud
ing
land
use
ch
ange
and
fo
rest
ry)
(201
2) -
WRI
CA
IT
Nica
ragu
aLo
wer
-mid
dle-
inco
me
4713
.09
13
39.7
20.
4253
.12
42.8
20.
085
Nige
riaLo
wer
-mid
dle-
inco
me
5638
.55
95.5
122.
1-0
.91
0.7
3 86
.47
19.7
10.
998
Paki
stan
Low
er-m
iddl
e-in
com
e10
241.
6950
105
23.0
50.
645
.49
31.0
60.
718
Peru
Uppe
r-m
iddl
e-in
com
e11
730.
703
10-0
.20
0.17
28.2
555
.23
0.33
5
Philip
pine
sLo
wer
-mid
dle-
inco
me
6365
.00
2153
41.5
30.
2929
.40
28.4
40.
331
Sene
gal
Low
-inco
me
2267
.83
6.4
8.6
0.51
0.33
51
.36
9.83
0.05
9
Sout
h Af
rica
Uppe
r-m
iddl
e-in
com
e12
881.
947.
75.
6-0
.17
0.44
16
.93
0.96
0.97
4
Tanz
ania
Low
-inco
me
2417
.77
37.4
47.2
0.11
1.01
88
.17
29.1
50.
361
Vene
zuel
a RB
Uppe
r-m
iddl
e-in
com
e18
309.
150
1-1
79.4
30.
3511
.20
64.8
20.
834
Zam
bia
Low
er-m
iddl
e-in
com
e17
43.2
18.
510
12.3
1.68
75.6
059
.97
0.13
2
31 ODI Insights
Read more ODI Insights at odi.org/insights
ODI is the UK’s leading independent think tank on international development and humanitarian issues.
The opinions expressed herein are the authors’ and do not necessarily reflect those of ODI. © Overseas Development Institute 2016. Creative Commons CC BY-NC 4.0.
Overseas Development Institute 203 Blackfriars Road London SE1 8NJ United Kingdom
Tel. +44 (0) 20 7922 0300 odi.org @odidev
This material has been funded by UK aid from the UK Government, however the views expressed do not necessarily re�ect the UK Government’s of�cial policies.