Alicorp S.A.A. -...
10
CORPORATES CREDIT OPINION 31 May 2018 Update RATINGS Alicorp S.A.A. Domicile Peru Long Term Rating Baa3 Type Senior Unsecured - Fgn Curr Outlook Stable Please see the ratings section at the end of this report for more information. The ratings and outlook shown reflect information as of the publication date. Analyst Contacts Alonso Sanchez 52-55-1253-5706 VP-Senior Analyst [email protected] Marianna Waltz, CFA 55-11-3043-7309 MD-Corporate Finance [email protected] CLIENT SERVICES Americas 1-212-553-1653 Asia Pacific 852-3551-3077 Japan 81-3-5408-4100 EMEA 44-20-7772-5454 Alicorp S.A.A. Update to credit analysis - First quarter 2018 Summary Alicorp’s rating is supported by its leading market position in Peru in key product categories, its high profitability and strong credit metrics; and its extensive and hard to replicate distribution network. The rating also reflects its broad product portfolio, and its experienced management team with a successful track record of completing acquisitions. The rating considers the company's small size compared to global industry peers, its limited geographic diversity given its concentration in Peru and certain Latin American markets with weak economies, and its exposure to commodity price volatility. Exhibit 1 EBITDA and EBITDA margin have improved steady since 2014. 752 497 781 814 943 974 12.9% 7.9% 11.9% 12.3% 13.3% 13.4% 2.0% 4.0% 6.0% 8.0% 10.0% 12.0% 14.0% 16.0% 18.0% 20.0% 0 200 400 600 800 1,000 1,200 2013 2014 2015 2016 2017 LTM 03/18 EBITDA - As Adj EBITDA Margin % All ratios are based on 'Adjusted' financial data and incorporate Moody's Global Standard Adjustments for Non-Financial Corporations. Source: Moody's Financial Metrics™ Credit Strengths » High profitability despite smaller size when compared to global industry peers » Leading market position in Peru, its largest market, with extensive and difficult to replicate distribution network » Good product diversification Credit Challenges » Modest geographic diversification » Exposure to some weak economies in Latin America » Event risk from M&A transactions
Transcript of Alicorp S.A.A. -...

CORPORATES
CREDIT OPINION31 May 2018
Update
RATINGS
Alicorp S.A.A.Domicile Peru
Long Term Rating Baa3
Type Senior Unsecured - FgnCurr
Outlook Stable
Please see the ratings section at the end of this reportfor more information. The ratings and outlook shownreflect information as of the publication date.
Analyst Contacts
Alonso Sanchez 52-55-1253-5706VP-Senior [email protected]
Marianna Waltz, CFA 55-11-3043-7309MD-Corporate [email protected]
CLIENT SERVICES
Americas 1-212-553-1653
Asia Pacific 852-3551-3077
Japan 81-3-5408-4100
EMEA 44-20-7772-5454
Alicorp S.A.A.Update to credit analysis - First quarter 2018
SummaryAlicorp’s rating is supported by its leading market position in Peru in key product categories,its high profitability and strong credit metrics; and its extensive and hard to replicatedistribution network. The rating also reflects its broad product portfolio, and its experiencedmanagement team with a successful track record of completing acquisitions. The ratingconsiders the company's small size compared to global industry peers, its limited geographicdiversity given its concentration in Peru and certain Latin American markets with weakeconomies, and its exposure to commodity price volatility.
Exhibit 1
EBITDA and EBITDA margin have improved steady since 2014.
752
497
781 814
943 974
12.9%
7.9%
11.9% 12.3%13.3% 13.4%
2.0%
4.0%
6.0%
8.0%
10.0%
12.0%
14.0%
16.0%
18.0%
20.0%
0
200
400
600
800
1,000
1,200
2013 2014 2015 2016 2017 LTM 03/18
EBITDA - As Adj EBITDA Margin %
All ratios are based on 'Adjusted' financial data and incorporate Moody's Global Standard Adjustments for Non-FinancialCorporations.Source: Moody's Financial Metrics™
Credit Strengths
» High profitability despite smaller size when compared to global industry peers
» Leading market position in Peru, its largest market, with extensive and difficult toreplicate distribution network
» Good product diversification
Credit Challenges
» Modest geographic diversification
» Exposure to some weak economies in Latin America
» Event risk from M&A transactions

MOODY'S INVESTORS SERVICE CORPORATES
Rating OutlookAlicorp's stable outlook reflects our expectation that the company's operating performance and credit metrics will continue to bestrong.
Factors that Could Lead to an UpgradeAn upgrade could be triggered if the company's adj. debt/EBITDA is below 2.5 times and adj. EBIT/Interest Expense is above 5 times ona sustained basis. To be considered for an upgrade the company should maintain strong liquidity and positive free cash flow.
Factors that Could Lead to a DowngradeA downgrade could be triggered if the company's debt/EBITDA remains above 3.5 times or if EBIT/Interest Expense declines below 3.5times. A deterioration in liquidity or operating performance, increased payouts to shareholders, large debt financed acquisitions, orintegration challenges, could also lead to a downgrade.
Key Indicators
Exhibit 2
Alicorp, S.A.A.
US Millions Dec-13 Dec-14 Dec-15 Dec-16 Dec-17
LTM
(Mar-18) Dec-18 (f) Dec-19 (f)
Revenue 2,155.8 2,214.3 2,069.1 1,964.4 2,178.2 2,234.5 2,536.0 2,900.0
EBIT Margin % 11.0% 5.8% 9.3% 9.7% 11.0% 11.2% 7.5% 7.9%
Debt / EBITDA 2.7x 5.5x 2.7x 2.0x 2.1x 1.9x 3.2x 2.7x
RCF / Net Debt 16.3% -2.0% 11.3% 22.8% 51.5% 52.4% 20.2% 21.5%
EBIT / Interest Expense 4.2x 2.0x 3.0x 4.8x 7.5x 7.8x 3.8x 4.5x
[1] All figures and ratios are calculated using Moody's estimates and standard adjustments. Moody's Forecasts (f) or Projections (proj.) are Moody's opinion and no not represent the viewsof the issuer. Periods are Financial Year-End unless indicated. LTM + Last Twelve Months.Source: Moody's Financial Metrics™
Corporate ProfileAlicorp, S.A.A., headquartered in Lima, is a Peruvian manufacturer and distributor of consumer goods (food, home & personal careproducts), business-to-business (B2B) branded products (bakeries, industrial products and food service) and aquaculture (shrimp andfish feed) with a total of 105 brands.
Alicorp has operations in Peru, Ecuador, Argentina, Chile, and Brazil and exports to 13 countries. Alicorp is public company and ismajority owned and controlled by Grupo Romero (45.8% stake), one of the largest conglomerates in Peru. The balance is owned bypension funds (26.4%), mutual funds (16.9%) and others (10.9%). Alicorp reported revenues of PEN7,106 million over the twelvemonths ended March 31, 2018.
This publication does not announce a credit rating action. For any credit ratings referenced in this publication, please see the ratings tab on the issuer/entity page onwww.moodys.com for the most updated credit rating action information and rating history.
2 31 May 2018 Alicorp S.A.A.: Update to credit analysis - First quarter 2018

MOODY'S INVESTORS SERVICE CORPORATES
Exhibit 3
Alicorp's revenue breakdown by business lineLTM 1Q18
Exhibit 4
Alicorp's EBITDA breakdown by business lineLTM 1Q18
Consumer goods Peru37%
Consumer goods International 15%
B2B branded products 22%
Aquaculture26%
Source: Alicorp's corporate presentation, May 2018
Consumer goods Peru54%
B2B branded products 17%
Aquaculture29%
Source: Alicorp's corporate presentation, May 2018
Detailed Credit ConsiderationsLEADING MARKET POSITION IN PERU AND AMPLE DISTRIBUTION NETWORK
Alicorp has a leading market position in Peru in its key product categories that include industrial baking flour, industrial oils, edible oils,laundry detergents, pasta, cookies & crackers, shortenings, and mayonnaise, among others. In its international business, it also has astrong market position (ranking mostly #2 or #3) in product categories such as pasta, hair care, laundry detergents, personal care soap,and cereal. Despite competing with large multinational companies and with local enterprises, Alicorp has been able to maintain itsmarket leadership due to its: broad product portfolio targeting all socioeconomic segments; product innovation capacity; extensivedistribution network; and strong brand recognition.
The company has 105 brands including premium, mainstream, and value segmentation which allows it to reach a broader customerbase with differentiated pricing strategy. In Peru, the company has leading market positions in several product categories that accountfor around 54% of consolidated EBITDA. In Brazil, Argentina, Bolivia and Ecuador, the company has strong market shares in someproduct categories, ranking between #1 to #3 positions.
Alicorp’s countrywide distribution network in Peru is a credit strength. In Peru, the company sells its products through the traditional(83%) and modern (17%) channels. Alicorp sells to 3rd. party exclusive distributors (48%), wholesalers (25%), to non-exclusivedistributors (10%), and directly to supermarkets (17%). In Chile, Brazil, and Ecuador the company has key regions coverage through 3rd.party distributors while in Argentina it operates through a proprietary distribution network.
Alicorp benefits from economic growth and modest inflation that supports consumption in Peru. We estimate Peruvian GDP to growby 3.5% in 2018 and 2019 with inflation around 1.7% in 2018 and 2019. As a result, private consumption will grow by 3.4% in 2018and 4.1% in 2019.
AMPLE PRODUCT PORTFOLIO WITH GEOGRAPHIC DIVERSIFICATION
Alicorp´s products are sold under three different lines of business, which have different market dynamics: consumer goods (54% ofconsolidated EBITDA), B2B branded products (17% of consolidated EBITDA), and aquaculture (29% of consolidated EBITDA). Its largestbusiness segment, consumer goods is divided into two categories: food and home & personal care products, representing 65% and35% of this business segment revenues respectively.
Alicorp's diversification by product is high with each single product category representing less than 19% of consolidated EBITDA. Inconsumer goods in Peru, the largest category is laundry detergents with four leading brands and a 19% contribution to consolidatedEBITDA. Edible oils contribute with 9% to consolidated EBITDA and pasta with 6%. While in B2B, industrial oil accounts for 8% ofEBITDA.
3 31 May 2018 Alicorp S.A.A.: Update to credit analysis - First quarter 2018

MOODY'S INVESTORS SERVICE CORPORATES
Profitability of Alicorp's business segments have increased since 2015. EBITDA margin of consumer goods, the largest contributor torevenue, has grown to 13.8% over the twelve months ended March 31, 2018 from 12.6% in 2015. Similarly, aquaculture's EBITDAmargin increased to 14.7% over the twelve months ended March 31, 2018; up from 13.5% in 2015. Finally, the B2B segment postedan EBITDA margin of 10.9% over the twelve months ended March 31, 2018, which compares strongly with the 7.3% EBITDA margin in2015. These improvements are the result of Alicorp's cost saving programs, operating improvement such as plant automatization andconsolidation, as well as launching or acquiring new products with high margins and leading positions. Going forward, we expect thecompany to benefit from these strategies.
Exhibit 5
Revenues by businessExhibit 6
EBITDA margin by business
56% 56% 54% 52%54%
22% 23% 22% 22%
21%
22% 21%24% 26%
25%
6,580 6,629 7,101 7,106
7,749
2015 2016 2017 LTM 3/18 2018F
Consumer goods products B2B branded products Aquaculture
Alicorp's revenue guidance FY2018 by business.Source: Alicorp's Corporate Presentation May 2018 and earnings releases.
13.5%
12.7%
14.8% 14.7%
7.3%
9.7%
8.9%
10.9%
12.6%12.9%
13.2%13.8%
11.0%
12.1%
12.7%13.0%
6.0%
7.0%
8.0%
9.0%
10.0%
11.0%
12.0%
13.0%
14.0%
15.0%
16.0%
2015 2016 2017 LTM 3/18
Aquaculture B2B branded products
Consumer goods products Consolidated
EBITDA margin calculated by the company.Source: Alicorp's Corporate Presentation May 2018 and earnings releases.
Alicorp has expanded its international operations over the last few years, but Peru remains its largest market accounting for 61% ofconsolidated revenues. Alicorp has track record completing acquisitions. Since 2012, the company has successfully closed 7 M&Atransactions of local and international companies. Despite the beneficial effects from increased geographic diversification, thepresence in weaker economies such as Ecuador (B3 stable), Argentina (B2 stable) or Brazil (Ba2 stable) exposes Alicorp to inflationaryenvironments and foreign exchange volatility.
ACQUISITIONS IN BOLIVIA STRENGTHENS ALICORP'S INTERNATIONAL OPERATION
In May 2018, Alicorp announced it acquired 100% shares of Industrias del Aceite S.A. (FINO) and that it has already received approvalto acquire ADM-SAO (ADM) in Bolivia. We estimate Alicorp will pay between $390-$420 million for these acquisitions (purchase priceof FINO was $293 million) and will finance the transaction with cash on hand and the proceeds of a 4-year $400 million club dealloan.
We view the transaction as a credit positive as it increases Alicorp’s operation in Bolivia and strengthens its presence in the consumergoods and business-to-business (B2B) segments. Moody’s views these acquisitions to be in line with Alicorp’s business strategy asit will: (i) incorporate new leading brands to its product portfolio; (ii) add new product categories; and (iii) obtain cost benefits byincreasing its vertical integration in Bolivia.
These transactions strengthen Alicorp´s position in Bolivia (Ba3 stable) by adding a leading consumer products company, increasingits portfolio in key categories including edible oils, margarines, spreads, cooking fats and home care, and strengthening its verticalintegration. According to Euromonitor, edible oils sales will grow at 3.2% CAGR in Bolivia in 2017-2022 while spreads will grow at a3.4% CAGR in the same period of time. Currently, Alicorp’s presence in Bolivia covers certain products such as detergent, laundry soap,pasta, hair care and cereal which sales account for less than 1% of consolidated revenues. Nevertheless, pro-forma for the acquisition,Bolivia will become the second largest market for Alicorp and will contribute with 17.5% to its consolidated revenues and 13.5% ofconsolidated EBITDA.
4 31 May 2018 Alicorp S.A.A.: Update to credit analysis - First quarter 2018

MOODY'S INVESTORS SERVICE CORPORATES
Moody’s estimates Bolivia economy will grow 4% in 2018 and in 2019. With this transaction, Alicorp will acquire the largestdistribution network in Bolivia with around 25,000 points of sale, out of which 62% is in the traditional channel, 13% in the B2B, and7% through the modern channel. Alicorp’s expertise with a similar distribution model in Peru will allow the company to successfullyoperate this network in Bolivia. In addition, Alicorp will add to its operation the largest grain crushing installed capacity in Bolivia (4,770MT/day).
Exhibit 7
Alicorp's 2017 sales by countryExhibit 8
Alicorp's acquisitions increases materially revenue contribution ofBoliviaPro-forma for Bolivian acquisitions
Peru61.0%Ecuador
14.1%
Brazil 6.8%
Argentina6.7%
Bolivia 0.7%
Others10.7%
Source: Alicorp's Investors Presentation, January 2018.
Peru50.7%
Ecuador 11.7%
Brazil 5.7%
Argentina5.5%
Bolivia 17.5%
Others8.9%
Source: Alicorp's Investors Presentation, January 2018.
Exhibit 9
Alicorp's 2017 sales by segmentExhibit 10
Alicorp's pro-forma sales by segment.
Consumer Products54%
Aquaculture24%
B2B22%
Source: Alicorp's Investors Presentation, January 2018.
Consumer Products51%
Aquaculture20%
B2B18%
Crushing11%
Source: Alicorp's Investors Presentation, January 2018.
LEVERAGE WILL INCREASE BUT WILL REMAIN ADEQUATE FOR THE RATING CATEGORY
The acquisition of Fino and ADM in Bolivia will add $400 million in long-term debt to Alicorp’s balance sheet. We estimate pro-formaadj. debt/EBITDA will increase to around 3.0-3.2 times. While higher than its actual level of 1.9 times over the twelve months endedMarch 31, 2018, pro-forma leverage will be still below our downgrade trigger. We estimate Alicorp will be able to reduce adj. debt/EBITDA below 3 times by year-end 2019 from higher EBITDA generation.
The company has increased its profitability over the last three years through operating efficiencies and improvement in its cashconversion cycle. EBITDA margin, as adjusted by Moody’s, has improved to 13.4% in the twelve months ended March 31, 2018 from7.9% in 2014. Alicorp's adj. EBITDA/Interest expense will decline to just over 6 times in 2018 when compared to 9.4 times over thetwelve months ended March 31, 2018.
5 31 May 2018 Alicorp S.A.A.: Update to credit analysis - First quarter 2018
MOODY'S INVESTORS SERVICE CORPORATES
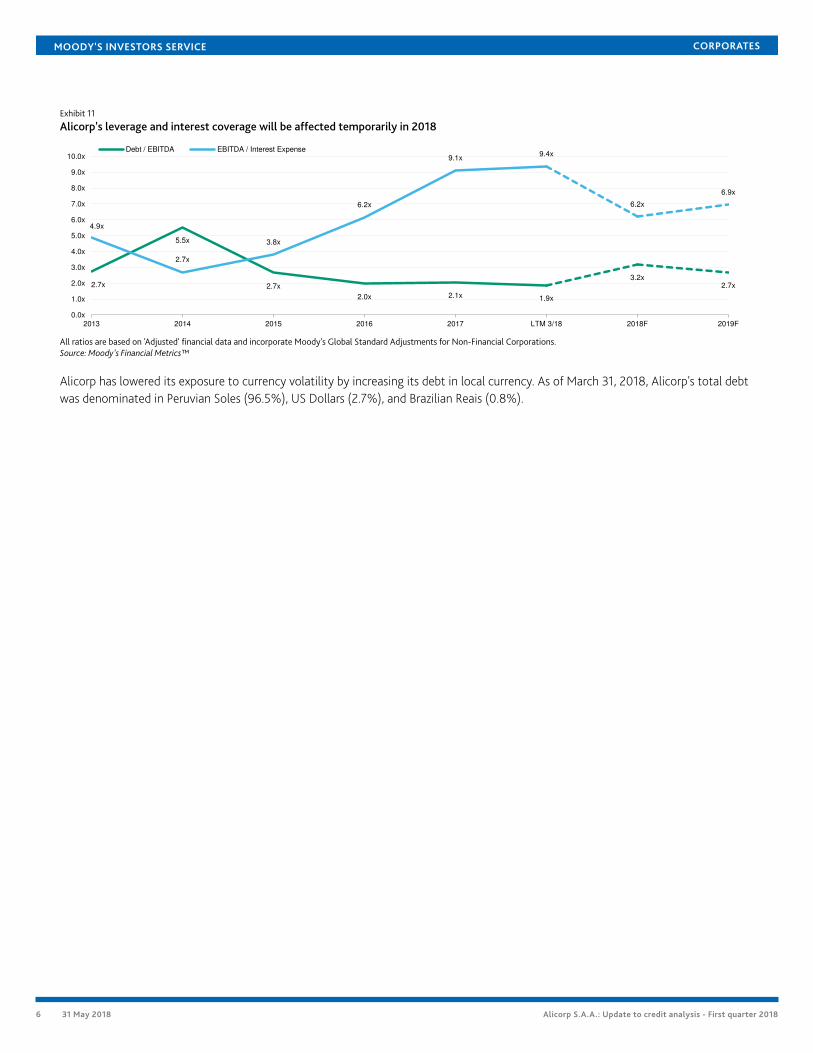
Exhibit 11
Alicorp's leverage and interest coverage will be affected temporarily in 2018
2.7x
5.5x
2.7x
2.0x 2.1x 1.9x
3.2x2.7x
4.9x
2.7x
3.8x
6.2x
9.1x9.4x
6.2x
6.9x
0.0x
1.0x
2.0x
3.0x
4.0x
5.0x
6.0x
7.0x
8.0x
9.0x
10.0x
2013 2014 2015 2016 2017 LTM 3/18 2018F 2019F
Debt / EBITDA EBITDA / Interest Expense
All ratios are based on 'Adjusted' financial data and incorporate Moody's Global Standard Adjustments for Non-Financial Corporations.Source: Moody's Financial Metrics™
Alicorp has lowered its exposure to currency volatility by increasing its debt in local currency. As of March 31, 2018, Alicorp's total debtwas denominated in Peruvian Soles (96.5%), US Dollars (2.7%), and Brazilian Reais (0.8%).
6 31 May 2018 Alicorp S.A.A.: Update to credit analysis - First quarter 2018

MOODY'S INVESTORS SERVICE CORPORATES
Liquidity AnalysisAlicorp has adequate liquidity. As of March 31, 2018 the company had a cash position of PEN964 million ($331 million) that can cover1.2x its short-term debt. Its liquidity position is further supported by its strong free cash flow generation which has been positive over2015-2017 at an average of $200 million per year. In addition, the company has revolving uncommitted credit facilities to fund itsworking capital requirements totaling $988 million (70% available). Alicorp does not have committed credit facilities as it is not astandard practice in Peru. Alicorp’s long-term debt amortization includes PEN867 million due 2018, PEN97 million due 2019, PEN7million due 2020, PEN360 million due 2023, and PEN500 million due in 2025-2030.
Rating Methodology and Scorecard Factors
Exhibit 12
Rating FactorsAlicorp, S.A.A.
Consumer Packaged Goods Industry Grid [1][2]
Factor 1: Scale and Diversification (44%) Measure Score Measure Score
a) Total Sales (USD Billion) $2.2 Ba $2.9 Ba
b) Geographic Diversification B B B B
c) Segmental Diversification Baa Baa Baa Baa
Factor 2: Franchise Strength and Potential (14%)
a) Market Share A A A A
b) Category Assessment A A A A
Factor 3: Profitability (7%)
a) EBIT Margin 11.2% Ba 7.9% B
Factor 4: Financial Policy (14%)
a) Financial Policy Baa Baa Baa Baa
Factor 5: Leverage and Coverage (21%)
a) Debt / EBITDA 1.9x A 2.7x Baa
b) RCF / Net Debt 52.4% Aa 21.5% Baa
c) EBIT / Interest Expense 7.8x A 4.5x Baa
Rating:
a) Indicated Rating from Grid Baa2 Baa3
b) Actual Rating Assigned Baa3 Baa3
Current
LTM 3/31/2018
Moody's 12-18 Month Forward View
As of 5/29/2018 [3]
[1] All ratios are based on 'Adjusted' financial data and incorporate Moody's Global Standard Adjustments for Non-Financial Corporations.[2] As of 3/31/2018(L).[3] This represents Moody's forward view; not the view of the issuer; and unless noted in the text, does not incorporate significant acquisitions and divestitures.Source: Moody’s Financial Metrics™
7 31 May 2018 Alicorp S.A.A.: Update to credit analysis - First quarter 2018

MOODY'S INVESTORS SERVICE CORPORATES
Ratings
Exhibit 13Category Moody's RatingALICORP S.A.A.
Outlook StableSenior Unsecured Baa3
Source: Moody's Investors Service
Appendix
Exhibit 14
Peer comparison tableAlicorp, S.A.A.
(in US millions)
FYE
Dec-16
FYE
Dec-17
LTM
Mar-18
FYE
Dec-16
FYE
Dec-17
LTM
Mar-18
FYE
Dec-15
FYE
Dec-16
LTM
Sep-17
FYE
May-16
FYE
May-17
LTM
Feb-18
FYE
Dec-16
FYE
Dec-17
LTM
Dec-17
Revenue $1,964 $2,178 $2,234 $5,705 $6,056 $6,261 $13,849 $13,527 $13,945 $8,664 $7,827 $7,834 $3,927 $3,921 $3,921
EBITDA $241 $289 $300 $698 $696 $731 $1,760 $1,693 $1,633 $1,416 $1,496 $1,167 $573 $569 $569
Total Debt $481 $603 $571 $2,448 $2,717 $3,259 $5,645 $5,666 $6,045 $7,188 $3,939 $4,621 $1,505 $1,326 $1,326
Cash & Cash Equiv. $82 $322 $299 $623 $655 $1,049 $221 $331 $313 $798 $251 $133 $6 $5 $5
EBIT Margin 9.7% 11.0% 11.2% 8.4% 7.7% 7.8% 7.8% 7.9% 7.2% 12.4% 14.9% 10.8% 9.0% 8.7% 8.7%
EBIT / Int. Exp. 4.8x 7.5x 7.8x 4.0x 3.0x 3.8x 3.2x 3.2x 2.9x 3.2x 4.8x 4.6x 6.6x 6.3x 6.3x
Debt / EBITDA 2.0x 2.1x 1.9x 3.9x 4.0x 4.4x 3.5x 3.7x 3.5x 5.1x 2.6x 4.0x 2.6x 2.3x 2.3x
RCF / Net Debt 22.8% 51.5% 52.4% 25.5% 12.1% 14.7% 20.4% 19.9% 19.7% 19.3% 19.8% 21.2% 19.7% 17.6% 17.6%
FCF / Debt 39.6% 31.3% 19.8% 13.5% 0.5% 0.3% 5.1% 4.6% 1.8% 7.6% 15.9% 14.6% 8.3% 6.2% 6.2%
Alicorp, S.A.A. Sigma Alimentos S.A. de C.V. Grupo Bimbo, S.A.B. de C.V. Conagra Brands, Inc. Flowers Foods, Inc.
Baa3 Stable Baa3 Stable Baa2 Stable Baa2 Stable Baa2 Stable
All figures & ratios calculated using Moody’s estimates & standard adjustments. FYE = Financial Year-End. LTM = Last Twelve Months. RUR* = Ratings under Review, where UPG = forupgrade and DNG = for downgrade.Source: Moody’s Financial Metrics™
Exhibit 15
Moody's-Adjusted Debt BreakdownAlicorp, S.A.A.
(in US Millions)
FYE
Dec-13
FYE
Dec-14
FYE
Dec-15
FYE
Dec-16
FYE
Dec-17
LTM Ending
Mar-18
As Reported Debt 732.1 926.1 607.0 481.2 602.8 570.5
Pensions 0.0 0.0 0.0 0.0 0.0 0.0
Operating Leases 0.0 0.0 0.0 0.0 0.0 0.0
Moody's-Adjusted Debt 732.1 926.1 607.0 481.2 602.8 570.5
All figures are calculated using Moody’s estimates and standard adjustments.Source: Moody’s Financial Metrics™
Exhibit 16
Moody's-Adjusted EBITDA BreakdownAlicorp, S.A.A.
(in US Millions)
FYE
Dec-13
FYE
Dec-14
FYE
Dec-15
FYE
Dec-16
FYE
Dec-17
LTM Ending
Mar-18
As Reported EBITDA 240.0 131.7 190.2 227.8 278.6 290.3
Pensions 0.0 0.0 0.0 0.0 0.0 0.0
Operating Leases 0.0 0.0 0.0 0.0 0.0 0.0
Unusual 38.2 43.4 53.2 13.7 9.8 8.6
Non-Standard Adjustments 0.6 0.2 2.1 -0.3 0.9 0.9
Moody's-Adjusted EBITDA 278.8 175.3 245.4 241.2 289.4 299.8
All figures are calculated using Moody’s estimates and standard adjustments.Source: Moody’s Financial Metrics™
8 31 May 2018 Alicorp S.A.A.: Update to credit analysis - First quarter 2018

MOODY'S INVESTORS SERVICE CORPORATES
© 2018 Moody’s Corporation, Moody’s Investors Service, Inc., Moody’s Analytics, Inc. and/or their licensors and affiliates (collectively, “MOODY’S”). All rights reserved.
CREDIT RATINGS ISSUED BY MOODY'S INVESTORS SERVICE, INC. AND ITS RATINGS AFFILIATES (“MIS”) ARE MOODY’S CURRENT OPINIONS OF THE RELATIVE FUTURE CREDITRISK OF ENTITIES, CREDIT COMMITMENTS, OR DEBT OR DEBT-LIKE SECURITIES, AND MOODY’S PUBLICATIONS MAY INCLUDE MOODY’S CURRENT OPINIONS OF THERELATIVE FUTURE CREDIT RISK OF ENTITIES, CREDIT COMMITMENTS, OR DEBT OR DEBT-LIKE SECURITIES. MOODY’S DEFINES CREDIT RISK AS THE RISK THAT AN ENTITYMAY NOT MEET ITS CONTRACTUAL, FINANCIAL OBLIGATIONS AS THEY COME DUE AND ANY ESTIMATED FINANCIAL LOSS IN THE EVENT OF DEFAULT. CREDIT RATINGSDO NOT ADDRESS ANY OTHER RISK, INCLUDING BUT NOT LIMITED TO: LIQUIDITY RISK, MARKET VALUE RISK, OR PRICE VOLATILITY. CREDIT RATINGS AND MOODY’SOPINIONS INCLUDED IN MOODY’S PUBLICATIONS ARE NOT STATEMENTS OF CURRENT OR HISTORICAL FACT. MOODY’S PUBLICATIONS MAY ALSO INCLUDE QUANTITATIVEMODEL-BASED ESTIMATES OF CREDIT RISK AND RELATED OPINIONS OR COMMENTARY PUBLISHED BY MOODY’S ANALYTICS, INC. CREDIT RATINGS AND MOODY’SPUBLICATIONS DO NOT CONSTITUTE OR PROVIDE INVESTMENT OR FINANCIAL ADVICE, AND CREDIT RATINGS AND MOODY’S PUBLICATIONS ARE NOT AND DO NOTPROVIDE RECOMMENDATIONS TO PURCHASE, SELL, OR HOLD PARTICULAR SECURITIES. NEITHER CREDIT RATINGS NOR MOODY’S PUBLICATIONS COMMENT ON THESUITABILITY OF AN INVESTMENT FOR ANY PARTICULAR INVESTOR. MOODY’S ISSUES ITS CREDIT RATINGS AND PUBLISHES MOODY’S PUBLICATIONS WITH THE EXPECTATIONAND UNDERSTANDING THAT EACH INVESTOR WILL, WITH DUE CARE, MAKE ITS OWN STUDY AND EVALUATION OF EACH SECURITY THAT IS UNDER CONSIDERATION FORPURCHASE, HOLDING, OR SALE.
MOODY’S CREDIT RATINGS AND MOODY’S PUBLICATIONS ARE NOT INTENDED FOR USE BY RETAIL INVESTORS AND IT WOULD BE RECKLESS AND INAPPROPRIATE FORRETAIL INVESTORS TO USE MOODY’S CREDIT RATINGS OR MOODY’S PUBLICATIONS WHEN MAKING AN INVESTMENT DECISION. IF IN DOUBT YOU SHOULD CONTACTYOUR FINANCIAL OR OTHER PROFESSIONAL ADVISER. ALL INFORMATION CONTAINED HEREIN IS PROTECTED BY LAW, INCLUDING BUT NOT LIMITED TO, COPYRIGHT LAW,AND NONE OF SUCH INFORMATION MAY BE COPIED OR OTHERWISE REPRODUCED, REPACKAGED, FURTHER TRANSMITTED, TRANSFERRED, DISSEMINATED, REDISTRIBUTEDOR RESOLD, OR STORED FOR SUBSEQUENT USE FOR ANY SUCH PURPOSE, IN WHOLE OR IN PART, IN ANY FORM OR MANNER OR BY ANY MEANS WHATSOEVER, BY ANYPERSON WITHOUT MOODY’S PRIOR WRITTEN CONSENT.
CREDIT RATINGS AND MOODY’S PUBLICATIONS ARE NOT INTENDED FOR USE BY ANY PERSON AS A BENCHMARK AS THAT TERM IS DEFINED FOR REGULATORY PURPOSESAND MUST NOT BE USED IN ANY WAY THAT COULD RESULT IN THEM BEING CONSIDERED A BENCHMARK.
All information contained herein is obtained by MOODY’S from sources believed by it to be accurate and reliable. Because of the possibility of human or mechanical error as wellas other factors, however, all information contained herein is provided “AS IS” without warranty of any kind. MOODY'S adopts all necessary measures so that the information ituses in assigning a credit rating is of sufficient quality and from sources MOODY'S considers to be reliable including, when appropriate, independent third-party sources. However,MOODY’S is not an auditor and cannot in every instance independently verify or validate information received in the rating process or in preparing the Moody’s publications.
To the extent permitted by law, MOODY’S and its directors, officers, employees, agents, representatives, licensors and suppliers disclaim liability to any person or entity for anyindirect, special, consequential, or incidental losses or damages whatsoever arising from or in connection with the information contained herein or the use of or inability to use anysuch information, even if MOODY’S or any of its directors, officers, employees, agents, representatives, licensors or suppliers is advised in advance of the possibility of such losses ordamages, including but not limited to: (a) any loss of present or prospective profits or (b) any loss or damage arising where the relevant financial instrument is not the subject of aparticular credit rating assigned by MOODY’S.
To the extent permitted by law, MOODY’S and its directors, officers, employees, agents, representatives, licensors and suppliers disclaim liability for any direct or compensatorylosses or damages caused to any person or entity, including but not limited to by any negligence (but excluding fraud, willful misconduct or any other type of liability that, for theavoidance of doubt, by law cannot be excluded) on the part of, or any contingency within or beyond the control of, MOODY’S or any of its directors, officers, employees, agents,representatives, licensors or suppliers, arising from or in connection with the information contained herein or the use of or inability to use any such information.
NO WARRANTY, EXPRESS OR IMPLIED, AS TO THE ACCURACY, TIMELINESS, COMPLETENESS, MERCHANTABILITY OR FITNESS FOR ANY PARTICULAR PURPOSE OF ANY SUCHRATING OR OTHER OPINION OR INFORMATION IS GIVEN OR MADE BY MOODY’S IN ANY FORM OR MANNER WHATSOEVER.
Moody’s Investors Service, Inc., a wholly-owned credit rating agency subsidiary of Moody’s Corporation (“MCO”), hereby discloses that most issuers of debt securities (includingcorporate and municipal bonds, debentures, notes and commercial paper) and preferred stock rated by Moody’s Investors Service, Inc. have, prior to assignment of any rating,agreed to pay to Moody’s Investors Service, Inc. for appraisal and rating services rendered by it fees ranging from $1,500 to approximately $2,500,000. MCO and MIS also maintainpolicies and procedures to address the independence of MIS’s ratings and rating processes. Information regarding certain affiliations that may exist between directors of MCO andrated entities, and between entities who hold ratings from MIS and have also publicly reported to the SEC an ownership interest in MCO of more than 5%, is posted annually atwww.moodys.com under the heading “Investor Relations — Corporate Governance — Director and Shareholder Affiliation Policy.”
Additional terms for Australia only: Any publication into Australia of this document is pursuant to the Australian Financial Services License of MOODY’S affiliate, Moody’s InvestorsService Pty Limited ABN 61 003 399 657AFSL 336969 and/or Moody’s Analytics Australia Pty Ltd ABN 94 105 136 972 AFSL 383569 (as applicable). This document is intendedto be provided only to “wholesale clients” within the meaning of section 761G of the Corporations Act 2001. By continuing to access this document from within Australia, yourepresent to MOODY’S that you are, or are accessing the document as a representative of, a “wholesale client” and that neither you nor the entity you represent will directly orindirectly disseminate this document or its contents to “retail clients” within the meaning of section 761G of the Corporations Act 2001. MOODY’S credit rating is an opinion asto the creditworthiness of a debt obligation of the issuer, not on the equity securities of the issuer or any form of security that is available to retail investors. It would be recklessand inappropriate for retail investors to use MOODY’S credit ratings or publications when making an investment decision. If in doubt you should contact your financial or otherprofessional adviser.
Additional terms for Japan only: Moody's Japan K.K. (“MJKK”) is a wholly-owned credit rating agency subsidiary of Moody's Group Japan G.K., which is wholly-owned by Moody’sOverseas Holdings Inc., a wholly-owned subsidiary of MCO. Moody’s SF Japan K.K. (“MSFJ”) is a wholly-owned credit rating agency subsidiary of MJKK. MSFJ is not a NationallyRecognized Statistical Rating Organization (“NRSRO”). Therefore, credit ratings assigned by MSFJ are Non-NRSRO Credit Ratings. Non-NRSRO Credit Ratings are assigned by anentity that is not a NRSRO and, consequently, the rated obligation will not qualify for certain types of treatment under U.S. laws. MJKK and MSFJ are credit rating agencies registeredwith the Japan Financial Services Agency and their registration numbers are FSA Commissioner (Ratings) No. 2 and 3 respectively.
MJKK or MSFJ (as applicable) hereby disclose that most issuers of debt securities (including corporate and municipal bonds, debentures, notes and commercial paper) and preferredstock rated by MJKK or MSFJ (as applicable) have, prior to assignment of any rating, agreed to pay to MJKK or MSFJ (as applicable) for appraisal and rating services rendered by it feesranging from JPY200,000 to approximately JPY350,000,000.
MJKK and MSFJ also maintain policies and procedures to address Japanese regulatory requirements.
REPORT NUMBER 1125873
9 31 May 2018 Alicorp S.A.A.: Update to credit analysis - First quarter 2018
MOODY'S INVESTORS SERVICE CORPORATES
Analyst Contacts
Diana Gonzalez 52-55-1555-5305Associate [email protected]
CLIENT SERVICES
Americas 1-212-553-1653
Asia Pacific 852-3551-3077
Japan 81-3-5408-4100
EMEA 44-20-7772-5454
10 31 May 2018 Alicorp S.A.A.: Update to credit analysis - First quarter 2018