Alertamerica2012
164
2012 REPORT ON CITIZEN SECURITY IN THE AMERICAS / INFORME SOBRE SEGURIDAD CIUDADANA EN LAS AMÉRICAS Secretariat for Multidimensional Security • Secretaría de Seguridad Multidimensional © Copyright 2012 OEA Alertamerica .org OAS Hemispheric Security Observatory / El Observatorio Hemisférico de Seguridad de la OEA Official Statistical Information on Citizen Security provided by the OAS Member States / Estadísticas oficiales de Seguridad Ciudadana producidas por los Estados miembros de la OEA
-
Upload
gustavo-marcelo-medina-narbona -
Category
News & Politics
-
view
484 -
download
3
Transcript of Alertamerica2012

2012
REPORT ON CITIZEN SECURITY IN THE AMERICAS /INFORME SOBRE SEGURIDAD CIUDADANA EN LAS AMÉRICAS
Secretariat for Multidimensional Security • Secretaría de Seguridad Multidimensional © Copyright 2012 OEA
Alertamerica.org OAS Hemispheric Security Observatory /
El Observatorio Hemisférico de Seguridad de la OEA
Official Statistical Information on Citizen Security provided by the OAS Member States /Estadísticas oficiales de Seguridad Ciudadana producidas por los Estados miembros de la OEA

The Government of Canada’s Anti-Crime Capacity Building Program (ACCBP) provides up to $15 million a year to enhance the capacity of government agencies, international organizations and non-governmental entities to prevent and respond to threats posed by transnational criminal activity throughout the Americas using a variety of bilateral and multilateral project-delivery mechanisms. The ACCBP was launched by Prime Minister Stephen Harper in August 2009 during the North American Leaders’ Summit in Guadalajara, Mexico.
In Central America and the Caribbean, the ACCBP focuses on illicit drug trafficking, security-sector reform and crime prevention. In the Americas more widely, the Program also seeks to tackle corruption, human trafficking and migrant smuggling, and money laundering and proceeds of crime.
The ACCBP is managed by Foreign Affairsand International Trade Canada.
El Ministerio de Asuntos Exteriores y de Cooperación de España (MAEC) y la Agencia Española de Cooperación Internacional para el Desarrollo (AECID) desarrollan los esfuerzos y aportaciones de España para hacer frente a los principales desafíos del desarrollo en el mundo contemporáneo.
Para el cumplimiento de sus compromisos con la sociedad internacional, España ha apostado decididamente en los últimos años por el fortalecimiento del sistema multilateral, en lo que la Organización de los Estados Americanos ha sido un socio preferente en las Américas.
Desde 2006, y a través del Fondo español para la OEA, España ha apoyado cerca de noventa proyectos de la Organización para desarrollar la gobernabilidad democrática, las políticas e instituciones públicas, la prevención de conflictos y la construcción de la paz. De 2006 a 2011 España ha sido el principal donante entre los países observadores permanentes de la OEA, con una aportación superior a los cincuenta millones de dólares en esos seis años.
OAS Cataloging-in-Publication Data
Organization of American States. Secretariat for Multidimensional Security. Report on Citizen Security in the Americas 2012 : Official Statistical Information on Citizen Security provided by the OAS Member States = Informe sobre Seguridad Ciudadana en las Américas 2012 : Estadísticas oficiales de Seguridad Ciudadana producidas por los Estados miembros de la OEA. v. ; cm. (OEA documentos oficiales) (OAS Official Records Series) ISBN 978-0-8270-5881-1
1. National security--America. 2. Internal security--America. 3. Security, International.
I. Title. II. Title: Informe sobre seguridad ciudadana en las Américas 2012 : Estadísticas oficiales de seguridad ciudadana producidas por los Estados Miembros de la OEA. III. Alertamerica.org : OAS Hemispheric Security Observatory / Observatorio Hemisférico de Seguridad de la OEA. IV. Series. V. Series: OAS Official Records Series.
OEA/ Ser.D/ XXV.2

RePORt On Citizen SeCuRity in the AmeRiCAS 2012
Official Statistical Information on Citizen Security provided by the OAS Member States
Organization of American States • 2012
infORme SObRe SeguRiDAD CiuDADAnA en lAS AméRiCAS 2012
Estadísticas oficiales de Seguridad Ciudadana producidas por los Estados miembros de la OEA
Organización de los Estados Americanos • 2012
Secretariat for Multidimensional Security :: Secretaría de Seguridad Multidimensional

All rights reserved Todos los derechos reservados
Disclaimer
The contents of this publication do not necessarily reflect the views or policies of the OAS or contributory
organizations.
Aviso importante
Los contenidos de esta publicación no reflejan necesariamente los puntos
de vista de la OEA o de alguna de las organizaciones contribuyentes.
July 2012 / Julio de 2012
© OAS Secretariat for Multidimensional Security
/ Secretaría de Seguridad Multidimensional de la OEA
1889 F Street, N.W., Washington, D.C., 20006 United States of America
www.alertamerica.org
Additional sources of information from the Inter-American SystemFuentes adicionales de información en el Sistema Interamericano
Secretary general José Miguel Insulza
Assistant Secretary general Albert R. Ramdin
Secretary for multidimensional Security Adam Blackwell
DirectorÁlvaro Briones
editor-in-ChiefLuiz O. Coimbra
graphic DesignerAlejandro Ahumada
editorsAndrea ÁlvarezAndrea Arteaga
Bryce PardoFabrice Leroy
María Margarita LópezMarya Hynes
Pablo Sandino MartínezStefan Hyman
ContributorsEnrico Bisogno
Francisco CumsilleHilary Anderson
María Isabel GutierrezArena Ortega
Report on Citizen Security in the Americas 2012OAS Hemispheric Security ObservatoryWashington, DC, United States, 2012.
167 pages

Table of conTenTs
8
12
38
48
67
tAbleS
VIOLENT DEATHS
1.1 Intentional Homicide 2000-2011 (Total)1.2 Intentional Homicide 2000-2011 (Rate)1.3 Male Victims of Intentional Homicides (Rate)1.4 Female Victims of Intentional Homicides (Rate)1.5 Intentional Homicide Victims Aged 15-24, Latest Available Year1.6 Intentional Homicide Committed By Firearm, 2000-2010 (Total)1.7 Intentional Homicide Committed By Firearm, 2000-2011 (Rate)1.8 Intentional Homicide Committed By Firearm, 2000-2010 (From % of Total Homicides)
171821
22
25
26
27
28
ARtiCleS
El crimen organizado en las Américas: una lectura desde las preocupaciones y desafíos subyacentesGeneral Oscar Adolfo Naranjo Trujillo, Expresidente de Ameripol
Control de Armas en Brasil y Agenda RegionalAntonio Rangel Bandeira, Ph.D., Coordinador del Programa de Control de Armas de Viva Río
Women’s Rights in Latin America and the Caribbean: Challenges and PerspectivesMargarette May Macaulay, Judge, Inter-American Court of Human Rights and Alejandra Negrete Morayta, Lawyer, Inter-American Court of Human Rights
Police Administrative Records: Issues of Citizen Security in CARICOMFrancis Forbes, Executive Director, CARICOM - Implementation Agency for Crime and Security - IMPACS
Drug Court Activity in the AmericasDouglas B. Marlowe, J.D., Ph.D., Chief of Science, Law & Policy, National Association of Drug Court Professionals
Youth and CrimeChandrikapersad Santokhi, Member of Parliament of Surinam and CICAD Chair 2010-2011
Fortalecimiento Institucional de los Organismos de Seguridad Pública en CentroaméricaErich Vilchez, Director de Asuntos Políticos y Jurídicos, Secretaría General del Sistema de Integración Centroamericano – SICA
Victimization Surveys as a Resource for Informing on Crime and SafetyMichael Rand, Former U.S. Bureau of Justice Statistics
PRefACe
Secretary General José Miguel Insulza
84
98
126
144
1.9 Intentional Homicide Committed By Firearm (Latest Year)1.10 Suicide, 2000-2009 (Total)1.10a Intentional Homicide Victims Registered by Public Health Systems1.11 Suicide, 2000-2009 (Rate)1.12 Suicide, Latest Available Year1.13 Traffic and Transport Fatalities, Latest Available Year
FIREARMS
2.14 Legally Registered Civilian Firearms, Latest Available Year
29
3031
323334
44
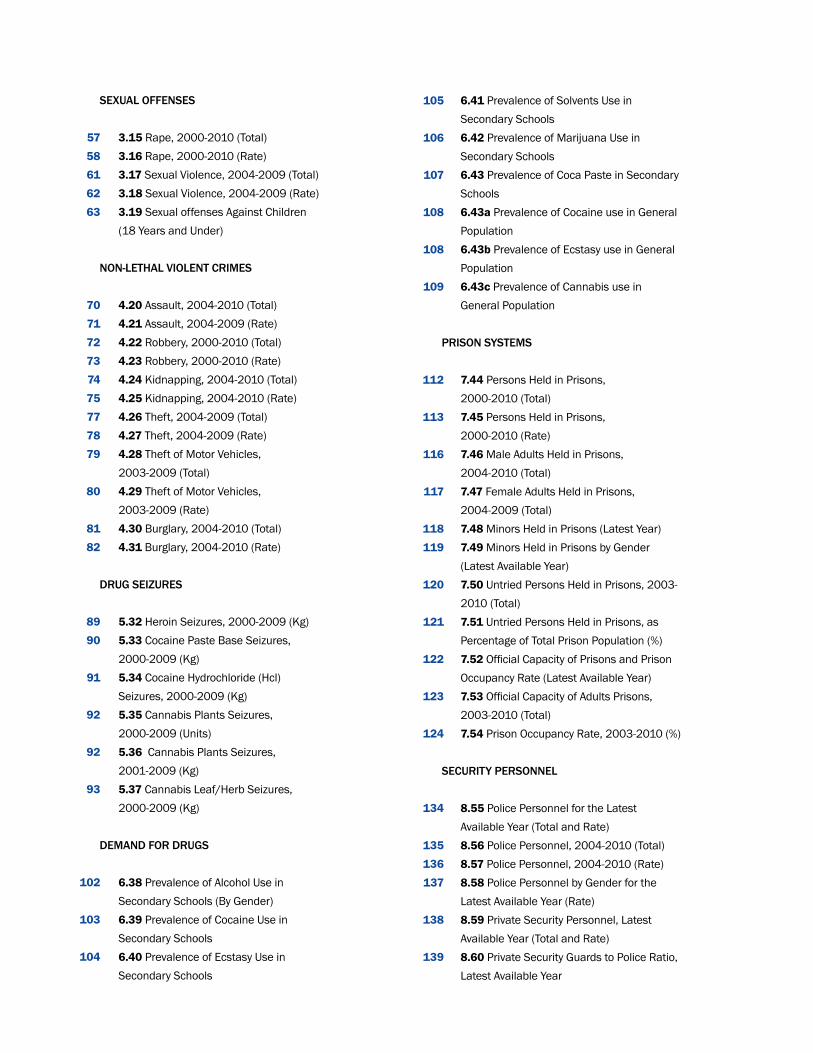
SEXUAL OFFENSES
3.15 Rape, 2000-2010 (Total)3.16 Rape, 2000-2010 (Rate)3.17 Sexual Violence, 2004-2009 (Total)3.18 Sexual Violence, 2004-2009 (Rate)3.19 Sexual offenses Against Children (18 Years and Under)
NON-LETHAL VIOLENT CRIMES
4.20 Assault, 2004-2010 (Total)4.21 Assault, 2004-2009 (Rate)4.22 Robbery, 2000-2010 (Total)4.23 Robbery, 2000-2010 (Rate)4.24 Kidnapping, 2004-2010 (Total)4.25 Kidnapping, 2004-2010 (Rate)4.26 Theft, 2004-2009 (Total)4.27 Theft, 2004-2009 (Rate)4.28 Theft of Motor Vehicles,2003-2009 (Total)4.29 Theft of Motor Vehicles,2003-2009 (Rate) 4.30 Burglary, 2004-2010 (Total)4.31 Burglary, 2004-2010 (Rate)
DRUG SEIZURES
5.32 Heroin Seizures, 2000-2009 (Kg)5.33 Cocaine Paste Base Seizures, 2000-2009 (Kg)5.34 Cocaine Hydrochloride (Hcl) Seizures, 2000-2009 (Kg)5.35 Cannabis Plants Seizures, 2000-2009 (Units)5.36 Cannabis Plants Seizures, 2001-2009 (Kg)5.37 Cannabis Leaf/Herb Seizures, 2000-2009 (Kg)
DEMAND FOR DRUGS
6.38 Prevalence of Alcohol Use in Secondary Schools (By Gender)6.39 Prevalence of Cocaine Use in Secondary Schools6.40 Prevalence of Ecstasy Use in Secondary Schools
6.41 Prevalence of Solvents Use in Secondary Schools6.42 Prevalence of Marijuana Use in Secondary Schools 6.43 Prevalence of Coca Paste in Secondary Schools6.43a Prevalence of Cocaine use in General Population6.43b Prevalence of Ecstasy use in General Population6.43c Prevalence of Cannabis use in General Population
PRISON SYSTEMS
7.44 Persons Held in Prisons,2000-2010 (Total)7.45 Persons Held in Prisons,2000-2010 (Rate)7.46 Male Adults Held in Prisons,2004-2010 (Total) 7.47 Female Adults Held in Prisons,2004-2009 (Total)7.48 Minors Held in Prisons (Latest Year) 7.49 Minors Held in Prisons by Gender (Latest Available Year)7.50 Untried Persons Held in Prisons, 2003-2010 (Total)7.51 Untried Persons Held in Prisons, as Percentage of Total Prison Population (%)7.52 Official Capacity of Prisons and Prison Occupancy Rate (Latest Available Year)7.53 Official Capacity of Adults Prisons, 2003-2010 (Total)7.54 Prison Occupancy Rate, 2003-2010 (%)
SECURITY PERSONNEL
8.55 Police Personnel for the Latest Available Year (Total and Rate)8.56 Police Personnel, 2004-2010 (Total)8.57 Police Personnel, 2004-2010 (Rate)8.58 Police Personnel by Gender for the Latest Available Year (Rate)8.59 Private Security Personnel, Latest Available Year (Total and Rate)8.60 Private Security Guards to Police Ratio, Latest Available Year
5758616263
707172737475777879
80
8182
8990
91
92
92
93
102
103
104
105
106
107
108
108
109
112
113
116
117
118119
120
121
122
123
124
134
135136137
138
139

8.61 Registered Private Security Companies, Latest Available Year (Total)
VICTIMIZATION SURVEYS
9.62 Victimization Rate,Latest Available Year (Prevalence)9.63 Prevalence of Sexual Assault,Latest Available Year9.64 Prevalence of Robbery,Latest Available Year9.65 Prevalence of Burglary,Latest Available Year
140
148
149
151
151
gRAPhS
Americas: Homicide Reported by Police Force, 2000-2010 (Total) Americas: Homicide Reported by Police Force, 2000-2010 (Rate per 100,000 inhabitants)Central America and Northern Triangle Countries: Intentional Homicide, 2000-2011 (Total)Central America and Northern Triangle Countries: Intentional Homicide, 2000-2011(Rate per 100,000 inhabitants)Americas: Victims of Rape Reported by Police Force 2000-2010 (Rate per 100,000 inhabitants)Cannabis Herb Seizures, 1985-2010“Ecstasy” Seizures, 2001-2010
Seized Cocaine of Unknown Purity, by Region, 2001-2010Trends in Cocaine Seizures in North AmericaCocaine Seizures in Selected South American Countries, 2000-2010Americas: Total Persons held in Prision, 2004-2010Americas: Rate per 100,000 inhabitants of Persons Held in Prison, 2004-2010Chile, Mexico and United States:Victimization Rates, 2000-2010Sexual Assault: Gap between Police Reported Data and Victimization Survey
bOXeS
Por un Sistema Regional de Indicadores, CISALVAFirearms, Trafficking and Organized Crime, UNODCThe incidence of sexual violencein the Americas, CIM
SOuRCeS AnD RefeRenCeS
Primary Data Sources
9.66 Prevalence of Motor Theft,Latest Available Year9.67 Police Reporting Rate,Latest Available Year9.68 Police Reporting Rate For Motor Vehicle Theft, Latest Available Year9.69 Police Reporting Rate For Burglary, Latest Available Year9.70 Police Reporting Rate For Robbery,Latest Available Year9.71 Police Reporting Rate For Sexual Assault, Latest Available Year
19
20
23
24
59
9094
3545
60
156
Children as a Group Vulnerableto Victimization, UNDPThe Role of Transnational Crime, The World BankDrug use data in the Americas, CICADImpact on Crime, UNODCPrivatization of Citizen Security, IACHR
AbOut the SmS
About the Secretariat for Mulridimensional Security
AbOut the OAS
About the Organization of American States
152
152
153
153
154
154
94
9494
114115
149
150
66
7695
109141
161
162

Alertamerica.org: El Observatorio Hemisférico de Seguridad de la OEA :: Informe Sobre Seguridad en las Américas
8
PRefaceIn 2009, the General Secretariat of the
Organization of American States (OAS) created Alertamérica, the OAS Hemispheric Observa-tory on Security, which authorities, security specialists and the general public can visit at www.alertamerica.org.
The OAS Hemispheric Observatory on Se-curity contains official data from OAS Member States which is sub-divided into 122 indicators that encompass the totality of areas related to the social phenomena of crime and violence, as well as information on the initiatives undertaken by Member States to control and sanction these. The indicators constitute the widest possible rep-ertoire of official information on these themes in the Americas. It is hoped that they will act as a cause for reflection and debate on a topic which has become the principal source of concern for citizens in our region. It constitutes, moreover, the most appropriate indicators and points of ref-erence for the short, medium, and long-term poli-cies which the American countries have imple-mented with a view to improving citizen security.
The document which the reader has in his/her hands, the Report on Citizen Security in the Americas 2012, is the second version of the Gen-eral Secretariat’s Annual Report comprising the information available through Alertamérica. The reader will find a synthesis of the current citizen security situation in the Americas, broken down into eighty-two statistical tables, as well as the opinions of renowned experts from throughout the continent on the principle areas of regional concern in this field.
This publication has been supported by various organizations, entities and collabora-tors without whom this Report would not have been possible. I would like to thank the Govern-ment of Canada’s Anti-Crime Capacity Building Program (ACCBP) and the Spanish Agency for International Development Cooperation (AE-CID) which have provided invaluable assistance in the sourcing, analysis and dissemination of
statistical information on citizen security in the Americas. I would also like to recognize the sup-port provided by Member States’ governments, which are of course the principal source of infor-mation disseminated in this Report.
The United Nations Office on Drugs and Crime (UNODC) Crime Trends and Operations of Criminal Justice Systems Survey and the Inter-American Development Bank, through its Region-al Public Goods Project entitled Regional System of Standardized Citizen Security and Violence Prevention Indicators, have been key partners in the development of instruments to collect official information on crime and violence in the region.
The Justice Studies Center of the Americas (JSCA), the Inter-American Commission on Hu-man Rights (IACHR), the Inter-American Commis-sion of Women (CIM), the Inter-American Drug Abuse Control Commission (CICAD), the Inter-American Children’s Institute (IIN) and the Pan-American Health Organization (PAHO) have also participated in the sourcing and analysis of of-ficial information in close coordination with the OAS General Secretariat.
We would like to thank all of these organiza-tions for the collaboration in this important effort; one which is firmly directed towards increasing transparency on issues which are deeply impor-tant for the future development of our region.
José miguel insulzaSecretary General

Alertamerica.org: OAS Hemispheric Security Observatory :: Report on Security in the Americas
9
En 2009 la Secretaría General de la Or-ganización de los Estados Americanos (OEA) creó Alertamérica, el Observatorio Hemisféri-co de Seguridad de la OEA, que autoridades, especialistas en temas de seguridad y el pú-blico en general pueden visitar en la dirección www.alertamerica.org.
El Observatorio Hemisférico de Seguridad de la OEA contiene información oficial de los Es-tados miembros de la OEA, agrupada en 122 in-dicadores que abarcan la totalidad de las áreas comprendidas por los fenómenos sociales de delito y violencia, así como de las iniciativas de-sarrolladas por los Estados para lograr su control y sanción. Estos indicadores constituyen el más amplio repertorio de información oficial sobre estas materias en el Hemisferio y está llamado a servir de base para la reflexión y el debate so-bre un tópico que se ha convertido en la principal preocupación de los habitantes de nuestra re-gión. Constituye, igualmente, el mejor referente e indicador para las políticas de corto, mediano y largo plazo que los Estados de las Américas im-plementan con el objetivo de mejorar la seguri-dad de sus ciudadanos.
El texto que el lector tiene en sus manos, informe Sobre Seguridad Ciudadana en las Américas 2012, es la segunda versión del In-forme Anual elaborado por esta Secretaría Ge-neral sobre la base de la información disponible en Alertamérica. En él el lector podrá encontrar una síntesis de la situación de las Américas en materia de seguridad ciudadana, agrupada en 82 tablas estadísticas, así como la opinión de destacados especialistas del continente sobre los principales temas de preocupación regional en este campo.
Esta publicación ha contado con el apoyo de diversos organismos, entidades y colaboradores, sin los cuales habría sido imposible llevar a cabo la tarea. El Gobierno de Canadá, por intermedio de su programa Anti-Crime Capacity Building Pro-gram (ACCBP) y el Gobierno de España, mediante
su Agencia Española de Cooperación Internacio-nal para el Desarrollo (AECID) han apoyado per-manentemente el acopio, análisis y divulgación de información estadística sobre seguridad ciu-dadana en las Américas. También reconocemos el apoyo de los gobiernos de los Estados Miem-bros de la OEA, que son las fuentes principales de toda la información que estamos divulgando.
La Organización de las Naciones Unidas contra la Droga y el Delito (ONUDD) con la En-cuesta sobre Tendencias del Crimen y Opera-ciones de los Sistemas Criminales y el Banco Interamericano de Desarrollo por intermedio de su Proyecto de Bienes Públicos Regiona-les titulado Sistema Regional de Indicadores de Convivencia y Seguridad Ciudadana, han sido so-cios claves en el desarrollo de instrumentos para recolectar información oficial sobre la criminali-dad y violencia en la región.
También han participado en los esfuerzos de acopio y análisis de datos oficiales, en forma coordinada con la Secretaría General de la OEA, el Centro de Estudios de Justicia de las Américas (CEJA), la Comisión Interamericana de Derechos Humanos (CIDH), la Comisión Interamericana de Mujeres (CIM), la Comisión Interamericana para el Control del Abuso de Drogas (CICAD), el Insti-tuto Interamericano del Niño, la Niña y el Adoles-cente (IIN) y la Organización Panamericana de la Salud (OPS).
A todos ellos agradecemos su colaboración en este esfuerzo que busca ampliar la transpa-rencia de información sobre un tema crucial para el futuro de nuestra región.
PRefacIo
José miguel in sulzaSecretario General


MueRTes VIolenTasVIolenT DeaTHs

Alertamerica.org: El Observatorio Hemisférico de Seguridad de la OEA :: Informe Sobre Seguridad en las Américas
12
La seguridad de la región, en la última década, ha adquirido una dimensión integral, complementaria y transnacional en la lucha contra los fenómenos del crimen organizado y sus actores, y ha avanzado en la construcción de un escenario de riesgos globales y comu-nes para el continente, basado en la identifi-cación de prioridades y esfuerzos unificados bajo un concepto más amplio de seguridad hu-mana, para enfrentar con éxito los entornos de violencia y crimen, reconfigurados particular-mente en el narcotráfico y el lavado de activos, que impactan y afectan el conglomerado social en su entorno, integridad y desarrollo.
Aunque existen focos de inseguridad se-
rios y los índices de violencia son altos, no se puede afirmar la existencia de un crimen or-ganizado en su máxima expresión, ni tampoco considerar la existencia de “ciudades fallidas”, dado que aún la gobernabilidad prevalece y el esfuerzo mancomunado internacional persiste con resultados de trascendencia en la lucha contra todas las manifestaciones del crimen transnacional. Sin embargo, la evolución y so-fisticación de la criminalidad hace imperativo repensar las estrategias adoptadas con el fin de incorporar nuevos elementos que permitan tener una lectura anticipada sobre su compor-tamiento, estructura, ramificaciones, conexio-
nes, finanzas y tentáculos en lo local como precondición necesaria para la definición de estrategias que respondan a la naturaleza y mutación del crimen organizado transnacional y la actuación oportuna y eficaz de las institu-ciones policiales y demás entes gubernamen-tales.
La visión estratégica de seguridad para la región, que conjuntamente se ha construido desde la Organización de Estados America-nos, identifica unas nuevas amenazas en un entorno multidimensional1, lo que ha permitido definir unas líneas de seguimiento especia-lizado desde tres perspectivas: 1. unas ame-nazas tradicionales asociadas al narcotráfico, terrorismo y la delincuencia organizada, 2. el protagonismo e interacción asumido por unas manifestaciones criminales no tradicionales derivadas de la simbiosis de delitos y 3. el sur-gimiento de unas preocupaciones y desafíos comunes asociados a aspectos políticos, so-ciales, económicos, de salud y ambientales, como la corrupción, la pobreza, las catástro-fes y pandemias, que integran en su conjun-to unas grandes fuerzas desequilibrantes a la seguridad pública regional.
Sobre la base de esta argumentación, Colombia se identifica con una concepción geoestratégica regional de la seguridad, apre-ciando en primer lugar, que de las 18 catego-rías de delitos transnacionales, que a instan-cias de las Naciones Unidas se han convenido en el mandato internacional2, hoy por hoy va-rios de ellos se agrupan o se derivan de la inci-dencia de las grandes amenazas que abarcan el marco de las preocupaciones de seguridad para la región.
La evolución de los mercados criminales y los enclaves del delito, hace prioritario que
1 El 19 de febrero de 2009, se conmemoró el quinto aniversario sobre la declaración de seguridad en las Américas, allí se reafirmaron las amenazas, preocupaciones y desafíos a la seguridad en el hemisferio bajo una natura-leza diversa y de alcance multidimensional, en lo cual se incluyen aspectos políticos, económicos, sociales, de salud y ambientales. 2 El 1995 la ONU identificó 18 categorías de delitos transnacionales.
el cRIMen oRganIzaDo en las aMéRIcas: una lecTuRa DesDe las PReocuPacIones y Desafíos subyacenTes
Por: General Óscar Naranjo TrujilloExpresidente de la Comunidad
de Policías de América (AMERIPOL)

Alertamerica.org: OAS Hemispheric Security Observatory :: Report on Security in the Americas
13
los estados estudien desde un enfoque eco-nómico, los mecanismos empleados por las organizaciones para la comercialización de la oferta criminal y la maximización de sus fi-nanzas bajo una lógica de actuación en red y la compra de servicios criminales en diversas zonas estratégicas que permitan una mayor movilidad y expansión.
Esta perspectiva se enriquece aún más con lo que hemos denominado el análisis de las 6T, la cual recoge aspectos críticos como el tráfico de estupefacientes, el tráfico de ar-mas, municiones y explosivos, el tráfico de seres humanos, el terrorismo, el tráfico de dinero y el tráfico de recursos naturales. Es-tos delitos multidimensionales registran hoy niveles preocupantes de violencia e inciden-cia, que advierten por un lado la tendencia de expansión y una relativa homogenización en las Américas, y por otro la necesidad de concentrar esfuerzos para lograr un efectivo y contundente impacto a sus manifestaciones criminológicas.
La incidencia, interacción y codependen-cia de estas manifestaciones del crimen son los ejes impulsores de la criminalidad organi-
zada en nuestra región, asociadas a rentas cri-minales y modalidades de violencia, que hoy son identificables dado que, contrario a lo que ocurría en épocas anteriores, los adelantos científicos, han permitido conocer, perfilar y atacar de una manera más directa.
De la mano de la reconfiguración del fe-nómeno, los actores han venido perfilando una caracterización del crimen regional, que se sustenta en una búsqueda recurrente de repu-tación de “poder”, conllevando a una ausencia de límites, incentivando disputas y “lealtades” criminales, la aplicación del terror y el chanta-je como arma defensiva al interior del entorno delictual y de “blindaje” para la defensa y des-conocimiento de los marcos legales, que pro-mueve la corrupción. En la actualidad vemos por un lado, una criminalidad con pretensiones de ampliar sus redes y de afectación a la segu-ridad de los ciudadanos, y por otro, una decidi-da respuesta de los gobiernos e instituciones policiales por asestar operativos estructurales contra los nodos centrales de la criminalidad a partir del fortalecimiento de los mecanismos de cooperación multilateral de vital relevancia para la lucha frontal contra las diversas mani-festaciones del crimen.
La simbiosis del narcotráfico con el te-rrorismo permite dimensionar las implicacio-nes de una criminalidad multidimensional. Produciéndose la necesidad de expresar la preocupación global de alianzas entre intere-ses narcotraficantes y terroristas, llevando a la priorización de la lucha contra el tráfico inter-nacional de droga.
Las disputas por el control de áreas de producción y rutas, la incentivación de rentas criminales que promueven el sicariato, se-cuestro y extorsión, el estímulo que otorga al terrorismo al facilitar la adquisición de armas y explosivos, el tráfico ilegal de dinero que se fundamenta en el lavado de activos y la trata de personas que estimula el entorno mafioso de los grandes capos y cabecillas terroristas, son elementos que no solo impactan a la se-guridad y estabilidad de las naciones, sino que tienen hoy en día una repercusión directa en la

Alertamerica.org: El Observatorio Hemisférico de Seguridad de la OEA :: Informe Sobre Seguridad en las Américas
14
percepción de seguridad ciudadana, al incen-tivar el surgimiento y fortalecimiento de gru-pos delincuenciales, que en las grandes urbes despliegan niveles preocupantes de criminali-dad y violencia.
Es así que fenómenos como el crecimien-to del consumo de drogas, impactan direc-tamente en la oferta para el narcomenudeo, dado que la distribución local está registran-do una rentabilidad similar a la internacional, constituyendo macroeconomías ilegales al-rededor del ilícito con ganancias cercanas al 250%, que para el caso de Colombia, son eje promotor de la violencia y el crimen urbano.
En Suramérica se registran coincidencias preocupantes, donde el crecimiento paulatino de los cultivos ilícitos y la producción de droga en los últimos cinco (5) años es concomitante con el escalamiento de delitos como el secues-tro. Para el caso de Colombia, el sicariato y la aparición de bandas criminales, soportadas en el narcotráfico y alianzas multicriminales con grupos terroristas y delincuenciales, represen-tan hoy un desafío mayor para la seguridad.
La acción policial en contra del narcotrá-fico, no se concibe de manera exclusiva como un problema de seguridad y salud pública, sino como una defensa integral de las democracias de América Latina. Los viejos paradigmas que dieron origen a la denominación de cárteles narcotraficantes vienen en desestimación, en la medida en que esas estructuras jerarqui-zadas y subordinadas tienden a desaparecer, dando origen a una especie de outsourcing criminal, en donde hay asociaciones esta-blecidas en línea horizontal con una alta mo-vilidad por el continente, Europa y Asia, que capitalizan mercados y oferta criminal menor.
La lucha contra la delincuencia organiza-da tiene su centro de gravedad en la legitimi-dad institucional. Por mayor que sea el desafío, terrorista y narcotraficante, el comportamiento de las fuerzas institucionales tiene que estar apegado al respeto por la ley y los derechos humanos. De lo contrario cada vez que un ser-vidor público se desvía de su actuación, lo que hace es legitimar al crimen, poniendo a prueba la capacidad moral de integridad y ética de las fuerzas de los Estados.
Los esfuerzos gubernamentales y de la comunidad americana de policías, por com-batir y someter a los criminales que inciden en nuestras naciones y transgreden nuestras fronteras, han sido enormes y sin claudicación. Así ha quedado reafirmado en la expresión es-pontanea de 20 naciones, que desde el 2008 nos agrupamos en AMERIPOL, espacio de coordinación para las policías del continente en la lucha contra el crimen. Desde su crea-ción se han generado 19.000 transacciones de intercambio de información3, que se extienden para el caso de Colombia, en la acción multila-teral que se desarrolla con Interpol y Europol.
La ofensiva de las instituciones policiales del continente, se está traduciendo también en capturas e incautaciones millonarias de dine-ro4, sin precedente en el pasado reciente. Para el caso de Colombia ha representado el apor-
3 Comunidad de Policía de América Latina y el Caribe. 4 Más de 326 millones de dólares a partir de incau-taciones en Colombia a abril de 2011.

Alertamerica.org: OAS Hemispheric Security Observatory :: Report on Security in the Americas
15
te de cooperación en procesos operacionales con ocho (8) países de América y Europa. Esto ha producido lo que puede denominarse como una diáspora narcotraficante, que plas-ma la movilización de narcotraficantes en la región y Centroamérica.
La Comisión Interamericana de Derechos Humanos de la OEA en 20095, señaló que la seguridad ciudadana debe contemplarse como una de las dimensiones de la seguridad humana y por lo tanto del desarrollo humano, lo cual in-volucra la interrelación de múltiples actores del Estado y la sociedad. Para la ONU este compo-nente reviste la misma importancia, razón por la cual ha planteado que la seguridad ciudada-na es una política pública que fue descuidada históricamente por los gobiernos de la región.
De esta manera las nuevas preocupacio-nes para la región, nos presentan los proble-mas de seguridad ciudadana como un factor de atención dado el nivel de incidencia que están recibiendo de organizaciones de crimen organizado serio, sumado al impacto de múlti-ples factores sociales, económicos, políticos y culturales, que alteran la convivencia e incenti-van los niveles de percepción de inseguridad. 5 Informe sobre Seguridad Ciudadana y Derechos Humanos – Comisión Interamericana de Derechos Humanos OEA.
Esta dimensión requiere de la formulación y aplicación de sistemas integrales de seguri-dad, que incentiven la reducción de los índices de criminalidad y delincuencia, y fortalezcan las herramientas de los Estados, para garan-tizar la tranquilidad y convivencia en nuestras sociedades.
Un sistema de seguridad debe concentrar los mecanismos necesarios para reducir los factores que conducen a la generación del de-lito, lo cual requiere de una dinámica integral y eficaz en su funcionamiento a partir de la arti-culación de cuatro (4) componentes:
La acción preventiva: que conjuga la responsabilidad del Estado en la formu-lación de políticas de inversión social en educación, empleo y salubridad, para desestimular focos de oferta para el crimen, fundamentadas en la infancia y adolescencia.
Un servicio de policía basado en la eficiencia: que despliegue una actividad preventiva y de atención directa ante las necesidades de la comunidad, la mitiga-ción del crimen, otorgando la detección y la captura del delincuente o criminal.

Alertamerica.org: El Observatorio Hemisférico de Seguridad de la OEA :: Informe Sobre Seguridad en las Américas
16
general Óscar naranjo trujilloExpresidente de la Comunidad de Policías de América (AMERIPOL)
Óscar Naranjo Trujillo (n. Colombia) se graduó con honores como subteniente de la Escuela de Cade-tes General Santander de la Policía Nacional de Colombia en 1978. Durante una carrera de más de treinta y cinco años con la Policía, el General ha ocupado varios cargos de alta responsabilidad y confianza que incluyen la Dirección de la Policía Judicial e Inteligencia y la Dirección de Inteligencia Policial. En 2007, el Presidente Uribe le designó como Director General de la Policía. En 2010, el Presidente Santos le ascendió al rango de Gene-
ral de Cuatro Estrellas, el General Naranjo es primer y único policía
de Colombia en ostentar este rango. El General ha jugado un papel clave en la creación
y el fortalecimiento de la Co-munidad de Policías de América
(AMERIPOL). Entre 2007-2010, se desempeñó como Secre-
tario General de dicha organización y, des-
de 2011 ha sido Presidente de la
Comunidad.
La aplicación de un efectivo siste-ma de justicia: con acceso equitativo y amplio, que ofrezca garantías para su aplicación, y disuada la acción de-lincuencial con una real aplicación de penas.
Una infraestructura acorde para el servicio penitenciario: que otorgue garantías y condiciones para el cumpli-miento de condenas, motive y promueva la resocialización e impida la continui-dad de la participación delictiva y crimi-nal desde los centros penitenciarios.
Este sistema extrapolado a los intereses del continente debe homogenizarse y avan-zar hacia renovadas alianzas y mecanismos de cooperación multilateral, particularmente frente a los mecanismos que ya se vienen afianzando en el marco de la inteligencia con CLACIP en AMERIPOL, entendiendo como un todo las preocupaciones y prioridades que en materia de seguridad y desarrollo necesita la región, para confrontar una amenaza crimi-nal que cada día es más global y apremia de la concentración de esfuerzos para cer-rarle espacios a las organizaciones y fomen-tar escenarios de prevención y resocialización, que desestimulen la generación del delito. Por el momento un primer paso que podría contribuir a la formulación de esfuerzos con-juntos, debe partir del conocimiento que se tiene desde la perspectiva de los cuerpos de inteligencia, para construir el primer reporte de evaluación de la amenaza del crimen or-ganizado para las Américas, a instancias de AMERIPOL.
La búsqueda de acciones contundentes contra la criminalidad organizada es responsa-bilidad de los estados, el tratamiento y abor-daje a estos complejos desafíos, deben nacer del conjunto de voluntades generadas alrede-dor de instituciones, gobiernos y sociedad, por contener su avance y focalizar la actuación sobre los puntos de gravedad de las organi-zaciones criminales para lograr impactar su estructura funcional y lucrativa.
Esto trae implícito ciertos desafíos: es-tudiar la interdependencia de la criminalidad con otras manifestaciones que alteran la segu-ridad, identificar los elementos de riesgo que facilitan su estructuración, la forma como se despliega en múltiples territorios y condiciona el comportamiento de los ciudadanos, conocer su morfología y fisonomía y los elementos que están asociados en tiempo y espacio para an-ticipar los comportamientos futuros de la crimi-nalidad y, sobre esta base, construir las es-trategias institucionales que permitan contener su actividad criminal y prevenir su incidencia en la convivencia y seguridad de los ciudada-nos. La última palabra no la ha tenido ni la podrá tener la criminalidad, sino los estados y sus instituciones que han demostrado altas capacidades para responder con efectividad a las amenazas y riesgos emergentes.

Alertamerica.org: OAS Hemispheric Security Observatory :: Report on Security in the Americas
17
Indicator definitionDefinición del indicador
COUNTRY
2000 2001 2002 2003 2004 2005 2006 2007 2008 2009 2010 2011
Antigua and Barbuda 5 7 5 5 4 3 11 17 16 16 6
Argentina 2,653 3,048 3,453 2,876 2,259 3,166 3,049 3,151 3,558 2,336 2,237
Bahamas 74 43 52 50 44 52 62 78 72 85 94
Barbados 20 25 25 33 22 29 35 27 25 19 31
Belize 41 64 87 67 79 81 92 97 103 97 129
Bolivia 3,078 2,957 2,610 2,565 3,748 876 2,724 1,013 1,216 1,130 1,084
Brazil 46,082 47,899 49,640 50,980 38,995 40,975 39,420 38,716 43,635 42,023 40,974
Canada 546 554 582 548 624 594 559 539 555 540 492
Chile 878 929 732 592 272 570 593 616 588 594 634 636
Colombia 25,681 26,311 27,829 21,918 18,888 17,234 16,274 16,381 15,250 17,717 17,459
Costa Rica 249 262 261 300 265 338 348 369 512 484 527
Dominica 2 1 9 8 8 8 5 7 7 13 15
Dominican Republic 1,144 1,110 1,310 1,656 2,390 2,121 2,107 2,092 2,607 2,625 2,638 2,513
Ecuador 1,833 1,658 1,906 1,609 2,390 2,121 2,385 2,273 1,916 1,883 2,638
El Salvador 2,341 2,210 2,024 2,172 2,768 3,882 3,927 3,495 3,179 4,349 4,005 4,308
Grenada 15 6 14 9 6 11 12 11 14 7 12
Guatemala 2,904 3,230 3,630 4,237 4,507 5,338 5,885 5,781 6,292 6,498 5,960
Guyana 76 80 143 209 131 142 163 115 158 117 139
Haiti (*5) 1,382 1,764 1,939 1,342 496 494 612 703
Honduras 3,176 3,488 3,629 2,224 2,155 2,417 3,118 3,588 4,473 4,996 6,236 7,104
Jamaica 887 1,139 1,045 975 1,471 1,674 1,340 1,583 1,611 1,683 1,442 1,133
Mexico 13,849 13,855 13,144 12,676 11,658 11,255 11,775 10,295 13,193 16,117 20,585
Nicaragua 476 537 554 635 646 729 686 714 738 802 785 738
Panama 299 306 380 338 308 364 363 444 654 818 759
Paraguay 995 1,314 1,372 1,285 1,209 1,076 934 906 942 848 741
Peru 1,302 1,294 1,136 1,316 1,526 3,057 3,141 2,943 3,413 4,074 5,473 7,086
Saint Kitts and Nevis 3 6 5 10 11 8 17 16 23 27 20
Saint Lucia 23 34 42 36 36 34 39 25 39 39 44
Saint Vincent and the Grenadines 20 12 20 18 28 26 13 36 27 20 25
Suriname 68 79 57 60 71 69 62 45 43 24
Trinidad and Tobago 120 151 171 229 260 386 371 391 547 506 472
United States 15,586 16,037 16,229 16,528 16,148 16,740 17,030 16,929 16,272 15,241 14,159
Uruguay 214 218 231 197 200 188 203 194 221 226 205 199
Venezuela 8,053 8,703 10,639 12,622 9,716 9,964 12,257 13,156 14,584 13,986
AMERICAS ( 34 countries) 134,075 138,949 144,730 140,922 124,185 126,870 129,496 126,539 136,977 140,552 144,733
Caribbean (13 countries) (*1) 2,313 3,916 4,462 4,968 5,622 4,352 4,012 4,779 5,482 5,652 5,502
Central America (7 countries) (*2) 9,486 10,097 10,565 9,973 10,728 13,149 14,419 14,488 15,951 18,044 18,401
North America (3 countries) (*3) 29,981 30,446 29,955 29,752 28,430 28,589 29,364 27,763 30,020 31,898 35,236
South America (11 countries) (*4) 90,913 94,490 99,748 96,229 79,405 79,438 81,205 79,509 85,524 84,958 85,594
Note
(*1) Data for the Caribbean includes: Antigua and Barbuda, Bahamas, Barbados, Dominica, Dominican Republic, Grenada, Haiti, Jamaica, Saint Kitts and Nevis, Saint Lucia, Saint Vincent and the Grenadines, and Trinidad and Tobago. (*2) Data for Central America includes: Belize, Costa Rica, El Salvador, Guatemala, Honduras, Nicaragua, and Panama. (*3) Data for North America includes: Canada, Mexico, and the United States. (*4) Data for South America includes: Argentina, Bolivia, Brazil, Chile, Colombia, Ecuador, Paraguay, Peru, Suriname, Uruguay, and Venezuela. (*5) Data for Haiti (2007‐2010) were obtained through the United Nations Stabilization Mission in Haiti.
1.1 INTENTIONAL HOMICIDE 2000‐2011 (TOTAL)
Number of victims of offenses of Intentional Homicide, as recorded by the Police. Intentional Homicide means death deliberately inflicted on a person by another person, including infanticide.
YEAR
Sub‐regional data:
Indicator definition
Alertamerica.org: El Observatorio Hemisférico de Seguridad de la OEA :: Informe Sobre Seguridad en las Américas
18
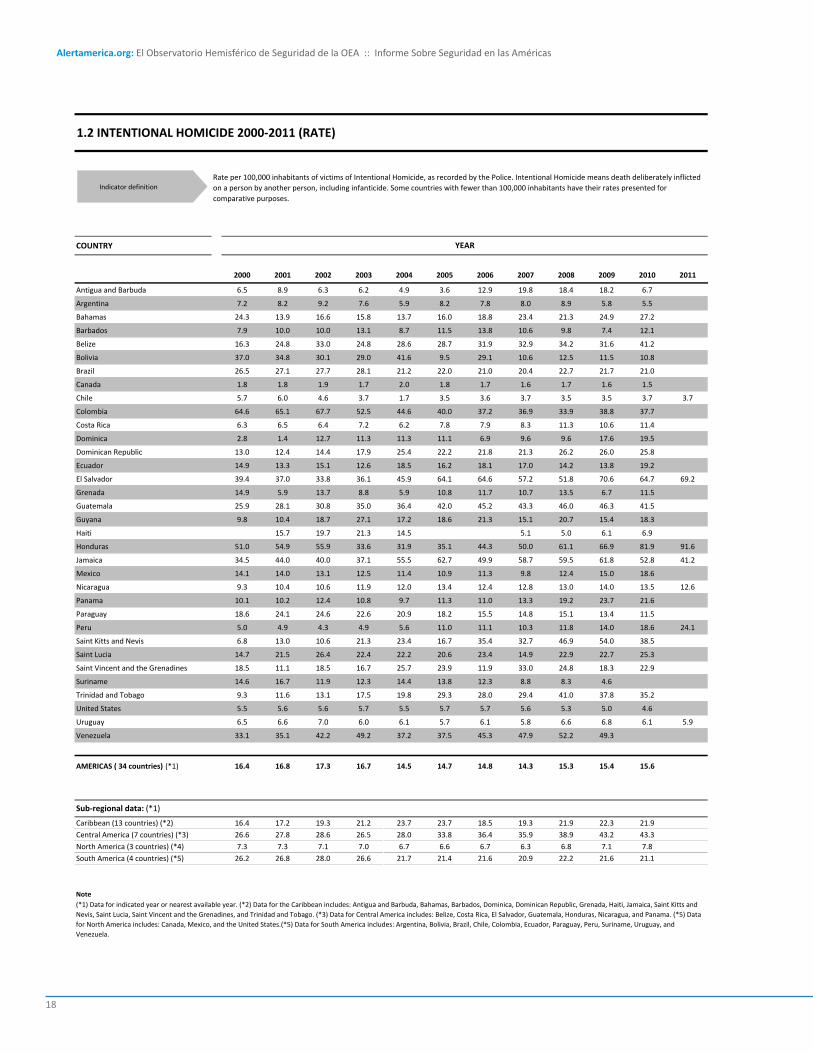
Indicator definitionDefinición del indicador
COUNTRY
2000 2001 2002 2003 2004 2005 2006 2007 2008 2009 2010 2011
Antigua and Barbuda 6.5 8.9 6.3 6.2 4.9 3.6 12.9 19.8 18.4 18.2 6.7
Argentina 7.2 8.2 9.2 7.6 5.9 8.2 7.8 8.0 8.9 5.8 5.5
Bahamas 24.3 13.9 16.6 15.8 13.7 16.0 18.8 23.4 21.3 24.9 27.2
Barbados 7.9 10.0 10.0 13.1 8.7 11.5 13.8 10.6 9.8 7.4 12.1
Belize 16.3 24.8 33.0 24.8 28.6 28.7 31.9 32.9 34.2 31.6 41.2
Bolivia 37.0 34.8 30.1 29.0 41.6 9.5 29.1 10.6 12.5 11.5 10.8
Brazil 26.5 27.1 27.7 28.1 21.2 22.0 21.0 20.4 22.7 21.7 21.0
Canada 1.8 1.8 1.9 1.7 2.0 1.8 1.7 1.6 1.7 1.6 1.5
Chile 5.7 6.0 4.6 3.7 1.7 3.5 3.6 3.7 3.5 3.5 3.7 3.7
Colombia 64.6 65.1 67.7 52.5 44.6 40.0 37.2 36.9 33.9 38.8 37.7
Costa Rica 6.3 6.5 6.4 7.2 6.2 7.8 7.9 8.3 11.3 10.6 11.4
Dominica 2.8 1.4 12.7 11.3 11.3 11.1 6.9 9.6 9.6 17.6 19.5
Dominican Republic 13.0 12.4 14.4 17.9 25.4 22.2 21.8 21.3 26.2 26.0 25.8
Ecuador 14.9 13.3 15.1 12.6 18.5 16.2 18.1 17.0 14.2 13.8 19.2
El Salvador 39.4 37.0 33.8 36.1 45.9 64.1 64.6 57.2 51.8 70.6 64.7 69.2
Grenada 14.9 5.9 13.7 8.8 5.9 10.8 11.7 10.7 13.5 6.7 11.5
Guatemala 25.9 28.1 30.8 35.0 36.4 42.0 45.2 43.3 46.0 46.3 41.5
Guyana 9.8 10.4 18.7 27.1 17.2 18.6 21.3 15.1 20.7 15.4 18.3
Haiti 15.7 19.7 21.3 14.5 5.1 5.0 6.1 6.9
Honduras 51.0 54.9 55.9 33.6 31.9 35.1 44.3 50.0 61.1 66.9 81.9 91.6
Jamaica 34.5 44.0 40.0 37.1 55.5 62.7 49.9 58.7 59.5 61.8 52.8 41.2
Mexico 14.1 14.0 13.1 12.5 11.4 10.9 11.3 9.8 12.4 15.0 18.6
Nicaragua 9.3 10.4 10.6 11.9 12.0 13.4 12.4 12.8 13.0 14.0 13.5 12.6
Panama 10.1 10.2 12.4 10.8 9.7 11.3 11.0 13.3 19.2 23.7 21.6
Paraguay 18.6 24.1 24.6 22.6 20.9 18.2 15.5 14.8 15.1 13.4 11.5
Peru 5.0 4.9 4.3 4.9 5.6 11.0 11.1 10.3 11.8 14.0 18.6 24.1
Saint Kitts and Nevis 6.8 13.0 10.6 21.3 23.4 16.7 35.4 32.7 46.9 54.0 38.5
Saint Lucia 14.7 21.5 26.4 22.4 22.2 20.6 23.4 14.9 22.9 22.7 25.3
Saint Vincent and the Grenadines 18.5 11.1 18.5 16.7 25.7 23.9 11.9 33.0 24.8 18.3 22.9
Suriname 14.6 16.7 11.9 12.3 14.4 13.8 12.3 8.8 8.3 4.6
Trinidad and Tobago 9.3 11.6 13.1 17.5 19.8 29.3 28.0 29.4 41.0 37.8 35.2
United States 5.5 5.6 5.6 5.7 5.5 5.7 5.7 5.6 5.3 5.0 4.6
Uruguay 6.5 6.6 7.0 6.0 6.1 5.7 6.1 5.8 6.6 6.8 6.1 5.9
Venezuela 33.1 35.1 42.2 49.2 37.2 37.5 45.3 47.9 52.2 49.3
AMERICAS ( 34 countries) (*1) 16.4 16.8 17.3 16.7 14.5 14.7 14.8 14.3 15.3 15.4 15.6
Caribbean (13 countries) (*2) 16.4 17.2 19.3 21.2 23.7 23.7 18.5 19.3 21.9 22.3 21.9
Central America (7 countries) (*3) 26.6 27.8 28.6 26.5 28.0 33.8 36.4 35.9 38.9 43.2 43.3
North America (3 countries) (*4) 7.3 7.3 7.1 7.0 6.7 6.6 6.7 6.3 6.8 7.1 7.8
South America (4 countries) (*5) 26.2 26.8 28.0 26.6 21.7 21.4 21.6 20.9 22.2 21.6 21.1
Note
(*1) Data for indicated year or nearest available year. (*2) Data for the Caribbean includes: Antigua and Barbuda, Bahamas, Barbados, Dominica, Dominican Republic, Grenada, Haiti, Jamaica, Saint Kitts and Nevis, Saint Lucia, Saint Vincent and the Grenadines, and Trinidad and Tobago. (*3) Data for Central America includes: Belize, Costa Rica, El Salvador, Guatemala, Honduras, Nicaragua, and Panama. (*5) Data for North America includes: Canada, Mexico, and the United States.(*5) Data for South America includes: Argentina, Bolivia, Brazil, Chile, Colombia, Ecuador, Paraguay, Peru, Suriname, Uruguay, and Venezuela.
1.2 INTENTIONAL HOMICIDE 2000‐2011 (RATE)
Rate per 100,000 inhabitants of victims of Intentional Homicide, as recorded by the Police. Intentional Homicide means death deliberately inflicted on a person by another person, including infanticide. Some countries with fewer than 100,000 inhabitants have their rates presented for comparative purposes.
YEAR
Sub‐regional data: (*1)
Indicator definition
Alertamerica.org: OAS Hemispheric Security Observatory :: Report on Security in the Americas
19
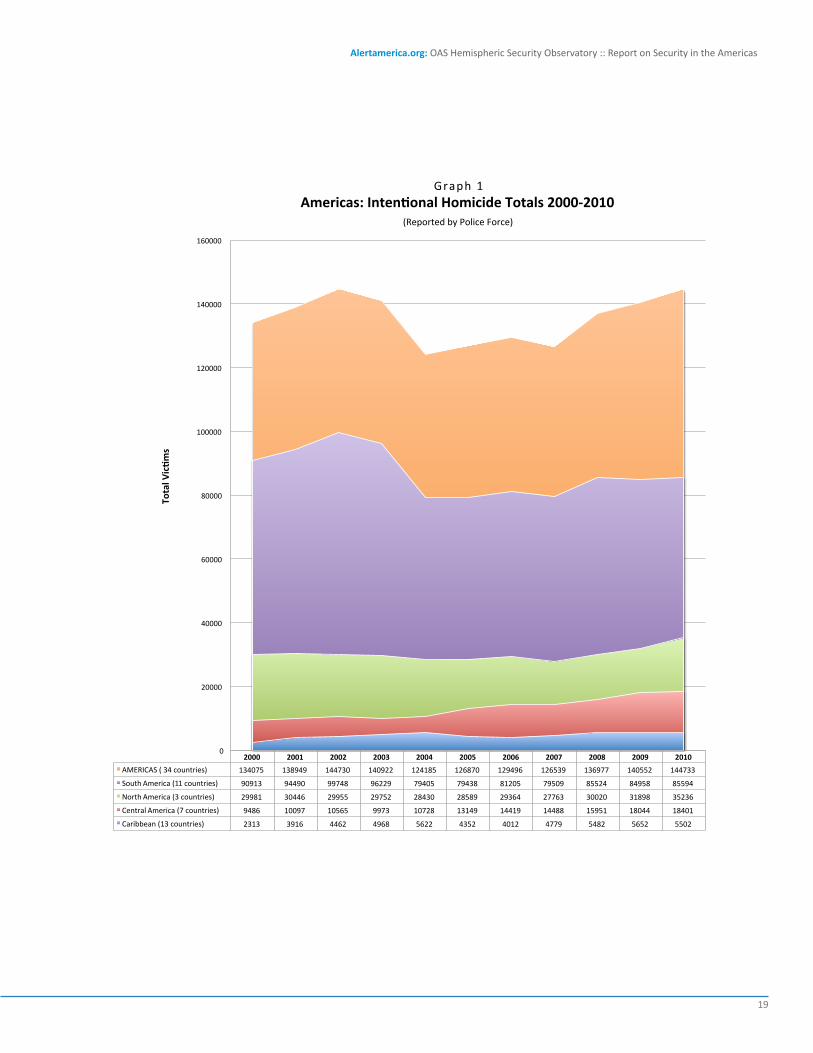
2000 2001 2002 2003 2004 2005 2006 2007 2008 2009 2010
AMERICAS ( 34 countries) 134075 138949 144730 140922 124185 126870 129496 126539 136977 140552 144733
South America (11 countries) 90913 94490 99748 96229 79405 79438 81205 79509 85524 84958 85594
North America (3 countries) 29981 30446 29955 29752 28430 28589 29364 27763 30020 31898 35236
Central America (7 countries) 9486 10097 10565 9973 10728 13149 14419 14488 15951 18044 18401
Caribbean (13 countries) 2313 3916 4462 4968 5622 4352 4012 4779 5482 5652 5502
0
20000
40000
60000
80000
100000
120000
140000
160000
Graph 1Americas: Intentional Homicide Totals 2000-2010
(Reported by Police Force)
Tota
l Vic
tim
s

Alertamerica.org: El Observatorio Hemisférico de Seguridad de la OEA :: Informe Sobre Seguridad en las Américas
20
2000 2001 2002 2003 2004 2005 2006 2007 2008 2009 2010
AMERICAS (34 countries) 16.4 16.8 17.3 16.6 14.5 14.7 14.8 14.2 15.3 15.4 15.6
Caribbean (12 countries) 16.4 17.2 19.3 21.2 23.7 23.7 18.5 19.3 21.9 22.3 21.9
Central America (7 countries) 26.6 27.8 28.5 26.5 28.0 33.7 36.3 35.9 38.8 43.2 43.3
North America (3 countries) 7.3 7.3 7.1 7 6.7 6.6 6.7 6.3 6.8 7.1 7.8
South America (12 countries) 26.1 26.8 27.9 26.5 21.6 21.3 21.6 20.9 22.2 21.5 21.1
0
5
10
15
20
25
30
35
40
45
50
Rate
per
100
,000
inha
bita
nts
Graph 2. Americas: Intentional Homicide Rates per 100,000 inhabitants, 2000-2010
(Reported by Police Force)

Alertamerica.org: OAS Hemispheric Security Observatory :: Report on Security in the Americas
21
COUNTRY
Latest available year Total Homicide Victims Total of Male Victims % of Male victims Rates of Male Victims
Argentina 2009 2,336 2,133 91% 10.8
Bahamas 2009 85 78 92% 46.6
Barbados 2010 31 19 63% 15.5
Belize 2010 129 116 90% 73.5
Brazil 2008 43,635 39,707 91% 42.0
Canada 2010 540 350 65% 2.9
Chile 2009 594 546 92% 6.5
Colombia 2010 17,459 16,062 92% 70.5
Costa Rica 2008 512 432 84% 18.8
Dominica 2009 13 12 92% 35.3
Dominican Republic 2008 2,607 2,300 88% 46.0
Ecuador 2008 1,916 1,762 92% 26.1
El Salvador 2008 3,179 2,925 92% 100.9
Grenada 2010 12 10 83% 19.1
Guatemala 2010 5,960 5,133 86% 73.3
Guyana 2009 117 92 79% 23.5
Haiti 2008 494 400 81% 8.2
Honduras 2009 4,996 4,912 98% 131.7
Jamaica 2010 1,442 1,286 89% 96.3
Mexico 2010 20,585 17,861 87% 33.4
Nicaragua 2008 738 581 79% 20.7
Panama 2009 818 745 91% 42.8
Paraguay 2008 942 696 74% 22.1
Saint Lucia 2008 39 34 87% 40.9
Saint Vincent and the Grenadines 2009 20 17 85% 30.9
Suriname 2008 43 31 71% 11.9
Trinidad and Tobago 2009 472 442 87% 68.0
United States 2010 14,159 10,348 73% 6.6
Uruguay 2010 205 168 82% 10.3
Venezuela(*1) 2008 11,357 9,920 87% 70.3
AMERICAS (30 countries) 2010(*2) 135,435 119,120 88% 27.5
Caribbean (10 countries) (*3) 2010 5,215 4,599 88%
Central America (7 countries) (*4) 2010 16,332 14,844 91%
North America (3 countries) (*5) 2010 35,284 28,560 81%
South America (9 countries) (*6) 2010 78,561 71,087 90%
Note(*1) Data source: Gobierno Bolivariano de Venezuela: Ministerio del Poder Popular para la Salud. (*2) Data for 2010 or latest available year. (*3) Data for Caribbean includes: Bahamas, Barbados, Dominica, Dominican Republic, Grenada, Haiti, Jamaica, Saint Lucia, Saint Vincent and the Grenadines, and Trinidad and Tobago. (*4) Data for Central America includes: Belize, Costa Rica, El Salvador, Guatemala, Honduras, Nicaragua, and Panama. (*5) Data for North America includes: Canada, Mexico, and the United States. (*6) Data for South America includes: Argentina, Brazil, Chile, Colombia, Ecuador, Paraguay, Suriname, Uruguay, and Venezuela.
1.3 MALE VICTIMS OF INTENTIONAL HOMICIDES (RATE)
YEAR
Sub‐regional data: (*2)
Intentional Homicide (male) means death deliberately inflicted on a male by another person, including infanticide, as recorded by the Police. Rates are calculated per 100,000 males. Some countries with fewer than 100,000 males have their rates presented for comparative purposes.
Indicator definition

Alertamerica.org: El Observatorio Hemisférico de Seguridad de la OEA :: Informe Sobre Seguridad en las Américas
22
Indicator definitionDefinición del indicador
COUNTRY
Latest available year Total Homicide victims Total Female victims % of Female victims Rates of Female victims
Argentina 2008 3,558 345 10% 1.7
Bahamas 2008 72 10 14% 5.8
Barbados 2010 31 10 31% 7.3
Belize 2010 129 16 12% 10.1
Bolivia 2008 1,216 49 4% 1.0
Brazil 2008 40,430 5,310 13% 5.4
Canada 2010 492 140 28% 0.8
Chile 2009 594 86 14% 1.0
Colombia 2009 15,817 1,259 8% 5.4
Costa Rica 2008 512 58 11% 2.6
Dominica 2009 13 1 8% 1.0
Dominican Republic 2008 2,607 158 6% 3.2
Ecuador 2008 1,916 222 12% 3.3
El Salvador 2008 3,179 427 13% 13.2
Grenada 2007 11 1 9% 1.9
Guatemala 2009 6,498 660 10% 10.4
Guyana 2010 139 14 10% 3.8
Haiti 2008 496 70 14% 1.4
Honduras 2009 4,996 362 7% 9.7
Jamaica 2010 1,442 144 10% 10.3
Mexico 2010 16,117 1,725 11% 3.1
Nicaragua 2008 738 51 7% 1.8
Panama 2009 818 70 9% 4.1
Paraguay 2008 942 49 5% 1.6
Peru 2008 3,332 187 6% 1.3
Saint Lucia 2008 39 2 6% 2.8
Saint Vincent and the Grenadines 2009 20 3 15% 5.6
Suriname 2005 69 4 6% 1.8
Trinidad and Tobago 2009 506 38 8% 5.5
United States 2010 14,159 3,056 22% 1.9
Uruguay 2010 205 41 20% 2.4
Venezuela 2008 14,584 567 4% 4.1
AMERICAS (32 countries) (*1) 2,010 135,677 15,136 11% 3.4
Caribbean (10 countries) (*2) 2010 5,237 437 8% 3.5
Central America (7 countries) (*3) 2010 30,768 1,645 10% 8.2
North America (3 countries) (*4) 2010 16,870 4,921 16% 2.1
South America (12 countries) (*5) 2010 82,802 8,133 10% 4.5
Note(*1) Data for 2010 or nearest available year. (*2) Data for Caribbean includes: Bahamas, Barbados, Dominica, Dominican Republic, Grenada, Haiti, Jamaica, Saint Lucia, Saint Vincent and the Grenadines, and Trinidad and Tobago.(*3) Data for Central America includes: Belize, Costa Rica, El Salvador, Guatemala, Honduras, Nicaragua, and Panama. (*4) Data for North America includes: Canada, Mexico, and the United States. (*5) Data for South America includes: Argentina, Bolivia, Brazil, Chile, Colombia, Ecuador, Guyana, Paraguay, Peru, Suriname, Uruguay, and Venezuela.
1.4 FEMALE VICTIMS OF INTENTIONAL HOMICIDES (RATE)
Intentional Homicide (female) means death deliberately inflicted on a woman by another person, including infanticide, as recorded by the Police. Rates are calculated per 100,000 females. Some countries with fewer than 100,000 women have their rates presented for comparative purposes.
Sub‐regional data: (*1)
Indicator definition

Alertamerica.org: OAS Hemispheric Security Observatory :: Report on Security in the Americas
23
2000 2001 2002 2003 2004 2005 2006 2007 2008 2009 2010 2011
Central America (7 countries) 9486 10097 10565 9973 10728 13149 14419 14488 15951 18044 18401
Guatemala 2904 3230 3630 4237 4507 5338 5885 5781 6292 6498 5960
Honduras 3176 3488 3629 2224 2155 2417 3118 3588 4473 4996 6236 7104
El Salvador 2341 2210 2024 2172 2768 3882 3927 3495 3179 4349 4005 4308
0
2000
4000
6000
8000
10000
12000
14000
16000
18000
20000
Tota
l Vic
tim
s of
Hom
icid
e Graph 3
Central America and Northern Triangle countries:Intentional Homicide Totals 2000-2011
(Reported by the Police Forces)

Alertamerica.org: El Observatorio Hemisférico de Seguridad de la OEA :: Informe Sobre Seguridad en las Américas
24
2000 2001 2002 2003 2004 2005 2006 2007 2008 2009 2010 2011
Central America (7 countries) 26.61 27.81 28.58 26.51 28.02 33.76 36.37 35.92 38.88 43.23 43.31
El Salvador 39.37 36.99 33.75 36.09 45.85 64.06 64.56 57.22 51.82 70.56 64.65 69.18
Guatemala 25.85 28.07 30.78 35.04 36.35 41.99 45.16 43.29 45.97 46.32 41.45
Honduras 50.95 54.85 55.91 33.58 31.89 35.06 44.34 50.01 61.11 66.91 81.88 91.60
0
10
20
30
40
50
60
70
80
90
100
Rate
per
100
,000
inha
bita
nts
Graph 4 Central America and Northern Triangle countries:
Intentional Homicide Rates per 100,000 inhabitants 2000-2011 (Reported by the Police Forces)

Alertamerica.org: OAS Hemispheric Security Observatory :: Report on Security in the Americas
25
Indicator definitionDefinición del indicador
COUNTRY
Latest available yearTotal homicide victims 15‐
24 years old% of persons 15‐24 years of age in total population
% of homicide victims between ages of 15‐24
Homicide rate of 15‐24 year old
Argentina 2008 745 17% 21% 11.2
Bahamas 2008 17 17% 34% 31.8
Belize 2010 14 21% 18% 24.4
Brazil 2008 17,653 17% 43% 52.4
Canada 2010 139 13% 26% 3.1
Chile 2009 213 17% 36% 7.9
Colombia 2009 5,895 19% 36% 70.0
Costa Rica 2008 79 20% 23% 9.2
Ecuador 2008 656 19% 31% 26.1
El Salvador 2008 1,225 19% 31% 105.6
Guatemala 2009 1,576 20% 27% 60.6
Guyana 2010 28 17% 20% 21.2
Mexico 2010 3,861 18% 34% 19.5
Nicaragua 2008 197 22% 27% 16.6
Panama 2009 142 18% 39% 24.4
Paraguay 2008 268 21% 22% 22.3
Saint Lucia 2008 8 19% 19% 26.4
Saint Vincent and the Grenadines 2009 3 19% 14% 12.1
Trinidad and Tobago 2009 57 21% 33% 21.2
Uruguay 2010 35 15% 18% 7.0
Venezuela 2008 4,421 19% 30% 82.6
AMERICAS (*1)(*2) 2,010 37,231 18% 36% 39.7
Caribbean (4 countries) (*3) 2010 85 20% 30% 22.7
Central America (6 countries) (*4) 2010 3,232 20% 29% 50.2
North America (2 countries) (*5) 2010 4,000 17% 34% 16.4
South America (9 countries) (*6) 2010 29,914 18% 38% 48.9
Note(*1) Americas refers to the 21 countries included in this table. (*2) Data for 2010 or nearest available year. (*3) Data for Caribbean includes: Bahamas, Saint Lucia, Saint Vincent and the Grenadines, and Trinidad and Tobago. (*4) Data for Central America includes: Belize, Costa Rica, El Salvador, Guatemala, Nicaragua, and Panama. (*5) Data for North America includes: Canada and Mexico. (*6) Data for South America includes: Argentina, Brazil, Chile, Colombia, Ecuador, Guyana, Paraguay, Uruguay, and Venezuela.
1.5 INTENTIONAL HOMICIDE VICTIMS AGED 15‐24, LATEST AVAILABLE YEAR
Intentional Homicide (young adult) means death deliberately inflicted on a person by another person as recorded by the Police. In this case, young adult refers to the population between 15 and 24 years old. Rates are calculated per 100,000 young adults (15‐24 years old). Some countries with fewer than 100,000 young adults have their rates presented for comparative purposes.
Sub‐regional data: (*2)
Indicator definition

Alertamerica.org: El Observatorio Hemisférico de Seguridad de la OEA :: Informe Sobre Seguridad en las Américas
26
Indicator definitionDefinición del indicador
COUNTRY
2000 2001 2002 2003 2004 2005 2006 2007 2008 2009 2010
Argentina 1,174 922 880 960 1,113
Barbados 8 9 7 14 6 13
Belize 36 41 37 41 66 47 67
Brazil 31,508 33,371 34,123 36,090 34,180 33,419 33,266 34,146 36,091 37,003 36,153
Canada 168 154 168 166 223 189 188 200 179 169
Colombia 21,597 22,238 23,830 18,408 14,541 12,097 11,756 11,711 10,938 14,063 13,549
Costa Rica 137 133 147 150 196 201
Dominican Republic 563 591 682 908 1,104 1,488 1,811 1,678 1,647
Ecuador 1,473 1,714 1,636 1,752
El Salvador 1,902 1,672 1,619 1,595 2,294 3,030 3,070 2,748 2,447 2,957
Grenada 9 9 8 7
Guatemala 2,108 2,419 2,741 3,448 3,643 4,239 4,611 4,775 5,236 5,403 5,003
Honduras 1,836 2,436 2,688 3,589 4,063 5,198
Jamaica 575 790 710 690 1,106 1,269 1,000 1,240 1,243 1,267 1,087
Mexico 3,566 3,425 2,560 2,960 2,806 3,155 3,554 3,959 4,998 8,627 10,854
Nicaragua 399 261 338
Panama 214 253 289 519 667 571
Paraguay 656 535 470 467
Saint Kitts and Nevis 7 6 12 12 17 22 17
Saint Vincent and the Grenadines 16 5 4 20 9 6
Trinidad and Tobago 180 272 269 306 435 365
United States 8,895 9,354 9,639 9,377 10,144 10,212 10,133 9,497 9,149 8,460
Uruguay 84 181 109 87 92 107
AMERICAS (23 countries) (*1)(*2) 77,109 79,894 82,023 80,152 85,913 75,326 86,007 77,646 81,018 89,494 90,102
Caribbean (7 countries) (*3) 1,358 1,601 1,612 1,819 2,431 2,672 2,796 3,080 3,536 3,358 3,142Central America (7 countries) (*4) 6,632 6,713 6,977 7,675 6,737 9,954 11,007 11,142 12,319 13,676 14,336North America (3 countries) (*5) 12,628 12,488 12,067 12,767 12,350 13,522 13,955 14,280 14,695 17,954 19,483South America (6 countries) (*6) 56,491 58,425 60,578 55,543 51,679 46,158 45,492 45,856 47,029 51,533 53,141
Note(*1) Americas refers to the 23 countries included in this table. (*2) Data calculated for indicated year or nearest available year. (*3) Data for Caribbean includes: Barbados, Dominican Republic, Grenada, Jamaica, Saint Kitts and Nevis, Saint Vincent and the Grenadines, and Trinidad and Tobago. (*4) Data for Central America includes: Belize, Costa Rica, El Salvador, Guatemala, Honduras, Nicaragua and Panama. (*5) Data for North America includes: Canada, Mexico and The United States. (*6) Data for South America includes: Argentina, Brazil, Colombia, Ecuador, Paraguay, and Uruguay.
1.6 INTENTIONAL HOMICIDE COMMITTED BY FIREARM, 2000‐2010 (TOTAL)
Intentional Homicide means death deliberately inflicted on a person by another person, including infanticide, as reported by the Police. In this case, deaths only committed by firearms are recorded.
YEAR
Sub‐regional data: (*2)
Indicator definition

Alertamerica.org: OAS Hemispheric Security Observatory :: Report on Security in the Americas
27
Indicator definitionDefinición del indicador
COUNTRY
2000 2001 2002 2003 2004 2005 2006 2007 2008 2009 2010
Argentina 3.1 2.4 2.3 2.4 2.8
Barbados 3.0 3.6 2.7 5.5 2.4 5.1
Belize 13.0 14.5 12.9 13.9 21.9 15.3 21.6
Brazil 18.1 18.9 19.1 19.9 18.6 18.0 17.7 18.0 18.8 19.1 18.5
Canada 0.5 0.5 0.5 0.5 0.7 0.6 0.6 0.6 0.5 0.5
Colombia 54.3 55.0 58.0 44.1 34.3 28.1 26.9 26.4 24.3 30.8 29.8
Costa Rica 3.4 3.2 3.5 3.5 4.5 4.6
Dominican Republic 6.4 6.6 7.5 9.8 11.8 15.2 18.2 16.6 16.1
Ecuador 11.4 13.1 12.4 13.0
El Salvador 32.0 28.0 27.0 26.5 38.0 50.0 50.5 45.0 39.9 48.0
Grenada 9.1 8.3 8.2 7.1
Guatemala 18.8 21.0 23.2 28.5 29.4 33.4 35.4 35.8 38.3 38.5 34.8
Honduras 26.6 34.6 37.5 49.0 54.4 68.3
Jamaica 22.2 30.3 27.1 26.3 41.9 47.9 37.6 46.3 46.3 47.4 39.8
Mexico 3.6 3.5 2.6 2.9 2.8 3.1 3.4 3.8 4.7 8.0 9.8
Nicaragua 7.1 4.6 5.9
Panama 6.6 7.7 8.6 15.3 19.3 16.2
Paraguay 12.3 9.1 7.8 7.5 7.1
Saint Kitts and Nevis 14.3 12.3 26.0 24.0 35.3 44.2 32.5
Saint Vincent and the Grenadines 14.7 4.6 3.7 18.4 8.3 5.5
Trinidad and Tobago 13.7 20.6 20.3 23.0 32.6 27.3
United States 3.1 3.3 3.3 3.2 3.4 3.4 3.4 3.1 3.0 2.7
Uruguay 2.5 5.5 3.3 2.6 2.8 3.2
AMERICAS (23 countries) (*1)(*2) 10.5 10.8 11.0 10.6 11.2 9.7 11.0 9.8 10.1 11.1 11.0
Caribbean (7 countries) (*3) 10.3 12.0 11.9 13.3 17.5 19.1 19.7 21.5 24.4 23.0 21.2
Central America (7 countries) (*4) 18.6 18.5 18.9 20.4 17.6 25.6 27.8 27.6 30.0 32.8 33.7
North America (3 countries) (*5) 3.1 3.0 2.9 3.0 2.9 3.1 3.2 3.2 3.3 4.0 4.3
South America (6 countries) (*6) 20.8 21.2 21.7 19.6 18.0 15.9 15.5 15.5 15.7 17.0 17.4
Note
(*1) Americas refers to the 23 countries included in this table. (*2) Data calculated for indicated year or nearest available year. (*3) Data for Caribbean includes: Barbados, Dominican Republic, Grenada, Jamaica, Saint Kitts and Nevis, Saint Vincent and the Grenadines, and Trinidad and Tobago. (*4) Data for Central America includes: Belize, Costa Rica, El Salvador, Guatemala, Honduras, Nicaragua, and Panama. (*5)Data for North America includes: Canada, Mexico and The United States. (*6) Data for South America includes: Argentina, Brazil, Chile, Colombia, Ecuador, Paraguay, Peru, and Uruguay.
1.7 INTENTIONAL HOMICIDE COMMITTED BY FIREARM, 2000‐2011 (RATE)
Intentional Homicide means death deliberately inflicted on a person by another person, including infanticide, as reported by the Police. In this case, deaths only committed by firearm are recorded. Some countries with fewer than 100,000 inhabitants have their rates presented for comparative purposes.
YEAR
Sub‐regional data: (*2)
Indicator definition
Alertamerica.org: El Observatorio Hemisférico de Seguridad de la OEA :: Informe Sobre Seguridad en las Américas
28
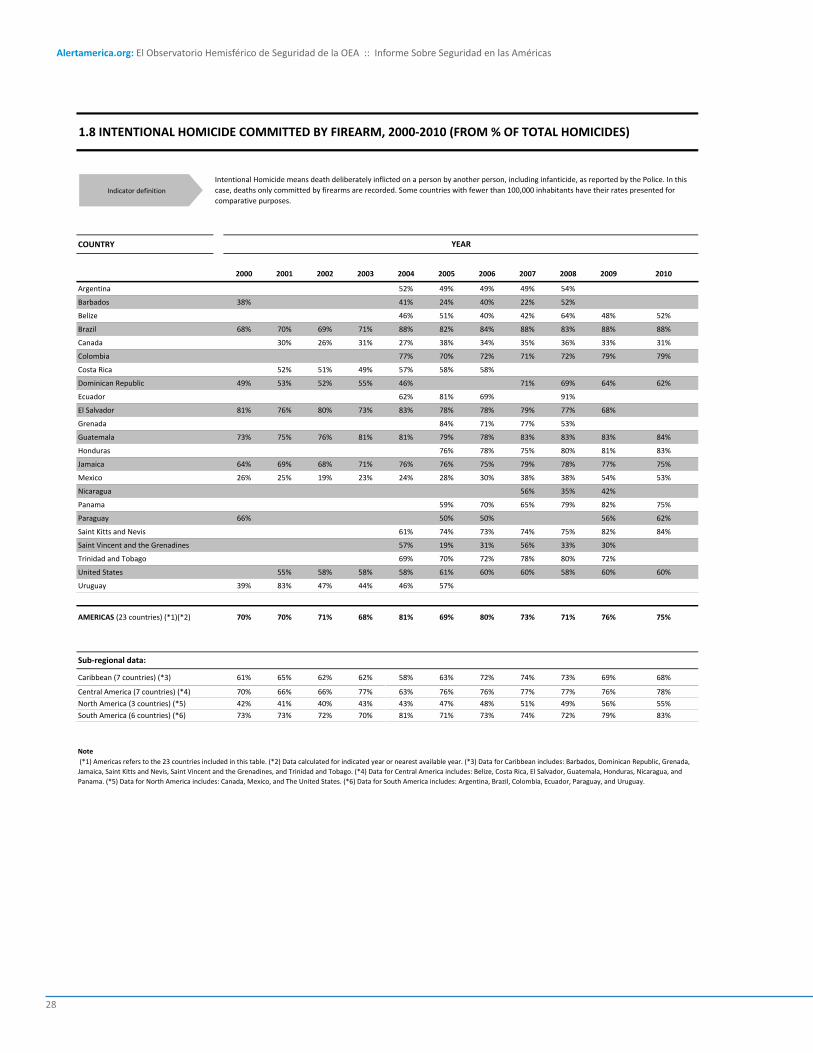
Indicator definitionDefinición del indicador
COUNTRY
2000 2001 2002 2003 2004 2005 2006 2007 2008 2009 2010
Argentina 52% 49% 49% 49% 54%
Barbados 38% 41% 24% 40% 22% 52%
Belize 46% 51% 40% 42% 64% 48% 52%
Brazil 68% 70% 69% 71% 88% 82% 84% 88% 83% 88% 88%
Canada 30% 26% 31% 27% 38% 34% 35% 36% 33% 31%
Colombia 77% 70% 72% 71% 72% 79% 79%
Costa Rica 52% 51% 49% 57% 58% 58%
Dominican Republic 49% 53% 52% 55% 46% 71% 69% 64% 62%
Ecuador 62% 81% 69% 91%
El Salvador 81% 76% 80% 73% 83% 78% 78% 79% 77% 68%
Grenada 84% 71% 77% 53%
Guatemala 73% 75% 76% 81% 81% 79% 78% 83% 83% 83% 84%
Honduras 76% 78% 75% 80% 81% 83%
Jamaica 64% 69% 68% 71% 76% 76% 75% 79% 78% 77% 75%
Mexico 26% 25% 19% 23% 24% 28% 30% 38% 38% 54% 53%
Nicaragua 56% 35% 42%
Panama 59% 70% 65% 79% 82% 75%
Paraguay 66% 50% 50% 56% 62%
Saint Kitts and Nevis 61% 74% 73% 74% 75% 82% 84%
Saint Vincent and the Grenadines 57% 19% 31% 56% 33% 30%
Trinidad and Tobago 69% 70% 72% 78% 80% 72%
United States 55% 58% 58% 58% 61% 60% 60% 58% 60% 60%
Uruguay 39% 83% 47% 44% 46% 57%
AMERICAS (23 countries) (*1)(*2) 70% 70% 71% 68% 81% 69% 80% 73% 71% 76% 75%
Caribbean (7 countries) (*3) 61% 65% 62% 62% 58% 63% 72% 74% 73% 69% 68%
Central America (7 countries) (*4) 70% 66% 66% 77% 63% 76% 76% 77% 77% 76% 78%
North America (3 countries) (*5) 42% 41% 40% 43% 43% 47% 48% 51% 49% 56% 55%
South America (6 countries) (*6) 73% 73% 72% 70% 81% 71% 73% 74% 72% 79% 83%
Note
(*1) Americas refers to the 23 countries included in this table. (*2) Data calculated for indicated year or nearest available year. (*3) Data for Caribbean includes: Barbados, Dominican Republic, Grenada, Jamaica, Saint Kitts and Nevis, Saint Vincent and the Grenadines, and Trinidad and Tobago. (*4) Data for Central America includes: Belize, Costa Rica, El Salvador, Guatemala, Honduras, Nicaragua, and Panama. (*5) Data for North America includes: Canada, Mexico, and The United States. (*6) Data for South America includes: Argentina, Brazil, Colombia, Ecuador, Paraguay, and Uruguay.
1.8 INTENTIONAL HOMICIDE COMMITTED BY FIREARM, 2000‐2010 (FROM % OF TOTAL HOMICIDES)
Intentional Homicide means death deliberately inflicted on a person by another person, including infanticide, as reported by the Police. In this case, deaths only committed by firearms are recorded. Some countries with fewer than 100,000 inhabitants have their rates presented for comparative purposes.
YEAR
Sub‐regional data:
Indicator definition

Alertamerica.org: OAS Hemispheric Security Observatory :: Report on Security in the Americas
29
Indicator definitionDefinición del indicador
COUNTRY
Latest available yearHomicides committed
by firearmHomicide rate committedby firearm (per 100,000)
% of total homicidecommitted by firearm
Argentina 2008 1,113 2.8 54%
Bahamas 2009 52 15.2 61%
Barbados 2008 13 5.1 52%
Belize 2010 67 21.6 52%
Brazil 2010 36,153 18.5 88%
Canada 2010 169 0.5 31%
Colombia 2010 13,549 29.8 78%
Costa Rica 2006 201 4.6 58%
Dominican Republic 2010 1,647 16.1 62%
Ecuador 2008 1,752 13.0 91%
El Salvador 2009 2,957 48.0 68%
Grenada 2008 7 7.1 53%
Guatemala 2010 5,003 34.8 84%
Guyana 2005 4,547 11.4 61%
Honduras 2010 5,198 68.3 83%
Jamaica 2010 1,087 39.8 75%
Mexico 2010 10,854 9.8 53%
Nicaragua 2009 338 5.9 42%
Panama 2010 571 16.2 75%
Paraguay 2010 467 7.1 62%
Saint Kitts and Nevis 2010 17 32.5 84%
Saint Vincent and the Grenadines 2009 6 5.5 30%
Trinidad and Tobago 2009 365 27.3 72%
United States 2005 107 3.2 57%
Uruguay 2009 11,041 38.9 79%
AMERICAS (26 countries) (*1) 2010 (*2) 105,742 12.5 77%
Caribbean (8 countries) (*3) 2010 (*2) 3,194 21.1 67%
Central America (7 countries) (*4) 2010 (*2) 14,336 34.0 77%
North America (3 countries) (*5) 2010 (*2) 19,483 4.3 55%
South America (8 countries) (*6) 2010 (*2) 68,729 20.6 87%
Note
Intentional Homicide means death deliberately inflicted on a person by another person, including infanticide, as reported by the Police. In this case, deaths only committed by firearms are recorded. Some countries with fewer than 100,000 inhabitants have their rates presented for comparative purposes.
Sub‐regional data: (*2)
(*1) Americas refers to the 26 countries included in this table. (*2) Data for 2010 or latest available year. (*3) Data for Caribbean includes: Bahamas, Barbados, Dominican Republic, Grenada, Jamaica, Saint Kitts and Nevis, Saint Vincent and the Grenadines, and Trinidad and Tobago. (*4) Data for Central America includes: Belize, Costa Rica, El Salvador, Guatemala, Honduras, Nicaragua, and Panama. (*5) Data for North America includes: Canada, Mexico and The United States. (*6) Data for South America includes: Argentina, Brazil, Colombia, Ecuador, Guyana, Paraguay, Uruguay, and Venezuela.
1.9 INTENTIONAL HOMICIDE COMMITTED BY FIREARM (LATEST YEAR)
Indicator definition

Alertamerica.org: El Observatorio Hemisférico de Seguridad de la OEA :: Informe Sobre Seguridad en las Américas
30
Indicator definitionDefinición del indicador
COUNTRY
2000 2001 2002 2003 2004 2005 2006 2007 2008 2009
Antigua and Barbuda 2 2 1 1 2 1 1
Argentina 2,807 3,135 3,165 3,270 3,147 3,021 3,128 3,001 3,111 2,900
Bahamas 11 1 3 4 2 5 4
Barbados 10 2 3 1 9 1
Belize 18 22 14 12 20 11 11 8 11 15
Brazil 8,186 9,363 9,494 9,803 10,113 10,048 10,349 10,647 11,134 11,237
Canada 3,600 3,699 3,638 3,769 3,615 3,748 3,526 3,627 3,691
Chile 1,480 1,623 1,594 1,659 1,742 1,679 1,795 1,930 2,168 2,155
Colombia 2,585 2,669 2,630 2,922 3,095 2,841 3,016 3,105 3,196
Costa Rica 244 181 246 280 277 273 308 272 262 279
Dominica 2 5 2 2 2 4 4 2 6 6
Dominican Republic 327 314 301 315 291 601 464 599 617 525
Ecuador 640 711 707 881 1,034 1,123 1,096 1,227 1,105 1,172
El Salvador 642 699 666 758 628 576 517 666 699 653
Grenada 4 1 6 4 1 6 1 3 2
Guatemala 191 207 271 266 260 241 300 361 547 533
Guyana 203 181 203 191 173 206 189 172
Haiti 107
Jamaica 80 73 56 64 42 58 53 50 47
Mexico 3,429 3,663 3,700 3,940 3,878 4,124 4,065 4,211 4,467 4,834
Nicaragua 765 735 756 803 786 633 641 632 657 649
Panama 171 195 196 231 232 196 207 191 201 190
Paraguay 284 289 357 313 406 419 427 392 374 457
Peru 364 396 449 407 385 334 423 741 435
Saint Kitts and Nevis 1 1 1 1 1 1 1
Saint Lucia 14 7 12 10 8 4 2 8
Saint Vincent and the Grenadines 5 8 7 4 4 8 6 11 4 1
Suriname 53 72 69 77 67 72 112 119 147 131
Trinidad and Tobago 166 179 158 144 168 136 142 131 130
United States 29,346 30,504 31,658 31,355 32,235 32,533 33,144 34,380 27,789
Uruguay 586 550 673 647 522 491 553 598 608 548
Venezuela 1,264 1,382 1,299 1,142 1,019 909 757 618 961
AMERICAS (32 countries)(*1)(*2) 57,587 60,996 62,416 63,395 64,283 64,376 65,371 67,836 62,664 62,828
Caribbean (12 countries) (*3) 728 700 655 658 633 931 792 921 928 832
Central America (6 countries) (*4) 2,031 2,039 2,149 2,350 2,203 1,930 1,983 2,129 2,378 2,320
North America (3 countries) (*5) 36,375 37,865 38,997 39,064 39,728 40,405 40,735 42,219 35,947 36,315
South America (11 countries) (*6) 18,453 20,392 20,616 21,325 21,718 21,110 21,862 22,568 23,411 23,363
Note
(*1) Americas refers to the 32 countries included in this table. (*2) Data calculated for indicated year or nearest available year. (*3) Data for the Caribbean includes: Antigua and Barbuda, Bahamas, Barbados, Dominica, Dominican Republic, Grenada, Haiti, Jamaica, Saint Kitts and Nevis, Saint Lucia, Saint Vincent and the Grenadines, and Trinidad and Tobago.(*4) Data for Central America includes: Belize, Costa Rica, El Salvador, Guatemala, Nicaragua, and Panama. (*5) Data for North America includes: Canada, Mexico, and the United States. (*6) Data for South America includes: Argentina, Brazil, Chile, Colombia, Ecuador, Guyana, Paraguay, Peru, Suriname, Uruguay, and Venezuela.
1.10 SUICIDE, 2000‐2009 (TOTAL)
Deaths caused by self‐inflicted and intentional injuries, for people aged five years and older. Original data source: OAS Pan‐American Health Organization Regional Core Health Data System.
YEAR
Sub‐regional data: (*2)
Indicator definition
Alertamerica.org: OAS Hemispheric Security Observatory :: Report on Security in the Americas
31
Indicator definitionDefinición del indicador
COUNTRY
Latest available year
Homicide (TOTAL)
Homicide (Rate
100,000 inh.)
Male Victims (TOTAL)
Male Victims (Rate
100,000male)
Female Victims (TOTAL)
Female Victims (Rate
100,000 female)
Victims aged 15‐
24 (TOTAL)
Victims aged 15‐24 (% of total
victims)
Event of indetermined Intent (*1) (TOTAL)
Event of indetermined Intent (*1) (MALE)
Event of indetermined Intent (*1) (FEMALE)
Antigua and Barbuda 2009 1 1.1 0 0.0 1 2.1 0 0% 0 0 0
Argentina 2009 1,780 4.4 1,514 7.7 266 1.3 560 31% 2,689 2,190 499
Bahamas 2008 77 22.8 70 42.4 7 4.1 20 26% 15 13 2
Barbados 2008 49 19.2 42 33.9 7 5.3 8 16% 12 10 2
Belize 2009 84 27.4 74 47.7 10 6.6 24 29% 19 18 1
Brazil 2009 51,978 26.8 47,713 50.0 4,265 4.3 18,846 36% 13,212 10,257 2,955
Canada 2009 525 1.6 393 2.4 132 0.8 153 29% 17 7 10
Chile 2009 903 5.3 806 9.6 97 1.1 268 30% 127 67 60
Colombia 2008 17,148 38.1 15,721 70.9 1,427 6.3 4,744 28% 2,203 1,729 474
Costa Rica 2009 409 8.9 366 15.7 43 1.9 111 27% 75 60 15
Dominica 2009 1 1.4 0 0.0 0 0.0 1 100% 1 1 0
Ecuador 2009 2,178 16.0 1,988 29.1 190 2.8 537 25% 47 27 20
El Salvador 2009 3,763 61.1 3,294 113.3 469 14.4 1,376 37% 0 0 0
Grenada 2008 1 1.0 0 0.0 1 1.9 0 0% 2 2 0
Guatemala 2008 5,028 36.7 4,473 67.1 555 7.9 1,664 33% 4,057 3,371 686
Guyana 2008 118 15.5 94 24.0 24 6.5 27 23% 60 47 13
Mexico 2009 18,885 17.6 17,051 31.6 1,834 3.3 4,178 22% 2,708 2,286 422
Nicaragua 2009 495 8.6 445 15.7 50 1.7 155 31% 123 106 17
Panama 2009 796 23.0 725 41.6 71 4.1 302 38% 134 119 15
Paraguay 2009 669 10.5 600 18.7 69 2.2 176 26% 98 80 18
Peru 2007 464 1.6 388 2.7 76 0.5 107 23% 1,065 752 313
Saint Kitts and Nevis 2008 13 26.5 13 50.0 0 0.0 7 54% 0 0 0
Saint Vincent and the Grenadines 2009 14 12.8 12 21.8 2 3.7 5 36% 2 2 0
Suriname 2009 36 6.9 29 11.2 7 2.7 4 11% 4 3 1
Trinidad and Tobago 2007 445 33.5 409 63.3 36 5.3 127 29% 71 56 15
United States 2007 18,534 6.1 14,737 9.7 3,797 2.4 5,608 30% 5,339 3,324 2,015
Uruguay 2009 172 5.1 141 8.7 31 1.8 37 22% 17 14 3
Venezuela 2007 9,641 35.1 9,150 65.9 491 3.6 3,964 41% 6,953 6,348 607
AMERICAS (28 countries) 2009 134,207 15.6 120,248 28.0 13,958 3.2 43,009 32% 39,050 30,889 8,163
Caribbean (8 countries) (*2) 2009 601 25.5 546 47.4 54 5.1 168 28% 103 84 19
Central America (6 countries) (*3) 2009 10,575 30.9 9,377 55.8 1,198 6.9 3,632 34% 4,408 3,674 734
North America (3 countries) (*4) 2009 37,944 8.5 32,181 14.2 5,763 2.5 9,939 26% 8,064 5,617 2,447
South America (11 countries) (*5) 2009 85,087 21.9 78,144 40.7 6,943 3.5 29,270 34% 26,475 21,514 4,963
Note(*1) Data source: OAS PAHO/WHO Mortality Information System (updated in June 2011). (*2) Data for the Caribbean includes: Antigua and Barbuda, Bahamas, Barbados, Dominica, Grenada, Saint Kitts and Nevis,Saint Vincent and the Grenadines, and Trinidad and Tobago. (*2) Data for Central America includes: Belize, Costa Rica, El Salvador, Guatemala, Nicaragua and Panama. (*3) Data for North America includes: Canada, Mexico, and the United States.(*4) Data for South America includes: Argentina, Brazil, Chile, Colombia, Ecuador, Paraguay, Peru, Suriname, Uruguay, and Venezuela.
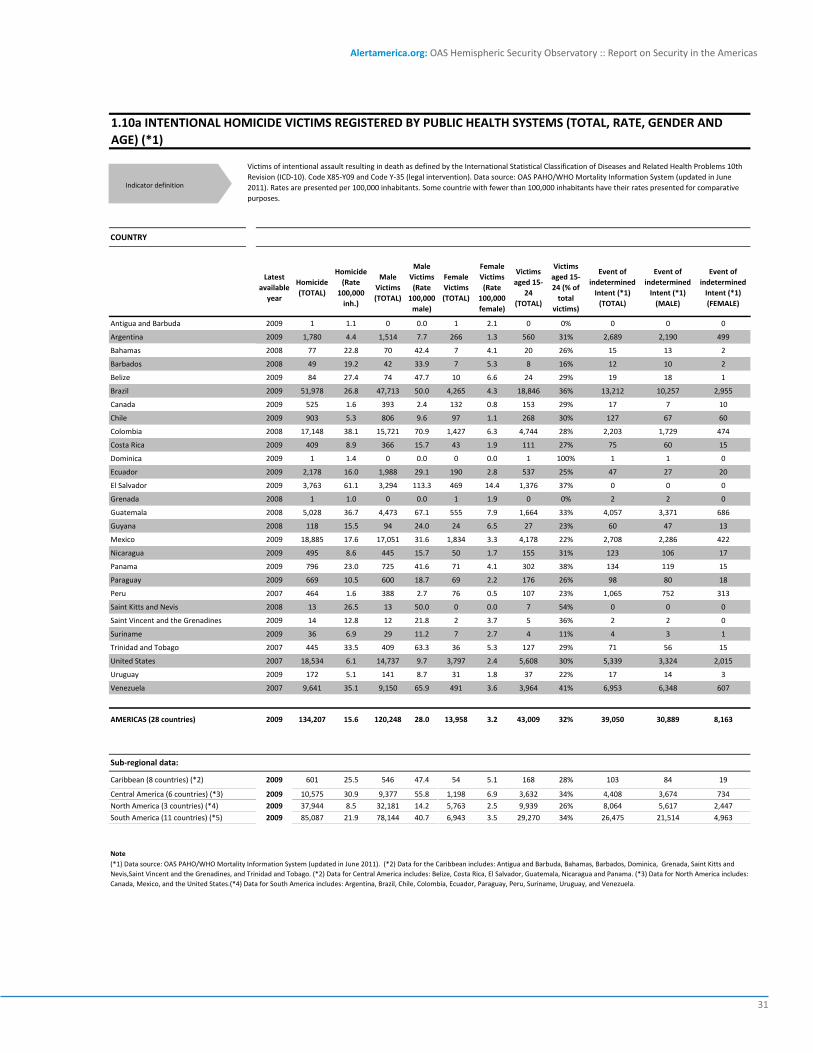
1.10a INTENTIONAL HOMICIDE VICTIMS REGISTERED BY PUBLIC HEALTH SYSTEMS (TOTAL, RATE, GENDER AND AGE) (*1)
Victims of intentional assault resulting in death as defined by the International Statistical Classification of Diseases and Related Health Problems 10th Revision (ICD‐10). Code X85‐Y09 and Code Y‐35 (legal intervention). Data source: OAS PAHO/WHO Mortality Information System (updated in June 2011). Rates are presented per 100,000 inhabitants. Some countrie with fewer than 100,000 inhabitants have their rates presented for comparative purposes.
Sub‐regional data:
Indicator definition

Alertamerica.org: El Observatorio Hemisférico de Seguridad de la OEA :: Informe Sobre Seguridad en las Américas
32
Indicator definitionDefinición del indicador
COUNTRY
2000 2001 2002 2003 2004 2005 2006 2007 2008 2009
Antigua and Barbuda 2.7 2.6 1.3 1.3 2.5 1.2 1.2
Argentina 7.6 8.4 8.4 8.6 8.2 7.8 8.0 7.6 7.8 7.2
Bahamas 3.7 0.3 1.0 1.3 0.6 1.5 1.2
Barbados 4.0 0.8 1.2 0.4 3.5 0.4
Belize 7.2 8.6 5.3 4.5 7.3 3.9 3.8 2.7 3.7 4.9
Brazil 4.7 5.3 5.3 5.4 5.5 5.4 5.5 5.6 5.8 5.8
Canada 11.7 11.9 11.6 11.9 11.3 11.6 10.8 11.0 11.1
Chile 9.6 10.4 10.1 10.4 10.8 10.3 10.9 11.6 12.9 12.7
Colombia 6.5 6.6 6.4 7.0 7.3 6.6 6.9 7.0 7.1
Costa Rica 6.2 4.5 6.0 6.7 6.5 6.3 7.0 6.1 5.8 6.1
Dominica 2.8 7.0 2.8 2.8 2.8 5.6 5.6 2.7 8.2 8.1
Dominican Republic 3.7 3.5 3.3 3.4 3.1 6.3 4.8 6.1 6.2 5.2
Ecuador 5.2 5.7 5.6 6.9 8.0 8.6 8.3 9.2 8.2 8.6
El Salvador 10.8 11.7 11.1 12.6 10.4 9.5 8.5 10.9 11.4 10.6
Grenada 3.9 1.0 5.9 3.9 1.0 5.9 1.0 2.9 1.9
Guatemala 1.7 1.8 2.3 2.2 2.1 1.9 2.3 2.7 4.0 3.8
Guyana 26.8 23.8 26.7 25.0 22.6 27.0 24.7 22.5
Haiti 0.2 0.0 0.0 1.1
Jamaica 3.1 2.8 2.1 2.4 1.6 2.2 2.0 1.9 1.8
Mexico 3.5 3.7 3.7 3.9 3.8 4.0 3.9 4.0 4.2 4.5
Nicaragua 15.0 14.2 14.4 15.1 14.6 11.6 11.6 11.3 11.6 11.3
Panama 5.8 6.5 6.4 7.4 7.3 6.1 6.3 5.7 5.9 5.5
Paraguay 5.3 5.3 6.4 5.5 7.0 7.1 7.1 6.4 6.0 7.2
Peru 1.4 1.5 1.7 1.5 1.4 1.2 1.5 2.6 1.5
Saint Kitts and Nevis 2.3 2.2 2.1 2.1 2.1 2.1 2.0
Saint Lucia 8.9 4.4 7.5 6.2 4.9 2.4 1.2 4.7
Saint Vincent and the Grenadines 4.6 7.4 6.5 3.7 3.7 7.4 5.5 10.1 3.7 0.9
Suriname 11.4 15.2 14.4 15.8 13.6 14.4 22.2 23.3 28.5 25.2
Trinidad and Tobago 12.8 13.8 12.1 11.0 12.8 10.3 10.7 9.9 9.8
United States 10.4 10.7 11.0 10.8 11.0 11.0 11.1 11.4 9.1
Uruguay 17.8 16.6 20.3 19.6 15.8 14.9 16.7 18.0 18.2 16.4
Venezuela 5.2 5.6 5.2 4.5 3.9 3.4 2.8 2.3 3.4
AMERICAS (32 countries)(*1)(*2) 7.2 7.5 7.6 7.6 7.7 7.7 7.7 7.9 7.1
Caribbean (12 countries) (*3) 3.2 3.1 2.8 2.8 2.7 3.9 3.2 3.7 3.7 3.3
Central America (6 countries) (*4) 6.9 6.8 7.1 7.6 7.0 6.0 6.1 6.4 7.1 6.8
North America (3 countries) (*5) 8.9 9.1 9.3 9.2 9.3 9.4 9.4 9.6 8.1 8.1
South America (11 countries) (*6) 5.4 5.9 5.9 6.0 6.1 5.8 6.0 6.1 6.2 6.2
Note (*1) Americas refers to the 32 countries included in this table. (*2) Data calculated for indicated year or nearest available year. (*3) Data for the Caribbean includes: Antigua and Barbuda, Bahamas, Barbados, Dominica, Dominican Republic, Grenada, Haiti, Jamaica, Saint Kitts and Nevis, Saint Lucia, Saint Vincent and the Grenadines, and Trinidad and Tobago.(*4) Data for Central America includes: Belize, Costa Rica, El Salvador, Guatemala, Nicaragua, and Panama. (*5) Data for North America includes: Canada, Mexico, and the United States. (*6) Data for South America includes: Argentina, Brazil, Chile, Colombia, Ecuador, Guyana, Paraguay, Peru, Suriname, Uruguay, and Venezuela.
1.11 SUICIDE, 2000‐2009 (RATE)
Rate per 100,000 inhabitants of deaths caused by self‐inflicted and intentional injuries, for people aged five years and older. Original data source: OAS Pan‐American Health Organization (PAHO) Regional Core Health Data System. Some countries with fewer than 100,000 inhabitants have their rates presented for comparative purposes.
YEAR
Sub‐regional data: (*2)
Indicator definition

Alertamerica.org: OAS Hemispheric Security Observatory :: Report on Security in the Americas
33
COUNTRY
Latest available year
Total SuicidesRate (per 100,000)
Total Male SuicidesMale Suicide
RateMale % of Total
SuicidesTotal Female Suicides
Female Suicide Rate
Female % of Total Suicides
Antigua and Barbuda 2008 1 1.1 1 1.1 100% 0 0 0%
Argentina 2009 2,900 7.2 2,276 11.3 78% 584 2.9 22%
Bahamas 2008 2 0.6 2 1.3 100% 0 0 0%
Barbados 2008 4 1.6 4 3.4 100% 0 0 0%
Belize 2009 15 4.9 11 7.6 78% 4 2.6 22%
Bolivia 2008 142 1.5 111 2.2 78% 39 0.8 22%
Brazil 2009 9,968 5.8 7,643 7.9 77% 2,325 2.4 23%
Canada 2008 3,778 11.1 2,829 16.6 77% 949 5.7 23%
Chile 2009 2,164 12.7 1,748 20.6 81% 416 4.9 19%
Colombia 2008 2,620 5.8 2,146 9.3 82% 563 2.5 18%
Costa Rica 2009 279 6.1 231 10.1 83% 44 1.9 17%
Dominica 2009 1 1.4 1 2.7 100% 0 0 0%
Dominican Republic 2009 552 5.2 428 6.5 82% 124 2.5 18%
Ecuador 2009 1,178 8.6 858 12.6 73% 320 4.7 27%
El Salvador 2009 669 10.6 530 17.2 80% 139 4.5 20%
Grenada 2007 3 2.9 3 5.8 100% 0 0 0%
Guatemala 2009 533 3.8 379 5.4 71% 154 2.2 29%
Guyana 2008 233 31.1 170 44.8 72% 63 16.5 28%
Haiti 2008 110 1.1 70 1.4 66% 40 0.8 34%
Honduras 2008 463 6.1 302 7.8 68% 161 4.4 32%
Jamaica 2008 47 1.7 42 3.09 89% 5 0.4 11%
Mexico 2009 4,876 4.5 3,963 7.3 82% 913 1.7 18%
Nicaragua 2009 652 11.3 474 16.5 73% 178 6.2 27%
Panama 2009 214 5.5 159 9.2 74% 31 1.8 26%
Paraguay 2009 457 7.2 311 9.8 69% 137 4.3 31%
Peru 2008 438 1.5 265 1.8 61% 173 1.2 39%
Saint Kitts and Nevis 2008 1 2.0 1 1.2 100% 0 0 0%
Saint Lucia 2008 8 4.7 7 7.8 84% 1 1.6 16%
Saint Vincent and the Grenadines 2009 1 0.9 1 1.8 100% 0 0 0%
Suriname 2008 75 14.4 63 23.9 85% 12 4.8 15%
Trinidad and Tobago 2008 142 9.8 116 17.9 84% 26 3.9 16%
United States 2008 34,662 11.1 27,205 17.7 80% 7,457 4.9 20%
Uruguay 2010 615 18.2 425 25.5 77% 100 6 23%
Venezuela 2008 1,006 3.4 812 5.5 82% 196 1.4 18%
AMERICAS (34 countries)(*1)(*2) 2009 (*2) 68,809 7.7 53,588 78% 15,153 22%
Caribbean ( 12 countries) (*3) 2009 (*2) 872 3.3 792 6.3 80% 197 1.6 20%Central America (7 countries) (*4) 2009 (*2) 2,825 6.7 2,087 10.0 75% 711 3.4 25%North America (3 countries) (*5) 2009 (*2) 42,249 9.5 33,997 15.3 80% 9,320 4.2 20%South America (12 countries) (*6) 2009 (*2) 23,960 5.9 17,123 8.8 79% 4,927 2.5 21%
Note (*1) Americas refers to the 34 countries included in this table. (*2) Data for 2009 or latest available year. (*3) Data for Caribbean includes: Antigua and Barbuda, Bahamas, Barbados, Dominica, Dominican Republic, Grenada, Haiti, Jamaica, Saint Kitts and Nevis, Saint Lucia, Saint Vincent and the Grenadines, and Trinidad and Tobago. (*4) Data for Central America includes: Belize, Costa Rica, El Salvador, Guatemala, Honduras, Nicaragua, and Panama. (*5) Data for North America includes: Canada, Mexico, and the United States. (*6) Data for South America includes: Argentina, Bolivia, Brazil, Chile, Colombia, Ecuador, Guyana, Paraguay, Peru, Suriname, Uruguay, and Venezuela.
1.12 SUICIDE, COMPARATIVE DATA
Deaths caused by self‐inflicted and intentional injuries, for people aged five years and older. Data Source: OAS Pan‐American Health Organization (PAHO), Regional Core Data Health System.
Sub‐regional data:
Indicator definition

Alertamerica.org: El Observatorio Hemisférico de Seguridad de la OEA :: Informe Sobre Seguridad en las Américas
34
COUNTRY
Latest available year Total fatalities Fatality rate
Antigua and Barbuda 2008 3 3.4
Argentina 2008 3,901 9.8
Bahamas 2008 44 13.0
Barbados 2010 22 8.6
Belize 2009 52 17.3
Bolivia 2008 1,357 14.0
Brazil 2009 46,109 24.0
Canada 2008 2,798 8.4
Chile 2009 2,223 13.2
Colombia 2008 9,453 21.0
Costa Rica 2009 572 12.7
Dominica 2009 6 8.2
Dominican Republic 2009 1,872 18.8
Ecuador 2009 3,897 28.9
El Salvador 2009 1,572 25.6
Grenada 2009 4 3.9
Guatemala 2009 309 2.3
Guyana 2008 133 17.4
Haiti 2008 542 5.5
Honduras 2009 828 11.3
Jamaica 2008 379 14.1
Mexico 2009 16,867 15.9
Nicaragua 2009 1,080 19.1
Panama 2009 501 14.7
Paraguay 2009 1,860 29.8
Peru 2008 3,591 12.5
Saint Kitts and Nevis 2008 10 20.4
Saint Lucia 2009 22 12.9
Saint Vincent and the Grenadines 2009 9 8.3
Suriname 2009 113 21.9
Trinidad and Tobago 2008 225 16.9
United States 2009 33,955 11.2
Uruguay 2009 482 14.5
Venezuela 2008 7,714 27.6
AMERICAS (34 countries)(*1)(*2) 2009 142,505 15.9
Caribbean (12 countries) (*3) 2008 3,138 12.4
Central America (7 countries) (*4) 2009 4,914 11.8
North America (3 countries) (*5) 2009 53,620 12.0
South America (12 countries) (*6) 2009 81,159 20.9
Note(*1) Americas refers to the 34 countries included in this Table. (*2) Data calculated for indicated year or nearest available year.(*3) Data for the Caribbean includes: Antigua and Barbuda, Bahamas, Barbados, Dominica, Dominican Republic, Grenada, Haiti, Jamaica, Saint Kitts and Nevis, Saint Lucia, Saint Vincent and the Grenadines, and Trinidad and Tobago. (*4) Data for Central America includes: Belize, Costa Rica, El Salvador, Guatemala, Honduras, Nicaragua, and Panama. (*5) Data for North America includes: Canada, Mexico, and the United States. (*6) Data for South America includes: Argentina, Bolivia, Brazil, Chile, Colombia, Ecuador, Guyana, Paraguay, Peru, Suriname, Uruguay, and Venezuela.
1.13 TRAFFIC AND TRANSPORT FATALITIES, LATEST AVAILABLE YEAR
Represents deaths by injuries as a result of an unexpected incident occurring through the movement or collision of vessels, vehicles or persons along a land, water, air or space route, including motor vehicle traffic accidents and other transport accidents.
Sub‐regional data: (*2)
Indicator definition

Alertamerica.org: OAS Hemispheric Security Observatory :: Report on Security in the Americas
35
El Sistema Regional de Indicadores Estandarizados de Convivencia y Seguridad Ciudadana (SES), es un Proyecto ejecutado con recursos del Banco Interamericano de Desarrollo, y que cuen-ta con la participación de 15 países socios y dos ciudades capitales del hemisferio. Esta iniciativa viene trabajando desde el 2008 con la facilitación del Instituto CISALVA de la Universidad del Valle (Cali, Colombia) y la co-ejecución del Departamento Nacional de Planeación (DNP – Colombia), con el fin de avanzar en acciones concretas para mejorar los sistemas de información y la promo-ción de metodologías de trabajo que articulen a las instituciones y a los tomadores de decisiones. En este momento, el Proyecto cuenta con socios estratégicos como OEA, UNODC y SICA.
Este proceso ha logrado estructurar una red regional de más de 180 instituciones na-cionales, responsables del tema de convivencia y seguridad ciudadana. En cada país socio se constituyen Sub Unidades Técnicas (SUT), bajo la coordinación del Ministerio o Secretaría de Es-tado responsable del tema. Este es un grupo de trabajo ad hoc compuesto por representantes de la Policía Nacional, el Ministerio Público, los Institutos Nacionales de Censos y Estadísticas, el Ministerio/Secretaría de Salud, responsables de la búsqueda de soluciones a los temas de: mor-talidad, criminalidad, violencia intrafamiliar y convivencia.
A partir de ahí, se ha realizado un trabajo nacional y regional para la estandarización de conceptos, la definición de protocolos para la captura de información y el reporte de datos estadís-ticos y comparables para 12 indicadores de registro administrativo. En el tema de encuestas, se diseñaron tres cuestionarios con sus respectivos manuales para los temas de: i) Victimización y percepción de inseguridad; ii) Violencia intrafamiliar/familiar/doméstica; y iii) Violencia sexual.
Finalmente, el SES ha sido un escenario de intercambio de conocimiento, en tanto las in-stituciones de cada país han podido compartir sus buenas prácticas sobre los procesos de me-joramiento de la información en distintos niveles. Con este propósito se han realizado reuniones regionales con sectores especializados de Policías, Ministerios Públicos, Institutos Nacionales de Estadísticas e Ingenieros de Sistemas.
Este Proyecto avanzará en la consolidación de la información como insumo para la imple-mentación, monitoreo y evaluación de políticas públicas para lo cual se trabaja en indicadores de segunda generación que permitan un mejor uso de los datos.
Para más información visite la página Web: www.seguridadyregion.com
Por María Isabel Gutiérrez Martínez,PhD., Directora del Instituto CISALVA, Universidad del Valle.
Contacto: [email protected], [email protected]
PoR un sIsTeMa RegIonalDe InDIcaDoRes


PosesIón De aRMasfIReaRMs

Alertamerica.org: El Observatorio Hemisférico de Seguridad de la OEA :: Informe Sobre Seguridad en las Américas
38
Brasil bajó las muertes por armas de fue-go de 39.284 homicidios dolosos registrados en 2003 a 34.300 en 2010, según datos de su Ministerio de Justicia, lo que permitió salvar la vida de 5.000 personas. Si consideramos los índices ascendientes de las muertes hasta 2003, la merma fue del 18 por ciento.
Brasil es el quinto mayor exportador de ar-mas livianas a nivel internacional, y es responsa-ble por el 13 por ciento de las muertes por arma de fuego en el mundo, a pesar de contar con sólo el 2,8 por ciento de la población mundial1. De hecho, en números absolutos, Brasil es el país donde se producen más muertes por armas de fuego, mientras que ocupa el quinto lugar en números relativos. Según el centro de investiga-ciones Viva Rio, circulan en mi país cerca de 16 millones de armas, de las cuales más de la mi-tad son ilegales. A pesar de los índices negativos, esta triste situación se está revirtiendo, gracias a la implementación de una serie de medidas de control sobre estos productos letales.
nueVa ley De aRMasy MunIcIones
La primera medida fue el cambio de la Ley de Armas con la promulgación del Estatuto del Desarme en 2003 2 después de una movilización 1 Bandeira, Antonio y Bourgeois, Josephine. Armas de Fue-go: ¿Protección o Riesgo? Estocolmo, Foro Parlamentario In-ternacional, 2006, p. 18, acceso en :http://www.comunidadesegura.org/files/active/0/armas%20de%20fogo%20protecao%20ou%20risco_esp.pdf2 Estatuto do Desarmamento , Brasília, 2003 (atualizado) :http://www.planalto.gov.br/ccivil_03/Leis/2003/L10.826.htm
popular liderada por las ONGs y las iglesias, que presionaron al Parlamento para que la aprobara.
Gracias a esta iniciativa, se prohibió el porte de armas para civiles, se aumentó la edad míni-ma para comprar armas a 25 años, se reglamen-taron 15 exigencias para la compra de armas -tales como certificado psicológico y certificado de manejo de armas- y se pasó parte del control ejercido por el Ejército (herencia en Latinoaméri-ca de los “años de plomo”) a la Policía. También se centralizó la información sobre armamento en un banco nacional de datos y se pasó a marcar la munición vendida a la Policía y las Fuerzas Arma-das (ahora se discute la marcación de toda muni-ción, para tornar más factible su rastreo).
En tanto, la población participó de un de-
bate nacional alimentado por los medios de co-municación sobre los resultados de las investiga-ciones realizadas por la ONG Viva Río. La misma incluyó el impacto que tienen las armas en la salud pública y la victimización, el uso indebido de armas para defensa (las armas son buenas para atacar y poco pueden hacer contra el fac-tor sorpresa de un asalto), las fuentes de desvío de armas y municiones, y el perfil de las armas incautadas. Es decir, con conocimiento científico se llevó a cabo una sensibilización contra los mi-tos de las sociedades arcaicas y se presentaron estadísticas contra argumentos puramente ideo-
conTRolDe aRMas en bRasIl y agenDa RegIonal
Por: Antônio Rangel Bandeira Sociologo y cordinador de “Viva Rio Disarmament Project”

Alertamerica.org: OAS Hemispheric Security Observatory :: Report on Security in the Americas
39
lógicos a favor de que los civiles usen armas. Al finalizar el debate público que se realizó bajo la influencia del poderoso lobby de la industria ar-mamentista, apenas el 8 por ciento de la pobla-ción apoyó la nueva Ley de Armas.
DesTRuccIón PúblIcaDe aRMas
En el proceso de movilización a favor del cam-bio legal, Brasil se hizo eco del pedido de Naciones Unidas (ONU) para que los países destruyeran en actos públicos sus excedentes de armas. Poco antes de la Conferencia de la ONU sobre Tráfico Internacional de Armas, en julio de 2001, el go-bierno de Río de Janeiro promovió la destrucción pública de 100 mil armas, logrando sensibilizar a la población sobre el riesgo de usar armas, y alertando a las demás autoridades sobre la inse-guridad de los depósitos de armas incautadas.
caMPañas VolunTaRIasDe canje De aRMas
Otra medida contra la violencia armada fue la realización de una gran campaña nacional de canje voluntario de armas. Una vez más, el de-bate público a partir de datos científicos sobre el universo oscuro de las armas llevó a que se entregaran y destruyeran un total de 459.855 armas en el período 2004-2005. Según el Minis-terio de Salud, el retiro de circulación de medio
millón de armas (menos armas, menos muertes, indican los estudios), combinado con la prohibi-ción del porte de armas en la calle, y la reforma de la Policía de São Paulo, disminuyó los homici-dios con armas de fuego significativamente, tal como lo mencionamos antes.
En São Paulo la reducción fue mayor al 50 por ciento de las muertes por armas de fuego, gracias a la combinación del desarme con la mo-dernización de las corporaciones policiales. Es interesante recordar que cuando Australia -en 1996- realizó la mayor campaña de desarme vo-luntario que haya existido, recogiendo 700 mil ar-mas, la reducción de los homicidios por armas de fuego bajó un 43 por ciento en los años siguientes a la campaña. ¿Por qué una reducción tan drás-tica?. Porque la policía ya era eficiente, y el pro-blema de las muertes se debía más que nada a la proliferación de armas automáticas en el país.
La principal característica de la campaña en Brasil fue la participación de la sociedad civil, sobre todo iglesias, ONGs, sindicatos, masone-ría, asambleas comunitarias, etcétera. Se insta-laron puestos de entrega de armas y municiones, dando más confianza a quienes no confían en la policía, y se inutilizaron las armas en el acto de entrega, con el uso de una maza, método barato y eficiente, que acaba con el riesgo de desvío y ofrece más seguridad. Se pagó por las armas de-pendiendo de su calibre, entre 50 y 150 dólares estadounidenses, con total anonimato y amnistía para las armas ilegales (Australia y Haití pagaron

Alertamerica.org: El Observatorio Hemisférico de Seguridad de la OEA :: Informe Sobre Seguridad en las Américas
40
demasiado, y con la plata se compraron armas nuevas).
En el período 2008-2009, el gobierno bra-sileño realizó una nueva campaña con la policía pero sin la participación de la sociedad civil, y el resultado fue un fiasco: apenas 30.721 armas entregadas. En 2011, un mes después de la ma-sacre de la escuela de Realengo en abril pasado, en que un ex -alumno asesinó a 12 adolescentes, el gobierno lanzó otra nueva campaña, esta vez con la participación de la sociedad civil, y que se encuentra en plena realización. Antes de lanzar-la, se realizó un seminario internacional con los coordinadores de las campañas voluntarias de canje de armas recientes consideradas más exi-tosas, analizándose las experiencias de Angola, Argentina, Colombia, Mozambique y Brasil.
conTRol PaRlaMenTaRIo De aRMas y MunIcIones
Otra nueva medida de control de armas fue
el funcionamiento de una Comisión Parlamenta-ria de Investigación (CPI) en el Parlamento Bra-sileño sobre el tráfico ilícito de armas en el país. Con el apoyo técnico de los expertos de Viva Rio, la comisión recorrió las fronteras terrestres de Brasil, identificando los puntos de contrabando de armas y municiones, que entran principal-mente a través de Paraguay, Bolivia, Suriname, Argentina y Uruguay.3
Motivado por la importancia del estudio, el PARLATINO encomendó a Viva Rio la constitución de un equipo internacional de expertos para ela-borar una ley marco, que sirviera como fuente de inspiración para los países que deseasen perfeccio-nar su legislación de control de armas y municio-nes. Fue entonces que se redactó el Proyecto de Ley Marco de Armas de Fuego, Munición y Ma-teriales Relacionados.4 Asimismo, se obligó a los 3 Vecindario Bajo Observación, Dreyfus, Pablo, y Bandeira, Antonio, Viva Rio, Rio, 2006 :http://www.comunidadesegura.org/files/active/0/Observan-do_Vecindario_esp.pdf4 Proyecto de Ley Marco de Armas de Fuego, Muni-ción y Materiales Relacionados, Foro Parlamentario Interna-cional/CLAVE, Montevideo, 2006 :http://www.comunidadesegura.org/files/active/0/Proyec-
fabricantes brasileños de armas a identificar al primer comprador de una muestra de 36 mil ar-mas incautadas por la policía de Río de Janeiro, de los cuales fueron identificadas 15 mil. De este modo, se revelaron las principales fuentes del cri-men organizado de Río: las armerías (deficiente-mente controladas), las empresas de seguridad privadas, armas privadas de militares y policías (compradas a precio de fábrica y revendidas en el mercado ilegal) y las propias policías. También se creó una Subcomisión de Control de Armas y Municiones del Parlamento de carácter perma-nente, que pasó a fiscalizar la implementación de la nueva ley, a realizar investigaciones sobre armas y municiones y a proponer nuevas medi-das de control. Si bien ya existían comisiones par-lamentarias específicas de control de armas en algunos países (como Suecia, Canadá, Estados Unidos y España) estas son importantes porque las comisiones parlamentarias de defensa, o de seguridad pública, son dominadas por el lobby de las armas y se dedican más al comercio de armas convencionales, mientras que las armas pequeñas no son debidamente consideradas. El documento final de la mencionada CPI es un ana-lisis pionero y ejemplar sobre el universo poco co-nocido del tráfico ilegal de armas en un país. 5
to%20Ley%20Marco%20Armas%20Parlatino.pdf5 Relatório da CPI do Tráfico Ilícito de Armas, Congresso Nacional, Brasília, 2006 :Relatório Específico del Diputado Jungmann (contiene el esencial):

Alertamerica.org: OAS Hemispheric Security Observatory :: Report on Security in the Americas
41
RankIng De las PRoVIncIas en el conTRol De aRMaMenTo
La Subcomisión de Control de Armas del Parlamento determinó que la policía de cada una de los 27 Estados de Brasil, además de los Tribu-nales Judiciales provinciales, informara sobre las armas y municiones incautadas en cada Estado. Como resultado se obtuvieron cerca de 300 mil informes sobre armas incautadas en los últimos 10 años en todo Brasil, que fueron analizadas por Viva Río estableciendo el tipo, la nacionali-dad y otras características de cada arma ilegal.
El análisis minucioso acabó con uno de los mitos que involucran los fuertes intereses del comercio de estos productos. Se comprobó que menos del 10 por ciento de las armas ilegales en Brasil son de fabricación extranjera, es decir, que la industria brasileña y el comercio nacional, mal fiscalizados, cuentan con una fuerte responsabi-lidad en el tráfico ilícito de armas y municiones en el país, y por supuesto, también sectores del gobierno que no fiscalizan ese mercado millo-http://www.comunidadesegura.org/files/active/0/Relato-rio%20sub-relatoria%20de%20industria%20comercio%20e%20cac.pdf
nario de manera eficiente. Los resultados de la encuesta aplicada a todas los Estados incluyeron preguntas sobre los mecanismos de control de armas y municiones, las condiciones de depósito de armas incautadas, el entrenamiento de poli-cía, la capacidad de producir buenos datos sobre armamento, la aplicación de la nueva Ley de Ar-mas, la participación popular en la campaña de desarme, la eficiencia en la incautación de arma-mento y otros indicadores de la política de control de armas por cada gobierno estatal.
Al final, se elaboró un Ranking de los Esta-dos en el Control de Armas,6 en que se destacó a los gobiernos que están en la vanguardia del control de armas (Brasilia, Río de Janeiro y São Paulo), así como los que tienen peor desempeño, promoviendo una competición virtuosa, difundien-do las buenas prácticas y exponiendo las defi-ciencias de cada policía estatal; para que reciban ayuda técnica y financiera del gobierno federal. Asimismo, el Ranking realizado por la experta Rebecca Peters, comparando los Estados de Es-tados Unidos cuanto a la aplicación de buenos principios de control de armas, los relacionó a un modelo ideal de 13 mecanismos de control.7
caMPaña De legalIzacIónDe aRMas
Al final de la campaña de entrega voluntaria de armas, en octubre de 2005, en Brasil se rea-lizó un referendo para prohibir la venta de armas para civiles, basada en que buena parte de las armas ilegales fueron hurtadas o robadas a ciu-dadanos de bien (sólo en 2003, más de 27 mil armas fueron robadas de residencias).
6 Nascimento, Marcelo y Purcena, Julio Cesar. Ranking dos Estados no Controle de Armas. Rio de Janeiro, VivaRio/Minis-tério da Justiça, 2010 :http://www.vivario.org.br/publique/media/Ranking_dos_es-tados_no_controle_de_armas.pdf7 Peters, Rebecca. Gun Control in the Unitede States – a Comparative Survey of State Firearms Laws. Nueva York: Open Society Institute´s Center on Crime, Communities and Culture, Soros Foundation. 2000, in Bandeira, Antonio y Bourgeois, Josephine, op. cit. p. 76.
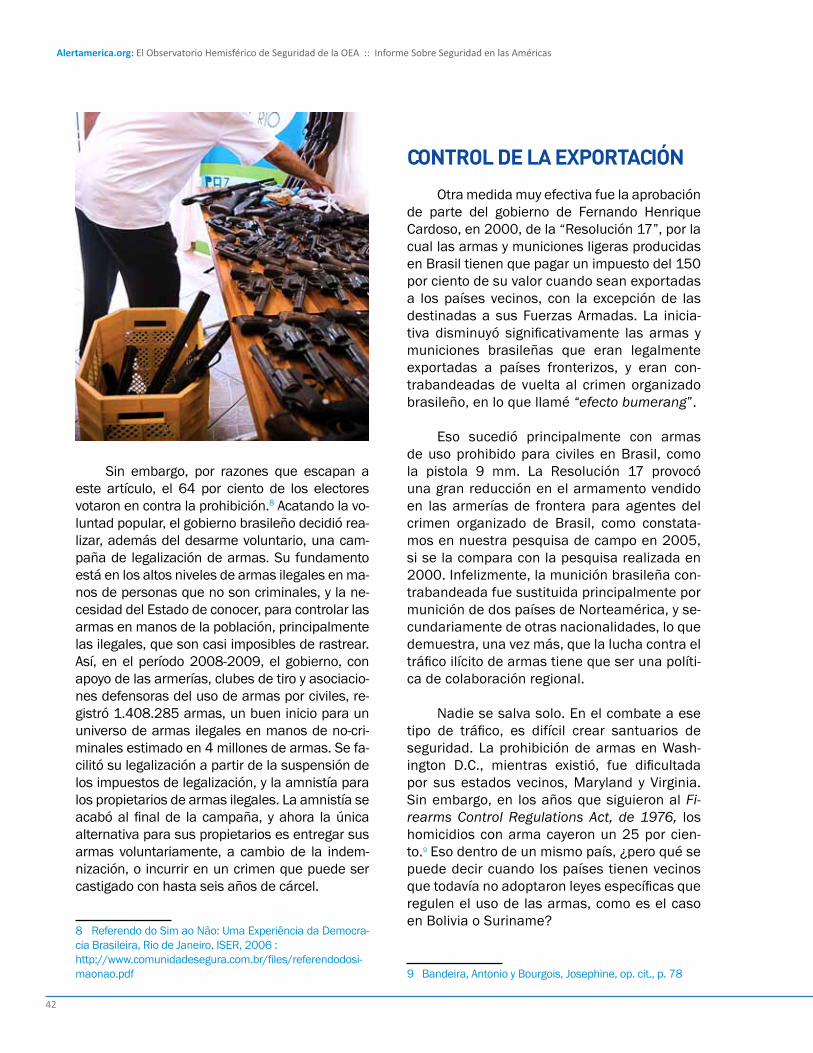
Alertamerica.org: El Observatorio Hemisférico de Seguridad de la OEA :: Informe Sobre Seguridad en las Américas
42
Sin embargo, por razones que escapan a este artículo, el 64 por ciento de los electores votaron en contra la prohibición.8 Acatando la vo-luntad popular, el gobierno brasileño decidió rea-lizar, además del desarme voluntario, una cam-paña de legalización de armas. Su fundamento está en los altos niveles de armas ilegales en ma-nos de personas que no son criminales, y la ne-cesidad del Estado de conocer, para controlar las armas en manos de la población, principalmente las ilegales, que son casi imposibles de rastrear. Así, en el período 2008-2009, el gobierno, con apoyo de las armerías, clubes de tiro y asociacio-nes defensoras del uso de armas por civiles, re-gistró 1.408.285 armas, un buen inicio para un universo de armas ilegales en manos de no-cri-minales estimado en 4 millones de armas. Se fa-cilitó su legalización a partir de la suspensión de los impuestos de legalización, y la amnistía para los propietarios de armas ilegales. La amnistía se acabó al final de la campaña, y ahora la única alternativa para sus propietarios es entregar sus armas voluntariamente, a cambio de la indem-nización, o incurrir en un crimen que puede ser castigado con hasta seis años de cárcel.
8 Referendo do Sim ao Não: Uma Experiência da Democra-cia Brasileira, Rio de Janeiro, ISER, 2006 :http://www.comunidadesegura.com.br/files/referendodosi-maonao.pdf
conTRol De la exPoRTacIón
Otra medida muy efectiva fue la aprobación de parte del gobierno de Fernando Henrique Cardoso, en 2000, de la “Resolución 17”, por la cual las armas y municiones ligeras producidas en Brasil tienen que pagar un impuesto del 150 por ciento de su valor cuando sean exportadas a los países vecinos, con la excepción de las destinadas a sus Fuerzas Armadas. La inicia-tiva disminuyó significativamente las armas y municiones brasileñas que eran legalmente exportadas a países fronterizos, y eran con-trabandeadas de vuelta al crimen organizado brasileño, en lo que llamé “efecto bumerang”.
Eso sucedió principalmente con armas de uso prohibido para civiles en Brasil, como la pistola 9 mm. La Resolución 17 provocó una gran reducción en el armamento vendido en las armerías de frontera para agentes del crimen organizado de Brasil, como constata-mos en nuestra pesquisa de campo en 2005, si se la compara con la pesquisa realizada en 2000. Infelizmente, la munición brasileña con-trabandeada fue sustituida principalmente por munición de dos países de Norteamérica, y se-cundariamente de otras nacionalidades, lo que demuestra, una vez más, que la lucha contra el tráfico ilícito de armas tiene que ser una políti-ca de colaboración regional.
Nadie se salva solo. En el combate a ese tipo de tráfico, es difícil crear santuarios de seguridad. La prohibición de armas en Wash-ington D.C., mientras existió, fue dificultada por sus estados vecinos, Maryland y Virginia. Sin embargo, en los años que siguieron al Fi-rearms Control Regulations Act, de 1976, los homicidios con arma cayeron un 25 por cien-to.9 Eso dentro de un mismo país, ¿pero qué se puede decir cuando los países tienen vecinos que todavía no adoptaron leyes específicas que regulen el uso de las armas, como es el caso en Bolivia o Suriname?
9 Bandeira, Antonio y Bourgois, Josephine, op. cit., p. 78

Alertamerica.org: OAS Hemispheric Security Observatory :: Report on Security in the Americas
43
agenDa RegIonal
El tráfico de armas y de municiones es un fe-nómeno supranacional, lo que exige una agenda compatible, que supere el nacionalismo estrecho y las pequeñas rivalidades. La agenda es clara, pero en gran medida sigue en el papel: acuerdos bilaterales, regionales e internacionales (como el Tratado sobre el Comercio de Armas - ATT), son más que nunca necesarios, para que se establez-ca una relación de colaboración e intercambio de informaciones entre las policías. Esto es difícil que suceda en determinadas subregiones de nuestro continente, por rivalidad y desconfianza de los servicios de inteligencia nacionales. Ade-más, la implementación efectiva de los acuerdos ya firmados es otra prioridad, así como las cam-pañas de legalización y de desarme voluntario,
Antônio Rangel bandeira Sociólogo y cordinador de“Viva Rio Disarment Project”
Antônio Rangel Bandeira (n. Brasil) obtuvo títulos de posgrado en Sociología Política por la Univer-sidad de York (Toronto) y la Universidad de Bran-deis (Boston), antes de dirigir los departamentos de Política y Sociología de la Universidad Católica de Río de Janeiro y la Universidad Técnica de Lis-boa. Como teniente de la reserva en el Ejército de Brasil, el Sr. Bandeira fué instructor de armas de fuego en la Escuela de Formación de Infantería. En la actualidad coordina el Proyecto de Control de Armas de Viva Río, organización no gubernamental que promueve una cultura de paz y promueve la inclusión social en Brasil. El Sr. Bandeira ha publicado numerosos libros y artículos sobre Armas Pe-queñas y Ligeras incluido Firearms: Protection or Risk?: One Hundred Questions and An-swers (2005).
la realización de investigaciones serias sobre el oscuro universo del comercio legal e ilegal de ar-mas, y el perfeccionamiento de las leyes nacio-nales de control, teniendo la citada Ley Marco como inspiración, que rescata lo que hay de más avanzado en el tema. También se debe trabajar en la armonización de las leyes nacionales de armas, una vez que las leyes tibias abren el ca-mino al contrabando para los países con buena legislación, también hay que unificar a los órga-nos nacionales de control de armas, normalmen-te fraccionados y competitivos, y se debe cons-truir un banco de datos de calidad que permita la centralización de la información sobre armas y municiones, en que el nuevo Banco de Datos del Observatorio de Seguridad Hemisférica de la OEA surge como una iniciativa de extrema impor-tancia. Con la palabra la OEA.

Alertamerica.org: El Observatorio Hemisférico de Seguridad de la OEA :: Informe Sobre Seguridad en las Américas
44
COUNTRY
Latest available year Total registered firearms Rate per 100,000 inhabitants
Antigua and Barbuda 2010 1,671 1,878
Argentina 2010 1,240,000 3,049
Brazil 2010 5,900,000 3,019
Canada 2010 7,621,150 22,488
Chile 2005 695,968 4,271
Colombia 2006 706,210 1,640
Costa Rica 2006 148,000 3,367
Ecuador 2006 117,000 886
El Salvador 2009 215,000 3,489
Guatemala 2006 253,514 1,946
Guyana 2007 56,000 7,330
Haiti 2006 20,379 213
Honduras 2006 151,003 2,147
Jamaica 2006 65,000 2,441
Mexico 2006 2,824,231 2,710
Nicaragua 2006 90,133 1,631
Panama 2006 65,436 1,990
Paraguay 2006 330,000 5,697
Peru 2005 270,041 970
Suriname 2006 30,000 5,941
Trinidad and Tobago 2006 7,801 590
Uruguay 2010 450,000 13,345
AMERICAS (22 countries)(*1) (*2) 2010 21,258,537 3,951
Caribbean (4 countries) (*3) 2010 94,851 695
Central America (6 countries) (*4) 2010 923,086 2,341
North America (2 countries) (*5) 2010 10,445,381 7,563
South America (10 countries) (*6) 2010 9,795,219 2,824
Note(*1) Americas refers to the 22 countries included in this table. (*2) Data for 2010 or latest available year. (*3) Data for Caribbean includes: Antigua and Barbuda, Haiti, Jamaica, and Trinidad and Tobago. (*4) Data for Central America includes: Costa Rica, El Salvador, Guatemala, Honduras, Nicaragua, and Panama. (*5) Data for North America includes: Canada and Mexico. (*6) Data for South America includes: Argentina, Brazil, Chile, Colombia, Ecuador, Guyana, Paraguay, Peru, Suriname, and Uruguay.
2.14 LEGALLY REGISTERED CIVILIAN FIREARMS, LATEST AVAILABLE YEAR
Sub‐regional data: (*2)
Number of legally‐registered firearms in hands of the civilian population.Indicator definition
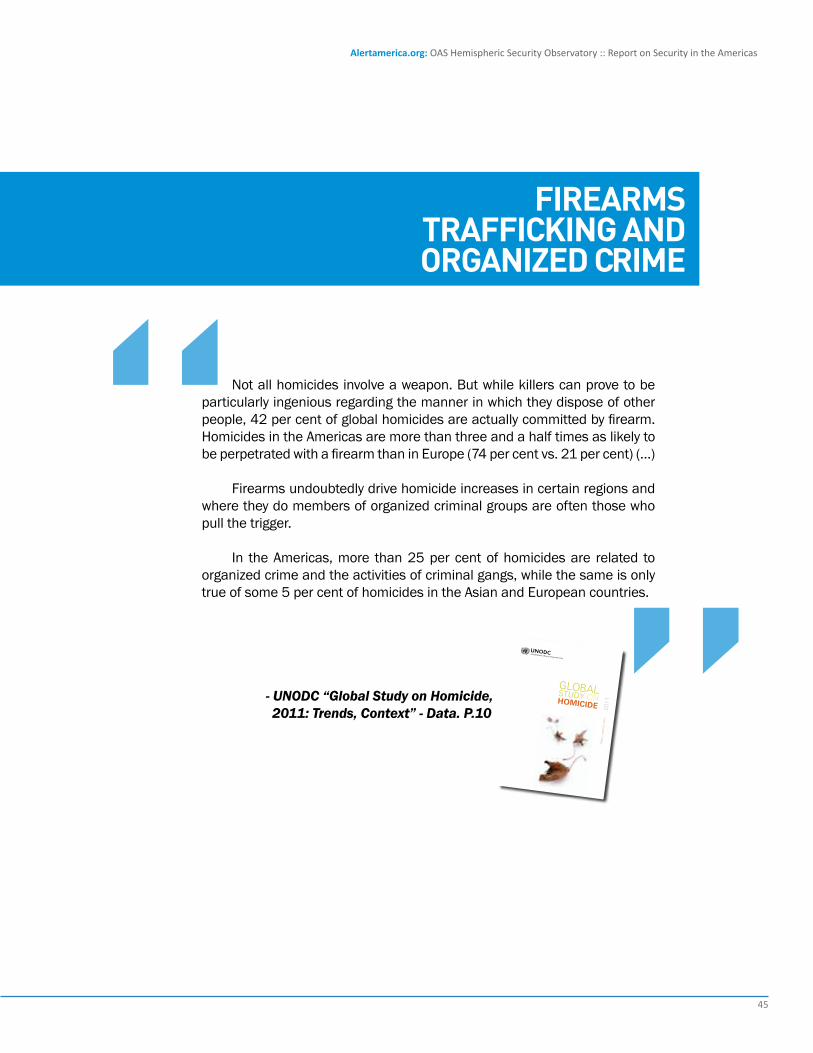
Alertamerica.org: OAS Hemispheric Security Observatory :: Report on Security in the Americas
45
Not all homicides involve a weapon. But while killers can prove to be particularly ingenious regarding the manner in which they dispose of other people, 42 per cent of global homicides are actually committed by firearm. Homicides in the Americas are more than three and a half times as likely to be perpetrated with a firearm than in Europe (74 per cent vs. 21 per cent) (…)
Firearms undoubtedly drive homicide increases in certain regions and where they do members of organized criminal groups are often those who pull the trigger.
In the Americas, more than 25 per cent of homicides are related to organized crime and the activities of criminal gangs, while the same is only true of some 5 per cent of homicides in the Asian and European countries.
- UNODC “Global Study on Homicide, 2011: Trends, Context” - Data. P.10
fIReaRMs TRaffIckIng anD oRganIzeD cRIMe
2011
TR
EN
DS
/ C
ON
TE
XT
S /
DA
TA
GLOBAL STUDY ONHOMICIDE


DelITos sexualessexual offenses

Alertamerica.org: El Observatorio Hemisférico de Seguridad de la OEA :: Informe Sobre Seguridad en las Américas
48
Violence against women is one of the most staggering and pressing human rights issues in Latin America and the Caribbean. It is rooted in deep cultural practices, in developed contexts of inequality, poverty, gender differentials and general disparities resulting in different forms of exclusion being the rule. These conditions create an embryonic scenario for a culture of violence which is not easy to diffuse.
The data, where available, is alarming. In Latin America, 33.1 per cent of the population is poor and 13.3 per cent is currently living in condi-tions of extreme poverty. This recent data shows that poverty continues to fall in Latin America. In-deed, in 2002, poverty was at 44 per cent and extreme poverty at 19.4 per cent.
Although this information shows signs of im-provement in the living conditions of the inhabi-tants of this region, problems in terms of income distribution remain and more women live in con-ditions of poverty and extreme poverty. The fema-le population of Latin America and the Caribbean participate less in the workforce than the male population and, as a consequence, suffer higher rates of unemployment. The average income for women in Latin America is equal to 69 per cent of the income of men in the workforce; these per-centages are similar for men and women in the Caribbean.
Levels of unwanted pregnancy, are high in the entire region. Maternal mortality statistics in-dicate that there has been some improvement in this regard in Latin America and the Caribbean. In 2000 there were 110 deaths per 100,000 live births, while in 2008 it was 85/1000,000. It cannot be denied that there have been some ad-vancements, for instance, some countries have enacted and implemented Reproductive Health and Rights laws, yet too many others still retain their archaic restrictive legislation thereby endan-gering the good health and safety of too many woman. Also, though women attain higher levels of education than men—income differentials and disparities between men and women still exist in the entire region. The situation is therefore quite discouraging. The Economic Commission for La-tin America and the Caribbean (ECLAC) conclu-ded that the representation of women in the “de-cision-making spheres is extremely low and most are almost exclusively occupied in labor associa-ted with care and reproduction. The situation is even more serious for most women who are poor, indigenous or of African descent due to the high level of vulnerability they experience. Gender vio-lence, however, knows no social boundaries, and although it is empowered by poverty, it is a univer-sal evil crossing all educational and social levels.”
WoMen’s RIgHTs In laTIn aMeRIca anD THe caRIbbean: cHallenges anD PeRsPecTIVes
By: Margarette May MacaulayJudge, Inter-American Court of Human Rights
Alejandra Negrete Morayta Lawyer, Inter-American Court of Human Rights

Alertamerica.org: OAS Hemispheric Security Observatory :: Report on Security in the Americas
49
Existing data clearly show that women are in a vulnerable situation in Latin America and the Caribbean. Inequality and poverty often forces women to depend on the income of men, which puts them in a position where they are more likely to suffer abuse and violence. But as the ECLAC report concluded, this violence knows no social boundaries. It is an irrefutable fact that human rights violations impact some more than others: those who have the means to access private healthcare do not see their right to health imperi-led. The same happens to those who can access private education and the housing market. Regar-ding these rights to adequate healthcare, educa-tion and housing, poverty is usually an equivalent of rights’ violations. But even though poverty and inequality can increase the vulnerability of wo-men, violence against them cuts across all sec-tors of society with different access to cultural, social and economic capital.
This paper deals with these issues in five
short sections. In the first, we provide an overview of international definitions and standards on vio-lence against women. Next, we analyze different types of violence. In the third section, we provi-de an overview of the specific case of violence against children and teenagers. In the fourth sec-tion we analyze the effects and costs of violence against women. In the fifth and final section, we analyze how the case-law of the Inter-American Court of Human Rights has addressed these is-sues and problems.
DefInITIon of VIolenceanD TyPes of VIolenceagaInsT WoMen
Article 1 of the Inter-American Convention on
the Prevention, Punishment and Eradication of Vio-lence Against Women (hereinafter, the “Convention of Belem do Para) defines violence against women as “any act or conduct, based on gender, which cau-ses death or physical, sexual or psychological harm or suffering to women, whether in the public or the private sphere.” Article 2 provides further gui-dance, and states the following:
“Violence against women shall be unders-tood to include physical, sexual and psychological violence:
a. that occurs within the family or domestic unit or within any other interpersonal re-lationship, whether or not the perpetrator shares or has shared the same residence with the woman, including, among others, rape, battery and sexual abuse;
b. that occurs in the community and is per-petrated by any person, including, among others, rape, sexual abuse, torture, trafficking in persons, forced prostitution, kidnapping and sexual harassment in the workpla-ce, as well as in educational institutions, health facilities or any other place; and
c. that is perpetrated or condoned by the state or its agents regardless of where it occurs.”
As we can see, violence against women is approached by the Convention from different perspectives, classified according to where it occurs. For instance, Article 2.a refers to the so-called private sphere, that is, behind closed doors or, as Hanna Arendt put it while para-phrasing Aristotle, in the private realm of the household or oikos. On the other hand, Article 2.b refers to violence that occurs in the public sphere, the polis in Aristotelian terms. Some spe-cific forms of violence can happen both in the private and public sphere, such as rape, battery and sexual abuse, while other violence happens specifically in the public sphere, such as torture by State officers, trafficking in persons, forced prostitution, kidnapping and sexual harassment in the workplace. Clearly violence against wo-men occurs both in homes and within commu-nities, and these two realities present different challenges to the State in terms of public policy designed to fight this kind of violence.
Finally, Article 2.c refers to the role of the Sta-
te, which cannot condone or perpetrate any kind of violence “regardless of where it occurs.” That means that the State has very special obligations towards women, and it obviously cannot claim

Alertamerica.org: El Observatorio Hemisférico de Seguridad de la OEA :: Informe Sobre Seguridad en las Américas
50
that violence which occurs in the private realm of households is not its responsibility.
But this responsibility of States should not make us forget that these crimes committed in the private sphere present special difficulties in terms of their prevention and eventual pro-secution, a reality that demands from the State special policies specifically designed to over-come those difficulties. As we can see from the Convention of Belem do Para, violence against women is expansively defined and –from the very beginning— the State is put in a particular posi-tion in which it can commit violence both by ac-tion (“perpetrate”) and by omission (“condone”).
In the next section we will provide a brief overview of the current state of affairs in terms of violence against women in Latin America and the Caribbean.
11. TyPes of VIolence agaInsT WoMen anD sTaTIsTIcs
In this section, we explore some very specific forms of violence against women, in order to see –through statistics— the magnitude of the problem. Most of the statistics are extracted from the No more report by ECLAC cited above. A general lack of statistical data in the struggling democracies of the region add to the problem of violence against women, a problem that is more acute in the coun-tries of the Caribbean. This has lead ECLAC to highlight “statistic invisibility” when discussing and analyzing the situation in Caribbean countries. We must therefore take the available data only as an indication of the problem, which in reality, is even more serious than what statistics show.
a.) VIolence WITHIn an InTIMaTe RelaTIonsHIP
This type of violence is closely related to the household. It happens in the realm of the
private sphere and –as we explained in the pre-vious section— it is covered by the broad defini-tion used in the Convention of Belem do Para. It has been described as a “functional instru-ment of power in the dominant gender system which is used to reinforce male authority and to ensure that women fulfill the roles attributed to them within the family and the home.”
Statistics from different countries of Latin America and the Caribbean come from various sources, and they are usually not comparable from a methodological point of view. But they do show some broad tendencies that we can see repeated through different surveys and studies. In Puerto Rico, for example, sixty per cent of women have been victims of violence by their partners. In Mexico, one in every five women suffer some kind of violence from their partners, and Brazil has similar numbers. In Co-lombia, about 100 women are battered every day. Numbers as dismal as these are replicated in most countries of the region, according to di-fferent sources.
The manifestations of violence perpetrated
within the household do vary. Such violence ran-ge from emotional abuse to severe physical and sexual violence. As the ECLAC report states, this type of violence is a “constant obstacle to the mobility of women which limits their access to a range of functions and activities beyond the pri-vate world, which then prevents them from ha-ving an independent life and enjoying their full rights.” The situation is aggravated by poverty and inequality, because women living in poverty lack access to certain resources. We do not mean economic resources alone, but also the kind of safety net that is usually available for women in the higher strata of society and denied to women in the lower strata. These conditions, combined with stereotypical gender models, contribute to a situation of increased vulnerability, thus creating –we believe— a special duty of protection for the State to prevent what is usually called economic violence, or the threat that women may be de-nied basic economic resources controlled by their male partners.

Alertamerica.org: OAS Hemispheric Security Observatory :: Report on Security in the Americas
51
b.) sexual VIolence
In the realm of sexual violence, rape is the most serious crime against women, and the at-titude in most States towards rape is extremely problematic because it is affected by or infected with gender stereotypes and their legal systems are ill-equipped to deal with such a horrendous crime.
Rape, in particular, can occur both in the public and in the private sphere. Old ideas about the role of women in marriage and lack of appro-priate protective laws, tend to render invisible the crime when committed by husbands on their wives. However, the problem remains: in Brazil, for example, a study showed that 33 per cent of those interviewed admitted suffering forms of physical violence involving armed weapons, aggression and rape within marriage. Rape can also occur within the family: national statistics for Peru show that eight of every ten cases of sexual abuse are committed by a member of the victim’s family circle and that six of every ten pregnancies in girls aged 11 to 14 years old are the product of incest or rape. Finally, a 2005 study based on school surveys completed in Chile, Costa Rica, Panama and Peru revealed that between five and forty per cent of female adolescents had expe-rienced sexual abuse at least once in their lives.
Finally, the sexual exploitation of women takes a different form in the public sphere through the crimes of forced prostitution and se-xual trafficking. These crimes particularly affect women in the lower strata of society.
c.) InsTITuTIonal VIolence
Institutional violence results from the way the State reacts to all forms of violence against women. It is considered a form of violence against women, for example, when the laws and policies of the State are non-existent or inade-quate to protect women against the incidence of violence and effectively treat with its causes. A frequent and typical example of this type of vio-lence is, in the attitude towards, and the way that public officials treat victims of sexual violations and domestic violence.
As the ECLAC report states, in many coun-tries of Latin America and the Caribbean, it is common to see the “criminalization of the victim by the police or courts, negligence in investiga-ting the underlying causes of the case by health services, the trauma to victims in repeating the experience throughout the legal processes, the slowness and complexity of administrative proce-dures and the low priority given to these services in government policies and budgets.”
A rather grim example of this kind of violen-ce by the State was the object of inquiry by the Inter-American Court on Human Rights in the case of González et. al. (“Cotton Field”) Vs. Mexi-co, where the Court issued a judgment on the deaths of three women whose bodies were found in a cotton field in Ciudad Juarez on November 6, 2001. This case presented the Court with spe-cific crimes that were committed in a context of extended violence against women: as the Inter-American Commission on Human Rights (IACHR) showed in its 2003 report on violence against wo-men in Ciudad Juarez, more than 400 women had been murdered in crimes committed with certain common patterns. For example, the vicims were usually young –either students or workers— many of them migrants who had disappeared and were later found dead in wastelands near the city. We shall return to this case later, but for now it is use-ful to recall that the family of those victims alle-ged mistreatment by public officials in charge of the investigation, a mistreatment deeply rooted in cultural patterns that when expressed by the State through its representatives, constitutes a clear form of institutional violence.
D.) feMIcIDe
The murder of women is probably the most radical and extreme form of violence against them. As Marcela Lagarde explains, femicide oc-curs when the State “fails to provide women with guarantees and conditions of security for their li-ves in the community, at home, in the workplace, whilst travelling or in leisure facilities. This is even more the case, when authorities fail to complete their functions efficiently.”

Alertamerica.org: El Observatorio Hemisférico de Seguridad de la OEA :: Informe Sobre Seguridad en las Américas
52
Statistics in the region are also staggering. Guatemala is one of the countries where the pro-blem is more acute. For example, “According to the Center for Informative Reports on Guatemala (CERIGUA, in Spanish) 665 women were murde-red in 2005. By May of 2006, the National Civil Police (…) reported that 230 women had been killed, whereas the Mutual Support Group (Gru-po de Apoyo Mutuo, GAM) reported up to 290 deaths. In June 2006, CERIGUA reported 362 killings of women in Guatemala.” The ECLAC re-port divides the murders, for purpose of analysis, according to the place where the crimes were committed, that is, whether they occurred in the private or public sphere. In Mexico, for example, the Femicide Commission of the Chamber of De-puties “states that an estimated 6,000 girls and women were killed between 1999 and 2005 –two thirds as a consequence of domestic violen-ce according to the Special Prosecutor for Cases of Violence Against Women.” In the Caribbean, several studies have shown intimate femicide in-creased in Jamaica and the Bahamas.
Violence against women in the realm of the household often leads to the murder of these women. States are aware of this situation, but face severe challenges, especially in relation to the prevention of these crimes, given their lack of visibility. Even so, some positive developments have occurred: femicide has become, in many countries, a specially aggravated crime, and so-cial discourses that sometimes tended to legiti-mize these crimes –such as the one related to the practice of “honor” killings— are slowly but steadily disappearing in our societies.
However, women are murdered outside the household as well: the ECLAC report states, “fe-micide can also take place in the public sphere (non-intimate femicide), following the rape of a woman by a stranger, the murder of a sex worker by a client, the death of a woman in armed con-flict or contexts of military or police repression.” Unfortunately, Latin America has the second hig-hest number of female deaths due to violence. This problem is worsened by the fact that most perpetrators are not brought to justice, which creates a situation of impunity that can only re-sult in a climate which fosters these crimes.
III. VIolence agaInsT THe gIRl cHIlD anD TeenageRs
The numbers on violence against women increase dramatically when the age of victims also encompasses the young. According to the ECLAC report, based on data by the World Health Organization (WHO), in Latin America and the Ca-ribbean in 2002, “the homicide rate for girl chil-dren aged between 0 and 17 years old was 2.21 per 100,000, while that of boys in the same age group was 8.11 per 100,000.” This is the highest rate of children killed in the world.
Violence against children takes many terri-ble forms: whether they become the victims of sexual exploitation, forced prostitution, labor ex-ploitation, sexual assault and violence, children are an especially vulnerable sector of society re-quiring the highest level of protection, precisely because of that vulnerability. Again, this violence expresses itself both at the private and public level: cultural patterns of education sometimes reinforce as acceptable the use of physical punis-hment for children, a practice that should be dee-med not only obsolete but as a gross violation of their human rights. In the public sphere, children face all kinds of violence from the State, espe-cially when the latter operate through repressive apparatus: almost all countries of the Americas have obsolete structures and mechanisms to

Alertamerica.org: OAS Hemispheric Security Observatory :: Report on Security in the Americas
53
deal with juvenile delinquency. When “institutio-nalized,” children of both genders become vic-tims of a system ill-prepared to treat them with minimum standards of decency, and many beco-me the object of emotional, sexual and physical violence by the very people charged with their protection and care.
IV. effecTs anD cosTs of VIolence
Violence against women has obvious social, political, economic and cultural costs besides the individual damage caused to every victim. From a social perspective, violence against women functions as a mechanism of oppression which per-petuates the male-centered culture of our societies. It works as a deterrent of emancipation practices, and is one of the main obstacles for achieving such emancipation. As the ECLAC report states, the
“… reduced economic, political and social participation of women victims of violence constitutes a barrier to en-joyment of their economic and social rights. This has collateral effects on economic and social development, gi-ven that it produces negative impacts on the labor market, on women’s capa-city to escape poverty, the operation of democratic institutions and the success of expensive programmes and projects. Such an erosion of existing social and human capital, as well as its accumu-lation rate, has multiplying negative consequences both for development – increasing inequality and reducing economic growth – and for the forma-tion of institutions leading to a better socio-economic climate. This only feeds a vicious circle of erosion of forms of ‘capital’ that paves the way for greater violence in the future.”
-Countries with greater gender equality have economies that are more competitive and grow faster-, as shown through a comparative analysis of 134 countries—UNWOMEN.
Beside these consequences, which are of paramount importance and we believe that the real challenge violence against women poses to the achievement of development, is the ine-ffective or non-existent mechanisms for dealing with this scourge which causes such serious in-dividual and social damage to the thousands of women victims of violence. The most important issue which should drive the thrust of States’ efforts to eradicate this problem of pandemic proportions from our communities is that such violations suffered by women victims of violen-ce are of their basic human rights. Not only the Convention of Belem do Para, but also the Inter-American Convention on Human Rights, is violated every time a woman is emotionally or physically battered, sexually assaulted or ha-rassed or injured in any way. This perspective on rights puts a heavy burden on States Parties to these Conventions.
In the following section we will explore the response of the Inter-American Court of Human Rights when faced with these terrible statistics and the cultural patterns which support them in the context of a contentious case.
V. InTeR-aMeRIcan case laW
In 2009, the Inter-American Court adjudi-cated the Cotton Field case mentioned above, which involved the murder of three young women in a context of extreme violence against women in Ciudad Juárez, México, a situation that was described as the “culmination of a situation cha-racterized by the reiterated and systematic vio-lation of human rights.” As the Representatives of the victims put it, “cruel acts of violence are perpetrated against girls and women merely be-cause of their gender, and (…) in some cases (…) they murdered as a culmination of this public and private violence.”

Alertamerica.org: El Observatorio Hemisférico de Seguridad de la OEA :: Informe Sobre Seguridad en las Américas
54
In this case, many issues were at stake, but one of the most important was how the law and the system of human rights protection could react to a violence that was deeply entrenched in society. Indeed, the Court considered that it had been proven that the investigative procedures into these crimes were full of irregularities and deficiencies of all kinds. The evidence produced during the proceedings showed that the State had behaved incorrectly in it’s agents treatment of the statements made by the family of the young wo-men who were missing at the time.
For example, the mother of one of the victims testified that when she reported her daughter’s disappearance, authorities told her that she “had not disappeared, but was out with her boyfriend or wandering around with friends,” “that, if anything happened to her, it was because she was looking for it, because a good girl, a good woman, stays at home.” The mother of another victim stated that when she went to present the missing person’s report, an official told a friend of her daughter’s that “she is surely with her boy-friend, because girls were very flighty and threw themselves at men.” Her mother also stated that when she went to file a complaint denouncing the disappearance, she was told that “maybe [her daughter] had gone off with her boyfriend, and would soon return home.” Sadly, this type of
behavior was the rule and not the exception in Ciudad Juárez. The State of Mexico did recognize that one of the causes of these murders was re-lated to deep patterns of a male-centered culture.
The Court confronted a challenge when fa-ced with evidence that the crimes were somehow rooted in cultural issues. How can the law react to such a diagnosis? Do normal reparations suffice when the root of the evil is so deeply entrenched in society that the normal reaction of the people in charge of protecting citizens –when facing a crime— is that described in the previous paragra-ph? To put it differently: if the disease is cultural, should not the remedy be cultural as well? Can the law affect culture? We believe it can, and the Court did, as well.
Indeed, in its judgment, the Court ordered the State to implement measures of reparation that attacked the cultural root of the problem. That is, they were transformative in nature, as they were issued with the goal of “transforming the relations of subordination and social ex-clusion that are at the origin of the conflict that needs to be overcome.” The Court adopted such language, and specifically stated:
“[B]earing in mind the context of structu-ral discrimination in which the facts of this case occurred, which was acknowledged by the State (…), reparations must be designed to change this situation, so that their effect is not only of resti-tution, but also of rectification. In this regard, re-establishment of the same structural context of violence and discrimination is not acceptable. (…) In accordance with the foregoing, the Court will assess the measures of reparation requested by the Commission and the representatives to ensu-re that they: (…) are designed to identify and eli-minate the factors that cause discrimination; (…) are adopted from a gender perspective, bearing in mind the different impact that violence has on men and on women, and (…) take into account all the juridical acts and actions in the case file which, according to the State, tend to repair the damage caused.”
As we can see, the reparations issued by the Court were partially addressed at dealing

Alertamerica.org: OAS Hemispheric Security Observatory :: Report on Security in the Americas
55
with the cultural problem which was one of the causes of violence against women. Hence, the Court ordered, for example, that the State adopt a gender perspective in further investigations; that it publicize the results of investigative proce-dures so Mexican society will be educated about what happened to women in Ciudad Juárez; that it transmit through radio and television, both at the local and federal level, a public act of recog-nition of international responsibility; and that it continue with education campaigns in the State of Chihuahua and throughout the country, among other measures that were similarly directed at producing a cultural change in society.
Time will tell whether these efforts if pro-perly implemented by the State will be successful or not in achieving the intended result. Neverthe-less, we believe that every effort should be made until the statistics set out in previous pages chan-ge dramatically and the rights and dignity of Latin American and Caribbean women are respected throughout the region.
VI. conclusIon
In the previous sections we took a glance at the situation of women’s rights from the prospec-tive of violence against them in Latin America and the Caribbean. The picture is grim. Space cons-traints prevent us from going deeper and further into the matter. Even though some improvement can be seen in certain areas, the numbers show
that the road ahead is still long and fraught with difficulties. We have tried to look at the problem from a human rights perspective: what can the law do, if anything, to deal with acute problems which cut across social strata and are deeply roo-ted in the cultural practices of our societies?
The Inter-American system of human rights protection has dealt with this problem several ti-mes. We focused on the Cotton Field case becau-se we believe it shows how clearly culture affects the way some State deal with all forms of violence against women. Also, the reparations established by the Court highlight that sincere and funda-mental change is an absolute necessity.
Because of poverty, inequality and historical subordination to men, women are one of the many vulnerable groups in Latin America and the Ca-ribbean. As such, they deserve special treatment from the State, as the State is duty bound to provide protection for such groups within it’s bor-ders. That means that the State should make every possible effort to prevent violence against women from occurring and to punish those res-ponsible when prevention has failed. The State must adapt its structures to dealing with violence against women, which means adopting a gende-red approach to the investigation of all crimes against women, as the Court established in the Cotton Field decision. The State is also obliged to make every possible effort to prevent such vio-lence against women in both private and public spheres. A duty expounded in the Convention of Belem do Para. This means creating public edu-

Alertamerica.org: El Observatorio Hemisférico de Seguridad de la OEA :: Informe Sobre Seguridad en las Américas
56
margarette may macaulayJudge, Inter-American Court of Human Rights
Margarette May Macaulay (b. Jamaica) is an Attor-ney-at-Law who, following her election in 2006, is one of the seven Judges who sits on the bench of the Inter-American Court of Human Rights, and the only from the Caribbean sub-region. Ms. Macaulay received a Bachelor of Laws degree from Holborn College (London) in 1966, a Diploma in Comparati-ve Law from the School of Oriental and African Stu-dies (London) and a Qualifying Certificate from the Norman Manley Law School (Jamaica). From 1976 onwards, Ms. Macaulay has been deeply involved in legal issues concerning gender and women’s rights in the Hemisphere as well as a leading children’s rights advocate in the re-gion. Throughout her ca-reer she has published numerous articles and opinions on these and other human rights issues. This article was written with the collaboration of Alejandra Negrete, Staff Attorney-at-Law at the Inter-Ameri-can Court of Human Rights.
cation programmes which emphasize the dignity, individuality and dignity of women; establishing public structures capable of providing battered-women with the kind of physical, economic, so-cial and psychological support they need to free themselves from abusive relationships; creating special units of investigation for complex crimes such as human trafficking and forced prostitu-tion; and other measures of such kind. Howe-ver, the State by itself, will not take the steps ne-cessary to achieve the level of protection which ought to reduce women’s vulnerability to violence within it’s territory. Constant activism by civil so-
Alejandra negrete morayta Abogada, Corte Interamericanade Derechos Humanos
Licenciada en derecho por la Universidad Nacional Autónoma de México. Ex abogada de la Relatoria Especial para la Libertad de Expresión de la Comisión Intera-mericana de Derechos Humanos. Abogada en la Corte Interamericana de Derechos Humanos IDH. Autora de diversas publicaciones sobre derechos humanos, derecho procesal y de-recho penal.
ciety organizations must fuel the move which our States need in order to move forward in this re-gard. The Inter-American system of human rights protection applies that principle to advance this cause. Thus, States Parties should work with civil society on these issues. It was and is the activism of women and feminist groups which were and are advancing the cause of emancipating women from the scourge of violence and the violation of their human rights and their work must be sup-ported within any State which intends to achieve it’s full level of development .

Alertamerica.org: OAS Hemispheric Security Observatory :: Report on Security in the Americas
57
Indicator definitionDefinición del indicador
COUNTRY
2000 2001 2002 2003 2004 2005 2006 2007 2008 2009 2010
Antigua and Barbuda 43 43 34 54 86 59 17
Argentina 3,154 3,264 3,276 3,367
Barbados 58 65 100 76 84 77 75 72 62 68
Belize 78 56 54 50 53 47 44 38 38 30
Bolivia 2,198 1,739 1,756 2,210 1,137 1,137 1,437 1,596 1,989 2,587
Brazil 24,807 26,208 23,679 21,918 28,199 31,980 39,693
Canada 531 587 565 570 528 490 471
Chile 1,881 1,659 2,290 2,461 2,618 2,678 2,941 2,919 3,429
Colombia 2,372 2,700 2,865 2,942 3,349 3,403
Costa Rica 576 600 543 485 1,685
Ecuador 1,246 1,499 1,484
Guatemala 366 416 365 379 363 314 289 318 385 401
Guyana 113 117 137 122 170 169 124 82 71 74
Jamaica 860 746 708 712 849 771 704
Mexico 13,066 12,971 14,373 13,996 13,650 13,550 13,894 14,199 14,078 14,850 14,993
Nicaragua 1,182 1,229 1,348 1,234 1,330 1,322 1,524 1,757 1,936 1,829
Panama 581 543 540 607 629 771 792 855 713 809 996
Paraguay 387 359 158 215 258
Peru 5,991 5,721 6,268 6,569 7,208 7,560 6,751
Saint Lucia 39 35 48 52 52 49 65 69 45
Saint Vincent and the Grenadines 66 87 50 60 36 54 28
Trinidad and Tobago 272 299 326 314 305 334 259 317 236 247
United States 90,178 90,863 95,235 93,883 95,089 94,347 94,472 92,610 90,750 89,241 84,767
AMERICAS (23 countries)(*1)(*2) 150,045 150,706 153,807 154,161 156,068 156,768 155,380 153,289 160,144 162,849 167,310
Caribbean (6 countries) (*3) 1,338 1,368 1,443 1,410 1,410 1,327 1,211 1,316 1,287 1,202 1,081
Central America (5 countries) (*4) 2,783 2,820 2,883 2,846 2,975 2,997 3,134 3,453 4,757 4,861 4,941North America (3 countries) (*5) 103,775 104,365 110,139 108,410 109,326 108,462 108,936 107,337 105,318 104,562 100,231South America (9 countries) (*6) 42,149 42,153 41,714 41,494 42,357 43,983 42,099 41,183 48,782 52,225 61,046
Note :
(*1) Americas refers to the 23 countries included in this Table. (*2) Data for indicated year or nearest available year. (*3) Data for Carribean includes: Antigua and Barbuda, Barbados, Jamaica, Saint Lucia, Saint Vincent and the Grenadines, and Trinidad and Tobago. (*4) Data for Central America includes: Belize, Costa Rica, Guatemala Nicaragua, and Panama. (*5) Data for North America includes: Canada, Mexico, and The United States. (*6) Data for South America includes: Argentina, Bolivia, Brazil, Chile, Colombia, Ecuador, Guyana, Paraguay, and Peru.
3.15 RAPE, 2000‐2010 (TOTAL)
Total number of offenses of rape reported by the Police. Rape means sexual intercourse without valid consent.
YEAR
Sub‐regional data: (*2)
Indicator definition

Alertamerica.org: El Observatorio Hemisférico de Seguridad de la OEA :: Informe Sobre Seguridad en las Américas
58
Indicator definitionDefinición del indicador
COUNTRY
2000 2001 2002 2003 2004 2005 2006 2007 2008 2009 2010
Antigua and Barbuda 53.0 52.0 40.0 63.0 100.0 68.0 19.0
Argentina 8.1 8.3 8.3 8.5
Barbados 23.0 26.0 40.0 30.0 33.2 30.4 29.5 28.2 24.3 26.6
Belize 31.0 21.7 20.5 18.5 19.2 16.7 15.3 12.9 12.6 9.8
Bolivia 25.9 20.1 19.9 24.5 12.4 12.2 15.1 16.5 20.2 25.8
Brazil 13.5 14.1 12.6 11.5 14.7 16.5 20.3
Canada 1.7 1.8 1.7 1.7 1.6 1.5 1.4
Chile 12.2 10.4 14.2 15.1 15.9 16.1 17.5 17.2 20.0
Colombia 5.6 6.3 6.6 6.6 7.4 7.5
Costa Rica 13.8 14.1 12.5 11.0 36.8
Ecuador 9.6 11.5 11.2
Guatemala 3.3 3.6 3.1 3.1 2.9 2.5 2.2 2.4 2.8 2.9
Guyana 14.9 15.5 18.1 16.0 22.3 22.1 16.2 10.7 9.3 9.7
Jamaica 32.6 28.2 26.6 26.6 31.6 28.9 25.8
Mexico 13.3 13.1 14.4 13.9 13.4 13.1 13.3 13.5 13.2 13.8 13.6
Nicaragua 23.2 23.7 25.7 23.2 24.7 24.2 27.6 31.4 34.2 31.4
Panama 19.7 18.1 17.6 19.5 19.8 23.9 24.1 25.6 21.0 23.4
Paraguay 6.6 6.0 2.6 3.4 4.1
Peru 22.1 20.8 22.5 23.3 25.3 26.2 23.1
Saint Lucia 25.0 22.0 30.0 32.0 32.1 29.7 38.9 41.1 26.5
Saint Vincent and the Grenadines 61.1 80.6 46.3 55.6 33.0 49.5 25.7
Trinidad and Tobago 21.0 23.0 25.0 24.0 23.2 25.3 19.6 23.9 17.7 18.5
United States 32.0 31.9 33.1 32.3 32.5 31.9 31.7 30.5 29.7 28.7 27.8
AMERICAS (23 countries)(*1)(*2) 19.8 19.6 19.8 19.6 19.7 19.5 19.1 18.7 19.3 19.4 19.8
Caribbean (6 countries) (*3) 29.9 30.4 31.9 31.1 30.9 29.0 26.3 28.5 27.7 25.9 23.0
Central America (5 countries) (*4) 11.9 11.8 11.8 11.4 11.7 11.5 11.8 12.8 17.3 17.3 17.2North America (3 countries) (*5) 25.3 25.1 26.3 25.6 25.6 25.2 25.0 24.4 23.7 23.3 22.1South America (9 countries) (*6) 13.2 13.0 12.7 12.5 12.6 12.9 12.2 11.8 13.8 14.7 17.0
Note(*1) Americas refers to the 23 countries included in this Table. (*2) Data calculated for indicated year or nearest available year. (*3) Data for Carribean includes: Antigua and Barbuda, Barbados, Jamaica, Saint Lucia, Saint Vincent and the Grenadines, and Trinidad and Tobago. (*4) Data for Central America includes: Belize, Costa Rica, Guatemala, Nicaragua, and Panama. (*5) Data for North America includes: Canada, México and the United States. (*6) Data for South America includes: Argentina, Bolivia, Brazil, Chile, Colombia, Ecuador, Guyana, Paraguay, and Peru.
3.16 RAPE, 2000‐2010 (RATE)
Rape means sexual intercourse without valid consent. Some countries with fewer than 100,000 inhabitants have their rates presented for comparative purposes.
YEAR
Sub‐regional data: (*2)
Indicator definition

Alertamerica.org: OAS Hemispheric Security Observatory :: Report on Security in the Americas
59
2000 2001 2002 2003 2004 2005 2006 2007 2008 2009 2010
Americas (23 countries) 19.79 19.64 19.82 19.63 19.65 19.53 19.14 18.68 19.31 19.44 19.76
Carribean (6 countries) 29.88 30.39 31.93 31.08 30.92 28.97 26.31 28.47 27.73 25.93 22.99
Central America (5 countries) 11.85 11.76 11.78 11.39 11.67 11.52 11.81 12.76 17.25 17.29 17.23
North America (3 countries) 25.25 25.13 26.27 25.62 25.59 25.15 25.01 24.40 23.71 23.33 22.11
South America (9 countries) 13.21 13.02 12.73 12.48 12.57 12.90 12.20 11.80 13.83 14.65 16.95
0
5
10
15
20
25
30
35
Victi
ms
of R
ape
Rate
per
100
,000
inha
bita
nts
Graph 5Americas: Rape Rate per 100,000 inhabitants, 2000-2010
(Reported by the Police Forces)
Alertamerica.org: El Observatorio Hemisférico de Seguridad de la OEA :: Informe Sobre Seguridad en las Américas
60
When analyzing the incidence of sexual violence against women, it is im-portant to understand that rape and other forms of sexual violence are noto-riously under-reported crimes in the Western Hemisphere. This is principally because the social legitimization of violence against women means that many men-and even some women-do not recognize sexual violence as a crime which should be reported to authorities. Should these crimes not be registered by the relevant authorities, they will not be represented in official statistics, something which may explain why data is comparatively low or incomplete.
Police, prosecutors or judges may dismiss or disregard women’s claims of sexual violence and instead encourage them to resolve “disputes” directly with their partners, to stop dressing “provocatively”, to “behave themselves” or not place themselves in situations in which they may be at-risk from sexual violence. Women are thus seen as responsible for fomenting violence and thus are not viewed as victims of heinous crimes. Accordingly, police, defense lawyers and other officials may “legitimize” acts of sexual violence in order to mitigate the responsibility of the perpetrator.
These attitudes also correspond to the environment in which criminal in-vestigations frequently take place. These are frequently physically invasive and often involve inquisitorial investigations. The fear of retribution is also a key fac-tor which may render women reluctant to report sexual violence, particularly in small or closed communities where it may be difficult to preserve anonymity, or in areas where restraining, detention or protection orders are known to be reluc-tantly issued or ineffectively enforced.
In the case of sexual violence against specific populations, such as indig-enous, afro-descendant, migrant, or LGBTQI women, a general mistrust of public authorities or lack of social acceptance may also serve as an obstacle to reporting.
THe IncIDence of sexual VIolence agaInsT WoMen
In THe aMeRIcas
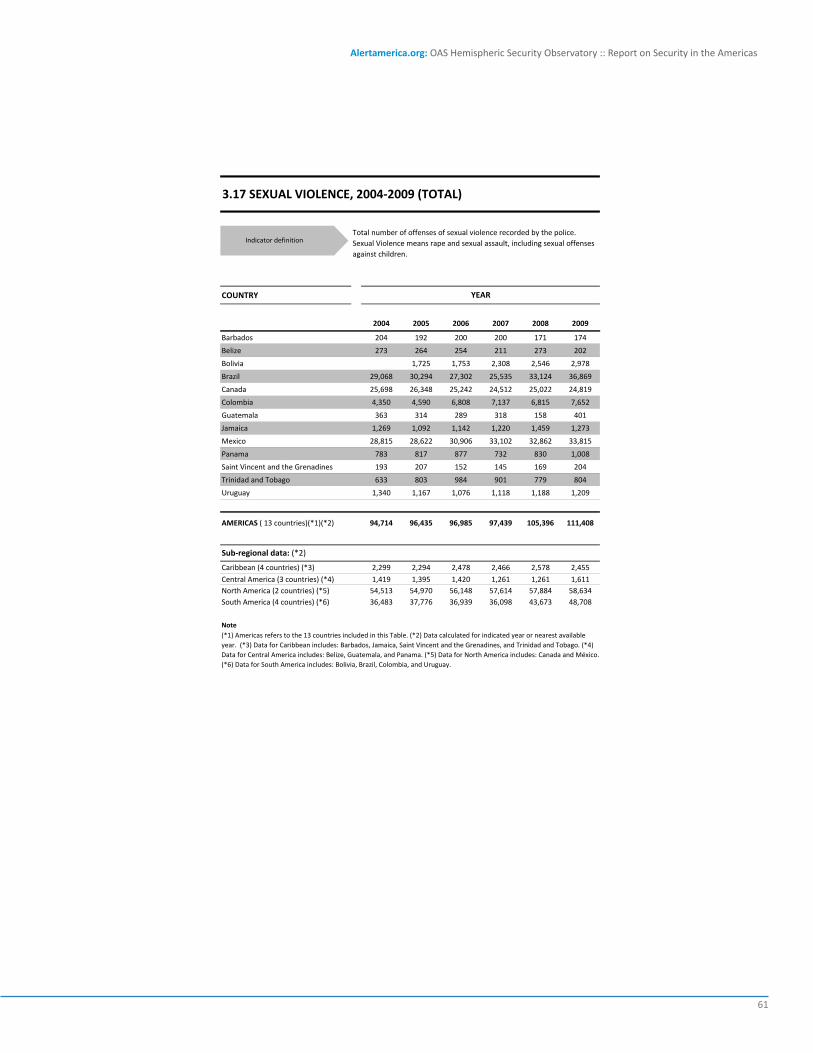
Alertamerica.org: OAS Hemispheric Security Observatory :: Report on Security in the Americas
61
Indicator definitionDefinición del indicador
COUNTRY
2004 2005 2006 2007 2008 2009
Barbados 204 192 200 200 171 174
Belize 273 264 254 211 273 202
Bolivia 1,725 1,753 2,308 2,546 2,978
Brazil 29,068 30,294 27,302 25,535 33,124 36,869
Canada 25,698 26,348 25,242 24,512 25,022 24,819
Colombia 4,350 4,590 6,808 7,137 6,815 7,652
Guatemala 363 314 289 318 158 401
Jamaica 1,269 1,092 1,142 1,220 1,459 1,273
Mexico 28,815 28,622 30,906 33,102 32,862 33,815
Panama 783 817 877 732 830 1,008
Saint Vincent and the Grenadines 193 207 152 145 169 204
Trinidad and Tobago 633 803 984 901 779 804
Uruguay 1,340 1,167 1,076 1,118 1,188 1,209
AMERICAS ( 13 countries)(*1)(*2) 94,714 96,435 96,985 97,439 105,396 111,408
Caribbean (4 countries) (*3) 2,299 2,294 2,478 2,466 2,578 2,455
Central America (3 countries) (*4) 1,419 1,395 1,420 1,261 1,261 1,611North America (2 countries) (*5) 54,513 54,970 56,148 57,614 57,884 58,634South America (4 countries) (*6) 36,483 37,776 36,939 36,098 43,673 48,708
Note(*1) Americas refers to the 13 countries included in this Table. (*2) Data calculated for indicated year or nearest available year. (*3) Data for Caribbean includes: Barbados, Jamaica, Saint Vincent and the Grenadines, and Trinidad and Tobago. (*4) Data for Central America includes: Belize, Guatemala, and Panama. (*5) Data for North America includes: Canada and México. (*6) Data for South America includes: Bolivia, Brazil, Colombia, and Uruguay.
3.17 SEXUAL VIOLENCE, 2004‐2009 (TOTAL)
Total number of offenses of sexual violence recorded by the police. Sexual Violence means rape and sexual assault, including sexual offenses against children.
YEAR
Sub‐regional data: (*2)
Indicator definition

Alertamerica.org: El Observatorio Hemisférico de Seguridad de la OEA :: Informe Sobre Seguridad en las Américas
62
Indicator definitionDefinición del indicador
COUNTRY
2004 2005 2006 2007 2008 2009
Barbados 80.6 75.9 78.7 78.4 67.1 68.0
Belize 98.9 93.6 88.2 71.5 90.7 65.8
Bolivia 18.8 18.7 24.2 26.3 30.2
Brazil 15.8 16.3 14.5 13.4 17.3 19.0
Canada 80.3 81.5 77.3 74.3 75.1 73.6
Colombia 10.3 10.7 15.6 16.1 15.1 16.8
Guatemala 2.9 2.7 2.5 2.6 1.3 3.2
Jamaica 48.1 41.9 43.6 46.5 55.3 48.0
Mexico 28.2 27.8 29.7 31.4 30.9 31.5
Panama 24.7 25.4 26.7 21.9 24.4 29.2
Saint Vincent and the Grenadines 177.1 189.9 139.4 133.0 155.0 187.2
Trinidad and Tobago 48.2 60.9 74.4 67.8 58.4 60.1
Uruguay 40.6 35.3 32.5 33.6 35.7 36.1
AMERICAS ( 13 countries)(*1)(*2) 24.4 24.3 24.4 24.5 26.5 28.0
Caribbean (4 countries) (*3) 53.3 53.0 57.0 56.5 58.8 56.1
Central America (3 countries) (*4) 9.0 8.6 8.6 7.4 7.3 9.1North America (2 countries) (*5) 40.7 40.6 41.0 41.7 41.4 41.5South America (4 countries) (*6) 15.3 15.6 15.1 14.6 17.5 19.3
Note
(*1) Americas refers to the 13 countries included in this Table. (*2) Data calculated for indicated year or nearest available year. (*3) Data for Caribbean includes: Barbados, Jamaica, Saint Vincent and the Grenadines, and Trinidad and Tobago.(*4) Data for Central America includes: Belize, Guatemala, and Panama. (*5) Data for North America includes: Canada and Mexico. (*6) Data for South America includes: Bolivia, Brazil, Colombia, and Uruguay.
3.18 SEXUAL VIOLENCE, 2004‐2009 (RATE)
Rate of offenses of sexual violence recorded by the Police per 100,000 inhabitants. Sexual Violence means rape and sexual assault, including sexual offenses against children. Some countries with fewer than 100,000 inhabitants have their rates presented for comparative purposes.
YEAR
Sub‐regional data: (*2)
Indicator definition
Aiming to design public policies based on national realities, the countries of the Americas will identify scientific methods for objective assessment of citizen security and of the specific risk factors in each state, addressing the different needs of its population.
Excerpt from the Hemispheric Plan of Action on Citizen Security in the Americas approved by the OAS Permanent Council on May 2, 2012.

Alertamerica.org: OAS Hemispheric Security Observatory :: Report on Security in the Americas
63
Indicator definitionDefinición del indicador
COUNTRY
Latest available yearTotal population aged18 years and under
Total number of sexual offenses against person aged 18 years and under
Rate of sexual offenses against minors
(per 100,000 minors)
Bahamas 2009 106 504 475
Barbados 2009 55 28 51
Belize 2009 129 94 73
Bolivia 2009 4,225 1,429 34
Canada 2009 6,878 2,620 38
Colombia 2009 15,937 5,378 34
Guatemala 2009 6,834 247 4
Guyana 2009 269 78 29
Mexico 2009 37,564 2,555 7
Panama 2009 1,196 21 2
Paraguay 2009 2,563 156 6
Peru 2009 10,591 2,109 20
Saint Vincent and the Grenadines 2009 36 62 172
Trinidad and Tobago 2009 340 278 82
AMERICAS (14 countries) (*1) 2009 86,723 15,559 18
Caribbean (4 countries) (*3) 2009 537 872 162
Central America (3 countries) (*4) 2009 8,159 362 4
North America (2 countries) (*5) 2009 44,442 5,175 12
South America (5 countries) (*6) 2009 33,585 9,150 27
Note(*1) Americas refers to the 14 countries included in this Table. (*2) Data calculated for 2009 or nearest available year. (*3) Data for Caribbean includes: Barbados, Jamaica, Saint Vincent and the Grenadines, and Trinidad and Tobago. (*4) Data for Central America includes: Belize, Guatemala, and Panama. (*5) Data for North America includes: Canada and Mexico. (*6) Data for South America includes: Bolivia, Colombia, Guyana, Paraguay, and Peru.
3.19 SEXUAL OFFENSES AGAINST CHILDREN (Rate)
Rate per 100,000 minors (under 18 years age) of sexual offenses comitted against children, as recorded by the Police. Sexual offenses against children means crimes of a sexual nature.
Sub‐regional data: (*2)
Indicator definition


DelITos VIolenTos no leTalesnon-leTHal VIolenT cRIMes

Alertamerica.org: El Observatorio Hemisférico de Seguridad de la OEA :: Informe Sobre Seguridad en las Américas
66
Within the Caribbean, children are disproportionately affected by crime and violence. Published by UNICEF (2006), the United Nations Secretary-General’s Study on Violence against Children highlights a range of physical, emotional and social abuse children experience in homes and families, com-munities, schools, institutions, and work situations. They are witnesses to and victims of violence across all the major social institutions and in the me-dia: domestic violence, child abuse and neglect, and corporal punishment at home and in school. In some jurisdictions, there has been an increase in the number of children killed and a rise in the number of children who are victims and perpetrators of violence. In turn, this raises the vulnerability of children to recruitment and participation in gangs. Region wide, children face increased vulnerability to sexual crimes, domestic violence, trafficking, child labor, commercial sexual exploitation, sexually transmitted infections and early sexual initiation. Groups of children identified as especially vulner-able are abused children, children of absent parents, children in minority groups such as Guyana’s Amerindians and Suriname’s Maroon communi-ties, children in poor households, children living in inner-city communities, disabled children, and children of parents who are disabled, have mental health problems, or suffer from drug or alcohol abuse.
- UNDP, “Caribbean Human Development Report 2012: Human Development and the
Shift to Better Citizen Security.” - P.33
cHIlDRen as a gRouP VulneRable
To VIcTIMIzaTIon

Alertamerica.org: OAS Hemispheric Security Observatory :: Report on Security in the Americas
67
PolIceaDMInIsTRaTIVeRecoRDs
As crime and violence are increasingly ha-ving a grave impact on human security and the socio-economic development of citizens in the Caribbean Community (CARICOM), there is an urgent need for effective use of police adminis-trative records to improve our understanding of a range of citizen security issues. Reliable and timely police administrative records are essential tools upon which decisions and policies may be based in order to curb the increasing levels of cri-minality which plague CARICOM Member States. Public access to police administrative records is a significant yet is an often overlooked aspect of accountability, transparency and access to infor-mation which is critical for developing evidenced based policies and citizen security initiatives. Inarguably, there exist great possibilities for po-lice administrative records to be used for the benefit of developing informed policing policies and curbing the human suffering experienced from rising criminality. Nevertheless, there is also considerable scope for exploitation, abuse and mistakes especially where the risks and detri-ments may outweigh the benefits. These inherent risks associated with information sharing include compromising national security and infringing in-dividual privacy. National security requires that certain information be maintained in confidence
in order to protect our citizens, democratic insti-tutions and relations with other foreign nations.
The scope of police administration records varies widely and may include, inter alia, crime reports, police budgets, human resource matters, reports on offenders and victims, and traffic mana-gement reports. These records may vary between countries and even between jurisdictions within a country. For purposes of this discussion and clari-ty of approach, the police administration records under review have been classified into four cate-gories which are relevant to citizen security initia-tives, policy development and transparency.
The first category addresses the work of the police service in relation to keeping the peace, law enforcement, protection of persons and pro-perty, community crime prevention programs, and the investigation of crimes. This includes cri-me reports and details on victims and offenders.
The second category is information of an ad-ministrative nature. This includes inter alia, infor-mation about police budgets, facilities and assets.
The third category includes human resour-ce information. This category includes personnel information, salaries, finances, vacancies, disci-plinary matters, and selection of police officers.
The final category includes auxiliary admi-nistrative issues which include information about firearms licensing and traffic management.
As greater emphasis is placed on the use of technology and research in the formation and im-plementation of citizen security initiatives as well as evidence based strategies on matters of poli-cy and legislation, police administrative records are increasingly becoming more critical. Citizen security policy needs to be based on the stron-gest possible evidence, which requires research and statistical analysis. Police administrative re-cords provide valuable data to synergise the use, appropriation and deployment of resources and support decision-making nationally and regiona-lly. Equally, dissemination of police administrati-ve records should be premised on the grounds
PolIce aDMInIsTRaTIVe RecoRDsIssues of cITIzen secuRITy In caRIcoM
By: Francis ForbesExecutive Director of the Caribbean Community’s
Implementation Agency on Crime and Security (IMPACS)

Alertamerica.org: El Observatorio Hemisférico de Seguridad de la OEA :: Informe Sobre Seguridad en las Américas
68
that research and statistical analysis should be undertaken in a way that provides maximum pro-tection for the privacy of individuals as well as the interest of national security.
The ability of institutions to be responsive to citizens including disclosing necessary infor-mation is critical in promoting accountability, transparency and good governance (World Bank, 2011). Allowing access to police administrative records can help to ensure transparency and to enhance the public’s positive perception of, and confidence in the police service. Citizens will be more likely to report crimes and criminal activities when they trust the police. Transparency helps to ensure that the police can do their jobs efficiently and effectively but may also compromise security and privacy. Balancing the interest in transparen-cy and accountability against privacy and security concerns must be adhered to. These concerns are heightened in sensitive national security mat-ters and records of information on minors.
Access to police administration records in CARICOM has been limited although some Mem-ber States like Jamaica and Trinidad and Tobago are increasingly making records available in the public domain. The restrictions to those records are based on a number of factors including natio-
nal security, individual privacy, and the inherent fear that increasing crime in Member States may affect tourism and other vital economic inves-tment activities in the Region.
Whilst most CARICOM Member States have enacted freedom of information legislation, in most cases, national security issues are generally exempt from those laws. Consequently, the Com-missioner of Police is entrusted with the respon-sibility to implement administrative procedures and policies relating to access, management and protection of the police administrative records.
Police administrative records in CARICOM are mainly paper based. There is a paucity of inte-grated data bases and computerized systems for effective record management and analysis. This is compounded by the lack of standardisation of categories and definitions which are not consis-tent from one country to the next. This makes re-gional aggregation, inter-state comparisons, and analysis of regional trends difficult as crime and security is increasingly a trans-national issue. Properly managed police administration records are essential in the quest for collective solutions.
Information sharing is critical for evidenced based citizen security policy. However, a balan-ce is necessary between promoting freedom of information and access to police administrative records as there are security implications to infor-mation sharing. Firstly, it is important to decide whether it is appropriate to share police admi-nistration records for a particular purpose. Then it must be determined how records should be shared, in particular what and how much infor-mation, and by what means (Denham, Elizabeth; 2011).
The legal framework governing police admi-nistration records needs to be developed to en-hance the effectiveness of information sharing, to assist important work in the field of research and statistical analysis, and to help safeguard and protect personal information held in publicly available sources. Any legal framework must also provide individuals and law enforcement the right to complain and obtain redress if their informa-tion is misused.

Alertamerica.org: OAS Hemispheric Security Observatory :: Report on Security in the Americas
69
Researchers, media personnel and others who may feel the need to access police adminis-trative records need to be accountable for the protection of sensitive, private records and the integrity of information. A system of approving or accrediting personnel who meet the relevant cri-teria should be established (Thomas, Richard and Walport, Mark; 2008). This will ensure that they are bound by a strict code, preventing disclosu-re of any personally identifying information, and providing criminal sanctions in case of breach of confidentiality. Additionally, a data sharing code of practice should be consolidated for the region, and should set the benchmark for best practice and regional standardization of police adminis-trative records.
Technology has had a huge impact on infor-mation management, sharing and analysis. It has enabled the creation of large and easily accessi-ble databases and has provided both increased levels of security and increased risks and threats of data breaches (European Commission, 2003). Priority must be given to strengthening national and regional databases as a critical element of information management and information sha-ring. One must be cognizant that unless electro-nic data management systems are governed and managed effectively, exploitation and misuse of computerized datasets can threaten or cause harm to greater numbers of people in ever shor-ter periods of time, whether by intent or accident (Thomas, Richard and Walport, Mark; 2008).
Police administrative records provide a wealth of information for evaluating and im-plementing informed citizen security polices, programs and strategies to reduce crime and prioritize and optimize resources and project in-terventions. However, proper legal, organizatio-nal and other structures need to be implemen-ted to enhance information sharing and ensure that individual privacy and national security are protected. The privacy and security of individual parties involved are crucial issues that must be considered.
RefeRences
Denham, Elizabeth; “Data Sharing In A Gov 2.0 World: Keynote Address”, 2011. European Commission; “Security and Privacy for the Citizen in the Post-September 11 Digital Age: A Prospective Overview, Report to the European Parliament Committee on Citizens Freedoms and Rights, Justice and Home Affairs”, 2003.
Thomas, Richard and Walport; Mark “Data Sha-ring Review Report”, 2008.
World Bank; “World Development Report”, 2011.
francis forbesExecutive Director of the Caribbean Community’s Implementation Agency on Crime and Security (IMPACS)
Francis Forbes (b. Jamaica) is currently the Interim Executive Director of the Caribbean Community’s Implementation Agency on Crime and Security (IMPACS), following a five year tenure as Head of the Liai-son Office in the same or-ganization. A career police officer by trade, Mr. Forbes spent thirty-four years in the Jamaica Constabulary Force, and between 1996 and 2005 served as Com-missioner of Police.

Alertamerica.org: El Observatorio Hemisférico de Seguridad de la OEA :: Informe Sobre Seguridad en las Américas
70
Indicator definitionDefinición del indicador
COUNTRY
2004 2005 2006 2007 2008 2009 2010
Argentina 142,099 143,291 137,181 145,240
Barbados 1,610 1,731 1,704 1,548 1,594 1,610
Belize 932 451 946 967 948 519
Bolivia 6,026 6,087 7,435 7,885 8,172 9,611
Brazil 661,008 547,288 662,995 574,010 539,810 544,766
Canada 49,376 53,451 56,709 58,269 58,419 57,100 57,100
Chile 85,687 86,330 87,313 92,774 96,822 11,468
Colombia 32,534 30,415 46,529 47,953 36,037 55,120 53,153
Costa Rica 6,531 6,052 5,931 6,429 6,750 7,437
Ecuador 7,967 7,756 6,575 5,838 5,378
El Salvador 4,003 3,829 3,284 3,355
Guatemala 6,443 6,095 6,055 6,238 5,973 7,603
Guyana 123 160 129 101 114 110
Mexico 178,725 173,725 175,738 189,383 186,585 244,623 230,687
Nicaragua 25,033 19,335 18,391 18,748 18,284 18,345
Panama 2,104 1,788 1,781 1,359 1,553 1,370 1,206
Peru 15,020 14,699 15,827 14,461 14,586 16,360
Saint Vincent and the Grenadines 1,529 1,252 1,054 1,063 1,017 1,215 1,302
Suriname 847,381 862,220 874,096 866,358 843,683 812,514 778,901
Trinidad and Tobago 643 801 657 680 771 689
United States 847,381 862,220 874,096 866,358 843,683 812,514 778,901
Venezuela 29,785 33,487 32,708 30,506 28,494
AMERICAS ( 22 countries)(*1)(*2) 2,951,939 2,861,210 3,021,896 2,930,944 2,846,981 2,772,473 2,702,235
Caribbean (3 countries) (*3) 3,782 3,784 3,415 3,291 3,382 3,514 2,912
Central America ( 6 countries) (*4) 45,046 37,550 36,388 37,025 36,863 38,568 38,465
North America ( 3 countries) (*5) 1,075,482 1,089,396 1,106,543 1,114,010 1,088,687 1,114,237 1,066,688
South America (10 countries) (*6) 1,685,531 1,730,480 1,875,550 1,776,618 1,718,048 1,712,975 1,596,836
Note(*1) Americas refers to the 22 countries included in this Table. (*2) Regional and sub‐regional information comes from data calculated for indicated year or nearest available year. (*3) Data for Caribbean includes: Barbados, Saint Vincent and the Grenadines, and Trinidad and Tobago. (*4) Data for Central America includes: Belize, Costa Rica, El Salvador, Guatemala, Nicaragua, and Panama. (*5) Data for North America includes: Canada, Mexico and The United States. (*6) Data for South America includes: Argentina, Bolivia, Brazil, Chile, Colombia, Ecuador, Guyana, Paraguay, Suriname, and Venezuela.
4.20 ASSAULT, 2004‐2010 (TOTAL)
Total number of offenses of Assault reported by the Police. Assault means physical attack against the body of another person resulting in serious bodly injury, excluding indecent/sexual assault, threats and slapping/punching. Assault leading to death should also be excluded.
YEAR
Sub‐regional data: (*2)
Indicator definition
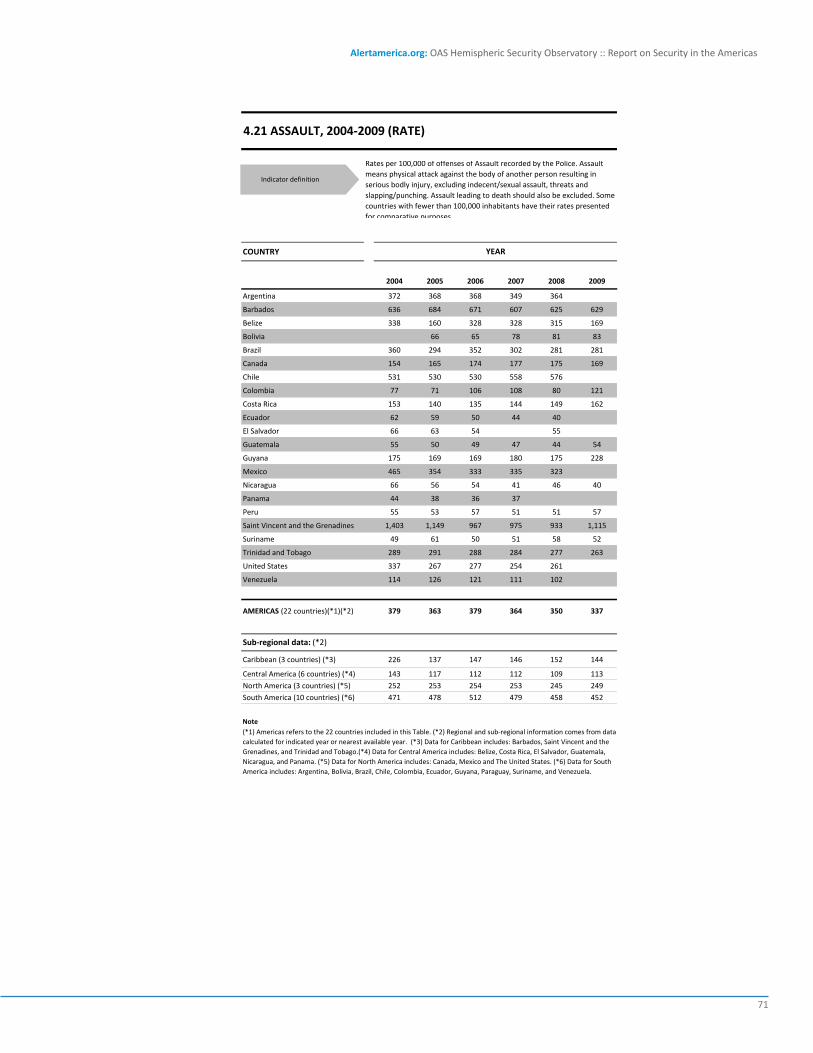
Alertamerica.org: OAS Hemispheric Security Observatory :: Report on Security in the Americas
71
Indicator definitionDefinición del indicador
COUNTRY
2004 2005 2006 2007 2008 2009
Argentina 372 368 368 349 364
Barbados 636 684 671 607 625 629
Belize 338 160 328 328 315 169
Bolivia 66 65 78 81 83
Brazil 360 294 352 302 281 281
Canada 154 165 174 177 175 169
Chile 531 530 530 558 576
Colombia 77 71 106 108 80 121
Costa Rica 153 140 135 144 149 162
Ecuador 62 59 50 44 40
El Salvador 66 63 54 55
Guatemala 55 50 49 47 44 54
Guyana 175 169 169 180 175 228
Mexico 465 354 333 335 323
Nicaragua 66 56 54 41 46 40
Panama 44 38 36 37
Peru 55 53 57 51 51 57
Saint Vincent and the Grenadines 1,403 1,149 967 975 933 1,115
Suriname 49 61 50 51 58 52
Trinidad and Tobago 289 291 288 284 277 263
United States 337 267 277 254 261
Venezuela 114 126 121 111 102
AMERICAS (22 countries)(*1)(*2) 379 363 379 364 350 337
Caribbean (3 countries) (*3) 226 137 147 146 152 144
Central America (6 countries) (*4) 143 117 112 112 109 113
North America (3 countries) (*5) 252 253 254 253 245 249
South America (10 countries) (*6) 471 478 512 479 458 452
Note
(*1) Americas refers to the 22 countries included in this Table. (*2) Regional and sub‐regional information comes from data calculated for indicated year or nearest available year. (*3) Data for Caribbean includes: Barbados, Saint Vincent and the Grenadines, and Trinidad and Tobago.(*4) Data for Central America includes: Belize, Costa Rica, El Salvador, Guatemala, Nicaragua, and Panama. (*5) Data for North America includes: Canada, Mexico and The United States. (*6) Data for South America includes: Argentina, Bolivia, Brazil, Chile, Colombia, Ecuador, Guyana, Paraguay, Suriname, and Venezuela.
4.21 ASSAULT, 2004‐2009 (RATE)
Rates per 100,000 of offenses of Assault recorded by the Police. Assault means physical attack against the body of another person resulting in serious bodly injury, excluding indecent/sexual assault, threats and slapping/punching. Assault leading to death should also be excluded. Some countries with fewer than 100,000 inhabitants have their rates presented for comparative purposes.
YEAR
Sub‐regional data: (*2)
Indicator definition

Alertamerica.org: El Observatorio Hemisférico de Seguridad de la OEA :: Informe Sobre Seguridad en las Américas
72
Indicator definitionDefinición del indicador
COUNTRY
2000 2001 2002 2003 2004 2005 2006 2007 2008 2009 2010
Antigua and Barbuda 77 63 80 97 86 92 162 215 165 176 125
Argentina 360,746 385,420 471,892 435,630 355,329 355,196 353,752 338,951 388,165
Barbados 454 326 289 302 289 330 367 393 394 383 411
Belize 571 547 568 435 432 631 503 487 497 485
Bolivia 9,100 9,686 8,447 8,472 7,365 8,571 8,728 10,846 13,569 13,678 12,863
Brazil 899,184 777,927 893,724 848,387 844,228 879,897 811,705
Canada 32,084 30,990 32,437 34,641 34,182 32,372 32,463 30,405
Chile 97,158 89,644 74,462 78,252 93,462 89,633 91,902 91,982
Colombia (*7) 55,079 69,715 91,520 84,127 74,171 94,254 55,435
Costa Rica (*7) 13,267 16,458 15,014 17,640 19,956 21,610 23,554 23,120 40,707 45,545 43,185
Dominican Republic 52,467 53,821 93,496 81,399 27,539
Ecuador (*7) 55,175 49,471 47,776 45,697 46,618 47,076 51,641 53,277 14,162 14,221 15,982
El Salvador 10,041 7,209 4,905 4,152 12,072 10,987 9,154 9,595 9,779 9,554
Guatemala 18,622 17,589 18,120 19,106 16,875 14,494 9,154 9,587 9,777 9,537
Guyana 1,890 1,893 1,973 2,435 1,755 1,834 2,139 2,216 1,831 1,981 2,740
Jamaica 3,107 2,605 2,355 2,101 2,094 2,195 1,994 1,589 2,639 2,967 2,837
Mexico 508,444 531,598 510,010 510,156 510,250 511,321 541,949 607,471 655,116 679,823 741,764
Nicaragua (*7) 17,920 20,527 21,056 21,532 21,328 21,378 24,348 27,867 33,512 32,442 28,429
Panama 4,960 5,249 5,843 6,352 7,861 8,145 9,506
Paraguay (*7) 3,799 4,593 4,668 2,426 1,819 2,541 1,894 4,154 17,968 21,696 25,479
Peru (*7) 38,584 42,908 45,594 45,997 41,606 42,931 48,785 28,951
Saint Lucia 312 340 358 354 421 470 443 454 527 550 539
Saint Vincent and the Grenadines 62 73 79 56 47 68 17
Suriname 593 700 2,020 1,836 1,906 1,661
Trinidad and Tobago 4,792 4,940 5,220 5,109 4,468 5,338 6,350 5,312 5,399 6,289 5,498
United States 408,020 423,546 420,850 414,237 401,470 417,438 449,246 447,324 443,563 408,742 357,832
Uruguay 6,751 6,147 8,483 6,933 7,000 8,352 8,867 9,174 10,705 11,391 13,829
Venezuela 35,251 30,461 38,587 38,254 29,001 27,374 27,842 29,132
AMERICAS (28 countries)(*1)(*2) 2,638,509 2,693,590 2,760,822 2,715,239 2,614,514 2,515,853 2,727,983 2,784,666 2,834,568 2,859,111 2,745,507
Caribbean (*3) (7 countries) 61,270 60,803 60,831 60,493 59,887 60,965 63,216 101,514 90,570 37,972 36,966
Central America (*4) (6 countries) 65,381 67,291 64,623 67,824 75,623 74,350 72,556 77,007 84,546 103,348 100,696
North America (*5) (3 countries) 948,548 987,228 962,944 956,477 942,710 961,196 1,025,836 1,088,977 1,131,051 1,121,028 1,130,001
South America (*6) (12 countries) 1,563,310 1,578,268 1,672,424 1,630,445 1,536,294 1,419,342 1,566,376 1,517,167 1,528,401 1,596,763 1,477,844
Note (*1) Americas refers to the 28 countries included in this Table. (*2) Regional and sub‐regional information comes from data calculated for indicated year or nearest available yea. (*3) Data for Caribbean includes: Antigua and Barbuda, Bahamas, Barbados, Dominica, Dominican Republic, Grenada, Haiti, Jamaica, Saint Kitts and Nevis, Saint Lucia, Saint Vincent and the Grenadines, and Trinidad and Tobago. (*4) Data for Central America includes: Belize, Costa Rica, El Salvador, Guatemala, Honduras, Nicaragua, and Panama. (*5) Data for North America includes: Canada, Mexico, and The United States. (*6) Data for South America includes: Argentina, Bolivia, Brazil, Chile, Colombia, Ecuador, Guyana, Paraguay, Peru, Suriname, Uruguay, and Venezuela. (*7) Data for Colombia (2010), Costa Rica (2010), Nicaragua (2009), Ecuador (2008/09/10), Paraguay (2008/09/10), and Peru (2010) were obtained through the Inter‐American Development Bank's CISALVA Regional Indicators Project.
4.22 ROBBERY, 2000‐2010 (TOTAL)
Total number of offenses of robbery recorded by the Police. Robbery means the theft of property from a person, overcoming resistance by force or threat of force. Robbery should include muggings (bag‐snatching) and theft with violence, but should exclude pick‐pocketing and extorsion.
YEAR
Sub‐regional data: (*2)
Indicator definition

Alertamerica.org: OAS Hemispheric Security Observatory :: Report on Security in the Americas
73
Indicator definitionDefinición del indicador
COUNTRY
2000 2001 2002 2003 2004 2005 2006 2007 2008 2009 2010
Antigua and Barbuda 100 80 100 120 105 110 190 250 190 200 140
Argentina 977 1,033 1,253 1,146 926 917 905 858 973
Barbados 180 130 115 120 114 130 145 154 154 150 160
Belize 227 212 215 161 156 224 175 165 165 158
Bolivia 109 114 98 96 82 93 93 114 140 139 128
Brazil 489 418 475 446 440 454 415
Canada 101 97 100 106 104 97 96 90
Chile 609 556 457 475 562 533 542
Colombia (*7) 130 162 209 190 165 206 120
Costa Rica (*7) 338 410 366 422 469 499 536 519 943
Dominican Republic 556 556 953 818
Ecuador (*7) 448 397 378 358 361 360 391 399 105 104 116
El Salvador 169 121 82 69 200 181 151 157 159 155
Guatemala 166 153 154 158 136 114 70 72 71 68
Guyana 250 250 260 320 230 240 280 290 240 260 360
Jamaica 120 100 90 80 79 83 75 59 98 111 104
Mexico 519 537 510 505 500 496 520 577 616 633 670
Nicaragua (*7) 351 397 401 405 396 392 441 498 591 565 488
Panama 156 163 178 190 231 236 270
Paraguay (*7) 71 84 84 43 31 43 31 68 288 342 394
Peru (*7) 142 156 164 163 146 149 167 98
Saint Lucia 200 215 225 220 260 285 265 270 310 320 310
Saint Vincent and the Grenadines 57 67 72 51 43 62 16
Suriname 120 140 400 360 370 320
Trinidad and Tobago 370 380 400 390 340 405 480 400 405 470 410
United States 145 149 146 143 137 141 151 148 146 133 123
Uruguay 205 186 256 210 212 253 268 276 321 341 410
Venezuela 145 123 153 149 111 103 103 106
AMERICAS (28 countries)(*1)(*2) 289 296 306 286 308 296 318 321 332 295 456
Caribbean (7 countries) (*3) 200 188 188 180 163 435 446 709 625 225 201
Central America (6 countries) (*4) 228 231 218 226 240 232 223 247 210 95
North America (3 countries) (*5) 241 249 240 226 221 223 236 248 255 250 269
South America (12 countries) (*6) 518 527 620 489 419 382 417 399 430 376 404
Note
(*1) Americas refers to the 28 countries included in this Table. (*2) Regional and sub‐regional information comes from data calculated for indicated year or nearest available year. (*3) Data for Caribbean includes: Antigua and Barbuda, Bahamas, Barbados, Dominica, Dominican Republic, Grenada, Haiti, Jamaica, Saint Kitts and Nevis, Saint Lucia, Saint Vincent and the Grenadines, and Trinidad and Tobago. (*4) Data for Central America includes: Belize, Costa Rica, El Salvador, Guatemala, Honduras, Nicaragua, and Panama. (*5) Data for North America includes: Canada, Mexico and the United States. (*6) Data for South America includes: Argentina, Bolivia, Brazil, Chile, Colombia, Ecuador, Guyana, Paraguay, Peru, Suriname, Uruguay, and Venezuela. (*7) Data for Colombia (2010), Costa Rica (2010), Nicaragua (2009), Ecuador (2008/10), Paraguay (2008/10), and Peru (2010) were obtainned through the Inter‐American Development Bank's CISALVA Regional Indicators Project.
4.23 ROBBERY, 2000‐2010 (RATE)
Rates per 100,000 inhabitants of the number of offenses of Robbery recorded by the Police. Robbery means the theft of property from a person, overcoming resistance by force or threat of force. Robbery" should include muggings (bag‐snatching) and theft with violence, but should exclude pick‐pocketing and extorsion. Some countries with fewer than 100,000 inhabitants have their rates presented for comparative purposes.
YEAR
Sub‐regional data: (*2)
Indicator definition

Alertamerica.org: El Observatorio Hemisférico de Seguridad de la OEA :: Informe Sobre Seguridad en las Américas
74
COUNTRY
2004 2005 2006 2007 2008 2009 2010
Barbados 23 14 17 12 18
Belize 5 8 6 6 4 2
Bolivia 92 99 143 160 125 111
Brazil 300 418 524 503 278 507
Canada 3457 3896 4488 4660 4732 4791
Chile 114 141 177 175 266 246 259
Colombia 1442 800 687 521 437 213 188
Costa Rica 9 13 4 9 8 5 11
Ecuador 203 37 47
El Salvador 4 8 29
Guatemala 51 52 57 98 213 162
Jamaica 38 31 38 38 47 30
Mexico 323 325 595 438 907 1163 1284
Nicaragua 14 35 34 6 6 7
Panama 11 17 13 29 21 28
Paraguay 3 24 5 10 7 7
Peru 469 497 611 463 483 729 269
Saint Kitts and Nevis 3 2 3 8 2 1
Saint Vincent and the Grenadines 3 2 3 8 2 1
Trinidad and Tobago 28 58 17 14 17 8
AMERICAS (20 countries)(*2)(*3) 6591 6461 7475 7246 7643 8104
Caribbean (5 countries) (*4) 95 116 75 85 80 58Central America (6 countries) (*5) 94 108 123 176 281 232
North America (2 countries) (*6) 3780 4221 5083 5098 5639 5954
South America (7 countries) (*7) 2623 2016 2194 1832 1643 1860
Note(*1) Data for Colombia (2010), Nicaragua (2008/10), and Peru (2010) were obtained through Inter‐American Development Bank's CISALVA Regional Indicators and does not include the brief kidnapping crime known in Latin America as "Secuestro Express" . (*2) Americas refers to the 20 countries included in this Table. (*3) Regional and sub‐regional information comes from data calculated for indicated year or nearest available year. (*4) Data for Caribbean includes: Barbados, Jamaica, Saint Kitts and Nevis, Saint Vincent and the Grenadines, and Trinidad and Tobago. (*5) Data for Central America includes: Belize, Costa Rica, El Salvador, Guatemala, Nicaragua, and Panama. (*6) Data for North America includes: Canada and Mexico. (*7) Data for South America includes: Bolivia, Brazil, Chile, Colombia, Ecuador, Paraguay, and Peru.
4.24 KIDNAPPING, 2004‐2010 (TOTAL)
Number of Kidnapping offenses as reported by the Police. Kidnapping means unlawfully detaining a person or persons against their will (including through the use of force, threat, fraud, or enticement) for the purpose of demanding for their liberation an illicit gain or any other economic gain or other material benefit, or in order to oblige someone to do or not to do something. Kidnapping excludes disputes over child custody.
YEAR
Sub‐regional data: (*3)
Indicator definition
The countries of the Americas agreed to implement strategies to prevent crime and violence that address the specific risk factors in each state and provide a coordinated, effective response to the multiple challenges associated with common crime and transnational organized crime.
Excerpt from the Hemispheric Plan of Action on Citizen Security in the Americas approved by the OAS Permanent Council on May 2, 2012.

Alertamerica.org: OAS Hemispheric Security Observatory :: Report on Security in the Americas
75
COUNTRY
2004 2005 2006 2007 2008 2009 2010
Barbados 9.1 5.5 6.7 4.7 7.1
Belize 1.8 2.8 2.1 2.0 1.3 0.7
Bolivia 1.0 1.1 1.5 1.7 1.3 1.1
Brazil 0.2 0.2 0.3 0.3 0.1 0.3
Canada 10.8 12.1 13.7 14.1 14.2 14.2
Chile 0.7 0.9 1.1 1.1 1.1 1.4 1.5
Colombia 3.4 1.9 1.6 1.2 1.0 0.5 0.4
Costa Rica 0.2 0.3 0.1 0.2
Ecuador 1.6 0.3 0.4
El Salvador 0.1 0.1 0.5
Guatemala 0.4 0.4 0.4 0.7 1.6 1.2
Jamaica 1.4 1.2 1.4 1.4 1.6
Mexico 0.3 0.3 0.6 0.4 0.9 1.1 1.2
Nicaragua 0.3 0.6 0.6 0.1 0.1 0.1
Panama 0.3 0.5 0.4 0.9 0.6 0.8
Paraguay 0.4 0.1 0.2 0.1
Peru 1.7 1.8 2.2 1.6 1.7 2.5 0.9
Saint Kitts and Nevis 6.4 4.2 6.3 16.3 4.1 2.0
Saint Vincent and the Grenadines 2.8 1.8 2.8 7.3 1.8 0.9
Trinidad and Tobago 2.1 4.4 1.3 1.1 1.3 0.6
AMERICAS (20 countries)(*2)(*3) 1.5 1.4 1.6 1.5 1.6 1.7
Caribbean (5 countries) (*4) 2.2 2.6 1.7 1.9 1.8 1.3
Central America (6 countries) (*5) 0.3 0.3 0.4 0.5 0.8 0.7
North America (2 countries) (*6) 2.8 3.1 3.7 3.7 4.0 4.2
South America (7 countries) (*7) 0.9 0.7 0.7 0.6 0.5 0.6
Note (*1) Data for Colombia (2010), Nicaragua (2008/10), and Peru (2010) were obtainned through Inter‐American Development Bank's CISALVA Regional Indicators and does not include the brief kidnapping crime known in Latin America as "Secuestro Express". (*2) Americas refers to the 20 countries included in this Table. (*3) Regional and sub‐regional information comes from data calculated for indicated year or nearest available year. (*4) Data for Caribbean includes: Barbados, Jamaica, Saint Kitts and Nevis, Saint Vincent and the Grenadines, and Trinidad and Tobago. (*5) Data for Central America includes: Belize, Costa Rica, El Salvador, Guatemala, Nicaragua, and Panama. (*6) Data for North America includes: Canada and Mexico. (*7) Data for South America includes: Bolivia, Brazil, Chile, Colombia, Ecuador, Paraguay, and Peru.
4.25 KIDNAPPING, 2004‐2010 (RATE)
Rate of Kidnapping per 100,000 inhabitants as reported by the Police. Kidnapping means unlawfully detaining a person or persons against their will (including through the use of force, threat, fraud, or enticement) for the purpose of demanding for their liberation an illicit gain or any other economic gain or other material benefit, or in order to oblige someone to do or not to do something. Kidnapping excludes disputes over child custody. Some countries with fewer than 100,000 inhabitants have their rates presented for comparative purposes.
YEAR
Sub‐regional data: (*2)
Indicator definition
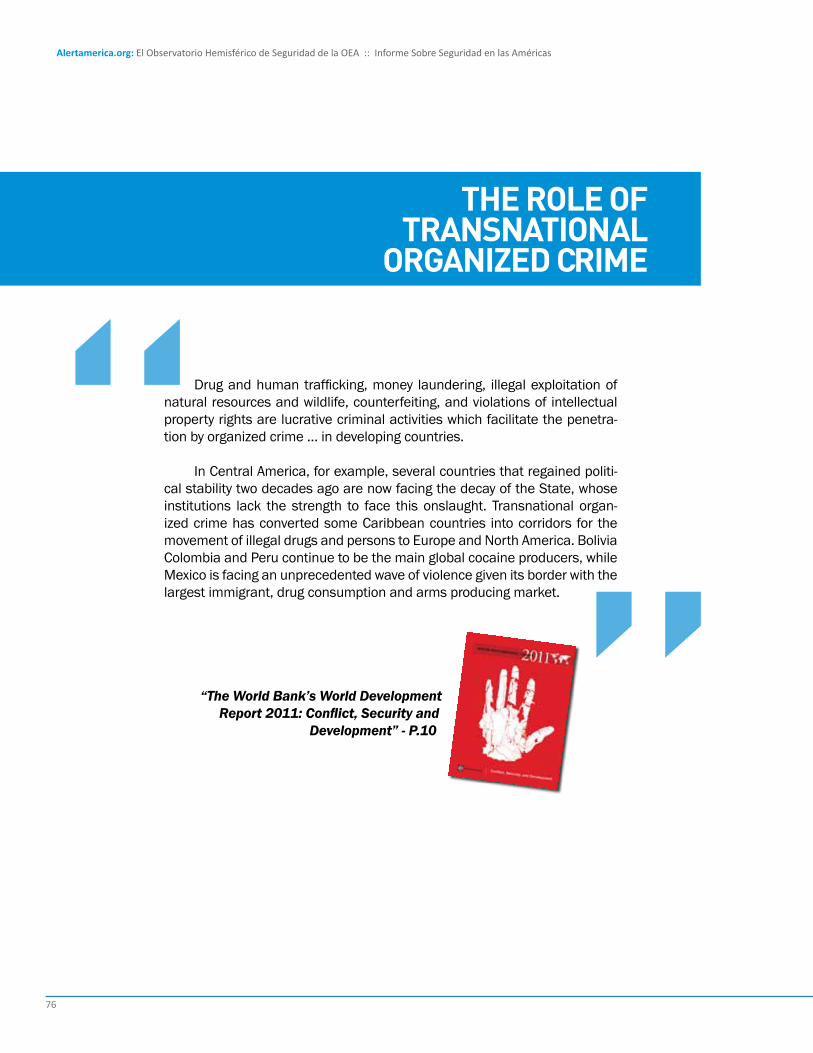
Alertamerica.org: El Observatorio Hemisférico de Seguridad de la OEA :: Informe Sobre Seguridad en las Américas
76
Drug and human trafficking, money laundering, illegal exploitation of natural resources and wildlife, counterfeiting, and violations of intellectual property rights are lucrative criminal activities which facilitate the penetra-tion by organized crime … in developing countries.
In Central America, for example, several countries that regained politi-cal stability two decades ago are now facing the decay of the State, whose institutions lack the strength to face this onslaught. Transnational organ-ized crime has converted some Caribbean countries into corridors for the movement of illegal drugs and persons to Europe and North America. Bolivia Colombia and Peru continue to be the main global cocaine producers, while Mexico is facing an unprecedented wave of violence given its border with the largest immigrant, drug consumption and arms producing market.
“The World Bank’s World Development Report 2011: Conflict, Security and
Development” - P.10
THe Role of TRansnaTIonal
oRganIzeD cRIMe

Alertamerica.org: OAS Hemispheric Security Observatory :: Report on Security in the Americas
77
COUNTRY
2004 2005 2006 2007 2008 2009
Argentina 329,462 303,550 291,802 264,488 285,187
Barbados 1,268 1,130 1,257 1,225 1,397 1,371
Belize 1,497 1,678 1,857 1,168 1,320 1,227
Bolivia 3,981 3,837 3,944 4,566 5,028 5,569
Brazil 1,672,098 1,336,609 1,598,260 1,405,559 1,251,934 1,195,402
Canada 690,967 655,885 634,912 597,504 569,714 574,950
Chile 85,652 155,270 153,713 167,893 175,648 191,103
Colombia 55,079 69,739 89,924 82,870 73,337 93,142
Costa Rica 7,839 8,361 8,393 12,329 4,764
Ecuador 4,719 5,956 5,968
El Salvador 10,720 11,417 8,355
Guatemala 5,172 4,303 3,875 4,131 4,768 6,034
Guyana 317 418 319 247 205
Jamaica 1,492 2,439 3,768
Mexico 83,143 84,827 85,775 99,536 105,398 132,345
Nicaragua 15,440 14,512 17,474 20,863 19,888
Panama 11,873 13,978 17,928 13,982 16,608 18,168
Paraguay 1,367 1,352 2,009 2,714
Peru 57,560 52,435 49,423 45,228 47,310 49,477
Saint Vincent and the Grenadines 2,017 1,933 1,849 1,531 1,729 1,845
Trinidad and Tobago 1,937 2,752 3,064 3,570 4,407 3,772
United States 6,937,089 6,783,447 6,626,363 6,591,542 6,586,206 6,338,095
Uruguay 98,416 104,909 101,972 99,846 105,564 94,508
Venezuela 64,011 59,001 55,684 54,142 50,842
AMERICAS (24 countries)(*1)(*2) 10,143,117 9,678,094 9,768,673 9,494,758 9,339,625 9,088,699
Caribbean (4 countries) (*3) 6,714 7,307 7,662 8,765 11,301 10,756
Central America (6 countries) (*4) 52,541 53,552 60,944 63,890 63,268 58,436
North America (3 countries) (*5) 7,711,199 7,524,159 7,347,050 7,288,582 7,261,318 7,045,390
South America (11 countries) (*6) 2,372,662 2,093,077 2,353,017 2,133,521 2,003,738 1,974,117
Note(*1) Americas refers to the 24 countries included in this Table. (*2) Regional and sub‐regional information comes from data calculated for indicated year or nearest available year. (*3) Data for Caribbean includes: Barbados, Jamaica, Saint Vincent and the Grenadines, and Trinidad and Tobago. (*4) Data for Central America includes: Belize, Costa Rica, El Salvador, Guatemala, Nicaragua, and Panama. (*5) Data for North America includes: Canada, Mexico, and The United States. (*6) Data for South America includes: Argentina, Bolivia, Brazil, Chile, Colombia, Ecuador, Guyana, Paraguay, Peru, Uruguay, and Venezuela.
4.26 THEFT, 2004‐2009 (TOTAL)
Total number of Theft offenses reported by the Police. Theft means depriving a person or organization of property without force with the intent to keep it. Theft excludes burglary, house‐breaking, robbery and theft of a motor vehicle.
YEAR
Sub‐regional data: (*2)
Indicator definition

Alertamerica.org: El Observatorio Hemisférico de Seguridad de la OEA :: Informe Sobre Seguridad en las Américas
78
COUNTRY
2004 2005 2006 2007 2008 2009
Argentina 859 784 746 670 715
Barbados 501 447 495 480 548 536
Belize 543 583 629 396 439 400
Bolivia 44 42 42 48 52 56
Brazil 909 718 849 739 652 617
Canada 2,160 2,030 1,945 1,812 1,710 1,704
Chile 531 953 933 1,009 1,045 1,126
Colombia 130 162 206 187 163 204
Costa Rica 248 242 238 277 104
Ecuador 37 46 45
El Salvador 177 188 136
Guatemala 42 34 30 31 35 43
Guyana 42 55 42 32 27
Jamaica 56 91 140
Mexico 81 82 82 95 99 123
Nicaragua 287 266 316 373 351
Panama 374 434 545 418 489 526
Paraguay 24 23 33 44
Peru 209 188 175 159 164 170
Saint Vincent and the Grenadines 1,850 1,773 1,696 1,405 1,586 1,693
Trinidad and Tobago 147 209 232 269 331 282
United States 2,367 2,294 2,219 2,186 2,164 2,064
Uruguay 2,981 3,173 3,077 3,004 3,168 2,825
Venezuela 245 222 206 197 182
AMERICAS (24 countries)(*1)(*2) 1,235 1,158 1,152 1,132 1,106 1,130
Caribbean (4 countries) (*3) 155 168 176 201 258 246
Central America (6 countries) (*4) 167 167 187 193 188 171
North America (3 countries) (*5) 1,806 1,745 1,687 1,657 1,635 1,572
South America (11 countries) (*6) 659 574 638 572 531 518
Note(*1) Americas refers to the 24 countries included in this Table. (*2) Regional and sub‐regional information comes from data calculated for indicated year or nearest available year. (*3) Data for Caribbean includes: Barbados, Jamaica, Saint Vincent and the Grenadines, and Trinidad and Tobago. (*4) Data for Central America includes: Belize, Costa Rica, El Salvador, Guatemala, Nicaragua, and Panama. (*5) Data for North America includes: Canada, Mexico, and The United States. (*6) Data for South America includes: Argentina, Bolivia, Brazil, Chile, Colombia, Ecuador, Guyana, Paraguay, Peru, Uruguay, and Venezuela.
4.27 THEFT, 2004‐2009 (RATE)
Total number of Theft offenses reported by the Police. Theft means depriving a person or organization of property without force with the intent to keep it. Theft excludes burglary, house‐breaking, robbery and theft of motor vehicule. Some countries with fewer than 100,000 inhabitants have their rates presented for comparative purposes.
YEAR
Sub‐regional data: (*2)
Indicator definition

Alertamerica.org: OAS Hemispheric Security Observatory :: Report on Security in the Americas
79
COUNTRY
2003 2004 2005 2006 2007 2008 2009
Argentina 52,559 52,714 53,193 62,018
Barbados 107 121 115 97 77 92
Bolivia 3,285 2,869 3,153 3,543
Brazil 212,400 194,821 210,097 172,249 165,614 168,200
Canada 174,566 170,277 160,014 158,638 145,714 125,568 107,992
Chile 5,536 9,338 11,359 13,025 18,250 20,420
Colombia 22,639 18,963 19,811 18,303 19,630 21,538
Costa Rica 5,330 4,765 5,115 5,601 6,121
Ecuador 5,505 6,033 6,257 6,866 7,766
Guatemala 4,649 4,029 5,785 3,165 3,244 3,310
Jamaica 2,352 2,174 2,104 2,124 2,232
Mexico 141,972 140,912 144,117 160,017 190,069 198,500
Panama 804 1,549 1,508 1,263 1,607 1,879 1,963
Peru 8,790 10,632 12,560 10,428 11,224 12,838 13,786
Saint Vincent and the Grenadines 36 24 30 21 36 29
Trinidad and Tobago 1,428 1,329 1,496 1,795 1,750 1,642
United States 1,257,112 1,237,856 1,235,863 1,198,433 1,098,505 958,629 794,626
Venezuela 41,078 28,740 25,780 30,275 36,827
AMERICAS (18 countries)(*1)(*2) 1,940,149 1,910,617 1,876,851 1,864,152 1,738,405 1,617,763 1,450,606
Caribbean (4 countries) (*3) 3,923 3,826 3,815 4,017 3,987 3,995
Central America (3 countries) (*4) 10,782 10,963 10,652 12,649 10,373 11,243 11,394
North America (3 countries) (*5) 1,573,650 1,550,105 1,536,789 1,501,188 1,404,236 1,274,266 1,101,118
South America (8 countries) (*6) 351,793 345,625 325,584 346,501 319,779 328,267 334,099
Note(*1) Americas refers to the 18 countries included in this Table. (*2) Regional and sub‐regional information comes from data calculated for indicated year or nearest available year. (*3) Data for Caribbean includes: Barbados, Jamaica, Saint Vincent and the Grenadines, and Trinidad and Tobago. (*4) Data for Central America includes: Costa Rica, Guatemala, and Panama. (*5) Data for North America includes: Canada, Mexico, and The United States. (*6) Data for South America includes: Argentina, Bolivia, Brazil, Chile, Colombia, Ecuador, Peru, and Venezuela.
4.28 THEFT OF MOTOR VEHICLES, 2003‐2009 (TOTAL)
Theft of Motor Vehicle means the removal of a motor vehicle without the consent of the owner of the vehicle. Motor vehicles includes all land vehicles with an engine that runs on the road, including cars, motorcycles, buses, lorries, construction, and agricultural vehicles.
YEAR
Sub‐regional data: (*2)
Indicator definition

Alertamerica.org: El Observatorio Hemisférico de Seguridad de la OEA :: Informe Sobre Seguridad en las Américas
80
COUNTRY
2003 2004 2005 2006 2007 2008 2009
Argentina 136 135 135 156
Barbados 42 48 45 38 30 36
Bolivia 35 30 33 36
Brazil 116 105 112 91 86 87
Canada 551 532 495 486 442 377 320
Chile 35 58 70 79 110 122
Colombia 53 44 45 41 44 47
Costa Rica 128 112 118 127 134
Ecuador 43 47 48 52 57
Guatemala 38 32 44 24 24 24
Jamaica 89 82 79 79 84
Mexico 139 137 138 152 179 185
Panama 26 49 47 38 48 55 57
Peru 32 39 45 37 39 45 47
Saint Vincent and the Grenadines 33 22 28 19 33 27
Trinidad and Tobago 109 101 113 135 131 123
United States 433 422 418 401 364 315 259
Venezuela 160 110 97 112 134
AMERICAS (18 countries)(*1)(*2) 252 245 238 233 215 198 176
Caribbean (4 countries) (*3) 92 89 89 93 92 92
Central America (3 countries) (*4) 60 59 56 65 52 55 55
North America (3 countries) (*5) 383 373 367 355 329 296 253
South America (8 countries) (*6) 104 101 94 99 90 91 91
Note (*1) Americas refers to the 18 countries included in this Table. (*2) Regional and sub‐regional information comes from data calculated for indicated year or nearest available year. (*3) Data for Caribbean includes: Barbados, Jamaica, Saint Vincent and the Grenadines, and Trinidad and Tobago. (*4) Data for Central America includes: Costa Rica, Guatemala, and Panama. (*5) Data for North America includes: Canada, Mexico, and The United States. (*6) Data for South America includes: Argentina, Bolivia, Brazil, Chile, Colombia, Ecuador, Peru, and Venezuela.
4.29 THEFT OF MOTOR VEHICLES, 2003‐2009 (RATE)
Theft of Motor Vehicle means the removal of a motor vehicle without the consent of the owner of the vehicle. Motor vehicles includes all land vehicles with an engine that runs on the road, including cars, motorcycles, buses, lorries, construction, and agricultural vehicles. Some countries with fewer than 100,000 inhabitants have their rates presented for comparative purposes.
YEAR
Sub‐regional data: (*2)
Indicator definition

Alertamerica.org: OAS Hemispheric Security Observatory :: Report on Security in the Americas
81
COUNTRY
2004 2005 2006 2007 2008 2009 2010
Antigua and Barbuda 2,870 2,982 2,805 2,924 2,131 1,936 1,736
Barbados 2,179 2,107 2,097 1,800 2,108 1,972 1,799
Belize 1,660 1,758 1,514 1,256 1,303 1,285
Brazil 240,193 171,948 247,877 205,613 200,218 191,214
Canada 275,869 261,362 251,361 231,520 211,065 205,998 196,565
Guatemala 1,129 1,928 1,628 1,442 1,507 1,572
Guyana 2,654 2,323 1,959 1,872 1,848 1,743 2,379
Jamaica 1,087 957 280 332 493 510 382
Mexico 141,885 142,640 154,655 162,003 161,907 174,541 191,575
Panama 818 2,738 2,788 3,151 3,175 3,225
Peru 8,861 6,136 5,412 4,701 3,994 3,992
Saint Lucia 648 528 668 588 595 688 609
Saint Vincent and the Grenadines 1,563 1,492 1,301 1,301 1,107 1,107 1,724
Trinidad and Tobago 21,024 21,747 21,830 19,256 23,328 20,739 19,445
United States 2,144,446 2,155,448 2,194,993 2,190,198 2,228,887 2,203,313 2,159,878
AMERICAS (15 countries)(*1)(*2) 2,846,886 2,774,174 2,891,118 2,827,594 2,843,642 2,813,785 2,777,380
Caribbean (6 countries) (*3) 29,371 29,813 28,981 26,201 29,762 26,952 25,695
Central America (3 countries) (*4) 3,607 4,504 5,880 5,486 5,961 6,032 6,082
North America (3 countries) (*5) 2,562,200 2,559,450 2,601,009 2,583,721 2,601,859 2,583,852 2,548,018
South America (3 countries) (*6) 251,708 180,407 255,248 212,186 206,060 196,949 197,585
Note (*1) Americas refers to the 15 countries included in this Table. (*2) Regional and sub‐regional information comes from data calculated for indicated year or nearest available year. (*3) Data for Caribbean includes: Antigua and Barbuda, Barbados, Jamaica, Saint Lucia, Saint Vincent and the Grenadines, and Trinidad and Tobago. (*4) Data for Central America includes: Belize, Guatemala, and Panama. (*5) Data for North America includes: Canada, Mexico, and The United States. (*6) Data for South America includes: Brazil, Guyana, and Peru.
4.30 BURGLARY, 2004‐2010 (TOTAL)
Total number of Burglary offenses reported by the Police. Burglary means gaining unauthorized access to a part of a building/dwelling or other premises, including by use of force, with the intent to steal goods (breaking and entering). Burglary should include, where possible, theft from a house, apartment or other dwelling place, factory, shop or office, from a military establishment, or by using false keys. It should exclude theft from a car, from a container, from a vending machine, from a parking meter and from a fenced meadow/compound.
YEAR
Sub‐regional data: (*2)
Indicator definition
To evaluate at the national level public policies on citizen security, the OAS member States proposes: to develop and/or strengthen effective technical and methodological tools that allow the measurement of the impact of policies, plans, and programs.
Excerpt from the Hemispheric Plan of Action on Citizen Security in the Americas approved by the OAS Permanent Council on May 2, 2012.

Alertamerica.org: El Observatorio Hemisférico de Seguridad de la OEA :: Informe Sobre Seguridad en las Américas
82
COUNTRY
2004 2005 2006 2007 2008 2009 2010
Antigua and Barbuda 3,500 3,550 3,300 3,400 2,449 2,200 1,951
Barbados 861 833 826 706 827 770 700
Belize 601 623 526 426 433 419
Brazil 131 92 132 108 104 99
Canada 862 809 770 702 634 611 580
Guatemala 9 15 12 11 11 11
Guyana 348 304 256 245 242 229 313
Jamaica 41 36 11 12 18 19 14
Mexico 139 138 148 154 152 162 173
Panama 25 83 83 93 92 92
Peru 32 22 19 16 14 14
Saint Lucia 400 320 400 350 350 400 350
Saint Vincent and the Grenadines 1,434 1,369 1,194 1,194 1,016 1,016 1,582
Trinidad and Tobago 1,600 1,650 1,650 1,450 1,750 1,550 1,450
United States 732 729 735 726 732 718 700
AMERICAS ( 15 countries)(*1)(*2) 432 416 429 415 414 405 396
Caribbean (6 countries) (*3) 644 651 630 567 641 582 547
Central America (3 countries) (*4) 23 28 35 32 34 34 33
North America (3 countries) (*5) 600 594 597 587 586 577 562
South America (3 countries) (*6) 119 84 118 97 93 88 88
Note (*1) Americas refers to the 15 countries included in this Table. (*2) Regional and sub‐regional information comes from data calculated for indicated year or nearest available year. (*3) Data for Caribbean includes: Antigua and Barbuda, Barbados, Jamaica, Saint Lucia, Saint Vincent and the Grenadines, and Trinidad and Tobago. (*4) Data for Central America includes: Belize, Guatemala, and Panama. (*5) Data for North America includes: Canada, Mexico, and The United States. (*6) Data for South America includes: Brazil, Guyana, and Peru.
4.31 BURGLARY, 2004‐2010 (RATE)
Total number of Burglary offenses reported by the Police. Burglary means gaining unauthorized access to a part of a building/dwelling or other premises, including by use of force, with the intent to steal goods (breaking and entering). Burglary should include, where possible, theft from a house, apartment or other dwelling place, factory, shop or office, from a military establishment, or by using false keys. It should exclude theft from a car, from a container, from a vending machine, from a parking meter and from a fenced meadow/compound. Some countries with fewer than 100,000 inhabitants have their rates presented for comparative purposes.
YEAR
Sub‐regional data:
Indicator definition

IncauTacIones De DRogasDRug seIzuRes

Alertamerica.org: El Observatorio Hemisférico de Seguridad de la OEA :: Informe Sobre Seguridad en las Américas
84
Drug Courts are separate dockets or calen-dars within the traditional criminal court system. These specialized programs offer a judicially su-pervised regimen of substance abuse treatment and other needed social services in lieu of cri-minal prosecution or incarceration. Participants undergo random weekly drug testing, and attend frequent status hearings in court, during which the judge reviews their progress in treatment and may impose a range of consequences contingent upon their performance (National Association of Drug Court Professionals [NADCP], 1997). The consequences may include punitive sanctions (for example, writing assignments, community service, or brief jail detention), desired rewards (for example, verbal praise or reduced supervision requirements) or modifications to the participant’s treatment plan. In pre-adjudication Drug Courts, successful gra-duates have their charge(s) withdrawn and may also have an opportunity to have the offense ex-punged from their record. In post-adjudication Drug Courts, graduates may avoid incarceration, reduce the conditions of their probation, or con-solidate multiple probationary sentences.
The first Drug Court was founded in Mia-mi/Dade County, Florida in the United States in 1989. Currently, there are more than 2,400 Drug Courts in the U.S. plus an additional 1,100 Problem-Solving Courts that provide comparable services for offenders presenting with other types of problems, such as mental illness (Huddleston & Marlowe, 2011). At least 20 countries other than the U.S. have also established Drug Courts—or Drug Treatment Courts, as they tend to be ca-lled in other countries— including Canada, Mexi-co, Brazil, Chile, Suriname and some Caribbean Nations (Cooper, et al., 2010).
In the summer of 2010, the Inter-American Drug Abuse Control Commission (CICAD) of the Organization of American States (OAS) adop-ted a Hemispheric Drug Strategy which, among other provisions, encourages member States to develop Drug Treatment Courts and other court-supervised treatment alternatives to incarcera-tion for addicted individuals charged with drug-related crimes (OAS, 2010). Through a three-year seed program, CICAD/OAS is offering training and technical assistance to help member Sta-tes plan for, implement and evaluate new Drug Treatment Court programs. In addition, the U.S. State Department, in collaboration with the U.S. White House Office of National Drug Control Poli-cy (ONDCP) and the U.S. National Association of Drug Court Professionals (NADCP), has provided training programs for several Latin-American and Caribbean nations, including assisting Mexico to open its first Drug Treatment Court in Monterey, Nuevo Leon in 2010.
effecTIVeness anDcosT-effecTIVeness
More than two decades of exhaustive re-search in the U.S. has proven beyond a reasona-ble doubt that Drug Courts reduce crime, reduce drug abuse, and improve participants’ emotio-nal health and productivity. Six meta-analyses (advanced statistical procedures) conducted by independent scientific teams each found that Drug Courts significantly reduced crime (usually measured by re-arrest rates) by an average of 8 to 26 percent (Aos et al., 2006; Downey & Ro-man, 2010; Latimer et al., 2006; Lowenkamp et al., 2005; Shaffer, 2010; Wilson et al., 2006). The best Drug Courts reduced crime by nearly one half. A cost-related meta-analysis in the U.S. concluded that Drug Courts produced an average of $2.21 in direct benefits to the criminal justice system for every $1 invested — a 221% return on investment (Bhati et al., 2008). The best Drug Courts returned between $13 and $27 in finan-cial benefits to their communities for every $1 that was invested.
DRug couRT acTIVITy In THe aMeRIcas
By: Douglas MarloweChief of Science, Policy and Law at the National Association
of Drug Court Professionals

Alertamerica.org: OAS Hemispheric Security Observatory :: Report on Security in the Americas
85
In other countries in the Americas, most Drug Treatment Courts are still in the formative stages and efforts to empirically evaluate their outcomes are only now being initiated. However, a recent study conducted by American University on behalf of CICAD/OAS analyzed survey respon-ses from Drug Treatment Court officials in twelve countries, including Canada, Mexico, Brazil, Chi-le, Suriname, Bermuda and Jamaica (Cooper et al., 2010). The large majority of the respondents reported their anecdotal observations that Drug Treatment Courts were reducing criminal recidi-vism in their countries considerably better than traditional correctional dispositions, and approxi-mately half of the respondents reported achie-ving notable cost savings.
Brazil, for example, reported 12% recidi-vism for participants in its Drug Treatment Court in Rio de Janeiro, as compared to a general re-cidivism rate of 80% for non-treatment-oriented criminal dispositions. It was further estimated that treatment costs for the Rio de Janeiro Drug Treatment Court were approximately $100 per participant, as compared to between $200 and $500 for traditional penal responses. Of course, these figures are merely estimates, and it is un-clear whether the comparison figures for traditio-nal correctional programs fairly reflect a compara-ble population of offenders who would otherwise be eligible and suited for a Drug Treatment Court. Nevertheless, the results confirm that Drug Treatment Courts are feasible and desirable to implement in a wide range of Latin-American and Caribbean nations.
cHallenges To IMPleMenTaTIon
The American University survey identified a number of common challenges to implemen-ting Drug Treatment Courts that were reported by several countries. The most frequently repor-ted challenges were a lack of adequate funding (especially for treatment services), high rates of staff turnover, an under-appreciation of the se-rious problems faced by participants, inadequate services for teens and young adults, and an in-
sufficient availability of adjunctive services, such as childcare and vocational training. These cha-llenges are virtually identical to those commonly reported in the U.S. and do not appear to reflect unique barriers faced by Latin-American or Ca-ribbean countries.
Importantly, few respondents voiced con-cerns about the “fit” of the Drug Court model to their nation’s legal system or traditions. Some representatives from civil law countries poin-ted to difficulties they might conceivably face in adapting Drug Court procedures to the dictates of their penal codes and procedures; however, none of those issues was viewed as insurmountable. Countries that follow a common-law legal tradi-tion, which draws heavily upon court opinions and case law to generate legal principles, might be expected to have a relatively easier time incorpo-rating Drug Court practices into their courtroom operations; however, no general legal doctrine in civil law countries was identified that should pre-vent the introduction of Drug Treatment Courts.
Mexico introduced Drug Treatment Courts alongside broader efforts to institute oral trials in its court system, in which lawyers advocate for their clients before the bench rather than sim-ply filing paperwork with the clerk (e.g., Padgett, 2011). Court interactions are critical to the suc-cess of Drug Courts, because it is often in the

Alertamerica.org: El Observatorio Hemisférico de Seguridad de la OEA :: Informe Sobre Seguridad en las Américas
86
courtroom that clinical and supervision require-ments are discussed and behavioral consequen-ces are imposed (e.g., Marlowe & Wong, 2008). Therefore, live trial proceedings are an essential ingredient for Drug Treatment Courts to thrive in Mexico and elsewhere.
besT PRacTIces
Research in the U.S. has identified specific practices within Drug Courts that produce the best outcomes. Generally speaking, Drug Courts are most effective when they faithfully adhere to the original model described by NADCP in 1997 in its defining document, entitled Defining Drug Courts: The Key Components [commonly referred to as the “10 Key Components”]. More effecti-ve and more cost-effective outcomes have been achieved, for example, by Drug Courts that held weekly team meetings with all staff members re-gularly in attendance; scheduled status hearings in court on at least a bi-weekly basis for the first few months of treatment; provided evidence-ba-sed substance abuse treatment and case-mana-gement services; conducted random urine drug testing at least twice per week; and administered gradually escalating sanctions for infractions and rewards for achievements (Carey et al., 2008). Programs that dropped or diluted these key ele-ments have typically paid dearly for it in terms of
higher failure rates, greater criminal recidivism, and lower cost benefits.
It remains an open question whether similar lessons will be learned in other countries. Vir-tually all of the countries polled in the American University survey reported that they are providing services in their Drug Treatment Courts that are quite consistent with those of the 10 Key Com-ponents. It appears that many international Drug Treatment Courts are exporting the model largely as designed with relatively modest adaptations, rather than attempting to redesign the program from scratch. Future research will hopefully re-veal what changes, if any, are necessary to adapt the model to the needs and traditions of various countries and peoples.
goIng To scale
Despite their unquestioned efficacy, Drug Courts in the U.S. still serve only a small fraction of the roughly 1.5 million adults arrested each year who meet criteria for substance abuse or dependence (Bhati et al., 2008). The primary obstacle to expanding the reach of Drug Courts in the U.S. is a lack of funding, and not an absence of judicial interest or public support (Huddleston & Marlowe, 2011). Convincing lawmakers that they will recoup their initial investments and reap
Alertamerica.org: OAS Hemispheric Security Observatory :: Report on Security in the Americas
87
substantial economic gains by investing in Drug Courts is now a primary goal of rational drug po-licy in the U.S.
Other countries seeking to extend the reach of Drug Treatment Courts will almost certainly face comparable challenges. Although some in-ternational commentators may attempt to distin-guish between “drug consumer countries” such as the United States and “drug producer coun-ties” such as Mexico or Colombia, this differen-tiation is one of degree rather than substance. There is no shortage of drug manufacturing or sa-les activities in the U.S., or of drug consumption activities in South American countries. Like the U.S., prison systems in many Latin-American and Caribbean nations are overflowing with drug-in-volved inmates and are bordering on bankruptcy. According to the OAS Observatory on Citizen Secu-rity (2011) (www.alertamerica.org), approximately 60% of prison inmates in many South American countries suffer from alcohol or drug problems, and only 42% of South American citizens receive necessary substance abuse treatment services. The need for Drug Treatment Courts is not quali-tatively different in the U.S. from most other coun-tries. The problems of addiction and drug-related crime are global in scope and the solutions must be equally global in reach. Attributing the drug problem to just one or a few countries is wishful thinking at best and self-delusion at worst.
The big question is whether the criminal
justice systems of various countries will move in the proper direction. Facing huge budget defi-cits, some governments are imposing across-the-board funding cuts to correctional and treatment programs. There is no need to speculate about the likely effects of such actions. If history is a guide, any cost savings that might be realized in the short term will shift the financial burden to a later date as the result of increased crime, drug abuse and related impairments.
Other governments are cutting expenditures to innovative programs such as Drug Courts, in part because newer programs often have lesser political support or public visibility. Again, there is little reason to speculate about the likely effects of such actions. The research literature is replete with
evidence for the superior effects of Drug Courts over traditional correctional rehabilitation efforts.
The best course of action is to shift funds away from costly and ineffective programs to tho-se that are proven to reduce crime and conserve scarce resources. Rather than taking an “axe” to cost-effective programs, policymakers should reallocate funds away from inefficient programs, reinvest them in evidence-based programs, and return the resulting cost savings to taxpayers. Much is possible if lawmakers apply what works rather than what is expedient, comfortable or po-pular. If lawmakers do not rise to this challenge, all of the research in the world will have little im-pact on public health or public safety.
RefeRences
Aos, S., Miller, M., & Drake, E. (2006). Evidence-based public policy options to reduce future prison construc-tion, criminal justice costs, and crime rates. Olympia, WA: Washington State Institute for Public Policy. Availa-ble at http://www.wsipp.wa.gov/rptfiles/06-10-1201.pdf.
Bhati, A. S., Roman, J. K., & Chalfin, A. (2008). To treat or not to treat: Evidence on the prospects of expan-ding treatment to drug-involved offenders. Washing-ton, DC: The Urban Institute. Available at http://www.urban.org/UploadedPDF/411645_treatment_offen-ders.pdf.
Carey, S. M., Finigan, M. W., & Pukstas, K. (2008). Exploring the key components of drug courts: A com-parative study of 18 adult drug courts on practices, outcomes and costs. Portland, OR: NPC Research. Available at http://www.npcresearch.com/Files/NIJ_Cross-site_Final_Report_0308.pdf.
Cooper, C. S., Franklin, B., & Mease, T. (2010, April). Establishing drug treatment courts: Strategies, expe-riences and preliminary outcomes. Washington DC: Justice Programs Office, School of Public Affairs, Ame-rican University. Available at http://www.cicad.oas.org/fortalecimiento_institucio-nal/dtca/files/Establishing_DTC_%20Strategies_Ex-periences_Preliminary_Outcomes_volume%201.pdf.

Alertamerica.org: El Observatorio Hemisférico de Seguridad de la OEA :: Informe Sobre Seguridad en las Américas
88
Downey, P. M., & Roman, J. K. (2010). A Bayesian meta-analysis of drug court cost-effectiveness. Wash-ington DC: The Urban Institute. Available at http://www.dccrimepolicy.org/costbenefitanalysis/images/BAMCBA1-post-copy-edit-6-2-11_3.pdf.
Huddleston, W., & Marlowe, D. B. (2011). Painting the current picture: A national report on drug courts and other problem solving court programs in the United States. Alexandria, VA: National Drug Court Institute. Available at http://www.ndci.org/sites/default/files/nadcp/PCP%20Report%20FINAL.PDF.
Latimer, J., Morton-Bourgon, K., & Chretien, J. (2006). A meta-analytic examination of drug treatment courts: Do they reduce recidivism? Canada Dept. of Justice, Research & Statistics Division.
Lowenkamp, C. T., Holsinger, A. M., & Latessa, E. J. (2005). Are drug courts effective? A meta-analytic re-view. Journal of Community Corrections, Fall, 5-28.
Marlowe, D. B., & Wong, C. J. (2008). Contingency ma-nagement in adult criminal drug courts (pp. 334-354). In S. T. Higgins, K. Silverman, & S. H. Heil (Eds.), Con-tingency management in substance abuse treatment. New York: Guilford Press.
National Association of Drug Court Professionals. (1997). Defining drug courts: The key components. Washington, DC: Office of Justice Programs, U.S. Dept. of Justice. Available at http://www.ndci.org/publica-tions/more-publications/ten-key-components.
Organization of American States, Inter-American Drug Abuse Control Commission. (2010). Hemispheric drug strategy: Plan of action 2011-2015. At http://www.cicad.oas.org/Main/Template.asp?File=/main/aboutcicad/basicdocuments/strategy_2010_eng.asp.
Organization of American States, Observatory on Citi-zen Security. (2011). Report on citizen security in the Americas. Available at http://www.oas.org/dsp/aler-tamerica/Alertamerica_2011.pdf.
Padgett, T. (7/11/2011). The war next door: Why Mexico’s drug violence is America’s problem too. Time Magazine, pp. 22-30.
Douglas marloweChief of Science, Policy and Law at the NationalAssociation of Drug Court Professionals
Douglas Marlowe (b. United States of America) is a Senior Scientific Consultant for the Treatment Re-search Institute at the University of Pennsylvania, Chief of Science, Policy and Law at the National Association of Drug Court Professionals, and As-sociate Professor of Psychiatry at the University of Pennsylvania’s School of Medicine. A lawyer and cli-nical psychologist by trade, Dr. Marlowe specializes in the study of drug treatment options, particularly drug courts for narcotics-abusing offenders. He is a Fellow of the American Psychological Association (APA) and has received Proficiency Certification in the Treatment of Psychoactive Substance Use Di-sorders from the APA Colle-ge of Professional Psycho-logy. He has published over 100 professional articles and chapters on the topics of crime and drug abuse and is on the editorial boards of the jour-nals, the Drug Court Review and Criminal Justice and Behavior.
Shaffer, D. K. (2010). Looking inside the black box of drug courts: A meta-analytic review. Justice Quarterly, 28, 493-521.
Wilson, D. B., Mitchell, O., & MacKenzie, D. L. (2006). A systematic review of drug court effects on recidivism. Journal of Experimental Criminology, 2, 459-487.

Alertamerica.org: OAS Hemispheric Security Observatory :: Report on Security in the Americas
89
COUNTRY
2000 2001 2002 2003 2004 2005 2006 2007 2008 2009
Argentina 48 126 32 176 16 31 33 0 15 0
Brazil 28 57 61 63 20 88 10 12
Canada 10 2 33 37 77 83 188 42 102 213
Chile 26 33 16 5 14 14 6 11 0
Colombia 567 792 775 625 767 762 515 527 678 735
Costa Rica 8 20 59 121 68 51 88 17 94 17
Dominican Republic 24 33 116 59 69 122 258 54 120 39
Ecuador 109 254 352 286 288 238 233 181 114 177
El Salvador 7 11 13 22 4 24 23 8 8
Guatemala 10 21 15 0 8 1 9 2
Mexico 299 245 283 306 302 462 334 317 296 282
Nicaragua 53 82 60 64 15 180 20 5
Panama 221 157 56 42 82 52 115 91
Peru 2 14 5 1 8 2 0 8 1
Trinidad and Tobago 10 20 16 22 0 27 0
United States 1,679 2,133 2,757 2,732 2,118 1,751 2,004 1,446 1,987 2,356
Venezuela 196 228 563 443 658 394 271 131 135 81
AMERICAS (17 countries)(*1)(*2) 3,325 4,212 5,369 5,138 4,585 4,090 4,140 2,999 3,753 4,019
Caribbean (2 countries) (*3) 34 43 126 79 85 144 258 54 148 39
Central America (5 countries) (*4) 299 327 361 382 196 183 208 280 247 123
North America (3 countries) (*5) 1,988 2,380 3,072 3,076 2,497 2,296 2,526 1,805 2,385 2,851
South America (7 countries) (*6) 975 1,463 1,809 1,602 1,807 1,468 1,148 860 973 1,006
Note (*1) Americas refers to the 17 countries included in this Table. (*2) Data for indicated year or nearest available year. (*3) Data for the Caribbean includes: Dominican Republic, and Trinidad and Tobago. (*4) Data for Central America includes: Costa Rica, El Salvador, Guatemala, Nicaragua, and Panama. (*5) Data for North America includes: Canada, Mexico and The United States. (*6) Data for South America includes: Argentina, Brazil, Chile, Colombia, Ecuador, Peru, and Venezuela.
5.32 HEROIN SEIZURES, 2000‐2009 (KG)
Kilograms of Heroin seized in a given year.
YEAR
Sub‐regional data: (*2)
Indicator definition
To strengthen national information systems, the OAS member States are committed to develop and/or strengthen mechanisms for coordination, generation, analysis, and dissemination of information on crime and violence among law enforcement agencies.
Excerpt from the Hemispheric Plan of Action on Citizen Security in the Americas approved by the OAS Permanent Council on May 2, 2012.
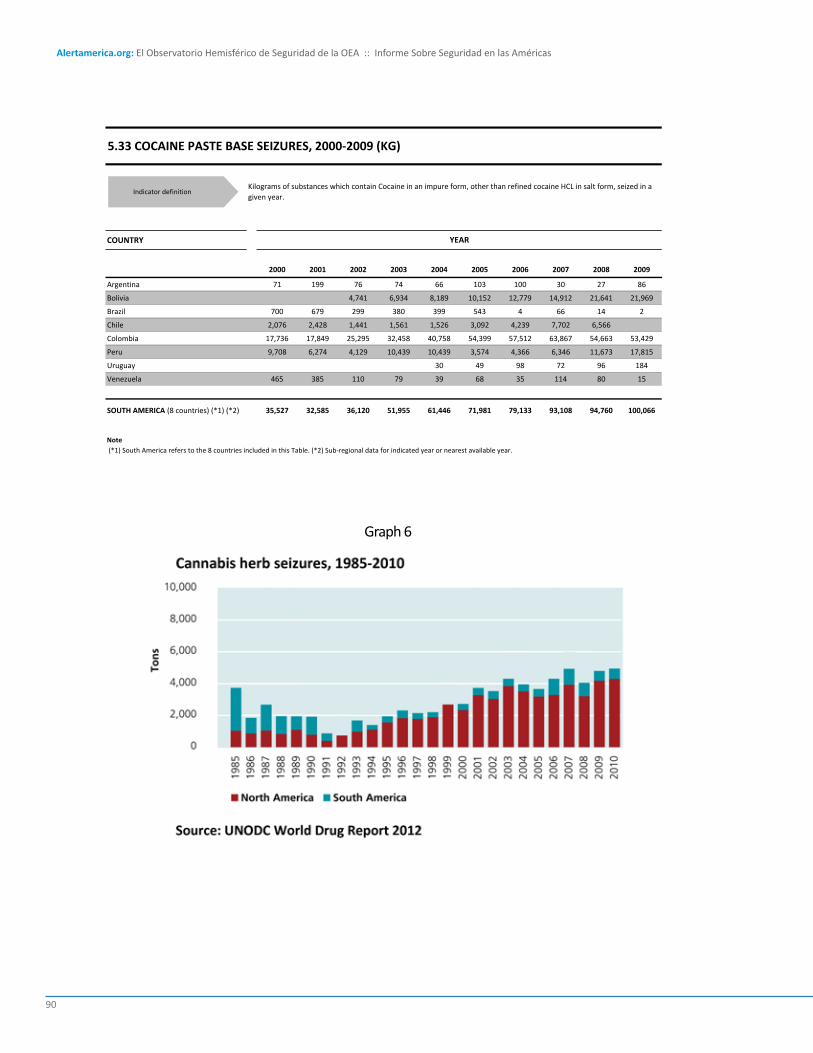
Alertamerica.org: El Observatorio Hemisférico de Seguridad de la OEA :: Informe Sobre Seguridad en las Américas
90
COUNTRY
2000 2001 2002 2003 2004 2005 2006 2007 2008 2009
Argentina 71 199 76 74 66 103 100 30 27 86
Bolivia 4,741 6,934 8,189 10,152 12,779 14,912 21,641 21,969
Brazil 700 679 299 380 399 543 4 66 14 2
Chile 2,076 2,428 1,441 1,561 1,526 3,092 4,239 7,702 6,566
Colombia 17,736 17,849 25,295 32,458 40,758 54,399 57,512 63,867 54,663 53,429
Peru 9,708 6,274 4,129 10,439 10,439 3,574 4,366 6,346 11,673 17,815
Uruguay 30 49 98 72 96 184
Venezuela 465 385 110 79 39 68 35 114 80 15
SOUTH AMERICA (8 countries) (*1) (*2) 35,527 32,585 36,120 51,955 61,446 71,981 79,133 93,108 94,760 100,066
Note (*1) South America refers to the 8 countries included in this Table. (*2) Sub‐regional data for indicated year or nearest available year.
5.33 COCAINE PASTE BASE SEIZURES, 2000‐2009 (KG)
Kilograms of substances which contain Cocaine in an impure form, other than refined cocaine HCL in salt form, seized in a given year.
YEAR
Indicator definition
Graph 6
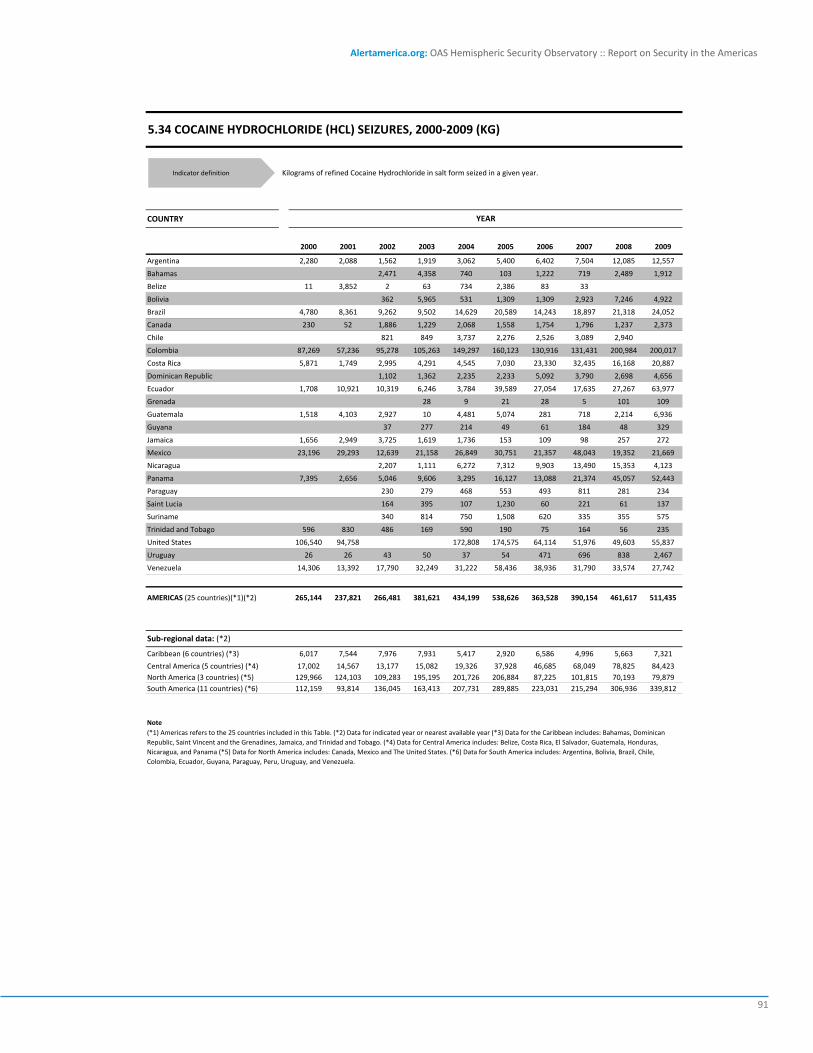
Alertamerica.org: OAS Hemispheric Security Observatory :: Report on Security in the Americas
91
COUNTRY
2000 2001 2002 2003 2004 2005 2006 2007 2008 2009
Argentina 2,280 2,088 1,562 1,919 3,062 5,400 6,402 7,504 12,085 12,557
Bahamas 2,471 4,358 740 103 1,222 719 2,489 1,912
Belize 11 3,852 2 63 734 2,386 83 33
Bolivia 362 5,965 531 1,309 1,309 2,923 7,246 4,922
Brazil 4,780 8,361 9,262 9,502 14,629 20,589 14,243 18,897 21,318 24,052
Canada 230 52 1,886 1,229 2,068 1,558 1,754 1,796 1,237 2,373
Chile 821 849 3,737 2,276 2,526 3,089 2,940
Colombia 87,269 57,236 95,278 105,263 149,297 160,123 130,916 131,431 200,984 200,017
Costa Rica 5,871 1,749 2,995 4,291 4,545 7,030 23,330 32,435 16,168 20,887
Dominican Republic 1,102 1,362 2,235 2,233 5,092 3,790 2,698 4,656
Ecuador 1,708 10,921 10,319 6,246 3,784 39,589 27,054 17,635 27,267 63,977
Grenada 28 9 21 28 5 101 109
Guatemala 1,518 4,103 2,927 10 4,481 5,074 281 718 2,214 6,936
Guyana 37 277 214 49 61 184 48 329
Jamaica 1,656 2,949 3,725 1,619 1,736 153 109 98 257 272
Mexico 23,196 29,293 12,639 21,158 26,849 30,751 21,357 48,043 19,352 21,669
Nicaragua 2,207 1,111 6,272 7,312 9,903 13,490 15,353 4,123
Panama 7,395 2,656 5,046 9,606 3,295 16,127 13,088 21,374 45,057 52,443
Paraguay 230 279 468 553 493 811 281 234
Saint Lucia 164 395 107 1,230 60 221 61 137
Suriname 340 814 750 1,508 620 335 355 575
Trinidad and Tobago 596 830 486 169 590 190 75 164 56 235
United States 106,540 94,758 172,808 174,575 64,114 51,976 49,603 55,837
Uruguay 26 26 43 50 37 54 471 696 838 2,467
Venezuela 14,306 13,392 17,790 32,249 31,222 58,436 38,936 31,790 33,574 27,742
AMERICAS (25 countries)(*1)(*2) 265,144 237,821 266,481 381,621 434,199 538,626 363,528 390,154 461,617 511,435
Caribbean (6 countries) (*3) 6,017 7,544 7,976 7,931 5,417 2,920 6,586 4,996 5,663 7,321
Central America (5 countries) (*4) 17,002 14,567 13,177 15,082 19,326 37,928 46,685 68,049 78,825 84,423North America (3 countries) (*5) 129,966 124,103 109,283 195,195 201,726 206,884 87,225 101,815 70,193 79,879South America (11 countries) (*6) 112,159 93,814 136,045 163,413 207,731 289,885 223,031 215,294 306,936 339,812
Note(*1) Americas refers to the 25 countries included in this Table. (*2) Data for indicated year or nearest available year (*3) Data for the Caribbean includes: Bahamas, Dominican Republic, Saint Vincent and the Grenadines, Jamaica, and Trinidad and Tobago. (*4) Data for Central America includes: Belize, Costa Rica, El Salvador, Guatemala, Honduras, Nicaragua, and Panama (*5) Data for North America includes: Canada, Mexico and The United States. (*6) Data for South America includes: Argentina, Bolivia, Brazil, Chile, Colombia, Ecuador, Guyana, Paraguay, Peru, Uruguay, and Venezuela.
5.34 COCAINE HYDROCHLORIDE (HCL) SEIZURES, 2000‐2009 (KG)
Kilograms of refined Cocaine Hydrochloride in salt form seized in a given year.
YEAR
Sub‐regional data: (*2)
Indicator definition

Alertamerica.org: El Observatorio Hemisférico de Seguridad de la OEA :: Informe Sobre Seguridad en las Américas
92
Indicator definitionDefinición del indicador
COUNTRY
2000 2001 2002 2003 2004 2005 2006 2007 2008 2009
Antigua and Barbuda 7,416 6,949 1,111 34,194 11,395 18,218 14,631
Argentina 676 939 14,244 4,073 2,497 2,045 2,036 2,329 3,816
Bahamas 1,466 10,207 110 14,112 1,552 8,306 34,454 194,864 8,328 11,374
Belize 162,975 71,857 46,393 198,709 63,072 122,366 126,490 28,873 50,050
Brazil 3,699,661 3,823,846 2,598,874 1,851,870 2,376,693 1,859,934 1,202,901 739,771 2,904,752 2,163,314
Canada 1,250,833 1,445,969 1,275,738 1,400,026 1,548,303 2,055,715 1,858,000 1,962,223 1,850,794 1,845,734
Chile 63,621 98,892 69,891 79,228 166,876 128,754 214,997 215,816 281,723 196,412
Costa Rica 2,048,421 1,906,454 1,235,119 979,681 551,388 1,269,060 661,087 2,328,560 1,421,873 1,992,214
Dominica 128,767 107,416 73,386 113,405 170,519 230,763 87,975 23,658 146,706 306,982
Dominican Republic 4,408 6,578 4,122 420 476 2,425 175 3,159 3,649 23,906
El Salvador 25,005 1,210 1,128 10,047 1,855 389 435 4,048 3,555 644
Grenada 2,091 6,611 4,098 3,629 2,280 3,575 12,873 8,536 19,573 13,502
Guatemala 293,897 418,097 370,626 710,229 66,003 694,724 156,362 1,006,822 10,817,497 4,296,107
Mexico 355,578 347,283 254,554 216,630 203,089 147,645 122,408 116,382
Saint Kitts and Nevis 33,367 3,445 6,258 30,772 155,608 83,309 108,571
Saint Vincent and the Grenadines 217,632 58,214 466,015 20,866 34,831 615,890 2,935,611 2,164,898
Uruguay 255 30 70 405 99 108 178 68
AMERICAS (17 countries) (*1) (*2) 8,296,069 8,511,594 6,288,367 5,815,605 5,678,285 6,656,861 4,660,779 7,449,012 20,670,553 13,308,605
Caribbean (6 countries) (*3) 361,780 355,393 300,459 190,891 641,953 300,129 204,502 857,502 3,132,085 2,535,293
Central America (4 countries) (*4) 2,530,298 2,397,618 1,653,266 1,898,666 682,318 2,086,539 944,374 3,368,303 12,292,975 6,339,015North America (3 countries) (*5) 1,606,411 1,801,547 1,631,316 1,747,309 1,802,857 2,272,345 2,061,089 2,109,868 1,973,202 1,962,116South America (4 countries) (*6) 3,764,213 3,923,669 2,669,959 1,945,372 2,547,712 1,991,590 1,420,042 957,731 3,188,982 2,363,610
Note (*1) Americas refers to the 17 countries included in this Table. (*2) Data for indicated year or nearest available year. (*3) Data for the Caribbean includes: Bahamas, Dominica, Dominican Republic, and Grenada. (*4) Data for Central America includes: Belize, Costa Rica, El Salvador, and Guatemala. (*5) Data for North America includes: Canada and Mexico. (*6) Data for South America includes: Argentina, Brazil, Chile, and Uruguay.
5.35 CANNABIS PLANTS SEIZURES, 2000‐2009 (UNITS)
Units of individual Cannabis Plants seized in a given year.
YEAR
Sub‐regional data: (*2)
Indicator definition
Indicator definitionDefinición del indicador
COUNTRY (*1)
2001 2002 2003 2004 2005 2006 2007 2008 2009
Guyana 38,558 8,618 35,120 51,434 17,600 21,510 33,709 182,934
Paraguay 2,286,000 3,375,000 3,607,500 4,667,261 5,184,879
Peru 39,092 103,697 17,296 43,284 20,342 50,602 55,606 61,013 137,510
Note (*1 ) The three countries mentioned in this table reported the total weight of the drugs seized (measured in kilograms), instead of the raw number of Cannabis Plants seized.
5.36 CANNABIS PLANTS SEIZURES, 2001‐2009 (KG)
Kilograms of individual Cannabis Plants seized in a given year. Indicator definition

Alertamerica.org: OAS Hemispheric Security Observatory :: Report on Security in the Americas
93
COUNTRY
2000 2001 2002 2003 2004 2005 2006 2007 2008 2009
Antigua and Barbuda 66 756 52 7,120 2,070 94 1,482 181 197
Argentina 25,539 33,052 44,824 58,340 54,786 36,482 87,526 89,940 107,530 91,869
Bahamas 11,429 6,058 1,858 2,387 5,327 3,125 3,732 6,011
Barbados 392 2,278 3,400 4,855 4,662 3,989
Belize 270 392 690 47 439 685 483 276
Bolivia 8,754 8,510 28,200 34,557 125,356 423,777 1,112,588 1,937,412
Brazil 159,386 146,672 194,093 168,076 209,658 217,830 163,432 197,255 187,103 131,366
Canada 83,083 90,412 40,888 21,519 33,777 56,226 73,135 57,476 40,560 34,391
Chile 3,277 2,418 8,832 4,260 4,990 6,438 4,984 6,620 10,835 13,928
Colombia 75,172 85,746 134,285 152,317 128,957 109,629 183,203 254,685 208,875
Costa Rica 1,140 2,887 729 1,779 2,967 1,584 2,454 4,786 4,809 2,064
Dominica 467 521 366 17 1,113 330 560 212 771 14,722
Dominican Republic 2,934 3,816 1,696 535 530 563 429 735 378 1,405
Ecuador 18,263 3,079 1,896 2,673 624 522 1,030 848 1,968 2,794
El Salvador 456 379 666 637 449 487 465 372 440 441
Grenada 386 106 199 355
Guatemala 1,095 345 279 710 2,053
Guyana 3,991 10,332 2,189 377 197 996 790 702 1,239 3,484
Haiti 1,705 149 520 385 228 817 533 859 691
Honduras 415 1,473 1,466 4 1,394 3,178
Jamaica 55,869 74,413 27,137 36,603 20,952 14,428 37,178 45,212 35,507 21,378
Mexico 2,050,400 1,808,800 1,633,326 2,247,797 2,208,382 1,801,880 1,902,319 2,213,405 1,684,068 2,091,737
Nicaragua 630 381 468 530 543 374 428 510
Panama 2,335 834 1,129 14,343 7,210 6,016 2,320 3,647
Paraguay 51,110 93,957 48,141 76,975 33,948 89,972 67,817 100,499 174,630 84,484
Peru 1,616 2,823 1,980 1,513 1,159 1,289 1,161 2,275 1,928
Saint Kitts and Nevis 6,051 372 61 57 7 155 44
Saint Lucia 2,000 840 46 2 410 905 581 939
Saint Vincent and the Grenadines 7,317 11,836 2,979 1,272 2,121 30,314 47,596
Suriname 108 46 205 119 197 196 153 140 120 187
Trinidad and Tobago 4,880 985 1,513 555 1,268 1,366 700 4,822
United States 1,235,027 1,164,974 1,100,525 1,216,061 1,192,847 1,122,279 1,372,655 1,703,953 1,510,312 2,049,274
Uruguay 808 1,156 900 621 1,256 970 445 1,820 1,063 549
Venezuela 15,000 14,432 20,920 9,589 11,311 18,280 18,280 25,392 20,719 32,637
AMERICAS (34 countries) (*1) (*2) 3,831,370 3,582,068 3,257,124 4,023,966 3,981,155 3,560,624 3,993,797 5,108,841 5,217,335 6,799,232
Caribbean (12 countries) (*3) 93,496 108,611 56,800 65,895 39,531 25,401 51,861 88,946 95,479 102,149Central America (7 countries) (*4) 6,341 8,011 6,262 6,890 7,621 18,481 13,096 13,706 12,160 12,168North America (3 countries) (*5) 3,368,510 3,064,186 2,774,740 3,485,376 3,435,006 2,980,385 3,348,109 3,974,834 3,234,940 4,175,402South America (12 countries) (*6) 363,023 401,260 419,322 465,805 498,996 536,358 580,731 1,031,356 1,874,755 2,509,513
Note(*1) Americas refers to the 34 countries included in this Table. (*2) Data for indicated year or nearest available year. (*3) Data for the Caribbean includes: Antigua and Barbuda, Bahamas, Barbados, Dominica, Dominican Republic, Grenada, Haiti, Jamaica, Saint Kitts and Nevis, Saint Lucia, Saint Vincent and the Grenadines, and Trinidad and Tobago. (*4) Data for Central America includes: Belize, Costa Rica, El Salvador, Guatemala, Honduras, Nicaragua, and Panama. (*5) Data for North America includes: Canada, Mexico, and the United States. (*6) Data for South America includes: Argentina, Bolivia, Brazil, Chile, Colombia, Ecuador, Guyana, Paraguay, Peru, Suriname, Uruguay, and Venezuela.
5.37 CANNABIS LEAF/HERB SEIZURES, 2000‐2009 (KG)
Amount of Kilograms of Cannabis leaf and/or herbs are seized in a given year.
YEAR
Sub‐regional data: (*2)
Indicator definition

Alertamerica.org: El Observatorio Hemisférico de Seguridad de la OEA :: Informe Sobre Seguridad en las Américas
94
Graph 7
Graph 9
Graph 8
Graph 10

Alertamerica.org: OAS Hemispheric Security Observatory :: Report on Security in the Americas
95
On March 21 the OAS Inter-American Drug Abuse Control Commission (CICAD) released the Report on Drug Use in the Americas, 2011, the first analysis of drug trends in the Western Hemisphere, covering the period of 2002-2009.
The need for up-to-date, valid and reliable information on drug issues is central to drafting successful drug policies. This point is reiterated in the Hemispheric Drug Strategy, approved by CICAD in 2010, that underscores the need for public policies being based on scientific evidence.
The study – whose data is published here - deals with trends of five groups of substances: alcohol, marijuana, inhalants, cocaine and related products, and non-medical use of pharmaceutical drugs. Finally, there is an analysis of the perceived risk associated with drug consumption and the ease of access to drugs.
The report points out that among licit drugs alcohol is the most widely used and there is a special concern for the high prevalence of alcohol use in the school population (13-17 years of age). Among illicit drugs marijuana is most prevalent. The report also notes the spread of cocaine use in Latin America and the Caribbean, and warns about the dangers of toxicity in co-caine base paste, a drug whose use is relatively infrequent but with highly adverse effects on health.
The report was based on the information provided by the national observa-tories or equivalent agencies of the countries, and represents a strong effort by the OAS member states to improve policies in benefit of the population.
OAS Inter-American Drug Abuse Control Commission (CICAD)
DRug use DaTa In THe aMeRIcas

DeManDa De DRogasDeManD foR DRugs

Alertamerica.org: El Observatorio Hemisférico de Seguridad de la OEA :: Informe Sobre Seguridad en las Américas
98
Security is an essential condition for the de-velopment of humankind. It is a universal, basic concept. When looking at security from a general perspective, we can conclude that security is a major concern of governments, the private sec-tor and the community. Security must be defined, experienced and guaranteed on a global, regional and national level, and also on the level of the com-munity, and the individual. It should not be based on statistics only, but on an actual sense of safety in the community. A community that lives in fear will not be able to develop beyond its basic needs of safety as determined in Maslow’s hierarchy of needs. The development of a nation and the investment cli-mate depends on the existence of sustained se-curity. For this purpose, our world is in need of a common security strategy allowing governments to guarantee a stable future for our children.
Many leaders have spoken on behalf of our children, we all know the statement by the late US President John F. Kennedy that “Children are the world’s most valuable resource and its best hope for the future”. However, do our actions also reflect our thinking, are we indeed providing them with the best opportunities and ensure that they can develop in a safe and secure environment. After all, we often forget that it is nów that we have to invest in our youth, to be able to speak of a good future.
According to the UNFPA our world popula-tion will hit a historic milestone of 7 billion by the end of October of this year, of which almost half will be under the age of 25. Currently, 1.3 billion adolescents live in developing countries, among them more than 500 million adolescent girls. Our leaders, academics and national and internatio-nal organizations have spoken, deliberated and written extensively on youth. We only need to do a search, as is common in our days, on the Inter-net and we find over half a billion hits. The United
Nations adopted in its General Assembly in 1995 the World Programme of Action for Youth (WPAY), which constituted the first global blue-print for effective national youth policies listing ten priority areas for youth policy. In 2003 five new priority areas were added to the existing ten, bringing the priority areas for youth to fifteen.
Since 2003, the UN Economic and Social Council has been publishing a World Youth Report every two years, with the most recent one (2010) focusing on Youth and Climate Change. In the World Youth Reports a global view on problems confronting youth in our day and age is extensi-vely presented and elaborated on in relation to the fifteen priority areas for youth. My conclusion is therefore that indeed Youth have our attention, however, how effective are our interventions on their behalf in providing them with the best op-portunities and ensuring that they can develop in a secure environment.
secuRITy anD cITIzen secuRITy
As stated above, security is a universal con-cept. As such it is one of the most important con-ditions for sustainable economic development, a goal pursued by every nation. We are increasingly becoming aware of the complex nature of secu-rity topics. As a result of the fast developments that go hand in hand with globalization, we now know that security policies of different nations, in different ways, cannot be considered as a sepa-rate entity of one single nation. In addition, the difference between internal and external security of a state is becoming less significant. While the definition of security of a state is no longer limited to its territorial sovereignty only.
Citizen Security as a concept is a typical La-tin (and South) American construct that emerged as governments were making their transition to democratic rule. The Inter-American Commission on Human Rights, in trying to define Citizen Securi-ty, states that “security against the threat of crime or violence is associated with [this concept] and is used to refer to the paramount security of in-dividuals and social groups […] both urban and
youTHanD cRIMe
Chandrikapersad SantokhiOAS Inter-American American Drug Abuse
Control Commission Chair, 2010/11

Alertamerica.org: OAS Hemispheric Security Observatory :: Report on Security in the Americas
99
rural.” It further expands on this definition saying that “Citizen Security involves the Rights to which all members of a society are entitled, so that they are able to live their daily lives with as little threat as possible to their personal security, their civic rights and their right to the use and enjoyment of their property.” The role of governance is also taken into account, because the State needs to ensure that these rights can be enjoyed fully and by everyone.
Threats affecting our security, both on the levels of the State and the Citizen are the tradi-tional threats, but also new threats such as trans-national crime, drug trafficking, money launde-ring, international terrorism, illegal immigration and illegal arms trade. Environmental pollution, poverty, kidnapping, the fragility of public utilities and bad governance (implying also weak institu-tions to guarantee security) are also threats to the security.
The effects of these threats can be seen at different levels such as:
• peace and security on a global level• regional stability• sustainable economic growth• trust in governance• public health • sense of security by the population• banking and insurance business
In the Caribbean, the CARICOM Heads of State gave a mandate to the Crime and Security Task Force which adopted a definition of security that emphasizes governance and public safety. The Task Force defined Security as “a condition of a state within the context of the constitutional frame where freedom is enjoyed, without fear or victimization from crime, functioning of gover-nance by a constitutionally elected government, which is not inhibited or disrupted through crimi-nal activity.”
youTH anD youTH cRIMeLooking at the transformations that have
taken place in our world in the past twenty-odd years, the youth is confronted with very fast trans-formations in our world in the fields of technolo-
gy and communication, politics – the end of the Cold War - and globalization. And seen from the perspective of the individual these developments on the macro-level do not concern them, and no thought is given to how it may impact them indi-vidually. No one really prepared for these transi-tions, for a globalized world, where everybody is connected with everybody, and where communi-cation takes place by the nanosecond.
These developments have had fast and far-reaching impacts on the whole of human-kind down to the level of its smallest unit, the individual. Where parents and educators are still functioning out of a paradigm of traditional control and upbringing, the technology of digi-tal communication changed this paradigm fas-ter than we could keep up with. One just needs to look at the ratio of communications reaching youth by digital technology and those reaching them from parents and educators. The impacts on the level of knowledge, discerning capabili-ties, scope of interests are far-reaching; showing the youth that there is a world out there wai-ting to be explored. And while they may not be allowed or feel comfortable to speak their mind in the presence of adults – parents or educators – they freely express themselves on the Internet and through other digital communication means. In addition, to the many positive effects, negati-ve effects proliferate at the same pace, including crime, drugs, possession of weapons and new

Alertamerica.org: El Observatorio Hemisférico de Seguridad de la OEA :: Informe Sobre Seguridad en las Américas
100
forms of crime, like Cybercrime, and not to for-get the negative impact on attitudes, norms and values.
Contrary to the traditional upbringing where bad behavior was punished and good behavior rewarded, nowadays under the influence of mo-dern technology children are introduced to ga-mes where negative behavior (killing of enemies, hitting the opponent harder, etc.) are rewarded from a very young age. This leads to parental authority and the authority of educators coming under pressure, which it already was as a result of socio-economic circumstances occurring in the direct surroundings, like political and economic crises, making parents and educators often de-fault on their obligations. The fact remains that governments, civil society, companies, on a natio-nal, regional, international level, did not anticipa-te on the quick developments, victimizing in the first place marginal groups made up for the larger part of women and children. The figures show that crime is on the increase among youth. Tradi-tional educators, like parents, church leaders, so-cial workers, sports coaches, who for many years ensured that our youth were well cared for, now have to share the stage with controversial poli-tical leaders, captains-of-industry, sect leaders and even outright gang leaders.
Summarizing, the traditional influencing me-chanisms, both formal – compulsory education and penal instruments, on the one hand to pro-tect children, and on the other hand to prevent youth crime – and informal to educate youth – social leaders, religious leaders, parents – firstly, did not understand and anticipate on these de-velopments; secondly, were not able to prevent our youth from coming into contact with these threats; thirdly, where the influence has led to de-viant behaviour in youth in different areas they did not succeed in finding effective actions and policies to reintegrate these youth in society. On the contrary, the family and society at large, takes aisolating attitude, abandoning and rejecting these youth, with the State follows in the same tracks by incarcerating them.
Fortunately, we see positive developments in many international organizations and coun-
tries, where new educational approaches are being studied, discussed and implemented. Early Childhood Development (ECD) is one of the ap-proaches that is now widely being promoted. Modern methods are being developed to correct youth in a positive manner, Opa Doeli, the Surina-mese Youth Pretrial Correctional Facility, is a good example of this, as well as other developments like family courts and drug treatment courts. The experience of Opa Doeli may serve as a good example of how children who were off the right track, performing poorly in school and showing deviant behavior, were suddenly capable of per-forming well, to correct their behavior, to subject themselves to authority, as a result of the inte-grated and well-structured approach used at Opa Doeli. The daily program includes agricultural ac-tivities, school, sports, health care, judicial servi-ces, involving also the parents, psychologists and others. The conclusion could be that this is the re-sult of the breaking down of traditional structures in society on the lowest level (the family), but also informal educational structures in society, sports and games, the church, etc.
The conclusion is that the many positive developments for our youth, including educatio-nal, formative, protective aspects, and not in the least love and care for the child, gave way to ma-terialism and pragmatism dictating us to leave the education and upbringing to paid educators, to teachers who have as their only tools obso-lete educational programs and literature not of this age. And again a gap is revealed where the needs of the youth are met with old-fashioned, unsatisfying tools, while the world is knocking on their door through the new, high-tech gad-gets. Parents and educators meanwhile have to address this problem and somehow try to stem the flow of threats reaching their children through films in their own living-room, undesired messa-ges on their Blackberries, undesired music, etc. Although the World Youth Report 2003 pays at-tention to the causes and conditions for juvenile crime which it states can be found at each level of the social structure, including economic and social factors, cultural factors, the family, urbani-zation, migration, the media, peer influence, new strategies to address this issue have not yet be-come mainstream.

Alertamerica.org: OAS Hemispheric Security Observatory :: Report on Security in the Americas
101
InTegRaTeD eDucaTIonal RefoRM To aDDRessyouTH cRIMe
The approach needed to ensure a stable fu-ture for our children and to see them fulfill their destiny as “the world’s most valuable resource and its best hope for the future” is first and fore-most that our investment must start today, most importantly by governments that consider it their moral duty to develop and introduce special pro-grams for at-risk groups, but especially the youth. These programs should be both formal and infor-mal and start from the earliest stages of a child’s life, providing it with guidance in different areas, including sports, games, homework assistance, parental guidance, housing, health care and safe-ty and security. This could be achieved by working on the neighborhood level in centers where diffe-rent Government Ministries integrate their efforts on behalf of the youth, which on the central go-vernment level are separate. Each neighborhood should have a program tailored to the specific needs of that neighborhood. The schools – in any case in Suriname - are currently a valuable infrastructure too often underemployed, remai-ning empty between closing hours of the school in the afternoon until the next morning. This va-luable infrastructure could be better employed for afternoon and evening classes for special target groups as well as cultural education.
Secondly, a policy needs to be developed that provides the youth with the freedom to de-velop themselves, while being made aware of the dangers and risks of the threats that they will be confronted with on their self-determined development path. This will enable them to un-derstand the freedom of choice and the limita-tions that go with it.
Thirdly, we need to work on a micro level to reach our children, this means coaching of no-parent and single-parent families, as well as educational coaching programs, that focus also on talent development. This means providing op-portunities to participate in a nearby locations in cultural programs, music playing, sports, etc. Pro-grams should be started to teach youth to set up
youth organizations on a local, national and re-gional level, through which role model strategies can be introduced. This entails that our national leaders also need to have sufficient qualities to instill in the youth a sense of awe and respect. Leaders with insufficient qualities, knowledge and education, could have negative effects on the youth, as it may give them the idea that crime (and poor school performance) pays.
Finally, the curriculum of our schools needs to be adjusted to reflect the current status of te-chnology and development of our world and our global civilization. It should include more voca-tional education, sports, development of talents, spiritual education, education on norms, values and ethics, and a compulsory three-hours of ser-vice in the own neighborhood
Chandrikapersad SantokhiOAS Inter-American American Drug Abuse Control Commission Chair, 2010/11
Chandrikapersad Santokhi (b. Suriname) studied in the Dutch Police Academy from 1978-1982 before joining the ranks of the Surinamese Police Force. During more than twenty-seven years of Ser-vice to the Force, Mr. Santokhi held many impor-tant posts including that of Director of the Judicial Department, which was charged with the responsi-bility of coordinating international law enforcement cooperation. Mr. Santokhi left the Police Force to join Ronald Venetiaan’s Administration and, from 2005 to 2010, served as Minister of Justice and Police, a role for which he was decorated as a Great Officer of the Yellow Star. In 2010, Mr. Santokhi was elected as Member of Parliament for the Progres-sive Reform Party (Vooruitstrevende Hervormings-partij) and in July 2011 he was appointed leader of the Party. Since 1995, Mr. San-tokhi has been Suriname’s Permanent Representative to the Inter-American Ame-rican Drug Abuse Control Commission. In 2009, Mr. Santokhi was elected vice-chairperson of the or-gan. A year later, Mr. Santokhi was elected chairperson.

Alertamerica.org: El Observatorio Hemisférico de Seguridad de la OEA :: Informe Sobre Seguridad en las Américas
102
COUNTRY
Latest available year Prevalance (Male and Female) Prevalence (Male) Prevalence (Female)
Antigua and Barbuda 2006 31% 32% 30%
Argentina 2009 46% 48% 46%
Bahamas 2008 29% 29% 28%
Barbados 2006 34% 33% 35%
Belize 2002 35% 40% 30%
Bolivia 2008 28% 34% 23%
Brazil 2004 44%
Canada 2010 72%
Chile 2009 35% 36% 36%
Colombia 2004 50% 54% 48%
Costa Rica 2009 21% 21% 20%
Dominica 2006 52% 55% 49%
Dominican Republic 2008 31% 29% 33%
Ecuador 2008 36% 36% 28%
El Salvador 2008 12% 13% 11%
Grenada 2006 40% 45% 35%
Guatemala 2007 37% 32% 25%
Guyana 2002 17% 41% 33%
Haiti 2009 27% 31% 24%
Honduras 2006 33% 15% 11%
Jamaica 2006 37% 37%
Panama 2008 21% 26% 16%
Paraguay 2003 40% 41% 39%
Peru 2007 16% 17% 15%
Saint Kitts and Nevis 2006 30% 29% 31%
Saint Lucia 2006 62% 66% 59%
Saint Vincent and the Grenadines 2006 31% 39% 28%
Suriname 2006 32% 37% 27%
Trinidad and Tobago 2006 48% 52% 45%
United States 2009 30% 31% 30%
Uruguay 2009 53% 53% 53%
Venezuela 2009 18% 20% 16%
AMERICAS (32 countries)(*1)(*2) 2009 37% 33% (*8) 31% (*9)
Caribbean (12 countries) (*4) 2008 31% 32% 42%
Central America (6 countries) (*5) 2009 28% 23% 17%
North America (2 countries) (*6) 2010 34% 31% 16%
South America (12 countries) (*7) 2009 40% 38% 31%
Note(*1) Americas refers to the 32 countries included in this Table. (*2) Regional and sub‐regional data for indicated year or nearest available year. (*3) Regional and sub‐regional averages were calculated by adding the product of the multiplied prevalence rates by the populations of each country, then dividing by the total sum of populations of the countries in the region, Sum of (Prevalence x Populations) / Sum of populations. (*4) Data for the Caribbean includes: Antigua and Barbuda, Bahamas, Barbados, Dominica, Dominican Republic, Grenada, Haiti, Jamaica, Saint Kitts and Nevis, Saint Lucia, Saint Vincent and the Grenadines, and Trinidad and Tobago.(*5) Data for Central America includes: Belize, Costa Rica, El Salvador, Guatemala, Honduras, and Panama. (*6) Data for North America includes: Canada and the United States. (*7) Data for South America includes: Argentina, Bolivia, Brazil, Chile, Colombia, Ecuador, Guyana, Paraguay, Peru, Suriname, Uruguay, and Venezuela. (*8) This does not include data from Brazil and Canada which did not disaggregrate data by gender. (*9) This does not include data from Brazil, Canada, and Jamaica which did not provide this information.
Sub‐regional data: (*3)
6.38 PREVALENCE OF ALCOHOL USE IN SECONDARY SCHOOLS (BY GENDER)
Percentage of secondary school students who reported having used alcohol in the thirty days before the study, in relation to the total secondary school population, divided by gender.Indicator definition
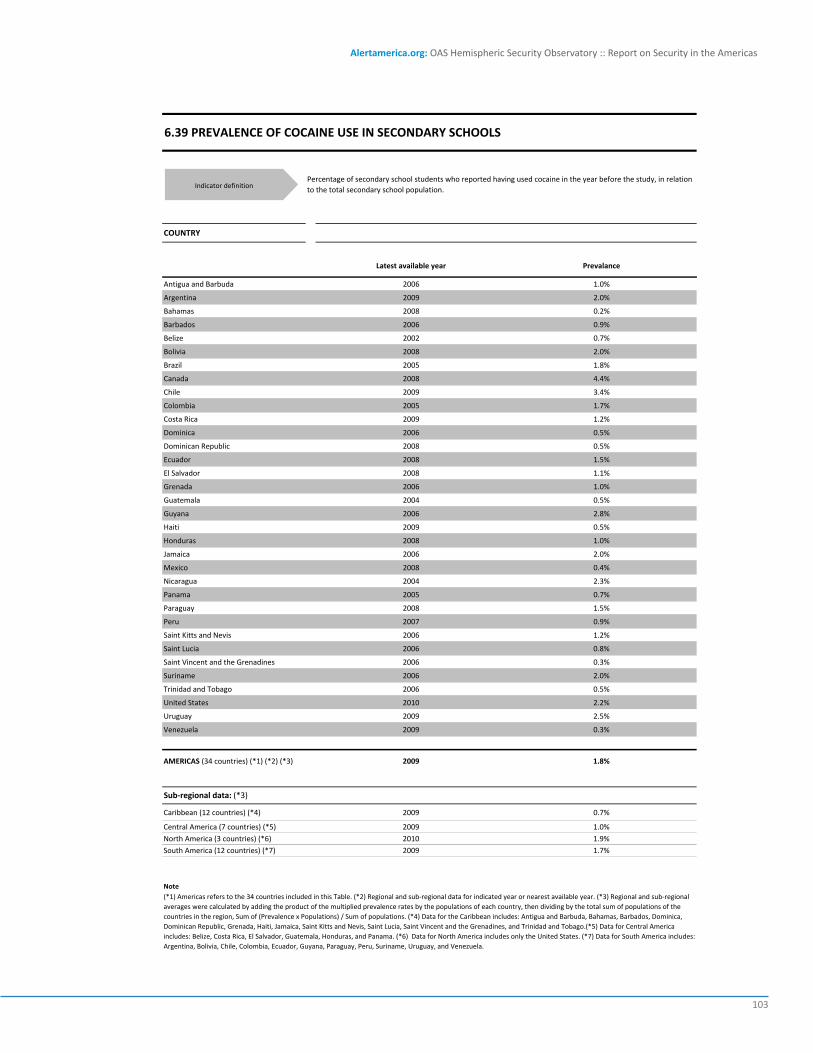
Alertamerica.org: OAS Hemispheric Security Observatory :: Report on Security in the Americas
103
COUNTRY
Latest available year Prevalance
Antigua and Barbuda 2006 1.0%
Argentina 2009 2.0%
Bahamas 2008 0.2%
Barbados 2006 0.9%
Belize 2002 0.7%
Bolivia 2008 2.0%
Brazil 2005 1.8%
Canada 2008 4.4%
Chile 2009 3.4%
Colombia 2005 1.7%
Costa Rica 2009 1.2%
Dominica 2006 0.5%
Dominican Republic 2008 0.5%
Ecuador 2008 1.5%
El Salvador 2008 1.1%
Grenada 2006 1.0%
Guatemala 2004 0.5%
Guyana 2006 2.8%
Haiti 2009 0.5%
Honduras 2008 1.0%
Jamaica 2006 2.0%
Mexico 2008 0.4%
Nicaragua 2004 2.3%
Panama 2005 0.7%
Paraguay 2008 1.5%
Peru 2007 0.9%
Saint Kitts and Nevis 2006 1.2%
Saint Lucia 2006 0.8%
Saint Vincent and the Grenadines 2006 0.3%
Suriname 2006 2.0%
Trinidad and Tobago 2006 0.5%
United States 2010 2.2%
Uruguay 2009 2.5%
Venezuela 2009 0.3%
AMERICAS (34 countries) (*1) (*2) (*3) 2009 1.8%
Caribbean (12 countries) (*4) 2009 0.7%
Central America (7 countries) (*5) 2009 1.0%
North America (3 countries) (*6) 2010 1.9%
South America (12 countries) (*7) 2009 1.7%
Note(*1) Americas refers to the 34 countries included in this Table. (*2) Regional and sub‐regional data for indicated year or nearest available year. (*3) Regional and sub‐regional averages were calculated by adding the product of the multiplied prevalence rates by the populations of each country, then dividing by the total sum of populations of the countries in the region, Sum of (Prevalence x Populations) / Sum of populations. (*4) Data for the Caribbean includes: Antigua and Barbuda, Bahamas, Barbados, Dominica, Dominican Republic, Grenada, Haiti, Jamaica, Saint Kitts and Nevis, Saint Lucia, Saint Vincent and the Grenadines, and Trinidad and Tobago.(*5) Data for Central America includes: Belize, Costa Rica, El Salvador, Guatemala, Honduras, and Panama. (*6) Data for North America includes only the United States. (*7) Data for South America includes: Argentina, Bolivia, Chile, Colombia, Ecuador, Guyana, Paraguay, Peru, Suriname, Uruguay, and Venezuela.
6.39 PREVALENCE OF COCAINE USE IN SECONDARY SCHOOLS
Percentage of secondary school students who reported having used cocaine in the year before the study, in relation to the total secondary school population.
Sub‐regional data: (*3)
Indicator definition

Alertamerica.org: El Observatorio Hemisférico de Seguridad de la OEA :: Informe Sobre Seguridad en las Américas
104
COUNTRY
Latest available year Prevalance
Argentina 2009 1.4%
Bahamas 2008 0.3%
Barbados 2006 0.6%
Belize 2002 0.7%
Bolivia 2004 0.3%
Canada 2008 9.2%
Chile 2009 1.7%
Colombia 2005 3.7%
Dominican Republic 2004 0.2%
Ecuador 2008 0.7%
El Salvador 2003 0.3%
Grenada 2005 0.5%
Guatemala 2004 0.2%
Guyana 2002 0.5%
Haiti 2009 0.6%
Honduras 2005 0.8%
Nicaragua 2003 0.2%
Panama 2008 1.0%
Paraguay 2005 0.4%
Peru 2007 0.6%
Saint Kitts and Nevis 2006 1.0%
Saint Vincent and the Grenadines 2006 0.1%
Suriname 2006 0.2%
United States 2010 4.7%
Uruguay 2008 1.3%
Venezuela 2009 0.3%
AMERICAS (26 countries) (*1) (*2) (*3) 2010
Caribbean (9 countries) (*4) 2008 0.41%
Central America (6 countries) (*5) 2008 0.40%
North America (2 countries) (*6) 2010 5.14%
South America (9 countries) (*7) 2009
Note(*1) Americas refers to the 26 countries included in this Table. (*2) Regional and sub‐regional data for indicated year or nearest available year. (*3) Regional and sub‐regional averages were calculated by adding the product of the multiplied prevalence rates by the populations of each country, then dividing by the total sum of populations of the countries in the region: Sum of (Prevalence x Populations) / Sum of populations. (*4) Data for the Caribbean includes: Antigua and Barbuda, Bahamas, Barbados, Dominica, Dominican Republic, Grenada, Haiti, Jamaica, Saint Kitts and Nevis, Saint Lucia, Saint Vincent and the Grenadines, and Trinidad and Tobago. (*5) Data for Central America includes: Belize, Costa Rica, El Salvador, Guatemala, Honduras, and Panama. (*6) Data for North America includes only the United States. (*7) Data for South America includes: Argentina, Bolivia, Chile, Colombia, Ecuador, Guyana, Paraguay, Peru, Suriname, Uruguay, and Venezuela.
6.40 PREVALENCE OF ECSTASY USE IN SECONDARY SCHOOLS
Percentage of secondary school students who reported having used Ecstasy in the year before the study, in relation to the total secondary school population.
Sub‐regional data: (*3)
Indicator definition
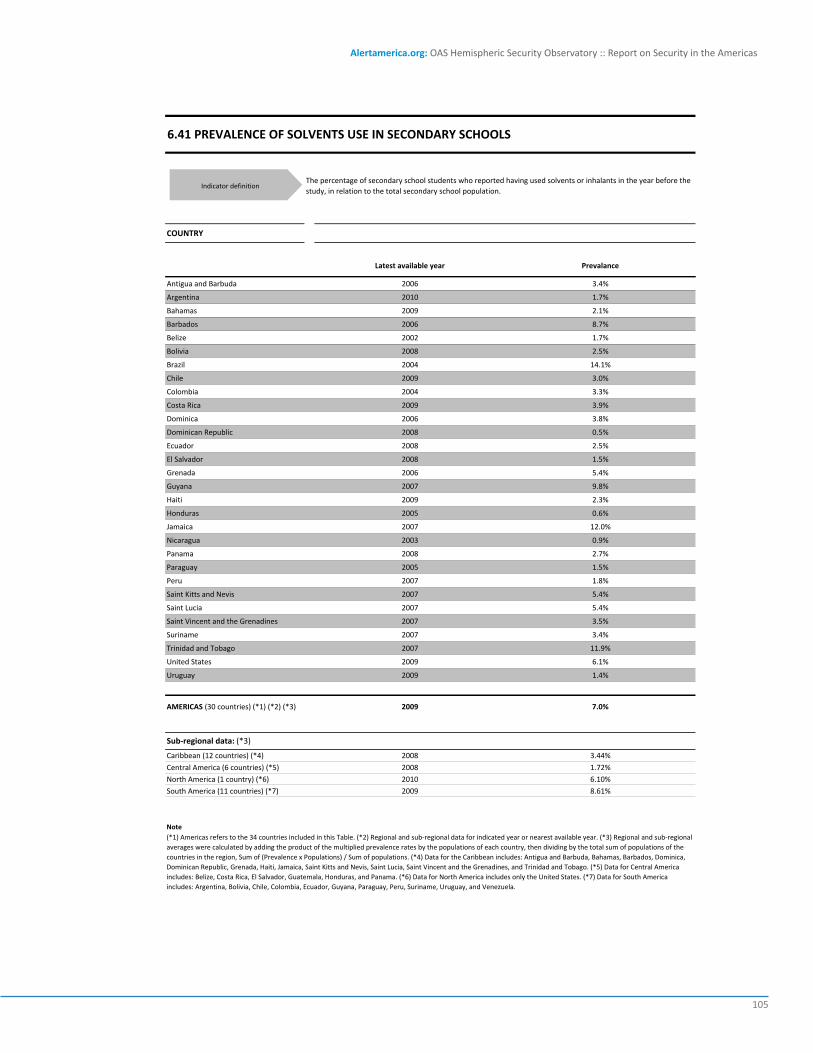
Alertamerica.org: OAS Hemispheric Security Observatory :: Report on Security in the Americas
105
COUNTRY
Latest available year Prevalance
Antigua and Barbuda 2006 3.4%
Argentina 2010 1.7%
Bahamas 2009 2.1%
Barbados 2006 8.7%
Belize 2002 1.7%
Bolivia 2008 2.5%
Brazil 2004 14.1%
Chile 2009 3.0%
Colombia 2004 3.3%
Costa Rica 2009 3.9%
Dominica 2006 3.8%
Dominican Republic 2008 0.5%
Ecuador 2008 2.5%
El Salvador 2008 1.5%
Grenada 2006 5.4%
Guyana 2007 9.8%
Haiti 2009 2.3%
Honduras 2005 0.6%
Jamaica 2007 12.0%
Nicaragua 2003 0.9%
Panama 2008 2.7%
Paraguay 2005 1.5%
Peru 2007 1.8%
Saint Kitts and Nevis 2007 5.4%
Saint Lucia 2007 5.4%
Saint Vincent and the Grenadines 2007 3.5%
Suriname 2007 3.4%
Trinidad and Tobago 2007 11.9%
United States 2009 6.1%
Uruguay 2009 1.4%
AMERICAS (30 countries) (*1) (*2) (*3) 2009 7.0%
Caribbean (12 countries) (*4) 2008 3.44%
Central America (6 countries) (*5) 2008 1.72%
North America (1 country) (*6) 2010 6.10%
South America (11 countries) (*7) 2009 8.61%
Note(*1) Americas refers to the 34 countries included in this Table. (*2) Regional and sub‐regional data for indicated year or nearest available year. (*3) Regional and sub‐regional averages were calculated by adding the product of the multiplied prevalence rates by the populations of each country, then dividing by the total sum of populations of the countries in the region, Sum of (Prevalence x Populations) / Sum of populations. (*4) Data for the Caribbean includes: Antigua and Barbuda, Bahamas, Barbados, Dominica, Dominican Republic, Grenada, Haiti, Jamaica, Saint Kitts and Nevis, Saint Lucia, Saint Vincent and the Grenadines, and Trinidad and Tobago. (*5) Data for Central America includes: Belize, Costa Rica, El Salvador, Guatemala, Honduras, and Panama. (*6) Data for North America includes only the United States. (*7) Data for South America includes: Argentina, Bolivia, Chile, Colombia, Ecuador, Guyana, Paraguay, Peru, Suriname, Uruguay, and Venezuela.
6.41 PREVALENCE OF SOLVENTS USE IN SECONDARY SCHOOLS
The percentage of secondary school students who reported having used solvents or inhalants in the year before the study, in relation to the total secondary school population.
Sub‐regional data: (*3)
Indicator definition

Alertamerica.org: El Observatorio Hemisférico de Seguridad de la OEA :: Informe Sobre Seguridad en las Américas
106
COUNTRY
Latest available year Prevalence Prevalence (Male) Prevalence (Female)
Antigua and Barbuda 2006 12.9% 18.1% 8.4%
Argentina 2009 8.4% 12.0% 5.3%
Bahamas 2008 7.2% 10.0% 4.6%
Barbados 2006 11.4% 12.8% 10.9%
Belize 2002 13.4% 19.7% 6.9%
Bolivia 2009 3.6% 5.4% 2.0%
Brazil 2005 6.3%
Canada 2010 25.1%
Chile 2009 15.1% 15.7% 14.5%
Colombia 2005 8.4%
Costa Rica 2009 6.3% 8.0% 4.6%
Dominica 2006 17.5% 20.7% 10.8%
Dominican Republic 2008 1.0%
Ecuador 2008 4.2% 6.4% 1.9%
El Salvador 2008 3.5% 5.4% 1.8%
Grenada 2006 14.4% 21.0% 12.2%
Guatemala 2004 1.0%
Guyana 2006 6.9% 7.5% 4.4%
Haiti 2009 0.7% 0.6% 0.7%
Honduras 2005 1.1% 1.7% 0.6%
Jamaica 2006 12.0% 14.3% 10.1%
Mexico 2008 1.2%
Nicaragua 2003 2.2% 3.4% 1.3%
Panama 2008 2.9% 4.8% 1.4%
Paraguay 2005 3.0% 4.6% 1.8%
Peru 2007 1.9% 2.6% 1.2%
Saint Kitts and Nevis 2006 12.9% 16.4% 9.8%
Saint Lucia 2006 16.5% 20.4% 13.2%
Saint Vincent and the Grenadines 2006 12.9% 18.1% 7.7%
Suriname 2006 3.3% 5.4% 1.5%
Trinidad and Tobago 2006 6.4% 8.9% 4.4%
United States 2010 27.5% 29.6% 23.9%
Uruguay 2009 12.5% 14.8% 10.3%
Venezuela 2009 0.9% 1.6% 0.6%
AMERICAS (34 countries) (*1) (*2) (*3) 2010 13.0%
Caribbean (12 countries) (*4) 2009 3.0% 8.4% 8.7%
Central America (7 countries) (*5) 2009 2.4% 4.6% 2.7%
North America (3 countries) (*6) 2010 21.1% 0.0% 0.0%
South America (12 countries) (*7) 2009 6.3% 9.0% 8.8%
Note (*1) Americas refers to the 34 countries included in this Table. (*2) Regional and sub‐regional data for indicated year or nearest available year. (*3) Regional and sub‐regional averages were calculated by adding the product of the multiplied prevalence rates by the populations of each country, then dividing by the total sum of populations of the countries in the region, Sum of (Prevalence x Populations) / Sum of populations. (*4) Data for the Caribbean includes: Antigua and Barbuda, Bahamas, Barbados, Dominica, Dominican Republic, Grenada, Haiti, Jamaica, Saint Kitts and Nevis, Saint Lucia, Saint Vincent and the Grenadines, and Trinidad and Tobago. (*5) Data for Central America includes: Belize, Costa Rica, El Salvador, Guatemala, Honduras, Nicaragua, and Panama. (*6) Data for North America includes: Canada, Mexico, and the United States. (*7) Data for South America includes: Argentina, Bolivia, Brazil, Chile, Colombia, Ecuador, Guyana, Paraguay, Peru, Suriname, Uruguay, and Venezuela.
6.42 PREVALENCE OF MARIJUANA USE IN SECONDARY SCHOOLS
Percentage of secondary school students who reported having used marijuana in the year before the study, in relation to the total secondary school population. Data, wherever possible, is disaggregated by gender.
Sub‐regional data: (*3)
Indicator definition

Alertamerica.org: OAS Hemispheric Security Observatory :: Report on Security in the Americas
107
COUNTRY
Latest available year Prevalance
Argentina 2009 0.9%
Belize 2002 0.2%
Bolivia 2008 1.3%
Chile 2009 2.7%
Colombia 2004 1.2%
Dominica 2006 0.5%
Dominican Republic 2004 0.1%
Ecuador 2008 0.6%
El Salvador 2003 0.3%
Haiti 2005 3.9%
Honduras 2005 0.2%
Jamaica 2006 1.4%
Nicaragua 2003 0.2%
Paraguay 2003 0.4%
Peru 2007 0.7%
Suriname 2001 0.1%
Uruguay 2009 0.6%
Venezuela 2005 0.3%
AMERICAS (18 countries) (*1) (*2) (*3) 2009 0.7%
Caribbean (4 countries) (*4) 2006 0.8%
Central America (5 countries) (*5) 2005 0.2%
South America (9 countries) (*6) 2009 0.6%
Note(*1) Americas refers to the 18 countries included in this Table. (*2) Regional and sub‐regional data for indicated year or nearest available year. (*3) Regional and sub‐regional averages were calculated by adding the product of the multiplied prevalence rates by the populations of each country, then dividing by the total sum of populations of the countries in the region, Sum of (Prevalence x Populations) / Sum of populations. (*4) Data for the Caribbean includes: Antigua and Barbuda, Bahamas, Barbados, Dominica, Dominican Republic, Grenada, Haiti, Jamaica, Saint Kitts and Nevis, Saint Lucia, Saint Vincent and the Grenadines, and Trinidad and Tobago. (*5) Data for Central America includes: Belize, Costa Rica, El Salvador, Guatemala, Honduras, and Panama. (*6) Data for South America includes: Argentina, Bolivia, Chile, Colombia, Ecuador, Guyana, Paraguay, Peru, Suriname, Uruguay, and Venezuela.
6.43 PREVALENCE OF COCA PASTE IN SECONDARY SCHOOLS
The percentage of secondary school students who reported having using coca paste/bazuco in the year before the study, in relation to the total secondary school population.
Sub‐regional data: (*3)
Indicator definition
To strengthen national information systems, the OAS member States are committed to develop and/or strengthen mechanisms for coordination, generation, analysis, and dissemination of information on crime and violence among law enforcement agencies.
Excerpt from the Hemispheric Plan of Action on Citizen Security in the Americas approved by the OAS Permanent Council on May 2, 2012.
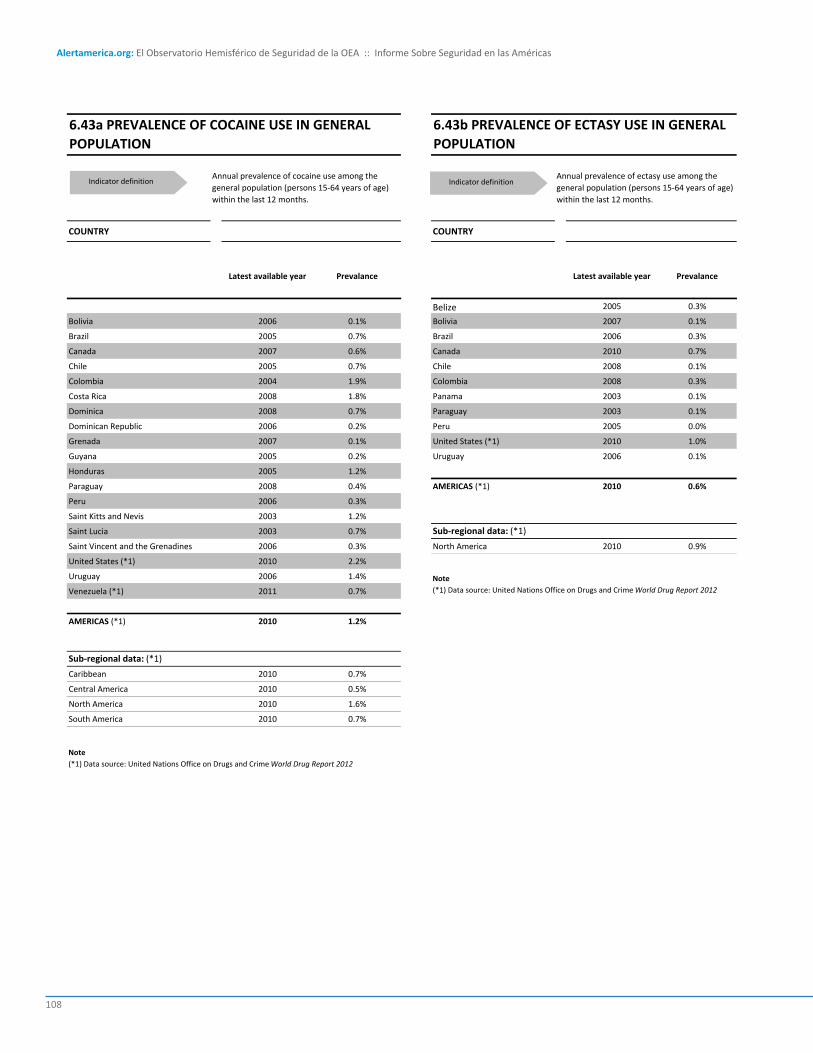
Alertamerica.org: El Observatorio Hemisférico de Seguridad de la OEA :: Informe Sobre Seguridad en las Américas
108
COUNTRY
Latest available year Prevalance
Bolivia 2006 0.1%
Brazil 2005 0.7%
Canada 2007 0.6%
Chile 2005 0.7%
Colombia 2004 1.9%
Costa Rica 2008 1.8%
Dominica 2008 0.7%
Dominican Republic 2006 0.2%
Grenada 2007 0.1%
Guyana 2005 0.2%
Honduras 2005 1.2%
Paraguay 2008 0.4%
Peru 2006 0.3%
Saint Kitts and Nevis 2003 1.2%
Saint Lucia 2003 0.7%
Saint Vincent and the Grenadines 2006 0.3%
United States (*1) 2010 2.2%
Uruguay 2006 1.4%
Venezuela (*1) 2011 0.7%
AMERICAS (*1) 2010 1.2%
Caribbean 2010 0.7%
Central America 2010 0.5%
North America 2010 1.6%
South America 2010 0.7%
Note
Sub‐regional data: (*1)
6.43a PREVALENCE OF COCAINE USE IN GENERAL POPULATION
Annual prevalence of cocaine use among the general population (persons 15‐64 years of age) within the last 12 months.
(*1) Data source: United Nations Office on Drugs and Crime World Drug Report 2012
Indicator definition
COUNTRY
Latest available year Prevalance
Belize 2005 0.3%
Bolivia 2007 0.1%
Brazil 2006 0.3%
Canada 2010 0.7%
Chile 2008 0.1%
Colombia 2008 0.3%
Panama 2003 0.1%
Paraguay 2003 0.1%
Peru 2005 0.0%
United States (*1) 2010 1.0%
Uruguay 2006 0.1%
AMERICAS (*1) 2010 0.6%
North America 2010 0.9%
Note
Sub‐regional data: (*1)
6.43b PREVALENCE OF ECTASY USE IN GENERAL POPULATION
Annual prevalence of ectasy use among the general population (persons 15‐64 years of age) within the last 12 months.
(*1) Data source: United Nations Office on Drugs and Crime World Drug Report 2012
Indicator definition

Alertamerica.org: OAS Hemispheric Security Observatory :: Report on Security in the Americas
109
Illicit drug use is also closely linked to crime; in various ways…While traffickers generally avoid at-tracting attention from law enforce-ment authorities, at times compe-tition between different trafficking groups can generate violence, often including homicide, as the different groups fight to defend or increase their illicit market shares. Moreover, criminal groups with access to large drug profits also often use them for corruption, which may with time lead to significant erosion of the State’s authority as drug criminals buy themselves impunity.
UNODC World Drug report
2012, p 71.
IMPacT on cRIMe
COUNTRY
Latest available year Prevalance
Barbados 2006 8.3%
Belize 2005 8.5%
Bolivia 2007 4.5%
Brazil 2005 2.6%
Canada 2010 10.7%
Chile 2008 6.4%
Colombia 2008 2.3%
Costa Rica 2006 1.0%
Ecuador 2007 0.7%
Paraguay 2003 3.4%
Peru 2003 0.5%
Saint Kitts and Nevis 2006 0.7%
United States (*1) 2010 14.1%
Uruguay 2006 5.2%
Venezuela (*1) 2011 1.7%
AMERICAS (*1) 2011 6.6%
Caribbean 2011 2.8%
Cantral America 2011 2.4%
North America 2011 10.8%
South America 2011 2.5%
Note
Sub‐regional data: (*1)
6.43c PREVALENCE OF CANNABIS USE IN GENERAL POPULATION
Annual prevalence of cannabis use among the general population (persons 15‐64 years of age) within the last 12 months.
(*1) Data source: United Nations Office on Drugs and Crime World Drug Report 2012
Indicator definition


PoblacIón caRcelaRIaPRIson sysTeMs

Alertamerica.org: El Observatorio Hemisférico de Seguridad de la OEA :: Informe Sobre Seguridad en las Américas
112
COUNTRY
2000 2001 2002 2003 2004 2005 2006 2007 2008 2009 2010
Argentina 37,885 41,008 46,288 51,998 54,472 55,423 54,001 52,457 54,537 57,403 59,227
Bahamas 2,829 2,897 2,416 2,556 2,655 2,454 2,374
Belize 903 1,167 1,331 1,345 1,338 1,086 1,114 1,114
Bolivia 8,151 5,577 6,065 5,669 6,495 7,310 7,031 7,683 7,433 7,433 8,700
Brazil 232,755 233,859 239,345 308,304 336,358 361,402 401,236 422,373 451,219 473,626 496,251
Canada 34,153 34,364 35,436 37,183 38,348 38,541
Chile 34,641 35,418 36,416 37,715 38,064 38,849 42,532 49,222 55,111 59,794 53,673
Colombia 51,518 49,302 52,936 62,277 68,020 66,828 60,049 63,603 69,979 75,992 84,444
Costa Rica 5,635 6,079 6,571 6,691 7,267 7,590 7,748 7,793 7,955 11,104
Dominican Republic 16,569 15,964 13,008 12,657 13,752 15,168 16,718 18,331
Ecuador 8,029 7,859 8,723 9,866 11,358 14,628 18,675 17,065 10,881 11,800
El Salvador 7,800 9,679 11,055 11,451 12,176 12,525 14,682 16,041 19,814 25,000 23,151
Guatemala 7,146 8,852 8,480 8,247 8,359 7,932 10,512
Guyana 1,280 1,461 1,861 2,171 2,117 2,179 2,122
Honduras 12,500 11,502 11,589 10,809 11,846
Jamaica 4,982 4,846 5,000 4,709 5,072 5,163
Mexico 154,765 165,687 172,888 182,530 193,889 205,821 210,140 211,553 211,898 233,161 222,794
Nicaragua 5,536 6,029 6,663 5,925 5,807 6,789
Panama 8,701 9,626 10,423 11,263 11,292 12,262 12,189 11,822 10,217 10,956 12,151
Paraguay 3,400 4,121 4,519 5,071 6,281 6,037 5,889 6,617 6,263
Peru 27,734 26,968 27,417 28,826 31,311 33,011 35,835 39,684 43,286 44,396 45,012
Saint Vincent and the Grenadines 302 367 382 413
Suriname 6,709 7,078 7,940 7,719 9,294 8,022
Trinidad and Tobago 3,924 3,771 3,700 3,599 3,863 3,719 3,672
United States 1,937,500 1,964,301 2,019,234 2,152,951 2,151,883 2,195,900 2,258,800 2,298,000 2,308,400 2,291,900 2,266,800
Uruguay 4,469 5,107 5,630 6,749 6,888 6,211 6,887 7,186 7,665 8,238 8,785
Venezuela 14,196 16,751 19,368 19,623 19,951 19,853 19,257 21,097 24,069 30,483 37,660
AMERICAS (27 countries) (*1)(*2) 2,614,431 2,687,866 2,751,465 3,010,907 3,049,904 3,140,973 3,250,301 3,334,523 3,397,305 3,453,635 3,457,290
Caribbean (5 countries) (*3) 25,110 24,171 24,868 26,414 28,308 29,667 29,953Central America (7 countries) (*4) 48,221 51,469 53,136 56,462 57,671 59,094 61,934 62,146 63,766 75,302 75,333North America (3 countries) (*5) 2,126,418 2,164,141 2,226,275 2,369,634 2,380,136 2,437,157 2,506,123 2,547,901 2,558,839 2,563,602 2,528,135South America (12 countries) (*6) 430,767 433,959 455,065 545,318 586,987 620,551 657,376 698,062 746,392 785,064 823,869
Note (*1) Americas refers to the 27 countries included in this Table. (*2) Data for indicated year or nearest available year. (*3) Data for the Caribbean includes: Bahamas, Dominican Republic, Jamaica, Saint Vincent and the Grenadines, and Trinidad and Tobago. (*4) Data for Central America includes: Belize, Costa Rica, El Salvador, Guatemala, Honduras, Nicaragua, and Panama. (*5) Data for North America includes: Canada, Mexico, and The United States. (*6) Data for South America includes: Argentina, Bolivia, Brazil, Chile, Colombia, Ecuador, Guyana, Paraguay, Peru, Suriname and Uruguay, and Venezuela. (*7) Most countries have not reported data related to inmates detained in police stations.
7.44 PERSONS HELD IN PRISONS, 2000‐2010 (TOTAL)
Persons held in prisons means the total of persons held in prisons, penal institutions or correctional facilities on a specified day and should exclude non‐criminal prisoners held for administrative purposes, including persons held pending investigation into their immigration status, and foreign citizens without a legal right to stay detained prior to removal. (*7)
YEAR
Sub‐regional data: (*2)
Indicator definition

Alertamerica.org: OAS Hemispheric Security Observatory :: Report on Security in the Americas
113
COUNTRY
2000 2001 2002 2003 2004 2005 2006 2007 2008 2009 2010
Argentina 103 110 123 137 142 143 138 133 137
Bahamas 881 891 732 765 785 717 686
Belize 350 432 482 477 465 368 370 363
Bolivia 98 66 70 64 72 80 75 81 77 75 87
Brazil 134 132 134 170 183 194 213 222 235 244 254
Canada 108 129 109 113 115 116
Chile 225 227 231 236 236 238 258 296 328 352 313
Colombia 130 122 129 149 160 155 137 143 155 166 182
Costa Rica 143 151 160 160 171 175 176 175 176 242 211
Dominican Republic 182 173 138 133 142 155 168 182
Ecuador 65 63 69 77 88 112 140 127 80 96
El Salvador 131 162 184 190 202 207 241 263 323 406 374
Guatemala 62 73 68 65 64 59 73
Guyana 168 191 244 284 277 286 279
Honduras 197 177 168 148 156
Jamaica 189 183 188 176 189 193
Mexico 190 200 202 201 199 217 201 201 199 217 201
Nicaragua 101 109 119 105 101 117
Panama 295 320 340 361 356 381 371 354 301 317 345
Paraguay 64 75 81 89 106 100 96 104 97
Peru 107 102 104 106 114 119 127 139 150 152 153
Saint Vincent and the Grenadines 280 337 350 379
Surinam 1,415 1,472 1,630 1,563 1,859 1,589
Trinidad and Tobago 299 286 280 271 290 278 274
United States 687 689 702 742 734 742 756 762 758 747 734
Uruguay 135 154 170 204 209 188 208 216 230 246 261
Venezuela 58 68 77 76 76 75 71 77 86 107 131
AMERICAS (27 countries) (*1)(*2) 324 329 333 360 361 367 376 381 385 387 383
Caribbean (5 countries) (*3) 182 173 176 185 196 204 203
Central America (7 countries) (*4) 135 142 144 150 151 152 156 154 155 180 177North America (3 countries) (*5) 517 521 531 560 557 565 576 579 576 572 558South America (12 countries) (*6) 124 123 128 151 160 167 175 184 194 202 210
Note (*1) Americas refers to the 27 countries included in this Table. (*2) Data for indicated year or nearest available year (*3) Data for the Caribbean includes: Bahamas, Dominican Republic, Jamaica, Saint Vincent and the Grenadines, and Trinidad and Tobago. (*4) Data for Central America includes: Belize, Costa Rica, El Salvador, Guatemala, Honduras, Nicaragua, and Panama. (*5) Data for North America includes: Canada, Mexico and The United States. (*6) Data for South America includes: Argentina, Bolivia, Brazil, Chile, Colombia, Ecuador, Guyana, Paraguay, Peru, Suriname and Uruguay, and Venezuela. (*7) Most countries have not reported data related to inmates detained in Police Stations.
7.45 PERSONS HELD IN PRISONS, 2000‐2010 (RATE)
Persons held in prisons means the total of persons held in prisons, penal institutions or correctional facilities on a specified day and should exclude non‐criminal prisoners held for administrative purposes, including persons held pending investigation into their immigration status, and foreign citizens without a legal right to stay detained prior to removal. Some countries with fewer than 100,000 inhabitants have their rates presented for comparative purposes. (*7)
YEAR
Sub‐regional data: (*2)
Indicator definition

Alertamerica.org: El Observatorio Hemisférico de Seguridad de la OEA :: Informe Sobre Seguridad en las Américas
114
2004 2005 2006 2007 2008 2009 2010
Caribbean (5 countries) 25110 24171 24868 26414 28308 29667 29953
Central America (7 countries) 57671 59094 61934 62146 63766 75302 75333
South America (12 countries) 586987 620551 657376 698062 746392 785064 823869
North America (3 countries) 2380136 2437157 2506123 2547901 2558839 2563602 2528135
0
500000
1000000
1500000
2000000
2500000
3000000
3500000
4000000
Graph 6Americas: Total persons held in Prison, 2004-2010
Tota
l Per
sons
Hel
d
Graph 11

Alertamerica.org: OAS Hemispheric Security Observatory :: Report on Security in the Americas
115
2004 2005 2006 2007 2008 2009 2010
North America (3 countries) 557.29 565.26 575.50 579.28 576.26 572.00 557.74
Caribbean (5 countries) 182.28 173.45 176.38 185.21 196.31 203.91 203.05
South America (12 countries) 160.09 167.13 174.92 183.61 194.13 201.99 209.64
Central America (7 countries) 150.63 151.72 156.24 154.10 155.43 180.41 177.34
AMERICAS (27 countries) 360.80 367.44 375.97 381.47 384.55 386.91 382.87
0
100
200
300
400
500
600
700
Pers
ons
held
in P
riso
n Ra
te p
er 1
00,0
00 in
habi
tant
s
Graph 7Americas: Rates per 100,000 inhabitants
of Persons Held in Prison, 2004-2010
Graph 12

Alertamerica.org: El Observatorio Hemisférico de Seguridad de la OEA :: Informe Sobre Seguridad en las Américas
116
COUNTRY
2004 2005 2006 2007 2008 2009 2010
Argentina 41,517 47,637 48,176 50,641 52,125 56,198
Bahamas 2,654 2,696 2,184 2,332 2,387 2,256 2,235
Bolivia 5,586 5,880 6,035 7,218 6,978 7,142
Brazil 317,568 341,138 378,171 396,760 422,565 442,225 461,444
Colombia 63,385 62,707 56,626 59,971 65,786 71,204 78,760
Costa Rica 7,645 7,684 8,390 9,120 9,038
Guyana 1,204 1,385 1,758 2,042 1,994 2,065 2,045
Jamaica 4,479 4,343 4,375 4,067 4,025 4,113
Mexico 94,129 195,248 199,455 201,953 208,784 213,650 209,188
Nicaragua 5,101 5,574 6,119 5,546 5,419 6,443
Panama 10,542 10,810 10,827 13,588 9,047 9,631 11,277
Peru 8,643 34,833 37,458 40,641 41,596 42,265
Saint Vincent and the Grenadines 359 374 404
Trinidad and Tobago 3,580 3,450 3,389 3,296 3,501 3,382
United States 1,955,100 1,986,200 2,038,900 2,064,500 2,082,800 2,081,800 2,058,300
AMERICAS (15 countries) (*1)(*2) 2,521,492 2,703,312 2,797,822 2,856,244 2,914,189 2,946,050 2,952,638
Caribbean (4 countries) (*3) 11,072 10,848 10,322 10,069 10,287 10,155 10,134
Central America (3 countries) (*4) 23,288 23,556 24,085 28,097 23,713 24,088 26,758
North America (2 countries) (*5) 2,049,229 2,181,448 2,238,355 2,266,453 2,291,584 2,295,450 2,267,488
South America (6 countries) (*6) 437,903 461,270 525,060 551,625 588,605 616,357 647,854
Note (*1) Americas refers to the 15 countries included in this Table. (*2) Regional and sub‐regional data for indicated year or nearest available year. (*3) Data for the Caribbean includes: Bahamas, Jamaica, Saint Vincent and the Grenadines, and Trinidad and Tobago. (*4) Data for Central America includes: Costa Rica, Nicaragua, and Panama (*5) Data for North America includes: Mexico and The United States. (*6) Data for South America includes: Argentina, Bolivia, Brazil, Colombia, Guyana, and Peru. (*7) Most countries have not reported data related to inmates detained in Police Stations.
7.46 MALE ADULTS HELD IN PRISONS, 2004‐2010 (TOTAL)
The total number of male adults held in prisons, penal institutions or correctional facilities on a specified day and should exclude non‐criminal prisoners held for administrative purposes, including persons held pending investigation into their immigration status and foreign citizens without a legal right to stay detained prior to removal. (*7)
YEAR
Sub‐regional data: (*2)
Indicator definition

Alertamerica.org: OAS Hemispheric Security Observatory :: Report on Security in the Americas
117
COUNTRY
2004 2005 2006 2007 2008 2009
Argentina 2,172 2,791 2,804 2,807 2,633
Bahamas 137 163 158 134 185 135
Belize 86 63 37 48 30
Bolivia 909 913 996 465 455 931
Brazil 18,790 20,264 23,065 25,830 28,654 31,401
Chile 2,265 2,328 2,626 3,228 3,986
Colombia 4,635 4,122 3,395 3,632 4,193 4,788
Costa Rica 626 606 690 721 822
Guyana 51 54 81 101 89 84
Jamaica 184 175 182 137 145 154
Mexico 9,540 10,373 10,685 10,888 10,970 11,099
Nicaragua 370 395 486 323 335
Panama 761 748 757 604 665
Peru 679 2,318 2,612 2,798 2,975 2,800
Saint Vincent and the Grenadines 8 8
Trinidad and Tobago 120 116 119 122 182 148
United States 184,500 193,400 203,100 206,600 206,700 200,100
AMERICAS (17 countries) (*1)(*2) 225,833 238,274 251,630 258,717 263,045 256,133
Caribbean (4 countries) (*3) 449 462 467 401 520 445
Central America (4 countries) (*4) 1,843 1,868 1,812 1,970 1,696 1,852North America (2 countries) (*5) 194,040 203,773 213,785 217,488 217,670 211,199South America (7 countries) (*6) 29,501 32,171 35,566 38,858 43,159 42,637
Note (*1) Americas refers to the 17 countries included in this Table. (*2) Regional and sub‐regional data for indicated year or nearest available year. (*3) Data for the Caribbean includes: Bahamas, Jamaica, Saint Vincent and the Grenadines, and Trinidad and Tobago. (*4) Data for Central America includes: Belize, Costa Rica, Nicaragua, and Panama. (*5) Data for North America includes: Mexico and The United States. (*6) Data for South America includes: Argentina, Bolivia, Brazil, Chile, Colombia, Guyana, and Peru. (*7) Most countries have not reported data related to inmates detained in Police Stations.
7.47 FEMALE ADULTS HELD IN PRISONS, 2004‐2009 (TOTAL)
The total number of female adults held in prisons, penal institutions or correctional facilities on a specified day and should exclude non‐criminal prisoners held for administrative purposes, including persons held pending investigation into their immigration status, and foreign citizens without a legal right to stay detained prior to removal. (*7)
YEAR
Sub‐regional data (*2)
Indicator definition
Excerpt from the Hemispheric Plan of Action on Citizen Security in the Americas approved by the OAS Permanent Council on May 2, 2012.
To promote knowledge transfer, and the discussion of experiences and practices the countries of the Americas will strengthen cooperation and technical assistance mechanisms with different international, regional, and sub-regional organizations and agencies.

Alertamerica.org: El Observatorio Hemisférico de Seguridad de la OEA :: Informe Sobre Seguridad en las Américas
118
COUNTRY
Latest available year Total minors held in prisionsMinors held in prisons (per 100,000 minors)
Antigua and Barbuda 2009 5 29.4
Bahamas 2010 63 59.4
Barbados 2009 67 121.8
Belize 2009 28 21.7
Bolivia 2006 725 17.6
Brazil 2009 16,940 28.2
Canada 2009 2,766 40.2
Colombia 2009 1,219 7.6
Costa Rica 2009 404 28.0
Dominica 2009 15 115.4
Dominican Republic 2006 360 9.6
El Salvador 2006 507 18.9
Guatemala 2003 220 3.6
Guyana 2010 16 5.9
Jamaica 2009 308 31.7
Nicaragua 2009 53 2.2
Panama 2009 660 55.2
Paraguay 2009 1166 45.5
Peru 2009 2,525 23.8
Saint Kitts and Nevis 2009 13 130.0
Saint Lucia 2009 189 337.5
Trinidad and Tobago 2009 189 55.6
United States 2010 70,792 91.6
Uruguay 2007 416 41.9
AMERICAS (24 countries) (*1)(*2) 2010 99,646 50.3
Caribbean (9 countries) (*3) 2009 1,209 22.7
Central America (6 countries) (*4) 2009 1,872 13.4North America (2 countries) (*5) 2010 73,558 87.4South America (7 countries) (*6) 2009 23,007 24.3
Note(*1) Americas refers to the 24 countries included in this Table. (*2) Regional and sub‐regional data for indicated year or nearest available year. (*3) Data forthe Caribbean includes: Antigua and Barbuda, Bahamas, Barbados, Dominica, Dominican Republic, Jamaica, Saint Kitts and Nevis, Saint Lucia, and Trinidad and Tobago. (*4) Data for Central America includes: Belize, Costa Rica, El Salvador, Guatemala, Nicaragua, and Panama. (*5) Data for North America includes: Canada and The United States. (*6) Data for South America includes: Bolivia, Brazil, Colombia, Guyana, Paraguay, Peru, and Uruguay.
7.48 MINORS HELD IN PRISONS (LATEST YEAR)
The total number of minors held in prisons, penal institutions or correctional facilities on a specified day and should exclude non‐criminal minors detained for administrative purposes.
Sub‐regional data: (*2)
Indicator definition

Alertamerica.org: OAS Hemispheric Security Observatory :: Report on Security in the Americas
119
COUNTRY
Latest available yearTotal male minorsheld in prision
Total female minorsheld in prision
Bahamas 2009 4
Belize 2009 9
Brazil 2010 25,802 2665
Colombia 2009‐2010 (*7) 1,510 74
Costa Rica 2009 2
Dominican Republic 2006 347 13
El Salvador 2006 475 32
Guyana 2009‐2010 (*7) 15 1
Jamaica 2009 245 63
Mexico 2010 3,586 181
Nicaragua 2010 74 2
Panama 2009 646 14
Paraguay 2009 448 23
Saint Kitts and Nevis 2009 12 1
Trinidad and Tobago 2009 189
United States 2010 9,293 562
Uruguay 2007 164 9
AMERICAS (17 countries)(*1)(*2) 2009 42,815 3,646
Caribbean (6 countries) (*3) 2009 808 82
Central America (5 countries) (*4) 2009 1,204 50North America (2 countries) (*5) 2010 12,879 743South America (4 countries) (*6) 2009 27,924 2,771
Note(*1) Americas refers to the 17 countries included in this Table. (*2) Regional and sub‐regional data for indicated year or nearest available year. (*3) Data for the Caribbean includes: Bahamas, Dominican Republic, Guyana, Jamaica, Saint Kitts and Nevis, and Trinidad and Tobago. (*4) Data for Central America includes: Belize, Costa Rica, El Salvador, Nicaragua, and Panama. (*5) Data for North America includes: Mexico and The United States. (*6) Data for South America includes: Brazil, Colombia, Paraguay, and Uruguay. (*7) Data for female minors relates to 2009, male minors, 2010.
7.49 MINORS HELD IN PRISONS BY GENDER (LATEST AVAILABLE YEAR)
The total number of minors held in prisons, penal institutions or correctional facilities on a specified day and should exclude non‐criminal minors detained for administrative purposes.
Sub‐regional data: (*2)
Indicator definition
The member states of the OAS agree that implementation of this Action Plan must take into account (…) the full respect for human rights and a gender perspective.
Excerpt from the Hemispheric Plan of Action on Citizen Security in the Americas approved by the OAS Permanent Council on May 2, 2012.

Alertamerica.org: El Observatorio Hemisférico de Seguridad de la OEA :: Informe Sobre Seguridad en las Américas
120
Indicator definitionDefinición del indicador
COUNTRY
2003 2004 2005 2006 2007 2008 2009 2010
Argentina 32,623 31,913 29,052 29,972 31,389 32,637 31,142
Bahamas 1,682 1,863 1,496 1,741 1,733 1,833 1,625
Brazil 138,318 163,671 170,444 177,389 187,336 196,670 209,126 215,229
Canada 9,560 9,899 10,875 12,104 12,914 13,485
Chile 15,977 14,004 12,829 11,802 10,750 11,445
Colombia 26,397 28,811 25,749 19,353 22,183 24,055 24,569 25,916
Costa Rica 1,988 1,602 1,680 1,756 2,099 2,711 2,563
Ecuador 6,437 6,785 11,904 6,516 401
Guyana 441 470 417 850 850 956
Jamaica 45 42 95 97 546 588
Mexico 80,134 80,661 87,844 89,801 88,136 88,035 92,311 91,297
Nicaragua 947 1,180 1,290 1,235 1,249 1,434
Panama 6,886 7,270 7,153 7,011 5,515 6,137 7,971
Peru 19,762 21,999 23,175 24,419 26,656 28,420 27,128
United States 462,179 442,926 463,100 475,900 483,700 494,300 477,500 457,500
AMERICAS (15 countries) (*1) (*2) 803,376 813,368 844,908 863,745 886,296 906,293 903,368 888,680
Caribbean (2 countries) (*3) 1,727 1,905 1,591 1,838 2,279 2,421 2,213
Central America (3 countries) (*4) 9,821 9,819 10,013 10,057 8,849 10,097 11,968
North America (3 countries) (*5) 551,873 533,486 561,819 577,805 584,750 595,820 583,296 562,282
South America (7 countries) (*6) 239,955 268,334 271,365 262,432 289,651 299,345 307,554 312,217
Note(*1) Americas refers to the 15 countries included in this Table. (*2) Regional and sub‐regional data for indicated year or nearest available year. (*3) Data for the Caribbean includes: Bahamas and Jamaica. (*4) Data for Central America includes: Costa Rica, Nicaragua, and Panama. (*5) Data for North America includes: Canada, Mexico, and The United States. (*6) Data for South America includes: Argentina, Brazil, Chile, Colombia, Ecuador, Guyana, and Peru. (*7) Most countries have not reported data related to inmates detained in Police Stations.
7.50 UNTRIED PERSONS HELD IN PRISONS, 2003‐2010 (TOTAL)
Untried/pre‐trial persons held in prisions, penal institutions or correctional facilities on a specified day. (*7)
YEAR
Sub‐regional data: (*2)
Indicator definition

Alertamerica.org: OAS Hemispheric Security Observatory :: Report on Security in the Americas
121
Indicator definitionDefinición del indicador
COUNTRY
2003 2004 2005 2006 2007 2008 2009 2010
Argentina 63% 58% 54% 57% 58% 57% 53%
Bahamas 59% 64% 62% 68% 65% 75% 68%
Brazil 45% 49% 47% 44% 44% 44% 44% 43%
Canada 28% 29% 31% 33% 34% 35%
Chile 42% 37% 33% 28% 22% 21%
Colombia 42% 42% 39% 32% 35% 34% 32% 31%
Costa Rica 27% 21% 22% 23% 26% 24%
Ecuador 65% 60% 64% 38% 4%
Guyana 34% 32% 22% 39% 40% 44%
Jamaica 1% 1% 2% 2% 11% 11%
Mexico 44% 42% 43% 43% 42% 42% 40% 41%
Nicaragua 17% 20% 19% 21% 22% 21%
Panama 61% 59% 59% 59% 54% 56% 66%
Peru 69% 70% 70% 68% 67% 66% 60%
United States 21% 21% 21% 21% 21% 21% 21% 20%
AMERICAS (15 countries) (*1) (*2) 28% 28% 28% 28% 27% 28% 28% 28%
Caribbean (2 countries) (*3) 26% 41% 40% 41% 33% 34% 47%
Central America (3 countries) (*4) 41% 39% 39% 38% 37% 36% 44%
North America (3 countries) (*5) 26% 25% 25% 24% 25% 24% 24% 22%
South America (7 countries) (*6) 48% 50% 47% 44% 45% 43% 43% 41%
Note(*1) Americas refers to the 15 countries included in this Table. (*2) Regional and sub‐regional data for indicated year or nearest available year. (*3) Data for the Caribbean includes: Bahamas, Jamaica, and Saint Vincent and the Grenadines. (*4) Data for Central America includes: Costa Rica, Nicaragua, and Panama. (*5) Data for North America includes: Canada, Mexico, and The United States. (*6) Data for South America includes: Argentina, Brazil, Chile, Colombia, Ecuador, Guyana, and Peru. (*7) Most countries have not reported data related to inmates detained in Police Stations.
7.51 UNTRIED PERSONS HELD IN PRISONS, AS PERCENTAGE OF TOTAL PRISON POPULATION (%)
Untried/Pre‐trial persons held in prisons, penal institutions or correctional facilities. (*7)
YEAR
Sub‐regional data: (*2)
Indicator definition
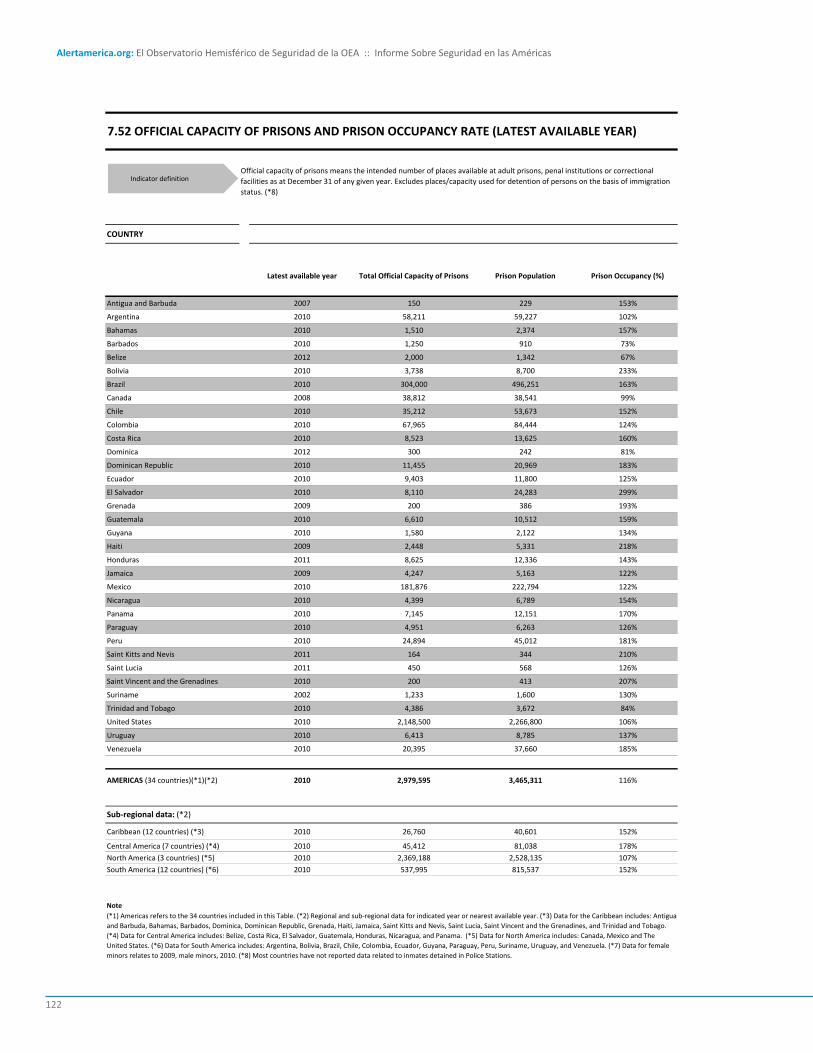
Alertamerica.org: El Observatorio Hemisférico de Seguridad de la OEA :: Informe Sobre Seguridad en las Américas
122
COUNTRY
Latest available year Total Official Capacity of Prisons Prison Population Prison Occupancy (%)
Antigua and Barbuda 2007 150 229 153%
Argentina 2010 58,211 59,227 102%
Bahamas 2010 1,510 2,374 157%
Barbados 2010 1,250 910 73%
Belize 2012 2,000 1,342 67%
Bolivia 2010 3,738 8,700 233%
Brazil 2010 304,000 496,251 163%
Canada 2008 38,812 38,541 99%
Chile 2010 35,212 53,673 152%
Colombia 2010 67,965 84,444 124%
Costa Rica 2010 8,523 13,625 160%
Dominica 2012 300 242 81%
Dominican Republic 2010 11,455 20,969 183%
Ecuador 2010 9,403 11,800 125%
El Salvador 2010 8,110 24,283 299%
Grenada 2009 200 386 193%
Guatemala 2010 6,610 10,512 159%
Guyana 2010 1,580 2,122 134%
Haiti 2009 2,448 5,331 218%
Honduras 2011 8,625 12,336 143%
Jamaica 2009 4,247 5,163 122%
Mexico 2010 181,876 222,794 122%
Nicaragua 2010 4,399 6,789 154%
Panama 2010 7,145 12,151 170%
Paraguay 2010 4,951 6,263 126%
Peru 2010 24,894 45,012 181%
Saint Kitts and Nevis 2011 164 344 210%
Saint Lucia 2011 450 568 126%
Saint Vincent and the Grenadines 2010 200 413 207%
Suriname 2002 1,233 1,600 130%
Trinidad and Tobago 2010 4,386 3,672 84%
United States 2010 2,148,500 2,266,800 106%
Uruguay 2010 6,413 8,785 137%
Venezuela 2010 20,395 37,660 185%
AMERICAS (34 countries)(*1)(*2) 2010 2,979,595 3,465,311 116%
Caribbean (12 countries) (*3) 2010 26,760 40,601 152%
Central America (7 countries) (*4) 2010 45,412 81,038 178%
North America (3 countries) (*5) 2010 2,369,188 2,528,135 107%
South America (12 countries) (*6) 2010 537,995 815,537 152%
Note(*1) Americas refers to the 34 countries included in this Table. (*2) Regional and sub‐regional data for indicated year or nearest available year. (*3) Data for the Caribbean includes: Antigua and Barbuda, Bahamas, Barbados, Dominica, Dominican Republic, Grenada, Haiti, Jamaica, Saint Kitts and Nevis, Saint Lucia, Saint Vincent and the Grenadines, and Trinidad and Tobago. (*4) Data for Central America includes: Belize, Costa Rica, El Salvador, Guatemala, Honduras, Nicaragua, and Panama. (*5) Data for North America includes: Canada, Mexico and The United States. (*6) Data for South America includes: Argentina, Bolivia, Brazil, Chile, Colombia, Ecuador, Guyana, Paraguay, Peru, Suriname, Uruguay, and Venezuela. (*7) Data for female minors relates to 2009, male minors, 2010. (*8) Most countries have not reported data related to inmates detained in Police Stations.
7.52 OFFICIAL CAPACITY OF PRISONS AND PRISON OCCUPANCY RATE (LATEST AVAILABLE YEAR)
Official capacity of prisons means the intended number of places available at adult prisons, penal institutions or correctional facilities as at December 31 of any given year. Excludes places/capacity used for detention of persons on the basis of immigration status. (*8)
Sub‐regional data: (*2)
Indicator definition

Alertamerica.org: OAS Hemispheric Security Observatory :: Report on Security in the Americas
123
COUNTRY
2003 2004 2005 2006 2007 2008 2009 2010
Argentina 37,525 37,525 39,198 46,494 49,322 53,044 56,022 58,211
Bahamas 1,510 1,510 1,510 1,510 1,510 1,510
Belize 1,000 1,000 1,400 1,400 1,700 1,700
Brazil 179,489 211,000 216,000 242,000 275,000 354,159 351,198 304,000
Canada 37,473 37,479 36,890 36,990 37,666 38,812
Colombia 48,291 49,722 49,821 52,414 52,555 54,777 55,042 67,965
Costa Rica 6,146 6,799 7,277 7,980 8,140 8,140 8,470
Guyana 1,550 1,550 1,550 1,550 1,550 1,550 2,160
Jamaica 3,036 3,036 3,036 4,247 4,247 4,247
Mexico 147,809 154,825 159,628 164,929 169,970 171,437 173,060 181,876
Nicaragua 5,446 4,399 4,399 4,399 4,399 4,399
Panama 7,230 7,245 7,271 7,124 7,145 7,145 7,145
Peru 19,855 21,727 21,794 21,226 22,478 23,738
Saint Vincent and the Grenadines 390 390 390 395 400 440
Trinidad and Tobago 4,161 4,161 4,386 4,386 4,386 4,161
United States 2,011,730 1,916,502 1,975,900 2,013,400 2,045,900 2,114,000 2,138,100 2,148,500
Uruguay 5,826 5,866 4,840 6,164 6,413
AMERICAS (17 countries) (*1)(*2) 2,511,237 2,465,768 2,536,712 2,614,215 2,690,877 2,849,603 2,875,718 2,864,601
Caribbean (4 countries) (*3) 9,097 9,097 9,322 10,533 10,538 10,318 10,583
Central America (4 countries) (*4) 19,822 20,475 20,968 21,050 21,063 21,384 21,714 21,767
North America (3 countries) (*5) 2,197,012 2,108,806 2,172,418 2,215,319 2,253,536 2,324,249 2,349,972 2,369,188
South America (6 countries) (*6) 292,536 327,390 334,229 368,524 405,745 493,432 493,714 463,063
Note (*1) Americas refers to the 17 countries included in this Table. (*2) Regional and sub‐regional data for indicated year or nearest available year. (*3) Data for the Caribbean includes: Bahamas, Jamaica, Saint Vincent and the Grenadines, and Trinidad and Tobago. (*4) Data for Central America includes: Belize, Costa Rica, Nicaragua, and Panama. (*5) Data for North America includes: Canada, Mexico and The United States. (*6) Data for South America includes: Argentina, Brazil, Colombia, Guyana, Peru, and Uruguay. (*7) Most countries have not reported data related to inmates detained in Police Stations.
7.53 OFFICIAL CAPACITY OF ADULTS PRISONS, 2003‐2010 (TOTAL)
The intended number of places available at adult prisons, penal institutions or correctional facilities as at December 31. Excludes places/capacity used for detention of persons on the basis of immigration status. (*7)
YEAR
Sub‐regional data: (*2)
Indicator definition
OAS Inter-American Commission on Human Rights Report on the Human Rights of Persons Deprived of Liberty in the Americas 2012. P. 156.
In respecting and ensuring the human rights of persons deprived of liberty the most serious challenge currently affecting the absolute majority of the countries of the region is overcrowding.

Alertamerica.org: El Observatorio Hemisférico de Seguridad de la OEA :: Informe Sobre Seguridad en las Américas
124
Indicator definitionDefinición del indicador
COUNTRY
2003 2004 2005 2006 2007 2008 2009 2010
Argentina 139% 145% 141% 116% 106% 103% 102% 102%
Bahamas 192% 160% 169% 176% 163% 157%
Belize 133% 135% 96% 78% 66% 66%
Brazil 172% 159% 167% 166% 154% 127% 135% 163%
Canada 91% 92% 96% 101% 102% 99%
Colombia 129% 137% 134% 115% 121% 128% 138% 124%
Costa Rica 109% 107% 104% 97% 96% 98% 131%
Guyana 83% 94% 120% 140% 137% 141% 98%
Jamaica 164% 160% 165% 111% 119% 122%
Mexico 123% 125% 129% 127% 124% 124% 135% 122%
Nicaragua 102% 137% 151% 135% 132% 154%
Panama 156% 169% 168% 166% 143% 153% 170%
Peru 145% 144% 151% 169% 177% 182%
Trinidad and Tobago 94% 91% 84% 82% 88% 89%
United States 107% 112% 111% 112% 112% 109% 107% 106%
Uruguay 116% 117% 142% 134% 137%
AMERICAS (17 countries) (*1)(*2) 114% 118% 118% 119% 118% 113% 114% 114%
Caribbean (4 countries) (*3) 144% 161% 152% 129% 121% 120% 123%
Central America (4 countries) (*4) 124% 124% 127% 130% 130% 118% 133% 143%North America (3 countries) (*5) 108% 113% 112% 113% 113% 110% 109% 107%South America (6 countries) (*6) 157% 152% 157% 152% 145% 127% 134% 150%
Note(*1) Americas refers to the 17 countries included in this Table. (*2) Regional and sub‐regional data for indicated year or nearest available year. (*3) Data for the Caribbean includes: Bahamas, Jamaica, and Trinidad and Tobago. (*4) Data for Central America includes: Belize, Costa Rica, Nicaragua, and Panama. (*5) Data for North America includes: Canada, Mexico and The United States. (*6) Data for South America includes: Argentina, Brazil, Colombia, Guyana, Peru, and Uruguay. (*7) Most countries have not reported data related to inmates detained in Police Stations.
7.54 PRISON OCCUPANCY RATE, 2003‐2010 (%)
Prison population total as a percentage of the official capacity of prisons, penal institutions or correctional facilities. This percentage is the occupancy rate and it demonstrates whether a prison system holds more prisoners than it is intended to hold and, if so, by how much. (*7)
YEAR
Sub‐regional data: (*2)
Indicator definition
PeRsonal De seguRIDaDsecuRITy PeRsonnel

Alertamerica.org: El Observatorio Hemisférico de Seguridad de la OEA :: Informe Sobre Seguridad en las Américas
126
DebIlIDaDes oRIgInaRIas
Centroamérica es por naturaleza un Istmo vulnerable, asentado sobre varias placas tectóni-cas que la hacen proclive a violentos temblores, erupciones volcánicas y terremotos. Es también una víctima principal del cambio climático que cada vez y con mayor frecuencia, es impactada por huracanes e inundaciones. Es al mismo tiem-po un corredor geográfico privilegiado que nos coloca entre los principales mercados ilegales de la droga. Asimismo y salvo pocas excepciones, la re-gión posee por causas socioeconómicas, políticas y culturales, una infraestructura institucional débil que no permite enfrentar con mayor efectividad los problemas actuales del crimen y la violencia.
anTeceDenTes
En los años ochenta, los Presidentes cen-troamericanos, con el propósito de resolver los conflictos político-militares en que se encontra-ban algunos países de la región, suscribieron el “Procedimiento para Establecer una Paz Firme y Duradera en Centroamérica”, denominado Es-quipulas II, mediante el cual se impulsó la paci-ficación, la democratización y el proceso de inte-gración regional.
A partir de las decisiones adoptadas en ma-teria de seguridad, cada país inició un proceso voluntario de desarme y reducción de efectivos
militares, que fortaleció el clima de confianza y seguridad en todo el Istmo. Seguidamente a los acuerdos, los centroamericanos comenzamos a ocupamos de la reconstrucción moral y material de nuestras sociedades para superar todas las consecuencias de la década perdida, creyendo que con el fin de la guerra y la conquista de la de-mocracia, se solucionaban nuestros problemas históricos.
Sin embargo, los acuerdos políticos y la sus-cripción y ratificación de los principales instrumen-tos jurídicos, no profundizaron en la solución de las causas estructurales de la violencia, que desde la independencia de Centroamérica aquejan a nues-tros pueblos, como la pobreza, el subdesarrollo y la exclusión social. Tampoco se consolidaron socie-dades pacificas ni se desarrolló un proceso per-manente de reconciliación nacional en las nue-vas democracias de la región. Asimismo, muchas de las armas que atizaron el conflicto todavía cir-culan libremente entre la población.
A la fecha, hemos tenido éxitos parciales en diferentes ámbitos de la vida de la región, pero aún tenemos tareas pendientes después de tan-tos años de violencia que dejaron como resulta-do migraciones masivas, desintegración familiar, ausencia de valores, irrespeto a la vida y falta de solidaridad, entre otros aspectos.
PRIncIPales InsTRuMenTos juRíDIcos
En el marco de dichos acuerdos menciona-dos anteriormente, surgieron iniciativas jurídicas que le dieron vigencia al actual Sistema de la Inte-gración Centroamericana, siendo la más importante de ellas el “Protocolo de Tegucigalpa” a la Carta de la Organización de Estados Centroamericanos (ODECA), aprobado el 13 de diciembre de 1991.
El artículo 3, literal b) de dicho Protocolo, dispone entre otros aspectos, que: “Centroamé-rica debe concretar un nuevo modelo de seguri-dad regional, sustentado en un balance razona-ble de fuerzas, el fortalecimiento del poder civil, la superación de la pobreza extrema, la promo-
foRTalecIMIenTo InsTITucIonal De los oRganIsMos De seguRIDaD PúblIca en cenTRoaMéRIca
Erich Constantino VílchezDirector de la Unidad de Seguridad Democrática, Sistema de
la Integración Centroamericana

Alertamerica.org: OAS Hemispheric Security Observatory :: Report on Security in the Americas
127
ción del desarrollo sostenible, la protección del medio ambiente, la erradicación de la violencia, la corrupción, el terrorismo, el narcotráfico y el tráfico ilícito de armas”, todo lo cual representa elementos innovadores, para la construcción de un nuevo concepto de Seguridad Democrática.
El Modelo de Seguridad Democrática en Centroamérica, ha tenido una incidencia impor-tante a nivel regional y hemisférico, toda vez que se trata de la primera concepción integral de la seguridad, y la primera en establecer un nexo di-recto entre democracia, seguridad y desarrollo.
El Tratado Marco de Seguridad Democráti-ca en Centroamérica es el instrumento jurídico regional, que contempla como objetivo principal, la creación de un nuevo marco conceptual e ins-titucional de la seguridad en la región, rigiendo el comportamiento de los Estados signatarios en la materia y diseñando lineamientos para la ejecución de la nueva agenda de seguridad en Centroamérica.
InsTRuMenTos DeRIVaDosy coMPleMenTaRIos
Entre otros instrumentos derivados y com-plementarios del Tratado Marco de Seguridad Democrática, se encuentran: el Tratado Cen-troamericano sobre Recuperación y Devolución de Vehículos Hurtados, Robados, Apropiados o Retenidos Ilícita o Indebidamente; el Tratado de
Asistencia Legal Mutua en Asuntos Penales entre los países centroamericanos; el Convenio Cen-troamericano para la Prevención y la Represión de los Delitos de Lavado de Dinero y de Activos Relacionados con el Tráfico Ilícito de Drogas y De-litos Conexos y otro de igual naturaleza. El Trata-do de Extradición Simplificada y el de Protección de Testigos, Victimas, Peritos y otras personas que intervienen en el Proceso Penal.
esTRucTuRa De seguRIDaD RegIonal
Centroamérica posee en términos teóricos y prácticos, una arquitectura político-institucional en materia de seguridad muy importante, re-presentada por las instancias del modelo cen-troamericano de seguridad democrática, que ha permitido entre otros aspectos, una expresión bastante armónica pero débil del Sistema de Se-guridad Regional, desarrollando planes, estrate-gias y acciones concretas, para llevar a la prác-tica el espíritu y la letra del “Tratado Marco de Seguridad Democrática en Centroamérica”, pero que hasta ahora no ha sido suficiente para resol-ver el clima de violencia que actualmente vive la región
la coMIsIón De seguRIDaDDe cenTRoaMéRIca
La Comisión es una instancia de evaluación, coordinación, ejecución y seguimiento, de elabo-ración de propuestas, así como de recomenda-ciones de alerta temprana, y cuando proceda, de pronta acción, subordinada a la Reunión de Presidentes y al Consejo de Ministros de Relacio-nes Exteriores, que impulsa las disposiciones y la puesta en práctica del Tratado Marco, así como las decisiones adoptadas por ella misma.
La Comisión de Seguridad de Centroamé-rica, actualmente impulsa tres ámbitos específi-cos de acción en la agenda regional de seguri-dad, constituidos por: los Desastres Naturales; la Seguridad de las Personas y sus Bienes y la Se-

Alertamerica.org: El Observatorio Hemisférico de Seguridad de la OEA :: Informe Sobre Seguridad en las Américas
128
guridad Regional. La secretaria General del SICA, es la Secretaria Técnica de la Comisión.
InTegRanTes De la coMIsIón De seguRIDaD De cenTRoaMéRIca
Para cumplir con su cometido, la Comisión de Seguridad, está integrada por los Viceminis-tros de Relaciones Exteriores, de Defensa y de Se-guridad Pública o Gobernación, presidiendo los primeros las delegaciones de cada país miembro del SICA. Para desarrollar sus funciones, la Co-misión de Seguridad de Centroamérica, es apo-yada por sus propias subcomisiones sectoriales, de Defensa, Jurídica y Seguridad Pública, a esta última se han integrado las y los Jefes o Directo-res de Policía de Centroamérica y el Consejo de Ministerios Públicos.
Para impulsar las iniciativas regionales en materia de seguridad, la Comisión tiene como instancia de coordinación, a la Presidencia Pro Tempore, la cual es ejercida cada seis meses, por cada país Miembro del Sistema de la Integración Centroamericana SICA, que a su vez es apoyada de forma permanente, por la Secretaría General a través de su Unidad de Seguridad Democrática.
la unIDaD De seguRIDaD DeMocRÁTIca Del sIca
Es creada en el marco de la XXXI Cumbre Ordinaria de Jefes de Estado y de Gobierno del SICA, principalmente para fortalecer el trabajo que desarrolla la Secretaria General del SICA como Secretaria Técnica de la Comisión de Segu-ridad de Centroamérica, así como la instituciona-lidad centroamericana en materia de seguridad democrática.
Tiene como objetivos específicos, el ase-gurar la ejecución efectiva, integral, coheren-te y armónica de la Estrategia de Seguridad de Centroamérica y de sus diversos componentes. Asimismo, la Unidad de Seguridad contribuye al
cumplimiento del mandato y funciones de la Co-misión de seguridad de Centroamérica y de sus respectivas subcomisiones.
Tiene también entre sus objetivos, promo-ver la sostenibilidad financiera, administrativa y técnica de las distintas iniciativas regionales en materia de seguridad. En la actualidad y para una mejor y más eficaz puesta en práctica de la estrategia y sus proyectos derivados, se persigue una reforma o rediseño de la unidad para un me-jor funcionamiento.
DIÁlogos PeRManenTes sobRe seguRIDaDen la RegIón
Hasta la fecha existen tres diálogos importan-tes sobre seguridad regional que se celebran entre los países del SICA con otros estados. Estos son: 1) El Dialogo Estados Unidos de América-SICA; 2) El Dialogo México-SICA y 3) el Diálogo Ad Hoc con la Unión Europea.
El objetivo de dichos diálogos, es el de for-talecer el modelo centroamericano de seguridad democrática y facilitar el desarrollo de proyectos e iniciativas regionales en la lucha contra el cri-men organizado. Al mismo tiempo se desarrollan proyectos e iniciativas conjuntas con diversos es-tados extra regionales y organismos internacio-nales como España, Italia, Alemania, ONU, OEA, ONUDC, PNUD.

Alertamerica.org: OAS Hemispheric Security Observatory :: Report on Security in the Americas
129
sITuacIón acTual De seguRIDaD en cenTRoaMéRIca
El aumento de la violencia es una realidad en Centroamérica que ha llenado los espacios que la cultura de la paz y la legalidad han aban-donado. La violencia ha crecido como una mane-ra de resolver todo tipo de conflictos cotidianos y se presenta de formas múltiples, no solo en el espacio público sino también en los lugares de trabajo, en los hogares de parte importante de la población y hasta en la escuela.
La violencia social y delictiva en los países de la región y con muy pocas excepciones, se en-cuentra entre las más altas de América latina y el Caribe planteando un complejo desafío para las incipientes democracias centroamericanas. La gravedad de la situación ha terminado por asentarse inevitablemente en la opinión pública, en donde según diversas encuestas de opinión, se encuentra entre los primeros problemas de preocupación, superado, cuando lo es, solamen-te por la pobreza o por el desempleo.
Esta situación se encuentra directamente vinculada con la creciente desconfianza ciudada-na hacia las instituciones encargadas del control y la prevención de la criminalidad, principalmen-te los organismos de seguridad pública, policía
y justicia. Contradictoriamente, hoy, los ejércitos tan cuestionados en el pasado, ocupan ahora un buen lugar en la credibilidad de los ciudadanos y en una esperanza frente a la criminalidad.
La intensidad de los fenómenos crimina-les y las carencias o debilidades de nuestras instituciones para combatirlos ha afectado drásticamente la calidad de vida de nuestra población y generando un clima de temor bastante generalizado, que amenaza directa-mente la existencia de nuestras instituciones democráticas y las posibilidades reales del desarrollo económico y social.
PRIncIPales causasDe la cRIsIs
Las principales causas del fenómeno tienen que ver, en primer lugar, con el tráfico de drogas y delitos conexos, y la corrupción que genera. Mu-chos hechos violentos que ocurren en las calles y ciudades, están relacionados con este flagelo y se podría afirmar que ningún país centroamerica-no escapa por completo a él.
La región además, no sólo sufre la extrema violencia debida a los homicidios, provocados en su gran mayoría por actividades criminales como el tráfico de drogas, sino también muchos otros hechos delictivos cotidianos y comunes, tales como los robos con violencia, los secuestros, los abusos sexuales, las Maras o Pandillas juveniles y la violencia en el hogar.
Destacan además entre otros orígenes, el fácil acceso a las armas de fuego, especialmen-te cortas y ligeras, el uso de sistemas modernos de comunicación y facilidades bancarias novedo-sas, la presencia de fronteras porosas, las debi-lidades institucionales, la corrupción y un poder judicial que, según encuestas de opinión, es con-siderado por la mayoría, como ineficiente y lento en muchos de nuestros países.
Es esencial comprender que el problema de la inseguridad no puede interpretarse únicamen-te como la suma de los hechos delictivos que su-

Alertamerica.org: El Observatorio Hemisférico de Seguridad de la OEA :: Informe Sobre Seguridad en las Américas
130
fren nuestras sociedades sino que se trata de un fenómeno de mayor alcance y profundidad, que se origina en esos hechos pero que los trascien-de hasta crear un verdadero clima social de ca-rácter epidémico.
La seguridad es parte fundamental de los derechos de los centroamericanos, y cuando es vulnerada, otros derechos fundamentales pier-den la capacidad de realizarse a plenitud. Es ne-cesario, por lo tanto, desarrollar políticas de se-guridad que en el marco del Estado de Derecho contribuyan a su fortalecimiento, sepan entender las más complejas causas del fenómeno de la in-seguridad, den cuenta efectiva de sus manifesta-ciones inmediatas y reduzcan significativamente sus posibilidades de incidencia futura en la vida de Centroamérica.
causas esTRucTuRalesDel fenóMeno
La pobreza por sí sola no es un factor ex-plicativo de la ola de violencia que actualmente abate a Centroamérica, existe una correlación muy clara entre diversos factores socioeconómi-cos y otros como la desigualdad, la marginación y la exclusión en las que vive una parte importante de la población.
Otro aspecto importante está relaciona-do con la situación familiar. Un porcentaje muy alto de familias enfrenta problemas de hogares mono-parentales, maternidad y paternidad ado-lescentes, descendencia numerosa, carencia de sistemas de protección social y viviendas hacina-das que inducen o intensifican las situaciones de conflicto, abuso y violencia, especialmente en los sectores más necesitados de la sociedad.
En Centroamérica un alto porcentaje de los jóvenes no estudia ni trabaja. Para ellos protago-nizar o ser víctima de la violencia es una posibili-dad cotidiana debido a la falta de oportunidades, la imposibilidad de una educación de calidad y poco acceso a espacios de recreación o al desa-rrollo de una vida comunitaria sana.
El irrespeto reiterado a la ley que impera en general en nuestras sociedades, así como la práctica de la resolución de conflictos por cuenta propia, generalmente por medio de la violencia con impunidad, son otros aspectos. En muchos de nuestros países generalmente la inmensa mayoría de las faltas menores y muchos de los crímenes más graves quedan sin sanción, agra-vando la percepción de indefensión y la humilla-ción de las víctimas. La carencia de sanción a los hechos criminales es un estímulo para que éstos se extiendan y repitan.
cosTos econóMIcosDe la VIolencIa
El crimen y la violencia, tienen un alto costo económico para nuestras sociedades. Enfrentar la delincuencia tiene un impacto importante en el gasto fiscal y adicionalmente y bajo distintas modalidades, en todos los estratos sociales la población vive la necesidad de gastar parte del presupuesto familiar en protegerse y procurarse medidas propias adicionales de seguridad.
Existen también claros indicios de que el cli-ma general de inseguridad afecta negativamente decisiones financieras y oportunidades de inver-sión nacional y extranjera, lo que tiene efectos directos sobre el desarrollo de la región. Se debe tener presente también que la forma más grave de crimen y violencia, el homicidio, contribuye di-rectamente a desorganizar la vida económica de la sociedad. Es una factor inhibidor del desarrollo y un des articulador de las relaciones sociales.
PRIoRIDaDes De la seguRIDaD RegIonal
Las prioridades relacionadas a la seguridad regional se encuentran contenidas en la Estra-tegia de Seguridad de Centroamérica, acordada por los Jefes de Estado y de Gobierno del Sistema de la Integración Centroamericana. La actual Es-trategia tiene cuatro componentes: 1) Combate al delito, 2) prevención 3) reinserción, rehabilita-

Alertamerica.org: OAS Hemispheric Security Observatory :: Report on Security in the Americas
131
ción y seguridad penitenciaria 4) Fortalecimiento Institucional.
La idea principal de la Estrategia de Segu-ridad es integrar los esfuerzos regionales, en concordancia con los ordenamientos jurídicos nacionales, con el fin de armonizarlos para la obtención de resultados contundentes en contra de las amenazas a la seguridad democrática. Su objetivo general es “establecer los componentes y actividades necesarias para fortalecer en la re-gión centroamericana la seguridad de las perso-nas y sus bienes”.
caMbIo De PaRaDIgMa
No se puede analizar la realidad de la inse-guridad pública en Centroamérica sin poner en un lugar central la necesidad de llevar a cabo un cambio de cultura como eje central de las políti-cas públicas que la enfrenten. Ninguna actividad de exclusivo control podrá alcanzar el máximo de eficiencia social que el problema del crimen y la violencia genera en nuestras sociedades, si no es complementado por una adecuada estrategia de prevención y promoción de una cultura de la legalidad.
Es nuestra absoluta convicción que esas políticas nacionales de seguridad, públicas o re-gionales, deben ser integrales. En el plano más estratégico deben combinar políticas de control y sanción con políticas de prevención y rehabili-tación y en el terreno operativo involucrar trans-versalmente la acción de las diversas instancias del Estado, con una adecuada participación de la sociedad civil y los gobiernos locales.
las PRIncIPales DebIlIDaDes InsTITucIonales
De conformidad con el Informe del Desa-rrollo Humano del PNUD, entre las principales debilidades de los estados para enfrentar la ola de violencia que abate a Centroamérica, se en-
cuentran: la politización de las autoridades judi-ciales, las amenazas a los operadores de justicia; bajos presupuestos para el funcionamiento de la administración de justicia; falta de independen-cia de las autoridades judiciales; debilidades del marco legal; sobrepoblación carcelaria y serios problemas de eficiencia en la justicia penal.
Otras debilidades se relacionan con el he-cho de que algunas instancias no responden a un esquema de coordinación sistémica y operati-va en el marco de la Estrategia de Seguridad de Centroamérica. Existe además cierta carencia de una visión regional en las instituciones naciona-les, entrando en contradicción con la naturaleza de la Estrategia de Seguridad de Centroamérica, lo cual prevé problemas en el seguimiento de su cumplimiento y en la dirección de los Proyectos que se derivan de ella;
Se nota una ausencia de políticas regiona-les de carácter sectorial derivadas de la Estrate-gia de Seguridad; así como una diversidad de estructuras institucionales y marcos normativos que hace complejo el tratamiento de las diferen-tes temáticas; hay una ausencia de Planificación estratégica que oriente las acciones operativas y debilidad en la cultura de integración regional. Existe también, debilidad en la institucionalidad operativa con visión regional en materia de segu-ridad (¿Quién da seguimiento?, ¿Quién ejecuta?, ¿Quién integra?). Ello da lugar a una ausencia de herramientas regionales de sistematización, se-guimiento de acciones.

Alertamerica.org: El Observatorio Hemisférico de Seguridad de la OEA :: Informe Sobre Seguridad en las Américas
132
Se hace notorio además, la escases del re-curso humano en temas de planificación, segui-miento y gerenciamiento de proyectos en materia de seguridad. Por ello el fortalecimiento institu-cional de las instituciones debe estar destinado entre otros aspectos, a resolver los retos que re-presenta el darle seguimiento operativo a la Es-trategia de Seguridad y sus proyectos derivados, incorporando a las instancias de visión regional con un carácter consultivo.
PRIncIPales foRTalezas InsTITucIonales
Esta comprobada la voluntad de los gobier-nos centroamericanos de coordinar con visión regional el tema de seguridad, dado el fuerte componente jurídico regional en materia de se-guridad que incluye el Tratado Marco de Seguri-dad Democrática, una Estrategia de Seguridad de Centroamérica y su Plan de Acción con Cos-tos, así como el actual desarrollo de 22 proyectos que tratan de cubrir las necesidades de los cua-tro componentes de le estrategia.;
Existen además los suficientes diagnósticos y mandatos ministeriales y presidenciales para desarrollar los ajustes que sean necesarios ante la realidad que viven los centroamericanos y que-da plenamente reconocido el esfuerzo institucio-nal de carácter regional, que refleja un número interesante de instancias de coordinación institu-cional, algunas de carácter político, otras de ca-rácter consultivo, otras de carácter operativo que deben de ser fortalecidas;
En la actualidad se desarrolla un proceso de formulación de proyectos regionales de Se-guridad y la Secretaría General del SICA, agiliza en el marco de sus capacidades, las acciones de construcción de espacios de diálogos y debates de carácter políticos para la modernización del aspecto jurídico, coordinación y acciones opera-tivas de carácter regional;
De las últimas Cumbres de Presidentes centroamericanos han emanado mandatos para establecer un Movimiento regional amplio de la Sociedad en su conjunto contra el crimen organi-
zado y la violencia, así como un programa regio-nal de juventud;
También ha quedado demostrada la vo-luntad de los sectores de la sociedad civil cen-troamericana, la empresa privada, los municipios y medios de Comunicación de apoyar las accio-nes de los gobiernos en la implementación de una Estrategia de Seguridad Regional;
De la Conferencia Internacional de Segu-ridad en apoyo a la Estrategia de Seguridad de Centroamérica, celebrada en Guatemala el 22 y 23 de junio de 2011, queda plenamente claro el compromiso de la Comunidad Internacional para apoyar las prioridades de seguridad regional identificada por los países Centroamericanos;
ResulTaDos Que se esPeRan Del acTual PRoceso De foRTalecIMIenTo InsTITucIonal en la RegIón
Lograr una visión integral y regional de del pro-yecto fortalecimiento institucional con relación a la formulación de los otros 21 proyectos emanados de de la Estrategia de Seguridad, y los que en el fu-turo se logren diseñar derivados de ella;
Establecer las necesidades de recursos que se requieren en materia de coordinación para lograr el seguimiento adecuado de los proyectos derivados de la Estrategia de Seguridad de Cen-troamérica;
Combinar y apuntalar los esfuerzos de las instituciones nacionales hacia el logro de los ob-jetivos de la Estrategia de Seguridad Regional, logrando los criterios necesarios para implemen-tar y operativizar el Mecanismo de Coordinación, Evaluación y Seguimiento de los proyectos y la Estrategia de Seguridad regional. Las políticas de seguridad pública deben estimular la partici-pación de las autoridades civiles locales, espe-cialmente en las dimensiones preventivas de la seguridad, pero también en su relación con los cuerpos de policía.
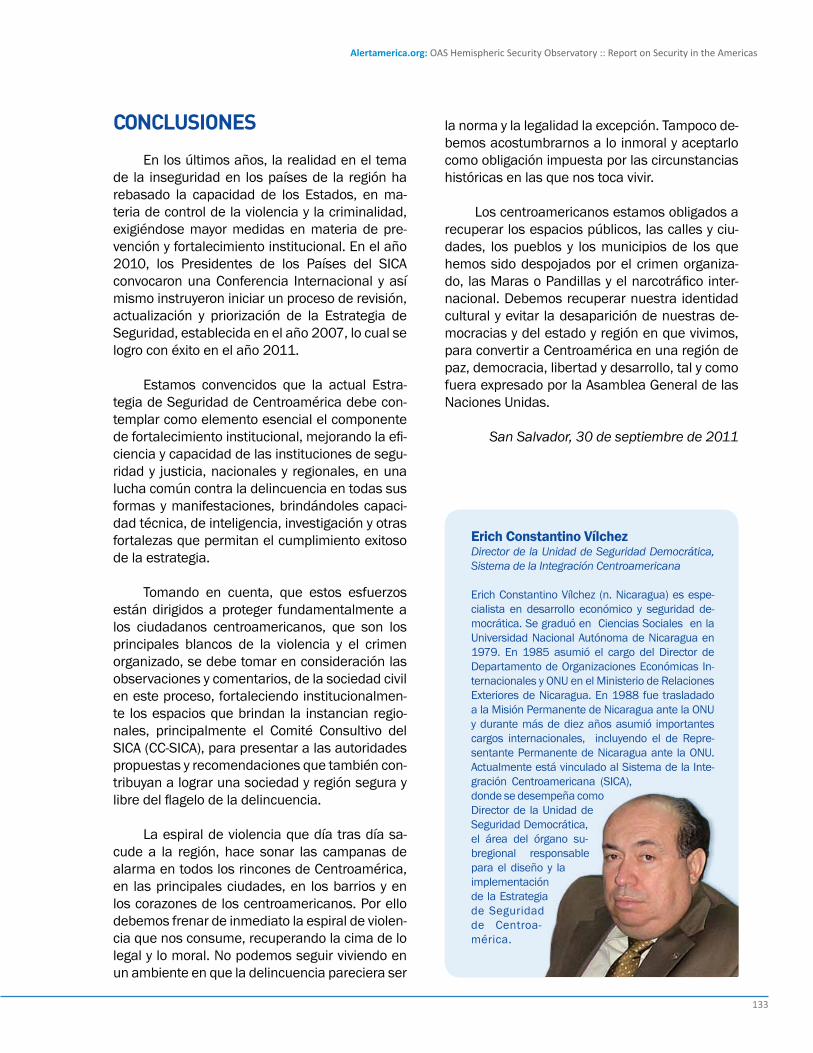
Alertamerica.org: OAS Hemispheric Security Observatory :: Report on Security in the Americas
133
conclusIones
En los últimos años, la realidad en el tema de la inseguridad en los países de la región ha rebasado la capacidad de los Estados, en ma-teria de control de la violencia y la criminalidad, exigiéndose mayor medidas en materia de pre-vención y fortalecimiento institucional. En el año 2010, los Presidentes de los Países del SICA convocaron una Conferencia Internacional y así mismo instruyeron iniciar un proceso de revisión, actualización y priorización de la Estrategia de Seguridad, establecida en el año 2007, lo cual se logro con éxito en el año 2011.
Estamos convencidos que la actual Estra-tegia de Seguridad de Centroamérica debe con-templar como elemento esencial el componente de fortalecimiento institucional, mejorando la efi-ciencia y capacidad de las instituciones de segu-ridad y justicia, nacionales y regionales, en una lucha común contra la delincuencia en todas sus formas y manifestaciones, brindándoles capaci-dad técnica, de inteligencia, investigación y otras fortalezas que permitan el cumplimiento exitoso de la estrategia.
Tomando en cuenta, que estos esfuerzos están dirigidos a proteger fundamentalmente a los ciudadanos centroamericanos, que son los principales blancos de la violencia y el crimen organizado, se debe tomar en consideración las observaciones y comentarios, de la sociedad civil en este proceso, fortaleciendo institucionalmen-te los espacios que brindan la instancian regio-nales, principalmente el Comité Consultivo del SICA (CC-SICA), para presentar a las autoridades propuestas y recomendaciones que también con-tribuyan a lograr una sociedad y región segura y libre del flagelo de la delincuencia.
La espiral de violencia que día tras día sa-cude a la región, hace sonar las campanas de alarma en todos los rincones de Centroamérica, en las principales ciudades, en los barrios y en los corazones de los centroamericanos. Por ello debemos frenar de inmediato la espiral de violen-cia que nos consume, recuperando la cima de lo legal y lo moral. No podemos seguir viviendo en un ambiente en que la delincuencia pareciera ser
la norma y la legalidad la excepción. Tampoco de-bemos acostumbrarnos a lo inmoral y aceptarlo como obligación impuesta por las circunstancias históricas en las que nos toca vivir.
Los centroamericanos estamos obligados a recuperar los espacios públicos, las calles y ciu-dades, los pueblos y los municipios de los que hemos sido despojados por el crimen organiza-do, las Maras o Pandillas y el narcotráfico inter-nacional. Debemos recuperar nuestra identidad cultural y evitar la desaparición de nuestras de-mocracias y del estado y región en que vivimos, para convertir a Centroamérica en una región de paz, democracia, libertad y desarrollo, tal y como fuera expresado por la Asamblea General de las Naciones Unidas.
San Salvador, 30 de septiembre de 2011
erich Constantino VílchezDirector de la Unidad de Seguridad Democrática, Sistema de la Integración Centroamericana
Erich Constantino Vílchez (n. Nicaragua) es espe-cialista en desarrollo económico y seguridad de-mocrática. Se graduó en Ciencias Sociales en la Universidad Nacional Autónoma de Nicaragua en 1979. En 1985 asumió el cargo del Director de Departamento de Organizaciones Económicas In-ternacionales y ONU en el Ministerio de Relaciones Exteriores de Nicaragua. En 1988 fue trasladado a la Misión Permanente de Nicaragua ante la ONU y durante más de diez años asumió importantes cargos internacionales, incluyendo el de Repre-sentante Permanente de Nicaragua ante la ONU. Actualmente está vinculado al Sistema de la Inte-gración Centroamericana (SICA), donde se desempeña como Director de la Unidad de Seguridad Democrática, el área del órgano su-bregional responsable para el diseño y la implementación de la Estrategia de Seguridad de Centroa-mérica.

Alertamerica.org: El Observatorio Hemisférico de Seguridad de la OEA :: Informe Sobre Seguridad en las Américas
134
COUNTRY
Antigua and Barbuda 2009 632 718
Argentina 2007 77,055 195
Bahamas 2010 2,644 764
Barbados 2009 1,414 552
Belize 2010 1,160 371
Bolivia 2010 36,045 357
Brazil 2009 330,940 169
Canada 2010 69,250 202
Chile 2010 36,509 211
Colombia 2010 159,071 339
Costa Rica 2010 11,845 251
Dominica 2009 423 549
Dominican Republic 2006 29,357 299
Ecuador 2006 38,629 290
El Salvador 2007 18,321 299
Grenada 2009 1,000 962
Guatemala 2009 22,655 158
Guyana 2011 2,900 384
Haiti 2012 14,000 138
Honduras 2011 14,500 187
Jamaica 2011 11,152 405
Mexico 2010 420,698 366
Nicaragua 2010 9,749 166
Panama 2004 14,732 457
Paraguay 2010 22,000 335
Peru 2010 100,390 341
Saint Kitts and Nevis 2009 400 769
Saint Lucia 2009 1,039 597
Saint Vincent and the Grenadines 2009 980 899
Suriname 2006 1,200 238
Trinidad and Tobago 2009 6,605 493
United States 2010 705,009 228
Uruguay 2004 16,867 500
Venezuela 2006 69,122 256
AMERICAS (34 countries) (*1)(*2) 2010 2,248,293 246
Caribbean (12 countries) (*3) 2009 69,646 275
Central America (7 countries) (*4) 2009 92,962 223
North America (3 countries) (*5) 2010 1,194,957 264
South America (12 countries) (*6) 2009 890,728 229
Note
Sub‐regional data: (*2)
(*1) Americas refers to the 34 countries included in this Table. (*2) Regional and sub‐regional data for indicated year or nearest available year. (*3) Data for the Caribbean includes: Antigua and Barbuda, Bahamas, Barbados, Dominica, Dominican Republic, Grenada, Haiti, Jamaica, Saint Kitts and Nevis, Saint Lucia, Saint Vincent and the Grenadines, and Trinidad and Tobago. (*4) Data for Central America includes: Belize, Costa Rica, El Salvador, Guatemala, Honduras, Nicaragua, and Panama. (*5) Data for North America includes: Canada, Mexico, and the United States. (*6) Data for South America includes: Argentina, Bolivia, Brazil, Chile, Colombia, Ecuador, Guyana, Paraguay, Peru, Suriname, Uruguay, and Venezuela.
Personnel in public agencies as at December 31 of a given year whose, principal functions are the prevention, detection and investigation of crime and the apprehension of alleged offenders. Data concerning support staff (secretaries, clerts, etc.) is not included.
8.55 POLICE PERSONNEL FOR THE LATEST AVAILABLE YEAR (TOTAL AND RATE)
Latest available year Police personnel total Rate per 100,000 inhabitants
Indicator definition

Alertamerica.org: OAS Hemispheric Security Observatory :: Report on Security in the Americas
135
COUNTRY
2004 2005 2006 2007 2008 2009 2010
Bahamas 2,055 2,204 2,361 2,442 2,521 2,644
Barbados 1,399 1,373 1,419 1,408 1,414
Belize 980 986 1,020 1,196 1,165 1,162 1,160
Bolivia 25,393 26,503 33,523 34,632 35,566 36,045
Brazil 305,955 282,106 395,754 300,677 345,922 330,940
Canada 50,800 61,026 62,461 64,134 65,283 67,425 69,250
Chile 30,855 30,490 31,604 31,825 33,361 34,989 36,509
Colombia 122,788 128,390 139,386 135,644 145,871 152,340 159,071
Costa Rica 9,179 9,531 9,585 10,349 10,416 11,045 11,845
Guatemala 21,380 20,804 21,480 18,513 19,474 22,655
Nicaragua 8,373 8,367 9,216 9,290 9,709 9,749
Peru 70,419 70,319 71,411 75,860 85,580 92,084 100,390
Saint Lucia 714 770 826 1,024 1,039
Trinidad and Tobago 5,802 6,030 6,224 6,205 6,333 6,605
United States 675,734 673,146 683,396 699,850 708,569 706,886 705,009
AMERICAS (15 countries) (*1)(*2) 1,331,826 1,320,756 1,462,387 1,391,672 1,471,189 1,476,380 1,494,325
Caribbean (4 countries) (*3) 9,970 10,198 10,571 10,811 11,207 11,579 11,702Central America (4 countries) (*4) 39,912 39,688 41,301 39,348 40,764 44,571 45,409North America (2 countries) (*5) 726,534 734,172 745,857 763,984 773,852 774,311 774,259South America (5 countries) (*6) 555,410 536,698 664,658 577,529 645,366 645,919 662,955
Note(*1) Americas refers to the 15 countries included in this Table. (*2) Regional and sub‐regional data for indicated year or nearest available year. (*3) Data for the Caribbean includes: Bahamas, Barbados, Saint Lucia, and Trinidad and Tobago. (*4) Data for Central America includes:Belize, Costa Rica, Guatemala, and Nicaragua. (*5) Data for North America includes: Canada and The United States. (*6) Data for South America includes: Bolivia, Brazil, Chile, Colombia, and Peru.
8.56 POLICE PERSONNEL, 2004‐2010 (TOTAL)
Personnel in public agencies as at December 31 of a given year, whose principal functions are the prevention, detection and investigation of crime and the apprehension of alleged offenders. Data concerning support staff (secretaries, clerts, etc.) is not included.
YEAR
Sub‐regional data:
Indicator definition
Excerpt from the Hemispheric Plan of Action on Citizen Security in the Americas approved by the OAS Permanent Council on May 2, 2012.
To foster mutual legal assistance in criminal matters at the hemispheric level the countries of the Americas will allow the implementation of hemispheric mechanisms for judicial cooperation and mutual legal assistance in fighting transnational organized crime.

Alertamerica.org: El Observatorio Hemisférico de Seguridad de la OEA :: Informe Sobre Seguridad en las Américas
136
COUNTRY
2004 2005 2006 2007 2008 2009 2010
Bahamas 632 668 707 722 737 764
Barbados 553 541 556 552 552
Belize 355 350 354 405 387 379 371
Bolivia 277 283 352 357 361 359
Brazil 166 152 210 158 180 171
Canada 159 189 191 194 196 200 204
Chile 191 187 192 191 199 206 213
Colombia 290 298 319 306 324 334 344
Costa Rica 216 220 218 232 230 241 255
Guatemala 172 164 165 139 142 162
Nicaragua 155 153 167 166 171 167
Peru 256 253 253 266 297 316 340
Saint Lucia 433 461 492 602 604
Trinidad and Tobago 442 458 470 467 475 494
United States 231 228 229 232 233 230 228
AMERICAS (15 countries) (*1)(*2) 212 208 228 214 224 223 224
Caribbean (4 countries) (*3) 486 495 510 519 535 549 553Central America (4 countries) (*4) 179 174 178 166 169 181 181North America (2 countries) (*5) 224 224 225 228 229 227 226South America (5 countries) (*6) 199 190 233 200 221 219 222
Note(*1) Americas refers to the 15 countries included in this Table. (*2) Regional and sub‐regional data for indicated year or nearest available year. (*3) Data for the Caribbean includes: Bahamas, Barbados, Saint Lucia, and Trinidad and Tobago. (*4) Data for Central America includes:Belize, Costa Rica, Guatemala and Nicaragua. (*5) Data for North America includes: Canada and The United States. (*6) Data for South America includes: Bolivia, Brazil, Chile, Colombia, and Peru.
8.57 POLICE PERSONNEL, 2004‐2010 (RATE)
Personnel in public agencies as at December 31 of a given year, whose principal functions are the prevention, detection and investigation of crime and the apprehension of alleged offenders. Data concerning support staff (secretaries, clerts, etc.) is not included. Some countries with fewer than 100,000 inhabitants have their rates presented for comparative purposes.
YEAR
Sub‐regional data: (*2)
Indicator definition

Alertamerica.org: OAS Hemispheric Security Observatory :: Report on Security in the Americas
137
COUNTRY
Latest available year Total male personnel Total female personnel % of male personnel
Bahamas 2010 2,078 566 79%
Barbados 2009 1,176 238 83%
Belize 2009 1,021 141 88%
Bolivia 2010 32,081 3,964 89%
Brazil 2009 259,418 35,522 78%
Canada 2010 55,930 13,320 81%
Chile 2010 32,566 3,943 89%
Colombia 2009 148,874 10,197 98%
Costa Rica 2010 10,397 1,448 88%
Guatemala 2009 19,910 2,745 88%
Jamaica 2010 9,308 3,026 75%
Mexico 2010 303,661 51,332 72%
Nicaragua 2010 7,101 1,748 73%
Peru 2009 82,371 9,713 89%
Saint Kitts and Nevis 2009 293 107 73%
Saint Lucia 2008 808 216 79%
Saint Vincent and the Grenadines 2009 786 194 80%
Trinidad and Tobago 2009 5,420 1,185 82%
United States 2010 621,817 83,192 88%
AMERICAS (19 countries)(*1)(*2) 2010 1,595,016 222,797 82.8%
Caribbean (7 countries) (*3) 2010 19,869 5,532 78%Central America (4 countries) (*4) 2010 38,429 6,082 85%North America ( 3 countries) (*5) 2010 981,408 49,281 82%South America ( 5 countries) (*6) 2010 555,310 63,339 84%
Note (*1) Americas refers to the 19 countries included in this Table. (*2) Regional and sub‐regional data for indicated year or nearest available year. (*3) Data for the Caribbean includes: Bahamas, Jamica, Barbados, Saint Lucia, and Trinidad and Tobago. (*4) Data for Central America includes: Belize, Costa Rica, Guatemala, and Nicaragua. (*5) Data for North America includes: Mexico, Canada, and The United States. (*6) Data for South America includes: Bolivia, Brazil, Chile, Colombia, and Peru.
8.58 POLICE PERSONNEL BY GENDER FOR THE LATEST AVAILABLE YEAR (TOTAL AND RATE)
Personnel in public agencies as at December 31 of a given year, whose principal functions are the prevention, detection and investigation of crime and the apprehension of alleged offenders. Data concerning support staff (secretaries, clerts, etc.) is not included.
Sub‐regional data:
Indicator definition

Alertamerica.org: El Observatorio Hemisférico de Seguridad de la OEA :: Informe Sobre Seguridad en las Américas
138
COUNTRY
Latest available year Total private security personnel Private security personnel rate per 100,000
Argentina 2007 150,000 380
Bahamas 2009 2,100 614
Barbados 2009 1,455 568
Belize 2009 1,180 384
Brazil 2008 1,675,415 873
Chile 2007 92,864 558
Colombia 2007 190,000 428
Costa Rica 2011 26,143 553
Dominica 2009 182 272
Ecuador 2005 40,368 309
El Salvador 2008 21,146 345
Grenada 2009 816 792
Guatemala 2007 120,000 899
Guyana 2009 5,396 708
Jamaica 2009 15,778 591
Paraguay 2010 28,000 433
Peru 2007 50,000 175
Saint Kitts and Nevis 2009 600 1,200
Saint Lucia 2009 250 145
Saint Vincent and the Grenadines 2009 379 348
Trinidad and Tobago 2010 5,000 373
United States 2008 1,086,000 357
AMERICAS (22 countries)(*1)(*2) 2009 3,513,072 520
Caribbean (9 countries) (*3) 2009 26,560 519Central America (4 countries) (*4) 2009 168,469 687North America ( 1 country) (*5) 2008 1,086,000 357South America ( 8 countries) (*6) 2008 2,232,043 654
Note (*1) Americas refers to the 22 countries included in this Table. (*2) Regional and sub‐regional data for indicated year or nearest available year. (*3) Data for the Caribbean includes: Bahamas, Barbados, Dominica, Grenada, Saint Kitts and Nevis, Saint Lucia, Saint Vincent and the Grenadines, and Trinidad and Tobago. (*4) Data for Central America includes: Belize, Costa Rica, El Salvador, and Guatemala. (*5) Data for North America includes: only The United States. (*6) Data for South America includes: Argentina, Brazil, Chile, Colombia, Ecuador, Guyana, Paraguay, and Peru.
8.59 PRIVATE SECURITY PERSONNEL, LATEST AVAILABLE YEAR (TOTAL AND RATE)
Number of security personnel in private agencies as of December 31 of a specific year, whose principal functions are protection and provision of security. Some countries with fewer than 100,000 inhabitants have their rates presented for comparative purposes.
Sub‐regional data: (*2)
Indicator definition
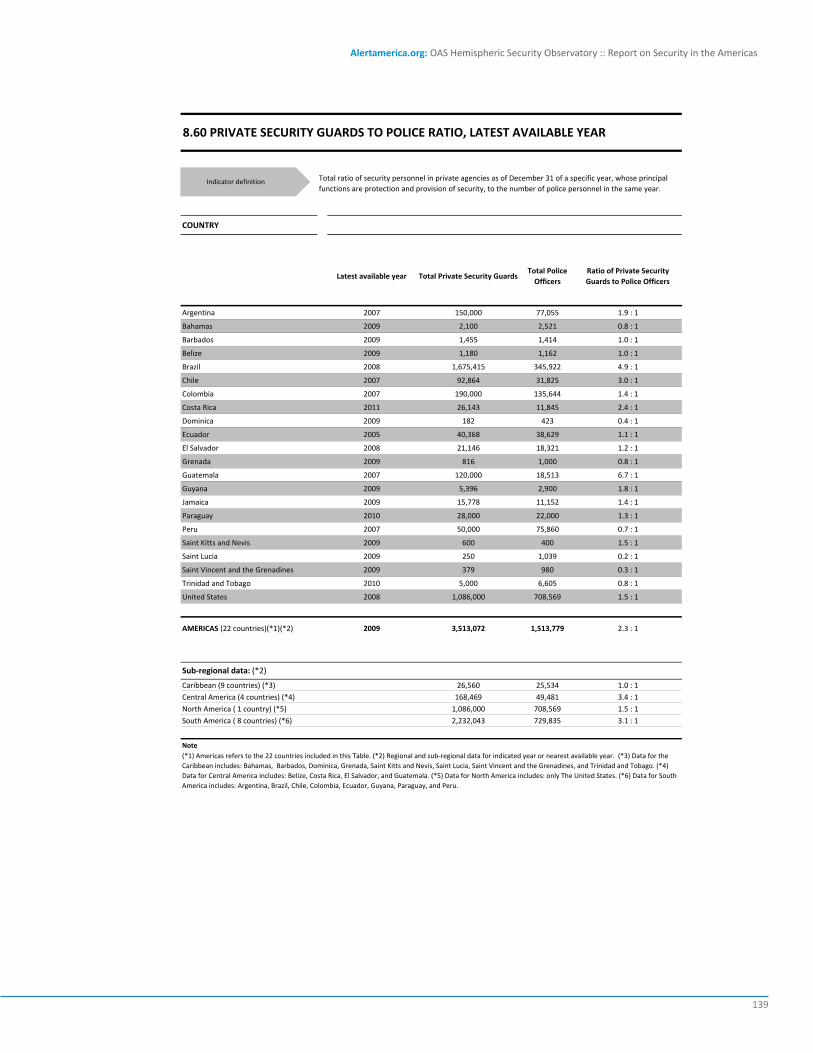
Alertamerica.org: OAS Hemispheric Security Observatory :: Report on Security in the Americas
139
COUNTRY
Latest available year Total Private Security GuardsTotal Police Officers
Ratio of Private Security Guards to Police Officers
Argentina 2007 150,000 77,055 1.9 : 1
Bahamas 2009 2,100 2,521 0.8 : 1
Barbados 2009 1,455 1,414 1.0 : 1
Belize 2009 1,180 1,162 1.0 : 1
Brazil 2008 1,675,415 345,922 4.9 : 1
Chile 2007 92,864 31,825 3.0 : 1
Colombia 2007 190,000 135,644 1.4 : 1
Costa Rica 2011 26,143 11,845 2.4 : 1
Dominica 2009 182 423 0.4 : 1
Ecuador 2005 40,368 38,629 1.1 : 1
El Salvador 2008 21,146 18,321 1.2 : 1
Grenada 2009 816 1,000 0.8 : 1
Guatemala 2007 120,000 18,513 6.7 : 1
Guyana 2009 5,396 2,900 1.8 : 1
Jamaica 2009 15,778 11,152 1.4 : 1
Paraguay 2010 28,000 22,000 1.3 : 1
Peru 2007 50,000 75,860 0.7 : 1
Saint Kitts and Nevis 2009 600 400 1.5 : 1
Saint Lucia 2009 250 1,039 0.2 : 1
Saint Vincent and the Grenadines 2009 379 980 0.3 : 1
Trinidad and Tobago 2010 5,000 6,605 0.8 : 1
United States 2008 1,086,000 708,569 1.5 : 1
AMERICAS (22 countries)(*1)(*2) 2009 3,513,072 1,513,779 2.3 : 1
Caribbean (9 countries) (*3) 26,560 25,534 1.0 : 1
Central America (4 countries) (*4) 168,469 49,481 3.4 : 1
North America ( 1 country) (*5) 1,086,000 708,569 1.5 : 1
South America ( 8 countries) (*6) 2,232,043 729,835 3.1 : 1
Note
8.60 PRIVATE SECURITY GUARDS TO POLICE RATIO, LATEST AVAILABLE YEAR
Total ratio of security personnel in private agencies as of December 31 of a specific year, whose principal functions are protection and provision of security, to the number of police personnel in the same year.
(*1) Americas refers to the 22 countries included in this Table. (*2) Regional and sub‐regional data for indicated year or nearest available year. (*3) Data for the Caribbean includes: Bahamas, Barbados, Dominica, Grenada, Saint Kitts and Nevis, Saint Lucia, Saint Vincent and the Grenadines, and Trinidad and Tobago. (*4) Data for Central America includes: Belize, Costa Rica, El Salvador, and Guatemala. (*5) Data for North America includes: only The United States. (*6) Data for South America includes: Argentina, Brazil, Chile, Colombia, Ecuador, Guyana, Paraguay, and Peru.
Sub‐regional data: (*2)
Indicator definition

Alertamerica.org: El Observatorio Hemisférico de Seguridad de la OEA :: Informe Sobre Seguridad en las Américas
140
COUNTRY
Latest available year Total of registered companies
Argentina 2006 1,200
Bahamas 2009 180
Barbados 2009 33
Belize 2009 67
Bolivia 2006 57
Brazil 2008 2,904
Chile 2007 1,048
Colombia 2009 525
Costa Rica 2011 906
Dominica 2009 10
Ecuador 2005 849
El Salvador 2006 274
Grenada 2009 20
Guatemala 2006 127
Guyana 2009 76
Jamaica 2009 170
Paraguay 2010 210
Peru 2006 1,932
Saint Kitts and Nevis 2009 10
Saint Lucia 2009 26
Saint Vincent and the Grenadines 2009 7
Trinidad and Tobago 2009 231
Uruguay 2005 183
AMERICAS (23 countries)(*1)(*2) 2009 11,045
Caribbean (10 countries) (*3) 2009 763
Central America ( 4 countries) (*4) 2009 1,374
South America ( 9 countries) (*6) 2009 8,908
Note (*1) Americas refers to the 23 countries included in this Table. (*2) Regional and sub‐regional data for indicated year or nearest available year. (*3) Data for the Caribbean includes: Bahamas, Jamica, Dominica, Grenada, Guyana, Barbados, Saint Lucia, Saint Kitts and Nevis, and Trinidad and Tobago. (*4) Data for Central America includes: Belize, Costa Rica, Guatemala, and El Salvador. (*5) Data for South America includes: Argentina, Bolivia, Brazil, Chile, Ecuador, Colombia, Paraguay, Peru, and Uruguay.
8.61 REGISTERED PRIVATE SECURITY COMPANIES, LATEST AVAILABLE YEAR (TOTAL)
Number of private security companies with a valid, official, registered name; including those which deal with the transportation of goods as well as companies which possess their own private security sections.
Sub‐regional data: (*2)
Indicator definition

Alertamerica.org: OAS Hemispheric Security Observatory :: Report on Security in the Americas
141
In the last twenty-five years, the number of private firms offering security services has increased steadily in the Americas. In many cases, the employees of these businesses far outnumber the police in the member states. Recent studies show how the number of private security services is growing worldwide. These studies find that in the period that preceded the current global economic crisis, private firms or industries involved in security on the world’s major mar-kets experienced extraordinary growth rates that ranged between 8% and 9%. This was twice the rate of growth of the global economy as a whole, and was exceeded only by the growth in the automotive industry during that same period. In Latin America, the growth in the market for private security goods and services is estimated at around 11% over the last 15 years.
- OAS Inter-American Commissionon Human Rights,
“Report on Citizen Security and Human Rights”, 2009. - P.28
PRIVaTIzaTIon of cITIzen secuRITy
OEA/Ser.L/V/II. Doc. 57 31 December 2009 Original: Spanish
REPORT ON CITIZEN SECURITY AND HUMAN RIGHTS
2009 Internet: http://www.cidh.orgE‐mail: [email protected]
INTER‐AMERICAN COMMISSION ON HUMAN RIGHTS


encuesTa De VIcTIMIzacIónVIcTIMIzaTIon suRVeys

Alertamerica.org: El Observatorio Hemisférico de Seguridad de la OEA :: Informe Sobre Seguridad en las Américas
144
Surveys that obtain information from citi-zens about crimes they have experienced, com-monly called victimization surveys, have beco-me an increasingly useful tool throughout the world for understanding the extent and nature of crime.1 National and subnational victimization surveys are increasingly being implemented as nations understand that the traditional tools for measuring crimes, including official counts of crimes reported to police, are not adequate for informing the public about crime they experien-ce, for addressing the problems crime presents or for developing effective programs to reduce crime and assist its victims. A 2005 inventory of victimization surveys compiled by the United Nations Office on Drugs and Crime (UNODC) and United Nations Economic Commission for Europe (UNECE) of countries within UNECE scope found that 33 nations had conducted at least one victi-mization survey since 1993. The 2011 OAS onli-ne document Alertamerica.org reported that 14 member nations of the OAS had conducted at least one victimization survey since 2002, many of which are ongoing series.
Victimization surveys have been a growing resource because they fulfill a number of pur-poses. First, victimization surveys act as an in-dependent source of information, providing a “check” on official police based crime statistics which can be impacted, or may be seen by the public as being impacted, by various factors, such
1 Victimization surveys can also be a tool in measu-ring crimes against businesses. Because such surveys have their own attributes, strengths and limitations, they are outsi-de the scope of this article.
as available manpower and resources, program-matic priorities, and, at times, political pressures to use the statistics to impact public opinion. Sur-veys can provide a second, independent source of information on crimes people say they repor-ted to police, and can also provide information on the substantial numbers of crimes never repor-ted to police or recorded by them. Surveys can also collect a much broader spectrum of informa-tion about the offenses than is routinely compi-led in official crime statistics and can therefore provide the public and policy makers with infor-mation that can be used to create programs to combat crime and assist its victims. In the United States, for example, National Crime Victimization Survey findings that a substantial proportion of crime against women was committed by people they knew or were related to was instrumental in informing the development of programs designed to address violence against women. When con-ducted repeatedly over time, surveys can provide a measure of whether crime is either increasing or decreasing.
Surveys also obtain information about the nature of crimes people experience and crime’s impact on peoples’ lives; how they were injured, what losses they experienced; information not available from administrative records or statistics compiled by police departments. Victimization surveys can also obtain information on citizen attitudes towards various issues related to crime and criminal justice as well as collect information on peoples’ interactions with law enforcement and the criminal justice system.
Most victimization surveys measure a set of common offenses similar to those collected in police based statistical programs; violent crimes including rape and other sexual offenses, rob-bery, and physical assault; and property offenses including household burglary, vehicle theft and theft of property. Some victimization surveys also measure other offenses such as public corrup-tion, fraud, identity theft and stalking.
The data collected through victimization surveys can serve a variety of purposes. Among them are informing the public, informing policy
VIcTIMIzaTIon suRVeys as a ResouRce foR InfoRMIng on cRIMe anD safeTy
By: Michael RandFormer Chief of Victimization Statistics
at the United States Department of Justice

Alertamerica.org: OAS Hemispheric Security Observatory :: Report on Security in the Americas
145
and studying crime’s attributes and its impact on people and society. By providing rates of victimi-zation broken down by key demographic charac-teristics, surveys provide people with measures of risk of becoming victims of crime. The rich detail of information surveys can collect can also pro-vide information of the various impacts; health, economic and emotional, that crime victimization can have upon victims and their families.
Designing effective programs to address cri-me requires the kinds of information about when and where crime occurs, offender characteristics, the circumstances surrounding crime victimiza-tion, and the impact of crime on its victims that can be collected through victimization surveys. Such information is not generally available from other criminal justice statistical programs, but is routinely collected in victimization surveys.
The data collected in victimization surveys can be archived to enable further study by re-searchers into the correlates and causes of cri-me to better understand its causes and attribu-tes. Victimization surveys have been widely used in exploring such questions as violence against women, workplace crime, the effect of lifestyle on risk of victimization.
Victimization surveys do possess limita-tions. They are costly. Crime is a relatively rare occurrence, and it is necessary to interview a relatively large number of people in order to ob-tain information about the attributes of victims and crime events sufficient to produce reliable
estimates. Victimization surveys, like all surveys, are subject to what is called “survey error”. Some of the error is related to any collection of infor-mation. People may misremember details, inter-viewers may make mistakes in recording answers and analysts may produce inaccurate analyses. Victimization surveys are particularly subject to errors associated with remembering when cri-mes occurred; research has demonstrated that people tend to remember events as occurring more recently than they actually did. This pheno-menon, called “telescoping,” can lead to overes-timating crime rates unless procedures are built into the survey to help people exclude incidents that occurred outside the survey’s reference pe-riod. Survey researchers expend a great deal of effort minimizing such error, but cannot comple-tely eliminate it.
Surveys are also susceptible to sampling error which is associated with interviewing a sub-sample of the population rather than everyone. Samples must be drawn in such as way to be representative of the population. Because the information is collected from a population sam-ple, it may vary somewhat from the estimates that would have resulted if a different samole had been used. Such error can be measured and survey researchers take care to design samples that are representative of the population and of sufficient size to derive reliable results so that the sampling error is kept small.
Victimization surveys are most capable of measuring crimes people experience for which

Alertamerica.org: El Observatorio Hemisférico de Seguridad de la OEA :: Informe Sobre Seguridad en las Américas
146
they can remember the pertinent details, and which occur with sufficient frequency that a sur-vey can reliably measure them. Offenses such as murder and kidnapping, for example, are not typically included in victimization surveys becau-se they are either too rare or because they are difficult to measure. Victimization surveys cannot measure crimes against society such as terro-rism, drug trafficking or prostitution. Victimization surveys, therefore, cannot be a measure all crime in a country but do measure an important subset; those serious offenses that potentially can have a severe impact on people’s lives.
As noted above, more than 40 nations have implemented at least one victimization survey du-ring the past decade. Of the OAS nations, the Uni-ted States, Chile and Mexico have implemented surveys that have produced annual estimates of crime and can track changes over time. In Chile, the percentage of households in which at least one member was a victim of crime during the pre-vious year, called a prevalence rate, has declined across the period 2005 to 2010 (38.3 % vs. 28.2%). In Mexico, the prevalence rate has fluctuated, but was at about the same level in 2009 as it had been in 2002 (14.0% vs. 13.7%). In the United States, whose victimization survey does not produce a prevalence rate, the number of crimes per 1,000 people ages 12 and older has declined between 2001 and 2010 (25.1 vs. 17.1). While repeated National surveys are useful in assessing changes over time within a country, care must be used in comparing the estimates across nations, becau-se variations in laws, culture, public perceptions and importantly, survey methodologies across nations contribute to differences in the estimates of victimization produced by national victimiza-tion surveys. Without understanding these diffe-rences, it is not possible to know whether the di-fferences between the prevalence rates for Chile and Mexico described above are real or are the result of some difference in the countries them-selves or the way the surveys were implemented.
In order to reduce the differences across national estimates of victimization, and to make survey estimates more comparable, the Inter-national Crime Victimization Survey (ICVS) was first instituted in 1989. The ICVS incorporates a
standard questionnaire to elicit reports of crime victimization. Surveys in industrialized countries have been conducted by telephone, while surveys in developing countries were designed to be face to face surveys with interviewers conducting in-terviews at people’s homes. The ICVS has been conducted six times since 1989, with more than 70 nations throughout the world participating in at least one iteration. Among the OAS nations, Ar-gentina, Bolivia, Brazil, Canada, Colombia, Costa Rica, Mexico, Paraguay, Peru and the United Sta-tes have all implemented the ICVS at least once since 1989. In Argentina, Brazil, Colombia and Paraguay the survey was conducted in a major city; in Canada, Costa Rica, Mexico and the Uni-ted States, the surveys were national in scope. In the 2004-2005 iteration (sweep 5), the one year prevalence rate for the 10 measured offenses (theft of a car, theft from a car, theft of a motorcy-cle or moped, theft of a bicycle, burglary, attemp-ted burglary, theft of personal property, robbery, sexual offenses, assault or threat.) for Mexico, (18.7) was about the same as the rate for Cana-da (17.2) and the United States (17.5). Among the cities surveyed, Buenos Aires had a rate that was higher than that of New York, Sao Paulo and Rio de Janeiro.
The estimates of reporting crimes to the police from the ICVS are indicative of the impor-tance of these surveys, and of victimization sur-veys in general. In every nation surveyed, only a fraction of the crimes reported to the survey were ever brought to the attention of law enforce-ment. Some crimes such as motor vehicle theft and household burglary with entry are generally more reported to police than other offenses, such as robberies, assaults and sexual offenses. The ICVS and other national surveys have shown that generally, likelihood of reporting to police is co-rrelated with satisfaction with police services. In countries in which the population believes that the police are doing a good job, higher percen-tages of offenses are reported to the police than in countries in which the population does not be-lieve the police are doing a good job. For exam-ple, in the 2004-2005 ICVS, higher percentages of victims in the United States and Canada than in Mexico were satisfied with the police response to their reporting the crime,(57%, 65%, and 28%

Alertamerica.org: OAS Hemispheric Security Observatory :: Report on Security in the Americas
147
respectively). The percentages of crimes reported to police in the three countries exhibited similar differences, (U.S. 49%, Canada 48%, and Mexico 16%.) One possible conclusion from such data is that improving police responsiveness to crime victims could help to improve victim willingness to report crime to the police, which could then con-tribute to the decrease in crime over time.
Because of their potential for informing the public about the risks and impact of crime as well as informing public policy, victimization surveys will continue to grow as a useful tool in addres-sing the problem of crime throughout the world, and within the OAS community. In May 2011 the UNODC and the Mexican Instituto Nacional de Es-tadistica y Geografia (INEGI) initiated a Center of Excellence on Government, Public Safety, Victimi-zation and Justice, whose mission is “To contribu-te, from a statistical perspective, to the improve-ment of knowledge on government, public safety, victimization and justice, through strengthening re-gional capacities for data collection, analysts, and dissemination, methodology development, and knowledge generation in order to support policy making and evaluation.” One of the specific objec-tives of the Center is to help enhance the capacity of countries in the Latin American region to im-prove the quantity and quality of data generated through crime-related surveys. One of the initial activities of the Center will be to develop training curricula for national, regional and international training courses to cover all aspects of the imple-mentation and analysis of victimization surveys.
The Center’s work is extremely important because victimization surveys have demonstra-ted, wherever they have been implemented, that they are invaluable tools that can inform nations about the extent and nature of their crime within their borders in ways that no other program has been capable of doing and can help to focus re-sources more effectively to address the problems associated with crime.
michael RandFormer Chief of Victimization Statistics at theUnited States Department of Justice
Michael Rand (b. United States of America) is the former Chief of Victimization Statistics at the Uni-ted States Department of Justice, where he over-saw the collection of crime and victimization data and was responsible for the National Crime Victimi-zation Survey in the United States. Affiliated from 1972 to 1978 to the U.S. Census Bureau and from 1978 - 2012 to the U.S. Bureau of Justice Statistics (BJS), Mr. Rand was instrumental in the re-evalua-tion and re-design of operational methodologies to ensure that they meet future needs and requi-rements for information on crime and victimiza-tion. Mr. Rand is also the author/co-author of several articles and BJS reports on the im-pact of crime and nature of victimization. Recently, he co-authored a report on victimization of people with disabilities. Through the BJS, he also provided technical assistance to foreign agencies deve-loping criminal justice statisti-cal programs.

Alertamerica.org: El Observatorio Hemisférico de Seguridad de la OEA :: Informe Sobre Seguridad en las Américas
148
COUNTRY
Lastest available year Prevalence
Antigua and Barbuda 2009 11.2%
Barbados 2009 10.8%
Brazil 2002 35.0%
Canada 2004 17.2%
Chile 2010 28.2%
Colombia 2008 15.5%
Costa Rica 2008 27.9%
Ecuador 2008 12.7%
El Salvador 2004 13.7%
Guatemala 2007 37.3%
Guyana 2009 7.8%
Jamaica 2009 5.6%
Mexico 2009 13.7%
Panama 2008 8.4%
Paraguay 2008 27.3%
Saint Lucia 2009 10.9%
Suriname 2009 9.7%
Trinidad and Tobago 2009 10.2%
United States 2010 14.9%
Uruguay 2007 44.0%
Venezuela 2006 36.4%
AMERICAS (21 countries)(*2)(*3) 2009 21.1%
Caribbean (5 countries) (*4) 2009 7.8%
Central America (4 countries) (*5) 2008 26.9%
North America (3 countries) (*6) 2010 14.8%
South America (9 countries) (*7) 2008 30.5%
Note(*1) Data obtainned from victimization surveys. (*2) Americas refers to the 21 countries included in this Table. (*3) Regional and sub‐regional data for indicated year or nearest available year. (*4) Data for the Caribbean includes: Bahamas, Barbados, Saint Lucia, and Trinidad and Tobago. (*5) Data for Central America includes: Costa Rica, El Salvador, Guatemala, and Panama. (*6) Data for North America includes: Canada, Mexico and The United States. (*7) Data for South America includes: Bolivia, Brazil, Chile, Colombia, and Peru.
9.62 VICTIMIZATION RATE, LATEST AVAILABLE YEAR (PREVALENCE)
Percentage of households in which at least one member was a victim of crime across the last calendar year/twelve months. As recorded by victimization surveys.
Sub‐regional data: (*2)
Indicator definition
Excerpt from the Hemispheric Plan of Action on Citizen Security in the Americas approved by the OAS Permanent Council on May 2, 2012.
To strengthen operational information systems to fight transnational crimes, the OAS member States will develop secure channels for operational information exchange among agencies responsible for public security, including closed virtual platforms.

Alertamerica.org: OAS Hemispheric Security Observatory :: Report on Security in the Americas
149
COUNTRY
Latest available year Prevalence
Brazil 2002 4.0%
Canada 2009 2.4%
El Salvador 2009 0.8%
Jamaica 2009 0.9%
United States 2010 0.7%
Venezuela 2006 0.1%
AMERICAS (6 countries)(*2)(*3) 2009 1.8%
Note (*1) Data obtained from victimization surveys. (*2) Americas refers to the 6 countries included in this Table.
9.63 PREVALENCE OF SEXUAL ASSAULT, LATEST AVAILABLE YEAR
Percentage of individuals grabbed, touched or assaulted for sexual purposes and in an offensive manner over the last calendar year/twelve months.
Indicator definition
2000 2001 2002 2003 2004 2005 2006 2007 2008 2009 2010 2011
Chile 43 38.3 38.4 34.8 35.3 33.6 28.2
Mexico 14 9 20.2 11 16.3 11 13.1 13.7
United States 27.9 25.1 23.1 22.6 21.4 21 20.7 19.3 17.1 14.9
0
5
10
15
20
25
30
35
40
45
50
Victi
miz
ation
Rat
e (%
)
Graph 9 Chile, México and United States: Victimization Rates, 2000-2010
Graph 13

Alertamerica.org: El Observatorio Hemisférico de Seguridad de la OEA :: Informe Sobre Seguridad en las Américas
150
0
500
1000
1500
2000
2500
3000
3500
4000
4500
Brazil (2002)
Canada (2009) Jamaica (2009)
Brazil (2002)
Canada (2009) Jamaica (2009)
Victimization Survey 4000 2400 900
Police data 16 74 48
Graph 8.
Sexual Assault: Gap between PoliceReported Data and Victimization Survey Data.
Rates per 100,000 inhabitants
Graph 14

Alertamerica.org: OAS Hemispheric Security Observatory :: Report on Security in the Americas
151
COUNTRY
Latest available year Prevalence
Brazil 2009 7.1%
Canada 2009 1.3%
Chile 2010 5.0%
Costa Rica 2008 11.1%
El Salvador 2009 7.3%
Jamaica 2009 1.6%
Mexico 2010 4.9%
United States 2010 1.9%
Venezuela 2006 3.9%
AMERICAS (9 countries)(*2)(*3) 2009 4.0%
Note
9.64 PREVALENCE OF ROBBERY, LATEST AVAILABLE YEAR
Percentage of individuals who were the victims of robbery, or attempted robbery, by way of force/cohercion over the last calendar year/twelve months
(*1) Data obtained from victimization surveys. (*2) Americas refers to the 9 countries included in this Table. (*3) Regional data for indicated year or nearest available year.
Indicator definition
COUNTRY
Latest available year Prevalence
Canada 2009 8.3%
Chile 2010 4.3%
Costa Rica 2008 7.2%
El Salvador 2009 5.4%
Jamaica 2009 4.5%
Mexico 2010 1.8%
United States 2009 25.6%
Note
Data obtained within from victimization surveys.
9.65 PREVALENCE OF BURGLARY, LATEST AVAILABLE YEAR
Percentage of burglaries reported to the Police by the victim of the offense or someone else, calculated on the basis of the last incident experienced by the victim.
Indicator definition

Alertamerica.org: El Observatorio Hemisférico de Seguridad de la OEA :: Informe Sobre Seguridad en las Américas
152
COUNTRY
Latest available year Prevalence
Canada 2009 3.40%
Chile 2010 2.40%
Costa Rica 2008 0.80%
El Salvador 2009 3.30%
Jamaica 2009 0.50%
Mexico 2010 1.26%
United States 2010 4.90%
AMERICAS (7 countries)(*2)(*3) 2009 3.79%
Note
9.66 PREVALENCE OF MOTOR THEFT, LATEST AVAILABLE YEAR
Percentage of vehicle thefts reported to the Police by the victim of the offense or someone else, calculated on the basis of the last incident experienced by the victim.
(*1) Data obtained from victimization surveys. (*2) Americas refers to the 7 countries included in this Table. (*3) Regional data for indicated year or nearest available year.
Indicator definition
COUNTRY
Latest available year Prevalence
Brazil 2002 33%
Canada 2004 53%
Chile 2010 36%
Costa Rica 2008 23%
El Salvador 2009 10%
Mexico 2009 22%
United States 2010 51%
Venezuela 2006 30%
AMERICAS (8 countries)(*2)(*3) 2010 40%
Note
9.67 POLICE REPORTING RATE, LATEST AVAILABLE YEAR
Percentage of offenses reported to the Police by the victim of the offense or someone else, calculated on the basis of the last incident experienced by the victim.
(*1) Data obtained from victimization surveys. (*2) Americas refers to the 8 countries included in this Table. (*3) Regional data for indicated year or nearest available year.
Indicator definition

Alertamerica.org: OAS Hemispheric Security Observatory :: Report on Security in the Americas
153
COUNTRY :: PAIS
Latest available year :: Ultimo año disponible
Prevalence ::Prevalencia
Brazil 2002 96%
Canada 2009 50%
Chile 2009 89%
Costa Rica 2008 71%
El Salvador 2004 62%
Mexico 2010 85%
United States 2010 83%
AMERICAS (7 countries)(*2)(*3) 2010 85%
Note
9.68 POLICE REPORTING RATE FOR MOTOR VEHICLE THEFT, LATEST AVAILABLE YEAR
Percentage of vehicle thefts reported to the Police by the victim of the offense or someone else, calculated on the basis of the last incident experienced by the victim.
(*1) Data obtained from victimization surveys. (*2) Americas refers to the 7 countries included in this Table. (*3) Regional data for indicated year or nearest available year.
Indicator definition
COUNTRY
Latest available year Prevalence
Brazil 2002 30%
Canada 2009 23%
Chile 2009 55%
Costa Rica 2008 23%
Jamaica 2009 40%
Mexico 2010 32%
United States 2010 59%
AMERICAS (7 countries)(*2)(*3) 2010 44%
Note
9.69 POLICE REPORTING RATE FOR BURGLARY, LATEST AVAILABLE YEAR
Percentage of burglaries reported to the Police by the victim of the offense or someone else, calculated on the basis of the last incident experienced by the victim.
(*1) Data obtained from victimization survey. (*2) Americas refers to the 7 countries included in this Table. (*3) Regional data for indicated year or nearest available year.
Indicator definition

Alertamerica.org: El Observatorio Hemisférico de Seguridad de la OEA :: Informe Sobre Seguridad en las Américas
154
COUNTRY
Latest available year Prevalence
Brazil 2002 29%
Canada 2009 43%
Chile 2009 45%
Costa Rica 2008 22%
Jamaica 2009 43%
Mexico 2010 22%
United States 2009 68%
Venezuela 2009 32%
AMERICAS (8 countries)(*2)(*3) 2010 47%
Note
9.70 POLICE REPORTING RATE FOR ROBBERY, LATEST AVAILABLE YEAR
Percentage of Robberies reported to the Police by the victim of the offense or someone else, calculated on the basis of the last incident experienced by the victim.
(*1) Data obtained from victimization surveys. (*2) Americas refers to the 8 countries included in this Table. (*3) Regional data for indicated year or nearest available year.
Indicator definition
COUNTRY
Latest available year Prevalence
Brazil 2002 14%
Canada 2004 8%
Jamaica 2009 66%
Venezuela 2009 64%
AMERICAS (4 countries)(*2)(*3) 2010 20%
Note
9.71 POLICE REPORTING RATE FOR SEXUAL ASSAULT, LATEST AVAILABLE YEAR
Percentage of Sexual Assaults reported to the Police by the victim of the offense or someone else, calculated on the basis of the last incident experienced by the victim.
(*1) Data obtained from victimization surveys. (*2) Americas refers to the 4 countries included in this Table. (*3) Regional data for indicated year or nearest available year.
Indicator definition

fuenTes y RefeRencIasbIblIogRÁfIcas
souRcesanD RefeRences

Alertamerica.org: El Observatorio Hemisférico de Seguridad de la OEA :: Informe Sobre Seguridad en las Américas
156
Pais Fuente
Government of Antigua y Barbuda
Her Majesty's Prisons of Antigua and Barbuda
Ministry of National Security & Labour
Office of the National Drug Council and Police (ONDCP)
The Royal Antigua and Barbuda Police Force (RABDF)
Direccion Nacional del Servicio Penitenciario Federal
Gobierno de la Ciudad de Buenos Aires
Instituto Nacional de Estadística
Ministerio de Defensa de Argentina, Registro Nacional de Armas (RENAR)
Ministerio de Justicia, Seguridad y Derechos Humanos, Sistema Nacional de Estadística sobre Ejecución de Pena
Ministerio de Justicia, Seguridad y Derechos Humanos, Sistema Nacional de Información Criminal
Ministerio de Seguridad
Policia Federal Argentina
Policia Metropolitana de Buenos Aires
Servicios Penitenciarios Provinciales
Bahamas Royal Police Force
Bahamas Department of Statistics Vital Statistics Section
Government of The Bahamas
Her Majesty's Prison Bahamas
Ministry of Health
Ministry of National Security
Crime Statistics Department
Government of Barbados
Her Majesty's Prison Barbados
Ministry of Foreign Affairs and Foreign Trade, Barbados Socio-Economic Data
Ministry of Health
Ministry of Home Affairs, Attorney General Office
Office of the Commissioner of the Police
Royal Barbados Police Force
The Office of the Attorney General of Barbados
Belize Police Department
Department of Corrections of Belize
Governement of Belize
Ministry of Police and Public Safety
Comando General de la Policia Boliviana Division Nacional de Analisis y Proyecciones - Estadistica
Gobierno del Estado Plurinacional de Bolivia
Instituto Nacional de Estadística de Bolivia, Indicadores de Seguridad Ciudadana
Ministerio de Gobierno
Ministerio de Justicia
Policía Nacional
Conselho Nacional de Justiça Cadastro Nacional de Crianças e Adolescentes em Conflito com a Lei (CNCA)
Gabinete de Segurança Institucional da Presidência da República
Instituto Brasileiro de Geografia e Estatística - IBGE
Ministério da Justiça
Ministério da Justiça Departamento de Polícia Federal
Ministério da Justiça Departamento Penitenciário Nacional Sistema Integrado de Informações Penitenciárias – InfoPen
Ministério da Justiça Secretaria Nacional de Segurança Pública (SENASP)
Ministério da Justiça Secretaria Nacional de Segurança Pública (SENASP) Unidade de Pesquisa e Análise da Informação.
Ministério da Saúde
Sistema Nacional de Armas (SINARM)
Sistema Nacional de Estatísticas em Segurança Pública e Justiça Criminal.
Canada Police Department
Canadian Center for Justice Statistics
Government of Canada
Health Canada, Canadian Alcohol and Drug Use Monitoring Survey.
Ministry of Public Safety
Ministry of Transport of Canada, Canadian Motor Vehicle Collision Statistics
Royal Canadian Mounted Police
Statistics Canada
Statistics Canada Criminal Victimization in Canada
Carabineros de Chile Sistema de Automatización Policial (AUPOL)
Gobierno de Chile, Informe de Estadísticas Delictuales
Instituto Nacional de Estadísticas (INE) Anuario de Carabineros Información anual de estadísticas policiales
Ministerio de Defensa Nacional de Chile Dirección General de Movilización Nacional (DGMN)
Ministerio de Justicia Gendarmería de Chile
Ministerio del Interior y Seguridad Pública
Ministerio del Interior y Seguridad Pública Sistema Nacional de Información Delictual
Ministerio Público (Fiscalía de Chile)
Policia de Investigaciones de Chile Departamento de Estadísticas Policiales
Departamento Administrativo Nacional de Estadística (DANE)
Departamento Nacional de Planeación
Fiscalía General de la Nación
Gobierno de Colombia
Instituto Nacional de Medicina Legal y Ciencia Forense de Colombia
Instituto Nacional Penitenciario y Carcelario de Colombia
Ministerio de Defensa Nacional
Ministerio de Defensa Nacional Dirección de Investigación Criminal e Interpol -DIJIN
Ministerio de Defensa Nacional Policia Nacional de Colombia
Ministerio de Defensa Nacional Red de Observatorios del Delito
Ministerio de Defensa Nacional Revista Criminalidad
Ministerio del Interior y de Justicia
Gobierno de Costa Rica
Instituto Nacional de Estadísticas y Censos
Ministerio de Gobernación, Policía y Seguridad Pública
Ministerio de Justicia y Paz Departamento de Investigacion y Estadistica
Ministerio de Justicia y Paz Observatorio de la Violencia y Delito
Ministerio de Relaciones Exteriores y Culto
Poder Judicial de Costa Rica
Policía de Costa Rica
Sistema Penitenciario Nacional
Commonwealth of Dominica Police Force
Government of Dominica
Ministry of National Security
Defensoría Pública Penal
Dirección Nacional de Rehabilitación Social (DNRS)
Gobierno de Ecuador
Ministerio de Gobierno
Ministerio de Coordinación de Seguridad
Ministerio de Justicia, Derechos Humanos y Cultos
Ministerio del Interior
Policía Judicial e Investigaciones de Ecuador
Policía Nacional de Ecuador
Consejo Nacional de Seguridad Pública
Corte Suprema de Justicia
Fiscalía General de la República
Instituto de Medicina Legal
Ministerio de Coordinación de Seguridad
Ministerio de Defensa Nacional
Ministerio de Gobernación
Ministerio de Justicia y Seguridad Pública
Policía Nacional Civil de El Salvador
Government of Grenada
Her Majesty's Prison, Grenada
Ministry of National Security
Royal Grenadian Police Force
Dirección General del Sistema Penitenciario de Guatemala
Instituto de Estudios Comparados en Ciencias Penales de Guatemala
Instituto Nacional de Estadísticas de Guatemala
Ministerio de Gobernación
Ministerio Público
Policía Nacional Civil de Guatemala
Criminal Investigations Department
Government of Guyana
Guyana Police Force
Guyana Prison Service
Ministry of Health
Ministry of Home Affairs
Government of Haiti
Minister of Justice and Public Security
Dirección General de Investigación Criminal Observatorio de la Violencia Honduras
Ministerio de Seguridad, Dirección General de Servicios Especiales Preventivos
Gobierno de Honduras
Polícia Nacional Preventiva de Honduras
Secretaría de Seguridad
Government of Jamaica
Jamaica Constabulary Force Police, Community Safety and Security Branch
Jamaica Constabulary Force Police, Statistics Department
Ministry of Justice, Strategic Planning Policy Research and Evaluation
Ministry of National Security, Department of Corrections
Instituto Nacional de Estadísticas y Geografía de México (INEGI)
Secretaría de la Defensa Nacional (SEDENA) de México.
Secretaría de Seguridad Pública
Secretaría de Seguridad Pública Policía Federal
Secretaria de Seguridad Publica Policía Nacional de Mexico
Secretariado Ejecutivo del Sistema Nacional de Seguridad Pública.
Sistema Nacional Penitenciario
Ministerio de Gobernación
Policía Nacional de Nicaragua
Procuraduría General de la República de Nicaragua
Sistema Penitenciario Nacional
Dirección General del Sistema Penitenciario.
Gobierno de Panamá
Ministerio de Gobierno y Justicia
Ministerio Público y Órgano Judicial
Policía Nacional de Panamá
Procuraduría General de la República de Panamá
Sistema Integrado de Estadistica Criminal (SIEC)
Dirección General de Estadística, Encuestas y Censos
Ministerio de Defensa de Paraguay, Dirección de Material Bélico (DIMABEL)
Ministerio de Justicia y Trabajo
Ministerio de Salud Publica y Bienestar Social
Ministerio del Interior
Policia Nacional de Paraguay
Dirección General de Control de Servicios de Seguridad, Control de Armas, Munición y Explosivos de Uso Civil (DICSAMEC)
Instituto Nacional Penitenciario de Perú
Ministerio del Interior
Ministerio de Justicia
Policía Nacional de Perú
Dirección Central de Inteligencia Criminal (DINTEL)
Dirección General de Prisiones
Fuerzas Armadas de República Dominicana Superintendencia de Vigilancia y Seguridad Privada
Gobierno de República Dominicana
Ministerio de Interior y Policía
Oficina Nacional de Estadística, Departamento de Estadísticas Demográficas, Sociales y Culturales
Policía Nacional de la República Dominicana
Procuraduría General de la República
Government of San Vincent and the Grenadines
Her Majesty's Prison of San Vincent and the Grenadines
Ministry of National Security Office of the Prime Minister
Saint Vincent and the Grenadines Penal Authority
The Royal San Vincent and the Grenadines Police Force
Her Majesty's Prison of St. Kitts and Nevis
Government of St. Kitts and Nevis
Ministry of National Security, Immigration and Labor
The Royal St. Christopher and Nevis Police Force
Bordelaise Correctional Facility
Government of Saint Lucia
Her Majesty's Prison of Saint Lucia
Ministry of Health Wellness, Family Affairs, Human Services, and Gender Relations
Ministry of Home Affairs and National Security
The Royal Saint Lucia Police Force
Attorney General’s Office Administration and Central Penitentiaire Inrichting
Government of Suriname
Ministry of Defense
Ministry of Health
Police Force of Suriname
Government of Trinidad and Tobago
Ministry of National Security
Strategic Services Agency
Trinidad and Tobago Police Service
U.S Census Bureau, The National Data Book The 2011 Statistical Abstract
U.S. Department of Justice, Bureau of Stastitics, National Crime Victimization Survey.
U.S. Department of Justice, Federal Bureau of Investigation
Dirección Nacional de Cárceles, Penitenciarias y Centros de Recuperación
Gobierno de Uruguay
Ministerio de Defensa de Uruguay, Registro Nacional de Armas
Ministerio del Interior
Ministerio del Interior Observatorio Nacional sobre Violencia y Criminalidad
Registro Nacional de Empresas de Seguridad (RENAEMSE)
Cuerpo de Investigaciones Cientificas, Penales y Criminalisticas (CTPJ)
Dirección General de Custodia y Rehabilitación al Recluso
Dirección Nacional los Servicios Penitenciarios
Gobierno de la República Bolivariana de Venezuela
Instituto Nacional de Estadística Victimización Delictiva y Percepción de la Policía, Comisión Nacional para la Reforma Policial
Ministerio del Poder Popular de Relaciones Interiores y Justicia
Ministerio del Poder Popular de Relaciones Interiores y Justicia Centro para la Paz
Ministerio del Poder Popular para la Planificación y el Desarrollo
Ministerio del Poder Popular para la Salud y Protección Social
Ministerio Público Informe Anual de la Fiscalía General de la República.
Antigua and Barbuda
Brazil
Grenada
Guatemala
Belize
Barbados
Bahamas
El Salvador
Argentina
Chile
México
Nicaragua
Canada
Bolivia
Colombia
Costa Rica
Dominica
Ecuador
San Vincent and the Grenadines
Honduras
Guyana
Haiti
Jamaica
Panamá
Paraguay
Perú
República Dominicana
Venezuela
Saint Kitts and Nevis
Saint Lucia
Suriname
Trinidad and Tobago
United States
Uruguay
Primary Data Sources :: Fuentes Principales de Datos
InternationalInternational Labour Organization (ILO)International Criminal Police Organization (INTERPOL)The World BankUnited Nations Children's Fund (UNICEF) United Nations Development Programme (UNDP)United Nations Educational, Scientific and Cultural Organization (UNESCO)United Nations Office on Drugs and Crime (UNODC)United Nations Population DivisionUnited Nations Survey on Crime Trends and Operations of Criminal Justice Systems (CTS)World Health Organization (WHO)
RegionalCARICOM Implementation Agency for Crime and Security (IMPACS)Eastern Caribbean Supreme CourtInstituto Latinoamericano de las Naciones Unidas para la Prevención del Delito y Tratamiento del Delincuente (ILANUD)Inter-American Development Bank (IDB)OAS CICAD Multilateral Evaluation Mechanism (MEM)OAS CICAD Inter-American Observatory on DrugOAS Inter-American Children's Institute (IIN)OAS Inter-American Commission of Women (CIM)OAS Inter-American Commission on Human Rights (IACHR) OAS Inter-American Drug Abuse Control Commission (CICAD)OAS Justice Center of the Americas (CEJA)Pan American Health Organization (PAHO)Sistema de la Integración Centroamericana (SICA)The American Police Community (AMERIPOL)UN ECLAC Latin American and Caribbean Demographic Centre (CELADE)UN Economic Commission for Latin America and the Caribbean (ECLAC)UN Latin American Institute for the Prevention of Crime and the Treatment of Offenders (ILANUD)

Alertamerica.org: OAS Hemispheric Security Observatory :: Report on Security in the Americas
157
Pais Fuente
Government of Antigua y Barbuda
Her Majesty's Prisons of Antigua and Barbuda
Ministry of National Security & Labour
Office of the National Drug Council and Police (ONDCP)
The Royal Antigua and Barbuda Police Force (RABDF)
Direccion Nacional del Servicio Penitenciario Federal
Gobierno de la Ciudad de Buenos Aires
Instituto Nacional de Estadística
Ministerio de Defensa de Argentina, Registro Nacional de Armas (RENAR)
Ministerio de Justicia, Seguridad y Derechos Humanos, Sistema Nacional de Estadística sobre Ejecución de Pena
Ministerio de Justicia, Seguridad y Derechos Humanos, Sistema Nacional de Información Criminal
Ministerio de Seguridad
Policia Federal Argentina
Policia Metropolitana de Buenos Aires
Servicios Penitenciarios Provinciales
Bahamas Royal Police Force
Bahamas Department of Statistics Vital Statistics Section
Government of The Bahamas
Her Majesty's Prison Bahamas
Ministry of Health
Ministry of National Security
Crime Statistics Department
Government of Barbados
Her Majesty's Prison Barbados
Ministry of Foreign Affairs and Foreign Trade, Barbados Socio-Economic Data
Ministry of Health
Ministry of Home Affairs, Attorney General Office
Office of the Commissioner of the Police
Royal Barbados Police Force
The Office of the Attorney General of Barbados
Belize Police Department
Department of Corrections of Belize
Governement of Belize
Ministry of Police and Public Safety
Comando General de la Policia Boliviana Division Nacional de Analisis y Proyecciones - Estadistica
Gobierno del Estado Plurinacional de Bolivia
Instituto Nacional de Estadística de Bolivia, Indicadores de Seguridad Ciudadana
Ministerio de Gobierno
Ministerio de Justicia
Policía Nacional
Conselho Nacional de Justiça Cadastro Nacional de Crianças e Adolescentes em Conflito com a Lei (CNCA)
Gabinete de Segurança Institucional da Presidência da República
Instituto Brasileiro de Geografia e Estatística - IBGE
Ministério da Justiça
Ministério da Justiça Departamento de Polícia Federal
Ministério da Justiça Departamento Penitenciário Nacional Sistema Integrado de Informações Penitenciárias – InfoPen
Ministério da Justiça Secretaria Nacional de Segurança Pública (SENASP)
Ministério da Justiça Secretaria Nacional de Segurança Pública (SENASP) Unidade de Pesquisa e Análise da Informação.
Ministério da Saúde
Sistema Nacional de Armas (SINARM)
Sistema Nacional de Estatísticas em Segurança Pública e Justiça Criminal.
Canada Police Department
Canadian Center for Justice Statistics
Government of Canada
Health Canada, Canadian Alcohol and Drug Use Monitoring Survey.
Ministry of Public Safety
Ministry of Transport of Canada, Canadian Motor Vehicle Collision Statistics
Royal Canadian Mounted Police
Statistics Canada
Statistics Canada Criminal Victimization in Canada
Carabineros de Chile Sistema de Automatización Policial (AUPOL)
Gobierno de Chile, Informe de Estadísticas Delictuales
Instituto Nacional de Estadísticas (INE) Anuario de Carabineros Información anual de estadísticas policiales
Ministerio de Defensa Nacional de Chile Dirección General de Movilización Nacional (DGMN)
Ministerio de Justicia Gendarmería de Chile
Ministerio del Interior y Seguridad Pública
Ministerio del Interior y Seguridad Pública Sistema Nacional de Información Delictual
Ministerio Público (Fiscalía de Chile)
Policia de Investigaciones de Chile Departamento de Estadísticas Policiales
Departamento Administrativo Nacional de Estadística (DANE)
Departamento Nacional de Planeación
Fiscalía General de la Nación
Gobierno de Colombia
Instituto Nacional de Medicina Legal y Ciencia Forense de Colombia
Instituto Nacional Penitenciario y Carcelario de Colombia
Ministerio de Defensa Nacional
Ministerio de Defensa Nacional Dirección de Investigación Criminal e Interpol -DIJIN
Ministerio de Defensa Nacional Policia Nacional de Colombia
Ministerio de Defensa Nacional Red de Observatorios del Delito
Ministerio de Defensa Nacional Revista Criminalidad
Ministerio del Interior y de Justicia
Gobierno de Costa Rica
Instituto Nacional de Estadísticas y Censos
Ministerio de Gobernación, Policía y Seguridad Pública
Ministerio de Justicia y Paz Departamento de Investigacion y Estadistica
Ministerio de Justicia y Paz Observatorio de la Violencia y Delito
Ministerio de Relaciones Exteriores y Culto
Poder Judicial de Costa Rica
Policía de Costa Rica
Sistema Penitenciario Nacional
Commonwealth of Dominica Police Force
Government of Dominica
Ministry of National Security
Defensoría Pública Penal
Dirección Nacional de Rehabilitación Social (DNRS)
Gobierno de Ecuador
Ministerio de Gobierno
Ministerio de Coordinación de Seguridad
Ministerio de Justicia, Derechos Humanos y Cultos
Ministerio del Interior
Policía Judicial e Investigaciones de Ecuador
Policía Nacional de Ecuador
Consejo Nacional de Seguridad Pública
Corte Suprema de Justicia
Fiscalía General de la República
Instituto de Medicina Legal
Ministerio de Coordinación de Seguridad
Ministerio de Defensa Nacional
Ministerio de Gobernación
Ministerio de Justicia y Seguridad Pública
Policía Nacional Civil de El Salvador
Government of Grenada
Her Majesty's Prison, Grenada
Ministry of National Security
Royal Grenadian Police Force
Dirección General del Sistema Penitenciario de Guatemala
Instituto de Estudios Comparados en Ciencias Penales de Guatemala
Instituto Nacional de Estadísticas de Guatemala
Ministerio de Gobernación
Ministerio Público
Policía Nacional Civil de Guatemala
Criminal Investigations Department
Government of Guyana
Guyana Police Force
Guyana Prison Service
Ministry of Health
Ministry of Home Affairs
Government of Haiti
Minister of Justice and Public Security
Dirección General de Investigación Criminal Observatorio de la Violencia Honduras
Ministerio de Seguridad, Dirección General de Servicios Especiales Preventivos
Gobierno de Honduras
Polícia Nacional Preventiva de Honduras
Secretaría de Seguridad
Government of Jamaica
Jamaica Constabulary Force Police, Community Safety and Security Branch
Jamaica Constabulary Force Police, Statistics Department
Ministry of Justice, Strategic Planning Policy Research and Evaluation
Ministry of National Security, Department of Corrections
Instituto Nacional de Estadísticas y Geografía de México (INEGI)
Secretaría de la Defensa Nacional (SEDENA) de México.
Secretaría de Seguridad Pública
Secretaría de Seguridad Pública Policía Federal
Secretaria de Seguridad Publica Policía Nacional de Mexico
Secretariado Ejecutivo del Sistema Nacional de Seguridad Pública.
Sistema Nacional Penitenciario
Ministerio de Gobernación
Policía Nacional de Nicaragua
Procuraduría General de la República de Nicaragua
Sistema Penitenciario Nacional
Dirección General del Sistema Penitenciario.
Gobierno de Panamá
Ministerio de Gobierno y Justicia
Ministerio Público y Órgano Judicial
Policía Nacional de Panamá
Procuraduría General de la República de Panamá
Sistema Integrado de Estadistica Criminal (SIEC)
Dirección General de Estadística, Encuestas y Censos
Ministerio de Defensa de Paraguay, Dirección de Material Bélico (DIMABEL)
Ministerio de Justicia y Trabajo
Ministerio de Salud Publica y Bienestar Social
Ministerio del Interior
Policia Nacional de Paraguay
Dirección General de Control de Servicios de Seguridad, Control de Armas, Munición y Explosivos de Uso Civil (DICSAMEC)
Instituto Nacional Penitenciario de Perú
Ministerio del Interior
Ministerio de Justicia
Policía Nacional de Perú
Dirección Central de Inteligencia Criminal (DINTEL)
Dirección General de Prisiones
Fuerzas Armadas de República Dominicana Superintendencia de Vigilancia y Seguridad Privada
Gobierno de República Dominicana
Ministerio de Interior y Policía
Oficina Nacional de Estadística, Departamento de Estadísticas Demográficas, Sociales y Culturales
Policía Nacional de la República Dominicana
Procuraduría General de la República
Government of San Vincent and the Grenadines
Her Majesty's Prison of San Vincent and the Grenadines
Ministry of National Security Office of the Prime Minister
Saint Vincent and the Grenadines Penal Authority
The Royal San Vincent and the Grenadines Police Force
Her Majesty's Prison of St. Kitts and Nevis
Government of St. Kitts and Nevis
Ministry of National Security, Immigration and Labor
The Royal St. Christopher and Nevis Police Force
Bordelaise Correctional Facility
Government of Saint Lucia
Her Majesty's Prison of Saint Lucia
Ministry of Health Wellness, Family Affairs, Human Services, and Gender Relations
Ministry of Home Affairs and National Security
The Royal Saint Lucia Police Force
Attorney General’s Office Administration and Central Penitentiaire Inrichting
Government of Suriname
Ministry of Defense
Ministry of Health
Police Force of Suriname
Government of Trinidad and Tobago
Ministry of National Security
Strategic Services Agency
Trinidad and Tobago Police Service
U.S Census Bureau, The National Data Book The 2011 Statistical Abstract
U.S. Department of Justice, Bureau of Stastitics, National Crime Victimization Survey.
U.S. Department of Justice, Federal Bureau of Investigation
Dirección Nacional de Cárceles, Penitenciarias y Centros de Recuperación
Gobierno de Uruguay
Ministerio de Defensa de Uruguay, Registro Nacional de Armas
Ministerio del Interior
Ministerio del Interior Observatorio Nacional sobre Violencia y Criminalidad
Registro Nacional de Empresas de Seguridad (RENAEMSE)
Cuerpo de Investigaciones Cientificas, Penales y Criminalisticas (CTPJ)
Dirección General de Custodia y Rehabilitación al Recluso
Dirección Nacional los Servicios Penitenciarios
Gobierno de la República Bolivariana de Venezuela
Instituto Nacional de Estadística Victimización Delictiva y Percepción de la Policía, Comisión Nacional para la Reforma Policial
Ministerio del Poder Popular de Relaciones Interiores y Justicia
Ministerio del Poder Popular de Relaciones Interiores y Justicia Centro para la Paz
Ministerio del Poder Popular para la Planificación y el Desarrollo
Ministerio del Poder Popular para la Salud y Protección Social
Ministerio Público Informe Anual de la Fiscalía General de la República.
Antigua and Barbuda
Brazil
Grenada
Guatemala
Belize
Barbados
Bahamas
El Salvador
Argentina
Chile
México
Nicaragua
Canada
Bolivia
Colombia
Costa Rica
Dominica
Ecuador
San Vincent and the Grenadines
Honduras
Guyana
Haiti
Jamaica
Panamá
Paraguay
Perú
República Dominicana
Venezuela
Saint Kitts and Nevis
Saint Lucia
Suriname
Trinidad and Tobago
United States
Uruguay

Alertamerica.org: El Observatorio Hemisférico de Seguridad de la OEA :: Informe Sobre Seguridad en las Américas
158
Pais Fuente
Government of Antigua y Barbuda
Her Majesty's Prisons of Antigua and Barbuda
Ministry of National Security & Labour
Office of the National Drug Council and Police (ONDCP)
The Royal Antigua and Barbuda Police Force (RABDF)
Direccion Nacional del Servicio Penitenciario Federal
Gobierno de la Ciudad de Buenos Aires
Instituto Nacional de Estadística
Ministerio de Defensa de Argentina, Registro Nacional de Armas (RENAR)
Ministerio de Justicia, Seguridad y Derechos Humanos, Sistema Nacional de Estadística sobre Ejecución de Pena
Ministerio de Justicia, Seguridad y Derechos Humanos, Sistema Nacional de Información Criminal
Ministerio de Seguridad
Policia Federal Argentina
Policia Metropolitana de Buenos Aires
Servicios Penitenciarios Provinciales
Bahamas Royal Police Force
Bahamas Department of Statistics Vital Statistics Section
Government of The Bahamas
Her Majesty's Prison Bahamas
Ministry of Health
Ministry of National Security
Crime Statistics Department
Government of Barbados
Her Majesty's Prison Barbados
Ministry of Foreign Affairs and Foreign Trade, Barbados Socio-Economic Data
Ministry of Health
Ministry of Home Affairs, Attorney General Office
Office of the Commissioner of the Police
Royal Barbados Police Force
The Office of the Attorney General of Barbados
Belize Police Department
Department of Corrections of Belize
Governement of Belize
Ministry of Police and Public Safety
Comando General de la Policia Boliviana Division Nacional de Analisis y Proyecciones - Estadistica
Gobierno del Estado Plurinacional de Bolivia
Instituto Nacional de Estadística de Bolivia, Indicadores de Seguridad Ciudadana
Ministerio de Gobierno
Ministerio de Justicia
Policía Nacional
Conselho Nacional de Justiça Cadastro Nacional de Crianças e Adolescentes em Conflito com a Lei (CNCA)
Gabinete de Segurança Institucional da Presidência da República
Instituto Brasileiro de Geografia e Estatística - IBGE
Ministério da Justiça
Ministério da Justiça Departamento de Polícia Federal
Ministério da Justiça Departamento Penitenciário Nacional Sistema Integrado de Informações Penitenciárias – InfoPen
Ministério da Justiça Secretaria Nacional de Segurança Pública (SENASP)
Ministério da Justiça Secretaria Nacional de Segurança Pública (SENASP) Unidade de Pesquisa e Análise da Informação.
Ministério da Saúde
Sistema Nacional de Armas (SINARM)
Sistema Nacional de Estatísticas em Segurança Pública e Justiça Criminal.
Canada Police Department
Canadian Center for Justice Statistics
Government of Canada
Health Canada, Canadian Alcohol and Drug Use Monitoring Survey.
Ministry of Public Safety
Ministry of Transport of Canada, Canadian Motor Vehicle Collision Statistics
Royal Canadian Mounted Police
Statistics Canada
Statistics Canada Criminal Victimization in Canada
Carabineros de Chile Sistema de Automatización Policial (AUPOL)
Gobierno de Chile, Informe de Estadísticas Delictuales
Instituto Nacional de Estadísticas (INE) Anuario de Carabineros Información anual de estadísticas policiales
Ministerio de Defensa Nacional de Chile Dirección General de Movilización Nacional (DGMN)
Ministerio de Justicia Gendarmería de Chile
Ministerio del Interior y Seguridad Pública
Ministerio del Interior y Seguridad Pública Sistema Nacional de Información Delictual
Ministerio Público (Fiscalía de Chile)
Policia de Investigaciones de Chile Departamento de Estadísticas Policiales
Departamento Administrativo Nacional de Estadística (DANE)
Departamento Nacional de Planeación
Fiscalía General de la Nación
Gobierno de Colombia
Instituto Nacional de Medicina Legal y Ciencia Forense de Colombia
Instituto Nacional Penitenciario y Carcelario de Colombia
Ministerio de Defensa Nacional
Ministerio de Defensa Nacional Dirección de Investigación Criminal e Interpol -DIJIN
Ministerio de Defensa Nacional Policia Nacional de Colombia
Ministerio de Defensa Nacional Red de Observatorios del Delito
Ministerio de Defensa Nacional Revista Criminalidad
Ministerio del Interior y de Justicia
Gobierno de Costa Rica
Instituto Nacional de Estadísticas y Censos
Ministerio de Gobernación, Policía y Seguridad Pública
Ministerio de Justicia y Paz Departamento de Investigacion y Estadistica
Ministerio de Justicia y Paz Observatorio de la Violencia y Delito
Ministerio de Relaciones Exteriores y Culto
Poder Judicial de Costa Rica
Policía de Costa Rica
Sistema Penitenciario Nacional
Commonwealth of Dominica Police Force
Government of Dominica
Ministry of National Security
Defensoría Pública Penal
Dirección Nacional de Rehabilitación Social (DNRS)
Gobierno de Ecuador
Ministerio de Gobierno
Ministerio de Coordinación de Seguridad
Ministerio de Justicia, Derechos Humanos y Cultos
Ministerio del Interior
Policía Judicial e Investigaciones de Ecuador
Policía Nacional de Ecuador
Consejo Nacional de Seguridad Pública
Corte Suprema de Justicia
Fiscalía General de la República
Instituto de Medicina Legal
Ministerio de Coordinación de Seguridad
Ministerio de Defensa Nacional
Ministerio de Gobernación
Ministerio de Justicia y Seguridad Pública
Policía Nacional Civil de El Salvador
Government of Grenada
Her Majesty's Prison, Grenada
Ministry of National Security
Royal Grenadian Police Force
Dirección General del Sistema Penitenciario de Guatemala
Instituto de Estudios Comparados en Ciencias Penales de Guatemala
Instituto Nacional de Estadísticas de Guatemala
Ministerio de Gobernación
Ministerio Público
Policía Nacional Civil de Guatemala
Criminal Investigations Department
Government of Guyana
Guyana Police Force
Guyana Prison Service
Ministry of Health
Ministry of Home Affairs
Government of Haiti
Minister of Justice and Public Security
Dirección General de Investigación Criminal Observatorio de la Violencia Honduras
Ministerio de Seguridad, Dirección General de Servicios Especiales Preventivos
Gobierno de Honduras
Polícia Nacional Preventiva de Honduras
Secretaría de Seguridad
Government of Jamaica
Jamaica Constabulary Force Police, Community Safety and Security Branch
Jamaica Constabulary Force Police, Statistics Department
Ministry of Justice, Strategic Planning Policy Research and Evaluation
Ministry of National Security, Department of Corrections
Instituto Nacional de Estadísticas y Geografía de México (INEGI)
Secretaría de la Defensa Nacional (SEDENA) de México.
Secretaría de Seguridad Pública
Secretaría de Seguridad Pública Policía Federal
Secretaria de Seguridad Publica Policía Nacional de Mexico
Secretariado Ejecutivo del Sistema Nacional de Seguridad Pública.
Sistema Nacional Penitenciario
Ministerio de Gobernación
Policía Nacional de Nicaragua
Procuraduría General de la República de Nicaragua
Sistema Penitenciario Nacional
Dirección General del Sistema Penitenciario.
Gobierno de Panamá
Ministerio de Gobierno y Justicia
Ministerio Público y Órgano Judicial
Policía Nacional de Panamá
Procuraduría General de la República de Panamá
Sistema Integrado de Estadistica Criminal (SIEC)
Dirección General de Estadística, Encuestas y Censos
Ministerio de Defensa de Paraguay, Dirección de Material Bélico (DIMABEL)
Ministerio de Justicia y Trabajo
Ministerio de Salud Publica y Bienestar Social
Ministerio del Interior
Policia Nacional de Paraguay
Dirección General de Control de Servicios de Seguridad, Control de Armas, Munición y Explosivos de Uso Civil (DICSAMEC)
Instituto Nacional Penitenciario de Perú
Ministerio del Interior
Ministerio de Justicia
Policía Nacional de Perú
Dirección Central de Inteligencia Criminal (DINTEL)
Dirección General de Prisiones
Fuerzas Armadas de República Dominicana Superintendencia de Vigilancia y Seguridad Privada
Gobierno de República Dominicana
Ministerio de Interior y Policía
Oficina Nacional de Estadística, Departamento de Estadísticas Demográficas, Sociales y Culturales
Policía Nacional de la República Dominicana
Procuraduría General de la República
Government of San Vincent and the Grenadines
Her Majesty's Prison of San Vincent and the Grenadines
Ministry of National Security Office of the Prime Minister
Saint Vincent and the Grenadines Penal Authority
The Royal San Vincent and the Grenadines Police Force
Her Majesty's Prison of St. Kitts and Nevis
Government of St. Kitts and Nevis
Ministry of National Security, Immigration and Labor
The Royal St. Christopher and Nevis Police Force
Bordelaise Correctional Facility
Government of Saint Lucia
Her Majesty's Prison of Saint Lucia
Ministry of Health Wellness, Family Affairs, Human Services, and Gender Relations
Ministry of Home Affairs and National Security
The Royal Saint Lucia Police Force
Attorney General’s Office Administration and Central Penitentiaire Inrichting
Government of Suriname
Ministry of Defense
Ministry of Health
Police Force of Suriname
Government of Trinidad and Tobago
Ministry of National Security
Strategic Services Agency
Trinidad and Tobago Police Service
U.S Census Bureau, The National Data Book The 2011 Statistical Abstract
U.S. Department of Justice, Bureau of Stastitics, National Crime Victimization Survey.
U.S. Department of Justice, Federal Bureau of Investigation
Dirección Nacional de Cárceles, Penitenciarias y Centros de Recuperación
Gobierno de Uruguay
Ministerio de Defensa de Uruguay, Registro Nacional de Armas
Ministerio del Interior
Ministerio del Interior Observatorio Nacional sobre Violencia y Criminalidad
Registro Nacional de Empresas de Seguridad (RENAEMSE)
Cuerpo de Investigaciones Cientificas, Penales y Criminalisticas (CTPJ)
Dirección General de Custodia y Rehabilitación al Recluso
Dirección Nacional los Servicios Penitenciarios
Gobierno de la República Bolivariana de Venezuela
Instituto Nacional de Estadística Victimización Delictiva y Percepción de la Policía, Comisión Nacional para la Reforma Policial
Ministerio del Poder Popular de Relaciones Interiores y Justicia
Ministerio del Poder Popular de Relaciones Interiores y Justicia Centro para la Paz
Ministerio del Poder Popular para la Planificación y el Desarrollo
Ministerio del Poder Popular para la Salud y Protección Social
Ministerio Público Informe Anual de la Fiscalía General de la República.
Antigua and Barbuda
Brazil
Grenada
Guatemala
Belize
Barbados
Bahamas
El Salvador
Argentina
Chile
México
Nicaragua
Canada
Bolivia
Colombia
Costa Rica
Dominica
Ecuador
San Vincent and the Grenadines
Honduras
Guyana
Haiti
Jamaica
Panamá
Paraguay
Perú
República Dominicana
Venezuela
Saint Kitts and Nevis
Saint Lucia
Suriname
Trinidad and Tobago
United States
Uruguay

Alertamerica.org: OAS Hemispheric Security Observatory :: Report on Security in the Americas
159
Pais Fuente
Government of Antigua y Barbuda
Her Majesty's Prisons of Antigua and Barbuda
Ministry of National Security & Labour
Office of the National Drug Council and Police (ONDCP)
The Royal Antigua and Barbuda Police Force (RABDF)
Direccion Nacional del Servicio Penitenciario Federal
Gobierno de la Ciudad de Buenos Aires
Instituto Nacional de Estadística
Ministerio de Defensa de Argentina, Registro Nacional de Armas (RENAR)
Ministerio de Justicia, Seguridad y Derechos Humanos, Sistema Nacional de Estadística sobre Ejecución de Pena
Ministerio de Justicia, Seguridad y Derechos Humanos, Sistema Nacional de Información Criminal
Ministerio de Seguridad
Policia Federal Argentina
Policia Metropolitana de Buenos Aires
Servicios Penitenciarios Provinciales
Bahamas Royal Police Force
Bahamas Department of Statistics Vital Statistics Section
Government of The Bahamas
Her Majesty's Prison Bahamas
Ministry of Health
Ministry of National Security
Crime Statistics Department
Government of Barbados
Her Majesty's Prison Barbados
Ministry of Foreign Affairs and Foreign Trade, Barbados Socio-Economic Data
Ministry of Health
Ministry of Home Affairs, Attorney General Office
Office of the Commissioner of the Police
Royal Barbados Police Force
The Office of the Attorney General of Barbados
Belize Police Department
Department of Corrections of Belize
Governement of Belize
Ministry of Police and Public Safety
Comando General de la Policia Boliviana Division Nacional de Analisis y Proyecciones - Estadistica
Gobierno del Estado Plurinacional de Bolivia
Instituto Nacional de Estadística de Bolivia, Indicadores de Seguridad Ciudadana
Ministerio de Gobierno
Ministerio de Justicia
Policía Nacional
Conselho Nacional de Justiça Cadastro Nacional de Crianças e Adolescentes em Conflito com a Lei (CNCA)
Gabinete de Segurança Institucional da Presidência da República
Instituto Brasileiro de Geografia e Estatística - IBGE
Ministério da Justiça
Ministério da Justiça Departamento de Polícia Federal
Ministério da Justiça Departamento Penitenciário Nacional Sistema Integrado de Informações Penitenciárias – InfoPen
Ministério da Justiça Secretaria Nacional de Segurança Pública (SENASP)
Ministério da Justiça Secretaria Nacional de Segurança Pública (SENASP) Unidade de Pesquisa e Análise da Informação.
Ministério da Saúde
Sistema Nacional de Armas (SINARM)
Sistema Nacional de Estatísticas em Segurança Pública e Justiça Criminal.
Canada Police Department
Canadian Center for Justice Statistics
Government of Canada
Health Canada, Canadian Alcohol and Drug Use Monitoring Survey.
Ministry of Public Safety
Ministry of Transport of Canada, Canadian Motor Vehicle Collision Statistics
Royal Canadian Mounted Police
Statistics Canada
Statistics Canada Criminal Victimization in Canada
Carabineros de Chile Sistema de Automatización Policial (AUPOL)
Gobierno de Chile, Informe de Estadísticas Delictuales
Instituto Nacional de Estadísticas (INE) Anuario de Carabineros Información anual de estadísticas policiales
Ministerio de Defensa Nacional de Chile Dirección General de Movilización Nacional (DGMN)
Ministerio de Justicia Gendarmería de Chile
Ministerio del Interior y Seguridad Pública
Ministerio del Interior y Seguridad Pública Sistema Nacional de Información Delictual
Ministerio Público (Fiscalía de Chile)
Policia de Investigaciones de Chile Departamento de Estadísticas Policiales
Departamento Administrativo Nacional de Estadística (DANE)
Departamento Nacional de Planeación
Fiscalía General de la Nación
Gobierno de Colombia
Instituto Nacional de Medicina Legal y Ciencia Forense de Colombia
Instituto Nacional Penitenciario y Carcelario de Colombia
Ministerio de Defensa Nacional
Ministerio de Defensa Nacional Dirección de Investigación Criminal e Interpol -DIJIN
Ministerio de Defensa Nacional Policia Nacional de Colombia
Ministerio de Defensa Nacional Red de Observatorios del Delito
Ministerio de Defensa Nacional Revista Criminalidad
Ministerio del Interior y de Justicia
Gobierno de Costa Rica
Instituto Nacional de Estadísticas y Censos
Ministerio de Gobernación, Policía y Seguridad Pública
Ministerio de Justicia y Paz Departamento de Investigacion y Estadistica
Ministerio de Justicia y Paz Observatorio de la Violencia y Delito
Ministerio de Relaciones Exteriores y Culto
Poder Judicial de Costa Rica
Policía de Costa Rica
Sistema Penitenciario Nacional
Commonwealth of Dominica Police Force
Government of Dominica
Ministry of National Security
Defensoría Pública Penal
Dirección Nacional de Rehabilitación Social (DNRS)
Gobierno de Ecuador
Ministerio de Gobierno
Ministerio de Coordinación de Seguridad
Ministerio de Justicia, Derechos Humanos y Cultos
Ministerio del Interior
Policía Judicial e Investigaciones de Ecuador
Policía Nacional de Ecuador
Consejo Nacional de Seguridad Pública
Corte Suprema de Justicia
Fiscalía General de la República
Instituto de Medicina Legal
Ministerio de Coordinación de Seguridad
Ministerio de Defensa Nacional
Ministerio de Gobernación
Ministerio de Justicia y Seguridad Pública
Policía Nacional Civil de El Salvador
Government of Grenada
Her Majesty's Prison, Grenada
Ministry of National Security
Royal Grenadian Police Force
Dirección General del Sistema Penitenciario de Guatemala
Instituto de Estudios Comparados en Ciencias Penales de Guatemala
Instituto Nacional de Estadísticas de Guatemala
Ministerio de Gobernación
Ministerio Público
Policía Nacional Civil de Guatemala
Criminal Investigations Department
Government of Guyana
Guyana Police Force
Guyana Prison Service
Ministry of Health
Ministry of Home Affairs
Government of Haiti
Minister of Justice and Public Security
Dirección General de Investigación Criminal Observatorio de la Violencia Honduras
Ministerio de Seguridad, Dirección General de Servicios Especiales Preventivos
Gobierno de Honduras
Polícia Nacional Preventiva de Honduras
Secretaría de Seguridad
Government of Jamaica
Jamaica Constabulary Force Police, Community Safety and Security Branch
Jamaica Constabulary Force Police, Statistics Department
Ministry of Justice, Strategic Planning Policy Research and Evaluation
Ministry of National Security, Department of Corrections
Instituto Nacional de Estadísticas y Geografía de México (INEGI)
Secretaría de la Defensa Nacional (SEDENA) de México.
Secretaría de Seguridad Pública
Secretaría de Seguridad Pública Policía Federal
Secretaria de Seguridad Publica Policía Nacional de Mexico
Secretariado Ejecutivo del Sistema Nacional de Seguridad Pública.
Sistema Nacional Penitenciario
Ministerio de Gobernación
Policía Nacional de Nicaragua
Procuraduría General de la República de Nicaragua
Sistema Penitenciario Nacional
Dirección General del Sistema Penitenciario.
Gobierno de Panamá
Ministerio de Gobierno y Justicia
Ministerio Público y Órgano Judicial
Policía Nacional de Panamá
Procuraduría General de la República de Panamá
Sistema Integrado de Estadistica Criminal (SIEC)
Dirección General de Estadística, Encuestas y Censos
Ministerio de Defensa de Paraguay, Dirección de Material Bélico (DIMABEL)
Ministerio de Justicia y Trabajo
Ministerio de Salud Publica y Bienestar Social
Ministerio del Interior
Policia Nacional de Paraguay
Dirección General de Control de Servicios de Seguridad, Control de Armas, Munición y Explosivos de Uso Civil (DICSAMEC)
Instituto Nacional Penitenciario de Perú
Ministerio del Interior
Ministerio de Justicia
Policía Nacional de Perú
Dirección Central de Inteligencia Criminal (DINTEL)
Dirección General de Prisiones
Fuerzas Armadas de República Dominicana Superintendencia de Vigilancia y Seguridad Privada
Gobierno de República Dominicana
Ministerio de Interior y Policía
Oficina Nacional de Estadística, Departamento de Estadísticas Demográficas, Sociales y Culturales
Policía Nacional de la República Dominicana
Procuraduría General de la República
Government of San Vincent and the Grenadines
Her Majesty's Prison of San Vincent and the Grenadines
Ministry of National Security Office of the Prime Minister
Saint Vincent and the Grenadines Penal Authority
The Royal San Vincent and the Grenadines Police Force
Her Majesty's Prison of St. Kitts and Nevis
Government of St. Kitts and Nevis
Ministry of National Security, Immigration and Labor
The Royal St. Christopher and Nevis Police Force
Bordelaise Correctional Facility
Government of Saint Lucia
Her Majesty's Prison of Saint Lucia
Ministry of Health Wellness, Family Affairs, Human Services, and Gender Relations
Ministry of Home Affairs and National Security
The Royal Saint Lucia Police Force
Attorney General’s Office Administration and Central Penitentiaire Inrichting
Government of Suriname
Ministry of Defense
Ministry of Health
Police Force of Suriname
Government of Trinidad and Tobago
Ministry of National Security
Strategic Services Agency
Trinidad and Tobago Police Service
U.S Census Bureau, The National Data Book The 2011 Statistical Abstract
U.S. Department of Justice, Bureau of Stastitics, National Crime Victimization Survey.
U.S. Department of Justice, Federal Bureau of Investigation
Dirección Nacional de Cárceles, Penitenciarias y Centros de Recuperación
Gobierno de Uruguay
Ministerio de Defensa de Uruguay, Registro Nacional de Armas
Ministerio del Interior
Ministerio del Interior Observatorio Nacional sobre Violencia y Criminalidad
Registro Nacional de Empresas de Seguridad (RENAEMSE)
Cuerpo de Investigaciones Cientificas, Penales y Criminalisticas (CTPJ)
Dirección General de Custodia y Rehabilitación al Recluso
Dirección Nacional los Servicios Penitenciarios
Gobierno de la República Bolivariana de Venezuela
Instituto Nacional de Estadística Victimización Delictiva y Percepción de la Policía, Comisión Nacional para la Reforma Policial
Ministerio del Poder Popular de Relaciones Interiores y Justicia
Ministerio del Poder Popular de Relaciones Interiores y Justicia Centro para la Paz
Ministerio del Poder Popular para la Planificación y el Desarrollo
Ministerio del Poder Popular para la Salud y Protección Social
Ministerio Público Informe Anual de la Fiscalía General de la República.
Antigua and Barbuda
Brazil
Grenada
Guatemala
Belize
Barbados
Bahamas
El Salvador
Argentina
Chile
México
Nicaragua
Canada
Bolivia
Colombia
Costa Rica
Dominica
Ecuador
San Vincent and the Grenadines
Honduras
Guyana
Haiti
Jamaica
Panamá
Paraguay
Perú
República Dominicana
Venezuela
Saint Kitts and Nevis
Saint Lucia
Suriname
Trinidad and Tobago
United States
Uruguay

Alertamerica.org: El Observatorio Hemisférico de Seguridad de la OEA :: Informe Sobre Seguridad en las Américas
160
Primary Data Sources :: Fuentes Principales de Datos
InternationalInternational Labour Organization (ILO)International Criminal Police Organization (INTERPOL)The World BankUnited Nations Children's Fund (UNICEF) United Nations Development Programme (UNDP)United Nations Educational, Scientific and Cultural Organization (UNESCO)United Nations Office on Drugs and Crime (UNODC)United Nations Population DivisionUnited Nations Survey on Crime Trends and Operations of Criminal Justice Systems (CTS)World Health Organization (WHO)
RegionalCARICOM Implementation Agency for Crime and Security (IMPACS)Eastern Caribbean Supreme CourtInstituto Latinoamericano de las Naciones Unidas para la Prevención del Delito y Tratamiento del Delincuente (ILANUD)Inter-American Development Bank (IDB)OAS CICAD Multilateral Evaluation Mechanism (MEM)OAS CICAD Inter-American Observatory on DrugOAS Inter-American Children's Institute (IIN)OAS Inter-American Commission of Women (CIM)OAS Inter-American Commission on Human Rights (IACHR) OAS Inter-American Drug Abuse Control Commission (CICAD)OAS Justice Center of the Americas (CEJA)Pan American Health Organization (PAHO)Sistema de la Integración Centroamericana (SICA)The American Police Community (AMERIPOL)UN ECLAC Latin American and Caribbean Demographic Centre (CELADE)UN Economic Commission for Latin America and the Caribbean (ECLAC)UN Latin American Institute for the Prevention of Crime and the Treatment of Offenders (ILANUD)

Alertamerica.org: OAS Hemispheric Security Observatory :: Report on Security in the Americas
161
The Secretariat for Multidimensional Security (SMS) promotes cooperation between OAS Member States, as well as with Inter-American and international organizations, as well as between entities such as the United Nations and its subsidiaries, in order to analyze, prevent, confront and respond to security threats.
In 2005, as a direct response to the 2003 Declaration on Security in the Americas, adopted in Mexico City, Secretary General José Miguel Insulza created the Secretariat. This move established the multidimensional concept of security, implying that its main purpose is the safeguard of human beings.
The Secretariat is composed of three main directorates – the Department of Public Security (DPS); the Executive Secretariat of the Inter-American Drug Abuse Control Commission (CICAD); and the Executive Secretariat of the Inter-American Committee against Terrorism (CICTE). Accordin-gly, the Secretariat focuses on the following six distinct aspects:
1. Laws;2. Compliance with laws;3. The prevention of delinquent activities and drug consumption;4. victims assistance;5. Rehabilitation of criminal offenders;6. The promotion of peace and security in the Hemisphere.
The Secretariat of Multidimensional Security offers solutions founded upon the model of “Smart Security”. This model requires the integration, in every one of its actions, of objective iden-tification based on reliable evidence pertaining to the issues being addressed; the development of proposals based on the national or regional necessities and capacities; and a multidimensional focus which ensures a systematic response to problems.
abouT THe secReTaRIaT foR MulTIDIMensIonal
secuRITy

Alertamerica.org: El Observatorio Hemisférico de Seguridad de la OEA :: Informe Sobre Seguridad en las Américas
162
The Organization of American States is the world’s oldest regional organization, dating back to the First International Conference of American States, held in Washington, D.C., from October 1889 to April 1890. That meeting approved the establishment of the International Union of Ame-rican Republics, and the stage was set for the weaving of a web of provisions and institutions that came to be known as the inter-American system, the oldest international institutional system.
The OAS came into being in 1948 with the signing in Bogotá, Colombia, of the Charter of the OAS, which entered into force in December 1951. It was subsequently amended by the Protocol of Buenos Aires, signed in 1967, which entered into force in February 1970; by the Protocol of Car-tagena de Indias, signed in 1985, which entered into force in November 1988; by the Protocol of Managua, signed in 1993, which entered into force in January 1996; and by the Protocol of Wash-ington, signed in 1992, which entered into force in September 1997.
The Organization was established in order to achieve among its member states—as stipulated in Article 1 of the Charter—”an order of peace and justice, to promote their solidarity, to strengthen their collaboration, and to defend their sovereignty, their territorial integrity, and their independence.”
Today, the OAS brings together all 35 independent states of the Americas and constitutes the main political, juridical, and social governmental forum in the Hemisphere. In addition, it has gran-ted permanent observer status to 67 states, as well as to the European Union (EU).
The Organization uses a four-pronged approach to effectively implement its essential purpo-ses, based on its main pillars: democracy, human rights, security, and development.
abouT THe oRganIzaTIon of aMeRIcan sTaTes

Comments on the Report on Citizen Security in the Americas 2012 are welcome and can be sent to:
Organization of American StatesSecretariat for multidimensional Security
Alertamerica.org 1889 F Street N.W., Washington, D.C.
United States of AmericaE-mail: [email protected]
Comentarios y sugerencias al Informe sobre Seguridad Ciudadana en las Américas 2012 son
bienvenidos y deben ser enviados a:
Organización de los Estados AmericanosSecretaría de Seguridad multidimensional
Alertamerica.org1889 F Street N.W., Washington, D.C.
Estados Unidos de AméricaCorreo electrónico: [email protected]

Secretariat for Multidimensional Security • Secretaría de Seguridad Multidimensional © Copyright 2012 OEA
with funding by / con recursos de
The Government of Canada through its Anti-Crime Capacity Building Program (ACCBP)
El Gobierno de España a través Ministeriode Asuntos Exteriores y de Cooperación