‘Leather Products’ - State Bank of Pakistan Booklets/Leather Products.pdf · The leather goods...
48
‘Leather Products’
Transcript of ‘Leather Products’ - State Bank of Pakistan Booklets/Leather Products.pdf · The leather goods...

‘Leather Products’
Research Report on ‘Leather Products’ Segment
i
Copyright Protection
The material in this work is copyrighted. Copying and/or transmitting portions or all of this
work without permission may be a violation of applicable law. State Bank of Pakistan
encourages dissemination of its work and will normally grant permission to reproduce
portions of the work promptly and when the report is reproduced for educational and non-
commercial purposes, without a fee, subject to such attributions and notices as we may
reasonably require.
State Bank of Pakistan does not guarantee the accuracy, reliability or completeness of
the content included in this work, or for the conclusions or judgments described herein,
and accepts no responsibility or liability for any omissions or errors (including, without
limitation, typographical errors and technical errors) in the content whatsoever or for
reliance thereon.
The contents of this work are intended for general informational purposes only and are
not intended to constitute legal, securities, or investment advice, an opinion regarding the
appropriateness of any investment, or a solicitation of any type.
All other queries on rights and licenses, including subsidiary rights, should be addressed
to the given below address:
Address
Infrastructure, Housing & SME Finance Department,
State Bank of Pakistan
I.I. Chundrigar Road,
Karachi
Ph: 021-32455501, 021-111 -727- 111
FAX: 021-99221139,

Research Report on ‘Leather Products’ Segment
ii
Acknowledgement
This segment booklet has been developed by M/s Corporate Partners (CDP) who was
commissioned by State Bank of Pakistan (SBP) to conduct the market research.
SBP‟s Infrastructure, Housing and SME Finance Department provided critical facilitation
and oversight for this initiative. State Bank of Pakistan is the Central Bank of the country.
Like a Central Bank in any developing country, State Bank of Pakistan performs both the
traditional and developmental functions to achieve macro-economic goals. This role
covers not only the development of important components of monetary and capital
markets but also to assist the process of economic growth and promote the fuller
utilization of the country‟s resources. The role of DFID, UK is also acknowledged here as
the cost of the research study was funded by this organization under the Financial
Inclusion Program.
This report contains market research and proposed banking products, based on primary
research survey results and secondary sources, carried out for SME segment “Leather
Products” by Corporate Development Partners (CDP).
The purpose of this research report is to provide segment specific credible information for
the commercial banks to facilitate them in designing and delivery of banking services to
small and medium enterprises (SMEs) in a responsible, profitable and sustainable
manner.
Research Report on ‘Leather Products’ Segment
Table of Content
i
1 Table of Contents
1 Guidelines for using this Research Report ............................................................................. 1
1.1 Market Assessment ...................................................................................................... 1
1.2 Product Suite ................................................................................................................ 1
1.3 Marketing and Distribution ........................................................................................... 1
2 Introduction & Objectives ....................................................................................................... 2
2.1 Limitation of the Study ................................................................................................. 3
2.2 Sampling Plan ............................................................................................................... 4
3 Economic Overview ............................................................................................................... 8
4 Leather Products Industry Overview .................................................................................... 10
4.1 Demand ....................................................................................................................... 11
4.2 Supply .......................................................................................................................... 11
4.3 Key Players ................................................................................................................. 13
4.4 Trade Bodies ............................................................................................................... 13
4.5 Recent Developments ................................................................................................ 13
4.6 Future Developments ................................................................................................. 13
4.7 Leather Product Making Process .............................................................................. 13
4.8 Success and Survival of the Businesses in this Sector ........................................... 15
5 Market Assessment ............................................................................................................. 16
5.1 Market & Demographic Profile ................................................................................... 16
5.1.1 Market Sizing and Lending Potential .................................................................. 17
5.1.2 Segment Demographics ...................................................................................... 18
5.2 Owners Profile ............................................................................................................ 19
5.3 Business Linkages ..................................................................................................... 20
5.4 Business Cycle ........................................................................................................... 22
5.4.1 Working Capital ................................................................................................... 23
5.5 Financial Assessment and Profile ............................................................................. 24
5.6 Financial Information .................................................................................................. 25
5.7 Indicative Business Requirements ............................................................................ 27
5.8 Financial Need Analysis ............................................................................................. 28
5.9 Usage of Banking Products ....................................................................................... 30
5.10 Segment Risk Considerations ................................................................................... 31
6 Proposed Banking Product Suite ......................................................................................... 33
6.1 Product Features ........................................................................................................ 33
6.2 Eligibility Criteria for Asset Products ........................................................................ 39

Research Report on ‘Leather Products’ Segment
Table of Content
ii
7 Distribution and Communication Considerations .................................................................. 40
7.1 Marketing Objectives of Banks .................................................................................. 40
7.2 Promotional Activities by Banks ............................................................................... 40
7.3 Distribution Strategy for Banks ................................................................................. 41
Research Report on ‘Leather Products’ Segment Section
Index of Tables 1
1
Index of Tables
Table A: Sampling Plan ......................................................................................................... 4
Table B: Economic Considerations ....................................................................................... 8
Table C: Summary of Industry Overview ............................................................................. 10
Table D: Cluster Locations for „Leather Products‟ Industry .................................................. 17
Table E: Stake Holders and Their Interests ......................................................................... 20
Table F: Raw Material for Leather Products Sector ............................................................. 21
Table G: Sector Financials Snapshot .................................................................................. 24
Table H: Indicative Equipment Requirement ....................................................................... 27
Table I: Working capital/Overdraft Finance Facility ............................................................. 34
Table J: Leather Product Making Machinery Leasing .......................................................... 35
Table K: Industrial Power Generator Leasing ...................................................................... 36
Table L: SME Business Bank Account ................................................................................ 37
Table M: Other Products ..................................................................................................... 37
Table N: Export Refinance .................................................................................................. 38
Table O: Asset Products Criteria ......................................................................................... 39

Research Report on ‘Leather Products’ Segment Section
Index of Figures 1
1
Index of Figures
Figure 4.7-a: Leather Product Making Process ........................................................................... 14
Figure 4.8-a: Indicators of Business Success .............................................................................. 15
Figure 4.8-b: Key means of survival as an SME .......................................................................... 15
Figure 5.1-a: Number of years in operation ................................................................................. 18
Figure 5.1-b: Customers‟ presence within the country ................................................................. 18
Figure 5.2-a: Education level of business owners ....................................................................... 19
Figure 5.2-b: Age group of business owners ............................................................................... 19
Figure 5.2-d: Ownership type ...................................................................................................... 19
Figure 5.2-c: Number of employees under business owners ....................................................... 19
Figure 5.3-a: Communication with customers ............................................................................. 20
Figure 5.3-c: Supplier Relationship ............................................................................................. 21
Figure 5.3-b: Number of Suppliers .............................................................................................. 21
Figure 5.4-a: Business Model ...................................................................................................... 22
Figure 5.4-b: Repayment Terms for customers ........................................................................... 23
Figure 5.6-a: Business Assets ..................................................................................................... 25
Figure 5.6-b: Capital Expenditure ................................................................................................ 25
Figure 5.6-c: Total Revenue ........................................................................................................ 26
Figure 5.6-d: Annual Expense ..................................................................................................... 26
Figure 5.6-e: Total Income .......................................................................................................... 26
Figure 5.8-a: Business Funding Needs ....................................................................................... 28
Figure 5.8-b: Fixed Assets Finance Requirements ...................................................................... 29
Figure 5.10-a: Business Expansion Restraints ............................................................................ 31
Figure 5.10-b: How Business Risk Addressed............................................................................. 32
Research Report on ‘Leather Products’ Segment Section
Guidelines for using this Research Report 1
1
1 Guidelines for using this Research Report
The „Leather Products‟ Segment Research Report provides indicative business and financial
characteristics based on the information evident from a sample of business owners via primary
research survey. It can be used by banks/DFIs as a starting point for development of program
based lending products for tapping the underutilized potential for providing financing products to
small business owners.
The „Leather Products‟ industry overview is developed by using information obtained from
secondary and tertiary sources, including industry associations and data available in public
domain.
1.1 Market Assessment
This section contains analysis based on primary findings of survey exercise conducted in main
cities of Pakistan, mainly Karachi and Lahore among others; the information can form the basis of
identifying the characteristics of a typical business entity in the segment.
1.2 Product Suite
Proposed banking product suite provides a number of potential core banking products templates
that can be used by Banks/DFIs to design appropriate banking products for gaining access to the
particular segment. However, it is highly recommended that product development undergoes the
usual general practice and protocols employed by the bank. It is also recommended that the
product development and the business line team work together to conduct a quick market
research of a small sample in order to validate the results of this study.
1.3 Marketing and Distribution
Marketing and Distribution considerations are indicative and have been based on the assumption
that banks will employ their individual marketing and distribution strategy for product development.
However, information presented can be utilized by banks for developing certain hypothesis to be
validated for developing their marketing and delivery strategies.

Research Report on ‘Leather Products’ Segment Section
Introduction & Objectives 2
2
2 Introduction & Objectives
According to the latest data cited in SMEDA and Economic Survey Reports 2010-2011, Small and
Medium Enterprises (SMEs) account for approximately 40% to GDP contribution of Pakistan and
play a major role in spurring economic activity with a contribution amounting to 80% of non-
agriculture GDP of Pakistan. Many businesses in this segment use banks but few are satisfied in
using banks for their business needs, owing to the following impediments:
A different risk profile
Lack of substantial collateral
Conservative approach adopted by financial institutions
Lack of awareness and willingness of banks
SMEs present immense business opportunities for financial institutions from the perspective of
increasing book size while generating strong risk adjusted returns, however a deeper
understanding of the dynamics of this segment will assist financial institutions to structure
products that meet overall risk management guidelines and facilitate the growth of this SME
segment.
In this context, State Bank of Pakistan (SBP) has mandated Corporate Development Partners to
conduct a secondary research and a primary survey of ten major SME subsectors of Pakistan to
determine banking and financial needs of the sectors.
This research report contains findings pertaining to the segment of “Leather Products” which
includes leather goods units mostly scattered in the main cities such as Karachi, Lahore, and
Sialkot.
Manufacturing sector in Pakistan has been the major contributor towards promoting economic
growth, but lack of research and development and inadequate investment have restrained this
sector to reach its growth to the fullest potential.
The leather goods making units are spread all over Pakistan but the highest concentration is in
Sialkot and Karachi. Raw material reserves, which are livestock, are mostly located in NWFP and
also in other areas mostly rural; however leather goods units acquire their raw material from
leather tanners which are located in main cities and easily available. This sector has great
potential for growth in exports; therefore, mostly requires investment and loan for their raw
material supplies to enable them to produce reasonably priced products for the international
market. Adequate and timely financing from financial institutions will enhance growth within this
sector.

Research Report on ‘Leather Products’ Segment Section
Introduction & Objectives 2
3
2.1 Limitation of the Study
The sample may not be geographically exhaustive.
The sampling plan may not suit the requirements of every bank.
Some of the recommendations are not backed by quantitative primary research but are based
on knowledge of the market and best practices.
Some of the questions in the questionnaire, especially in the financial information section were
considered too personal by many business owners; therefore, many of them refused to answer.
Hence, the responses in this regard may be evasive and cannot be verified with respect to their
accuracy.

Research Report on ‘Leather Products’ Segment Section
Introduction & Objectives 2
4
2.2 Sampling Plan
The primary research exercise conducted for identifying the financial needs of the SME segment
was based on the following sampling methodology.
Table A: Sampling Plan
Particulars Criteria Rationale
Size 1,000 detailed
one-on-one
interviews for
10 sub-sectors
100 SMEs
surveyed within
each sub sector.
Sample size is sufficient enough to gather relevant
qualitative and quantitative information on each sub
sector
Increase in the sample size will only add marginal
value to the overall information collected from the
survey exercise
Change of Definition of SME by SBP
Small enterprises are defined as those businesses
that have employees up to 20 and annual turnover up
to PKR 75 million
Medium enterprises are businesses with more than
20 employees and turnover above PKR 75 million
and up to PKR 400 million for the purpose of
classification and segmentation by banks
For the purpose of this research, the small portion of
medium entities that we have reviewed include entities
that have revenue up to PKR 150 million (i.e. two
times the sales of Small Enterprises)

Research Report on ‘Leather Products’ Segment Section
Introduction & Objectives 2
5
Particulars Criteria Rationale
Status At least
60% will be
informal
businesses
At least
20% will be
formal
businesses
Informal businesses would be entities that do not have
formal accounting and book keeping system. They do not
get their accounts properly audited and are normally not
registered under an official trade/regulatory body.
A wide majority of businesses operating in Pakistan are
informal businesses in terms of their quality of record
keeping and accounting information, in the absence of
which banks do not offer them any credit based products.
A study of informal businesses enables us to gauge the
reasons of these proprietors to remain within the informal
segment and still compete in the market with formal
business enterprises within the same industry segment.
Moreover as per revised SME Prudential Regulations, Small
businesses are allowed financing up to PKR 15 million
without the audited financials. This regulatory change will
enable SMEs to qualify for a structured lending product by
maintaining the basic system of book keeping and
accounting.
Formal businesses are those entities that are relatively
larger in size and have a proper book keeping system.
These are also registered businesses that are operating
either under an association of businesses or under a formal
regulatory license, with a fair amount of transparency in
their accounting and book keeping systems
Including the above businesses gives us a fair
representation of entities that are eligible for all financial
services being offered by banks and their extent of using
banks as their main financiers and other service providers
or only for holding their business operating accounts
Formal businesses have more structured requirements than
those who use banks only for products such as fund
transfers
Research Report on ‘Leather Products’ Segment Section
Introduction & Objectives 2
6
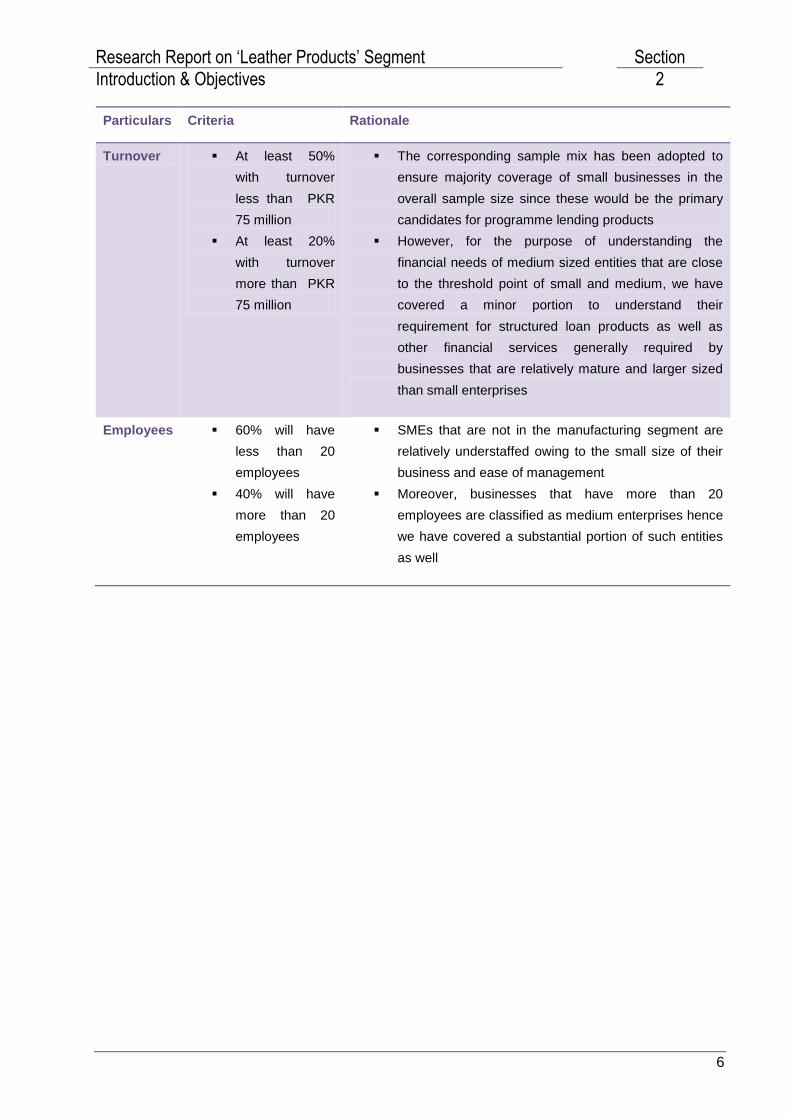
Particulars Criteria Rationale
Turnover At least 50%
with turnover
less than PKR
75 million
At least 20%
with turnover
more than PKR
75 million
The corresponding sample mix has been adopted to
ensure majority coverage of small businesses in the
overall sample size since these would be the primary
candidates for programme lending products
However, for the purpose of understanding the
financial needs of medium sized entities that are close
to the threshold point of small and medium, we have
covered a minor portion to understand their
requirement for structured loan products as well as
other financial services generally required by
businesses that are relatively mature and larger sized
than small enterprises
Employees 60% will have
less than 20
employees
40% will have
more than 20
employees
SMEs that are not in the manufacturing segment are
relatively understaffed owing to the small size of their
business and ease of management
Moreover, businesses that have more than 20
employees are classified as medium enterprises hence
we have covered a substantial portion of such entities
as well

Research Report on ‘Leather Products’ Segment Section
Introduction & Objectives 2
7
Particulars Criteria Rationale
Banking
history
At least 70%
with banking
history
At least 10%
with no banking
history
As per SBP prudential regulations any business
operated by an individual as a proprietor, but meets
the classification criteria of the regulations will be
termed under SME
On account of above a majority of sample in the
market are operating their businesses through a
bank account (either in the name of the proprietor or
in the name of the business)
Most of the financial needs and preferences that are
objectives of this assignment, have been obtained
from the above sample who are using a bank for their
businesses operating needs
However, a very small portion of the totally unbanked
SMEs in the sub-sector is also covered during our
survey to understand their reasons for not availing the
banking services and fulfilling their needs for financial
services through other, more expensive, informal
channels
.
Research Report for ‘Leather Products’ Segment Section
Economic Overview 3
8
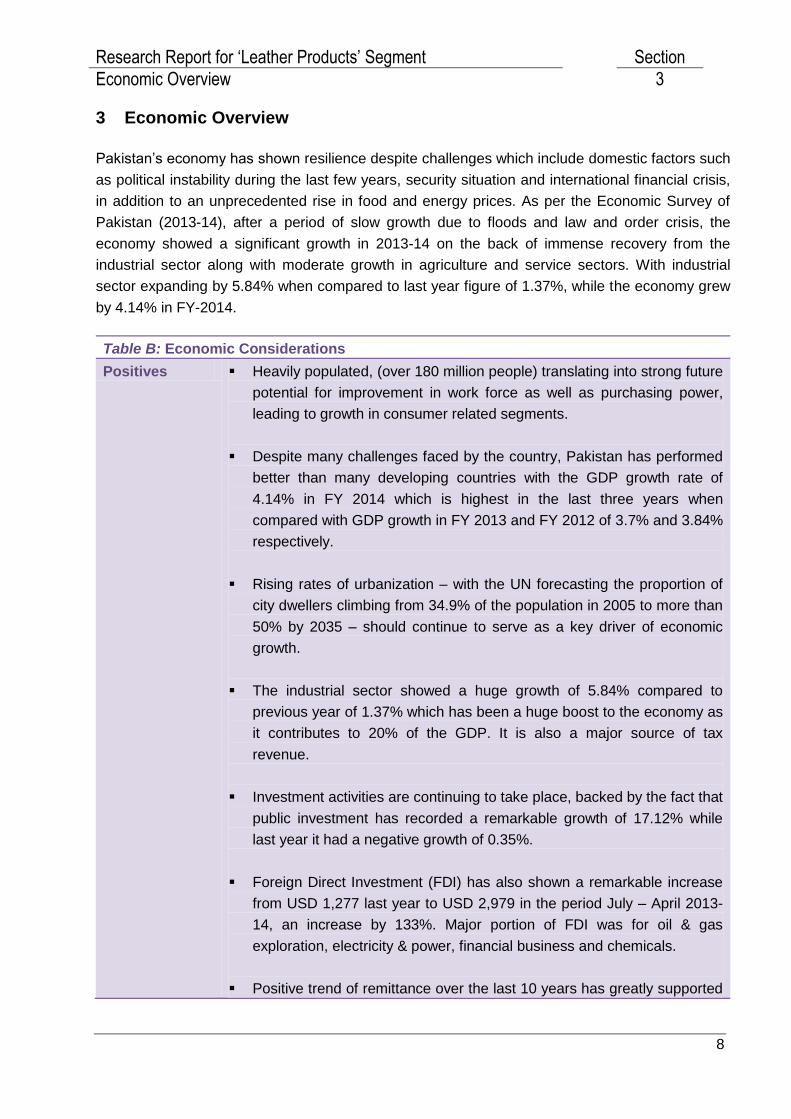
3 Economic Overview
Pakistan‟s economy has shown resilience despite challenges which include domestic factors such
as political instability during the last few years, security situation and international financial crisis,
in addition to an unprecedented rise in food and energy prices. As per the Economic Survey of
Pakistan (2013-14), after a period of slow growth due to floods and law and order crisis, the
economy showed a significant growth in 2013-14 on the back of immense recovery from the
industrial sector along with moderate growth in agriculture and service sectors. With industrial
sector expanding by 5.84% when compared to last year figure of 1.37%, while the economy grew
by 4.14% in FY-2014.
Table B: Economic Considerations
Positives Heavily populated, (over 180 million people) translating into strong future
potential for improvement in work force as well as purchasing power,
leading to growth in consumer related segments.
Despite many challenges faced by the country, Pakistan has performed
better than many developing countries with the GDP growth rate of
4.14% in FY 2014 which is highest in the last three years when
compared with GDP growth in FY 2013 and FY 2012 of 3.7% and 3.84%
respectively.
Rising rates of urbanization – with the UN forecasting the proportion of
city dwellers climbing from 34.9% of the population in 2005 to more than
50% by 2035 – should continue to serve as a key driver of economic
growth.
The industrial sector showed a huge growth of 5.84% compared to
previous year of 1.37% which has been a huge boost to the economy as
it contributes to 20% of the GDP. It is also a major source of tax
revenue.
Investment activities are continuing to take place, backed by the fact that
public investment has recorded a remarkable growth of 17.12% while
last year it had a negative growth of 0.35%.
Foreign Direct Investment (FDI) has also shown a remarkable increase
from USD 1,277 last year to USD 2,979 in the period July – April 2013-
14, an increase by 133%. Major portion of FDI was for oil & gas
exploration, electricity & power, financial business and chemicals.
Positive trend of remittance over the last 10 years has greatly supported

Research Report for ‘Leather Products’ Segment Section
Economic Overview 3
9
the country‟s balance of payment position.
Challenges National saving is showing a decline, with 12.9% of GDP in FY14 while
in FY13 it was reported 13.5% of the GDP. Covering the saving-
investment gap remains to be a challenge.
The FY 2013-14 has shown slight improvement in fiscal deficit which
reduced by 3.2% compared to previous year. Structural weakness in tax
system however still prevails with low tax to GDP ratio while the
expenditures continue to exceed the revenues.
Balance of payments has shown a surplus of USD 1,938 million
compared to last year deficit of USD 2,090 million in FY 2013-14.
However despite that, the current account balance further showed a
deficit of USD 2,162 million in July-April 2013-14 compared to last year
in the same period.
Research Report on ‘Leather Products’ Segment Section
Leather Products Industry Overview 4
10
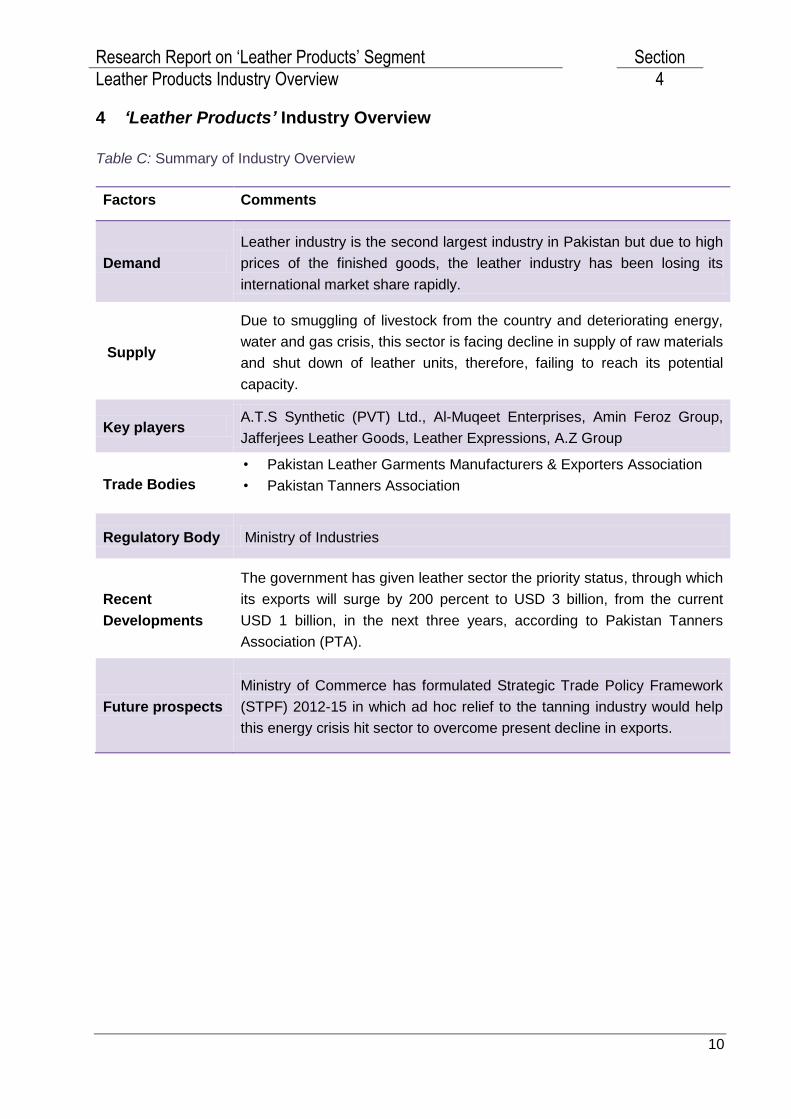
4 ‘Leather Products’ Industry Overview
Table C: Summary of Industry Overview
Factors Comments
Demand
Leather industry is the second largest industry in Pakistan but due to high
prices of the finished goods, the leather industry has been losing its
international market share rapidly.
Supply
Due to smuggling of livestock from the country and deteriorating energy,
water and gas crisis, this sector is facing decline in supply of raw materials
and shut down of leather units, therefore, failing to reach its potential
capacity.
Key players A.T.S Synthetic (PVT) Ltd., Al-Muqeet Enterprises, Amin Feroz Group,
Jafferjees Leather Goods, Leather Expressions, A.Z Group
Trade Bodies
• Pakistan Leather Garments Manufacturers & Exporters Association
• Pakistan Tanners Association
Regulatory Body Ministry of Industries
Recent
Developments
The government has given leather sector the priority status, through which
its exports will surge by 200 percent to USD 3 billion, from the current
USD 1 billion, in the next three years, according to Pakistan Tanners
Association (PTA).
Future prospects
Ministry of Commerce has formulated Strategic Trade Policy Framework
(STPF) 2012-15 in which ad hoc relief to the tanning industry would help
this energy crisis hit sector to overcome present decline in exports.
Research Report on ‘Leather Products’ Segment Section
Leather Products Industry Overview 4
11
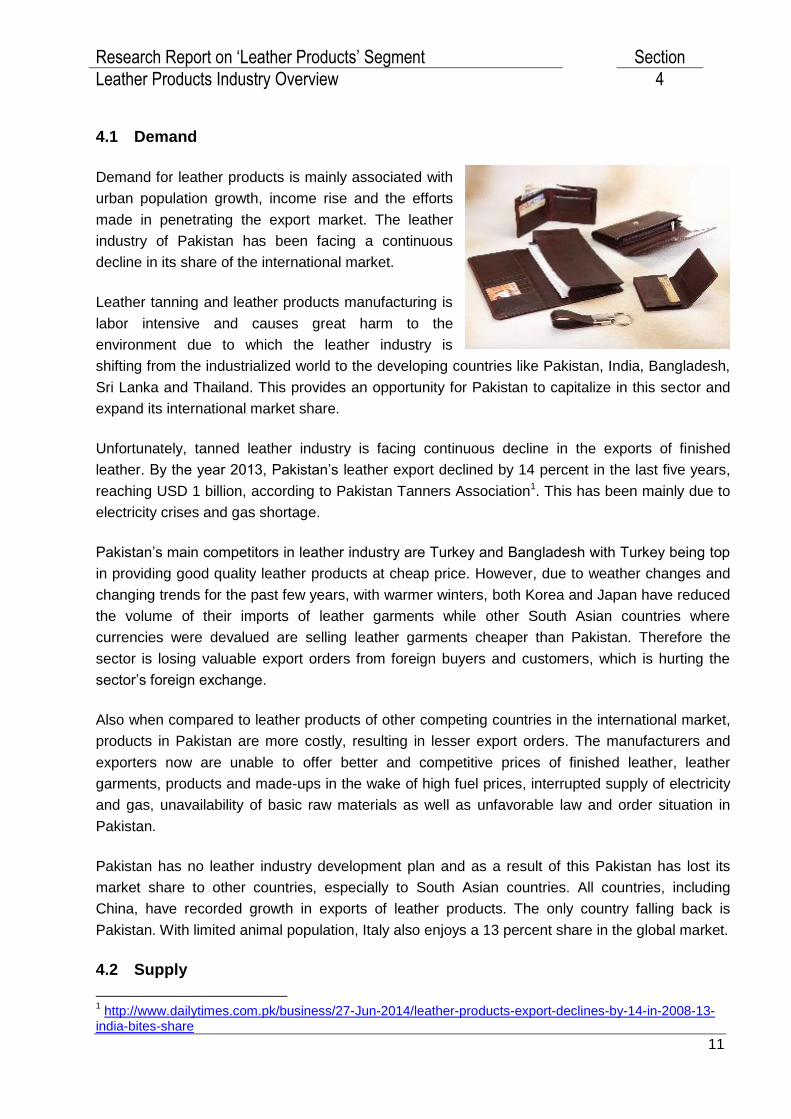
4.1 Demand
Demand for leather products is mainly associated with
urban population growth, income rise and the efforts
made in penetrating the export market. The leather
industry of Pakistan has been facing a continuous
decline in its share of the international market.
Leather tanning and leather products manufacturing is
labor intensive and causes great harm to the
environment due to which the leather industry is
shifting from the industrialized world to the developing countries like Pakistan, India, Bangladesh,
Sri Lanka and Thailand. This provides an opportunity for Pakistan to capitalize in this sector and
expand its international market share.
Unfortunately, tanned leather industry is facing continuous decline in the exports of finished
leather. By the year 2013, Pakistan‟s leather export declined by 14 percent in the last five years,
reaching USD 1 billion, according to Pakistan Tanners Association1. This has been mainly due to
electricity crises and gas shortage.
Pakistan‟s main competitors in leather industry are Turkey and Bangladesh with Turkey being top
in providing good quality leather products at cheap price. However, due to weather changes and
changing trends for the past few years, with warmer winters, both Korea and Japan have reduced
the volume of their imports of leather garments while other South Asian countries where
currencies were devalued are selling leather garments cheaper than Pakistan. Therefore the
sector is losing valuable export orders from foreign buyers and customers, which is hurting the
sector‟s foreign exchange.
Also when compared to leather products of other competing countries in the international market,
products in Pakistan are more costly, resulting in lesser export orders. The manufacturers and
exporters now are unable to offer better and competitive prices of finished leather, leather
garments, products and made-ups in the wake of high fuel prices, interrupted supply of electricity
and gas, unavailability of basic raw materials as well as unfavorable law and order situation in
Pakistan.
Pakistan has no leather industry development plan and as a result of this Pakistan has lost its
market share to other countries, especially to South Asian countries. All countries, including
China, have recorded growth in exports of leather products. The only country falling back is
Pakistan. With limited animal population, Italy also enjoys a 13 percent share in the global market.
4.2 Supply
1 http://www.dailytimes.com.pk/business/27-Jun-2014/leather-products-export-declines-by-14-in-2008-13-
india-bites-share

Research Report on ‘Leather Products’ Segment Section
Leather Products Industry Overview 4
12
Though leather manufacturing factories are
present all over Pakistan like Kasur, Lahore
and Multan, around 90% of products/ garments
are made in Karachi and Sialkot. Almost all of
these leather products are exported with very
few sold to the local market. Apart from earning
huge amount of foreign exchange for the
country, leather industry provides employment
opportunities to about 0.3 million people2. Further, availability of livestock population in Pakistan
ensures consistent supply of raw material to the leather industry. With all these favorable
conditions, leather industry of Pakistan should have flourished with huge earning of foreign
exchange for the country, but the real picture is far from it.
Despite ample availability of livestock, supply of raw material is severely affected due to
smuggling of live animals to other countries. According to Pakistan Tanners Association, the
export quota of live animals fixed by the government will cripple the leather industry with huge
number of live animals exported to Iran and Afghanistan, resulting in scarcity of raw material for
the leather industry. Further, severe energy crisis has caused serious damage to hides and skin,
being a major raw material for leather industry. According to Pakistan Tanners Association (PTA),
load shedding is not only causing serious damage to leather manufacturing process but also
adversely affecting quality of the leather. The skin, being perishable, cannot be stored without first
being processed, which requires uninterrupted supply of electricity and gas.
This raises the price of skin and other raw materials, which results in high production cost and
therefore has led to the shrinking of this sector. These production costs are further raised by
importing raw material to meet the local demand, as higher quality leather are mostly exported
which reduces value addition to the local leather product manufacturing and thus losing its export
shares to other countries selling cheaper products of better quality.
Energy crisis, especially in Punjab, has caused substantial damage to one of the major foreign
exchange earning leather industry in many other ways. As the sector has become less
competitive both locally and internationally, majority of tanning units are facing complete closures
due to low availability of gas and prolonged power breakdowns in the province, as use of furnace
oil for boiler heating has become unviable.
Exports of leather industry have also been jeopardized due to suspension of water supply in the
Tannery Zone of Korangi Industrial Area where the major leather and leather goods exporting
units exist.
2 http://weeklypulse.org/details.aspx?contentID=2112&storylist=16

Research Report on ‘Leather Products’ Segment Section
Leather Products Industry Overview 4
13
4.3 Key Players
A.T.S Synthetic (PVT) Ltd., Al-Muqeet Enterprises, Amin Feroz Group, Jafferjees Leather Goods,
Leather Expressions, A.Z Group
4.4 Trade Bodies
• Pakistan Leather Garments Manufacturers & Exporters Association – PLGMEA was formed in
November 2001 to protect, promote and develop the Pakistan Leather Garment Industry.
• Pakistan Tanners Association - was established in late 1950s representing the leather
industry and dealing with the members‟ problems at Federal level. PTA is now functioning as
a renowned trade body duly licensed by the Ministry of Commerce under Trade Organizations
Ordinance/Rules 2007, registered with the Security & Exchange Commission of Pakistan and
a bonafide member of the Federation of Pakistan Chambers of Commerce & Industry.
4.5 Recent Developments
In order to increase the pace of earning valuable foreign
exchange, the government has awarded the leather
sector a priority status through which it is expected that
the exports will surge by 200 percent to USD 3 billion
from the current USD 1 billion in the next three years,
according to Pakistan Tanners Association (PTA)3.
4.6 Future Developments
Ministry of Commerce has formulated Strategic Trade Policy Framework (STPF) 2012-154 in
which ad hoc relief to the tanning industry has been proposed which would help this energy crisis
hit sector to overcome present decline in exports. It is a positive step to increase the country‟s
exports after the implementation of various decisions taken in the trade policy.
Sri Lanka has expressed that there is potential for export of cheaper hides of buffalo and cows to
Pakistan which can be availed by leather industry of the country.
4.7 Leather Product Making Process
3 http://archives.dailytimes.com.pk/business/30-Dec-2012/govt-awards-leather-sector-priority-status
4 http://www.commerce.gov.pk/wp-
content/uploads/2014/09/STRATEGIC_TRADE_POLICY_FRAMEWORK_2012-15.pdf
Research Report on ‘Leather Products’ Segment Section
Leather Products Industry Overview 4
14
Purchase of skin and hides
Cutting
Storage of raw materials
Pattern making
Tanning process
Stitching
Finishing
Repairing/ Reworking
This process is carried out by those businesses which own their own leather tanning units
Storage for export
Wet Finishing
Local Market
Rejected
International customers
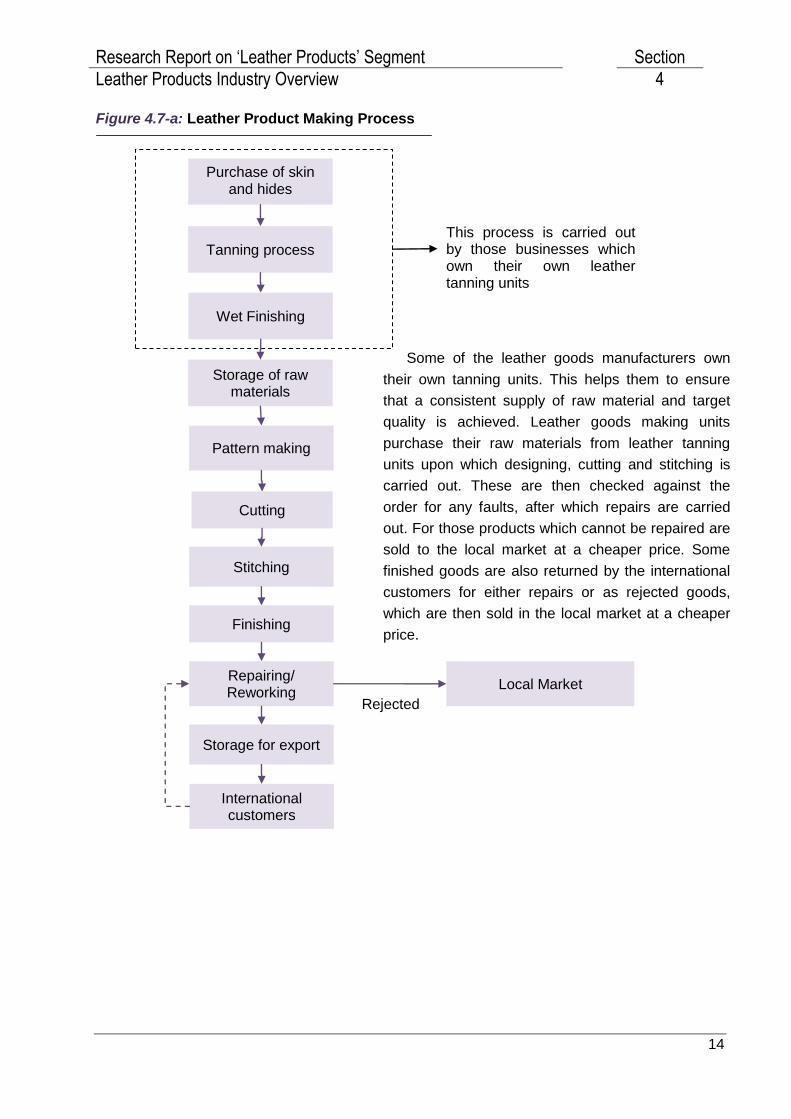
Figure 4.7-a: Leather Product Making Process
Some of the leather goods manufacturers own
their own tanning units. This helps them to ensure
that a consistent supply of raw material and target
quality is achieved. Leather goods making units
purchase their raw materials from leather tanning
units upon which designing, cutting and stitching is
carried out. These are then checked against the
order for any faults, after which repairs are carried
out. For those products which cannot be repaired are
sold to the local market at a cheaper price. Some
finished goods are also returned by the international
customers for either repairs or as rejected goods,
which are then sold in the local market at a cheaper
price.
Research Report on ‘Leather Products’ Segment Section
Leather Products Industry Overview 4
15
1%
65%
15%10%
93%
0%
10%
20%
30%
40%
50%
60%
70%
80%
90%
100%
Cost & efficiency Good relation with the suppliers
High profit margin Product innovation and diversity
Timely delivery
98% 97%
10%1%
0%
20%
40%
60%
80%
100%
120%
Education Experience Favorable Government policies
Strong supplier customer relations
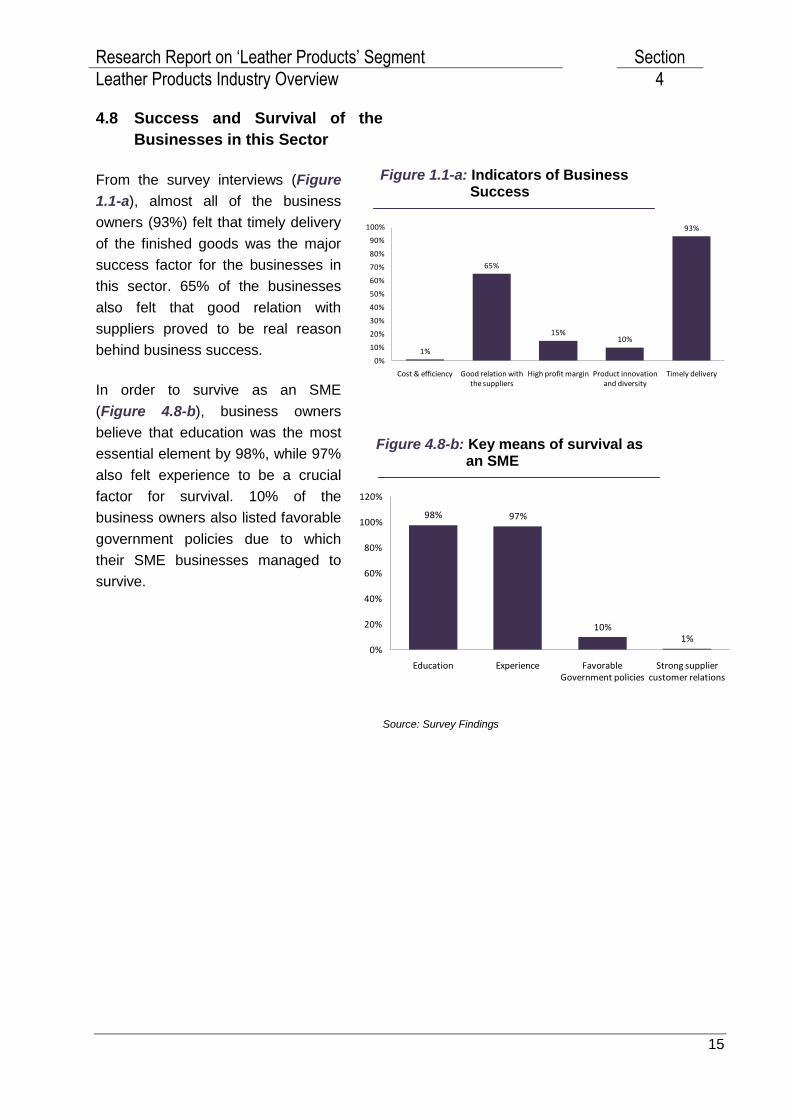
4.8 Success and Survival of the
Businesses in this Sector
From the survey interviews (Figure
1.1-a), almost all of the business
owners (93%) felt that timely delivery
of the finished goods was the major
success factor for the businesses in
this sector. 65% of the businesses
also felt that good relation with
suppliers proved to be real reason
behind business success.
In order to survive as an SME
(Figure 4.8-b), business owners
believe that education was the most
essential element by 98%, while 97%
also felt experience to be a crucial
factor for survival. 10% of the
business owners also listed favorable
government policies due to which
their SME businesses managed to
survive.
Figure 1.1-a: Indicators of Business Success
Figure 4.8-b: Key means of survival as an SME
Source: Survey Findings
Research Report on ‘Leather Products’ Segment Section
Market Assessment 5
16
5 Market Assessment
5.1 Market & Demographic Profile
At present, the retail sales segment in Pakistan is relatively organized. Majority of the businesses
are family owned with members of one family serving different functions of business. Underlying
issues inherent to the segment include:
1) Limited funding sources
2) Inability to identify and explore new ideas
3) Lack of technical institutions and skill development programs
„Leather Products‟ segment is largely dispersed across various cities with the biggest
concentration in Sialkot as export orders are conveniently delivered. The raw materials are
scattered in the rural and urban areas of the country but the greatest concentration of leather
tanners is in Sialkot, where most of the leather goods processing units are located for
convenience. Some businesses have their own tanning units and so require raw materials in form
of animal skins which is supplied from both rural and urban areas.
This sub-sector is known to have updated technology and is one of the leading industries in terms
of quality leather goods, but high production cost and energy crisis has led to decline in its
production, which is resultantly causing a sharp decline in its share in the international market.
Research Report on ‘Leather Products’ Segment Section
Market Assessment 5
17
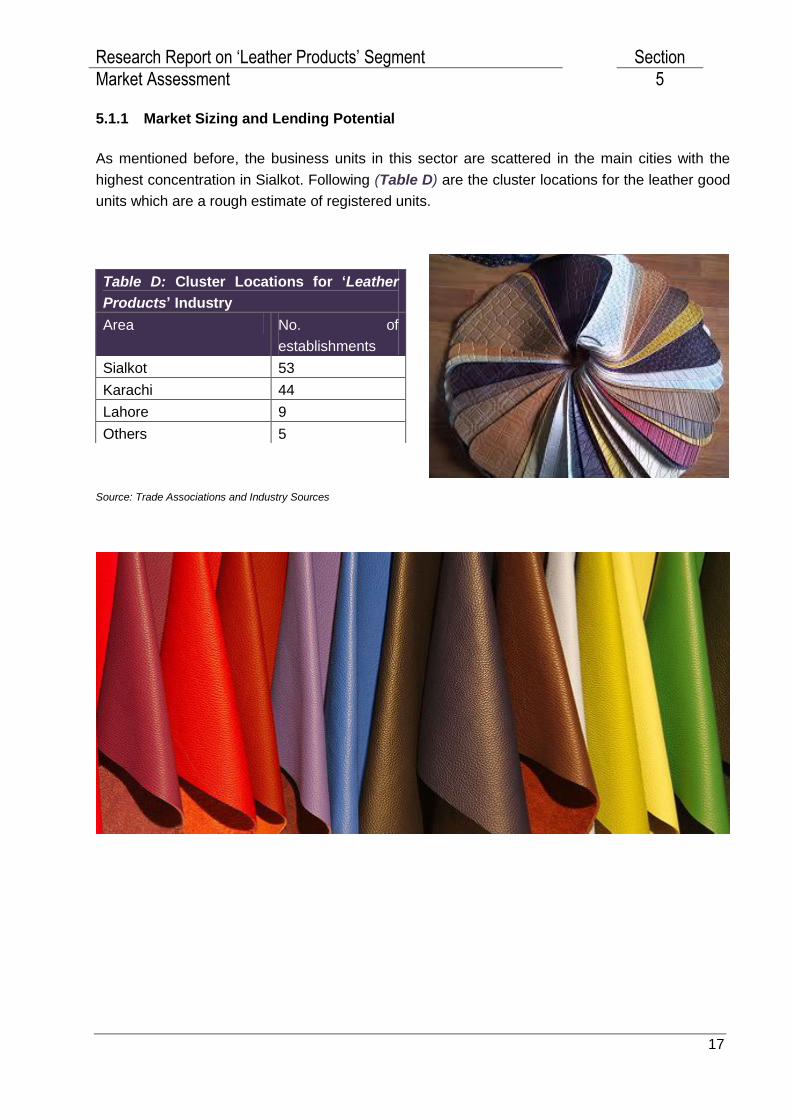
5.1.1 Market Sizing and Lending Potential
As mentioned before, the business units in this sector are scattered in the main cities with the
highest concentration in Sialkot. Following (Table D) are the cluster locations for the leather good
units which are a rough estimate of registered units.
Source: Trade Associations and Industry Sources
Table D: Cluster Locations for ‘Leather
Products’ Industry
Area No. of
establishments
Sialkot 53
Karachi 44
Lahore 9
Others 5

Research Report on ‘Leather Products’ Segment Section
Proposed Banking Product Suite 6
18
1 to 3 years, 6%
3 to 5 years, 27%
5 to 10 years, 38%
More Than 10 years, 29%
70%
8%2%
9% 11%
0%
10%
20%
30%
40%
50%
60%
70%
80%
Karachi Lahore Multan Punjab Sialkot
5.1.2 Segment Demographics
The segment is spread out across various regions, with high concentration of customers catered
by businesses in the survey in Karachi and Sialkot. However, for the survey purposes,
demographic information is obtained from industry sources and primary research conducted using
a selected sample of businesses in major cities of Pakistan, from which, Karachi was mostly
covered since it has one of the largest leather units in Korangi area. Accordingly, leather
businesses in the survey had majority of their customers in Karachi (70%), while some also had
their customers in Sialkot (11%), Lahore (8%), Multan (2%) and rest of Punjab (9%) (Figure
5.1-b).
In survey findings (Figure 5.1-a), majority of the businesses in this sector have been established
for five to ten years (38%) or more than 10 years (29%).
Source: Survey Findings
Figure 5.1-a: Number of years in operation
Figure 5.1-b: Customers’ presence within the country

Research Report on ‘Leather Products’ Segment Section
Proposed Banking Product Suite 6
19
College/Bachelor Degree, 63%
High School, 5%
No Education, 1%
Post Graduate, 28%
Primary School Completed, 2%
Some Primary School, 1%
21-30, 3%
31-40, 31%
41-50, 53%
51-65, 13%
0-4, 18%
5-9, 23%
10-24, 53%
24-50, 6%
Individual/proprietorship, 80%
Partnership, 20%
5.2 Owners Profile
The business owners consist mainly of people in the age group of 41-50 years (Figure 5.2-b) who
have been working for many years as many of the businesses are established for 5-10 years or
more than that. This indicates that the business owners are well experienced in their line of work.
Due to nature of work it is preferable that the owners are reasonably educated however, there are
also other owners with very basic education, 5% with high school while 3% with just primary
education (Figure 5.2-a), and are running the business for many years. All the businesses in this
sector under the survey are run by families with majority (53%) having workforce of 10-24
employees (Figure 5.2-d). 80% of the businesses are established as sole proprietors (Figure
5.2-c).
Source: Survey Findings
Figure 5.2-a: Education level of business owners
Figure 5.2-b: Age group of business owners
Figure 5.2-d: Number of employees under business owners
Figure 5.2-c: Ownership type
Research Report on ‘Leather Products’ Segment Section
Proposed Banking Product Suite 6
20
2%
18%
6%
63%
89%
0%
10%
20%
30%
40%
50%
60%
70%
80%
90%
100%
Courier Email Fax Personal Visits Telephone
5.3 Business Linkages
Businesses in the segment are connected to various institutions, which are directly or indirectly
affected by the business operations, primary stakeholders and their interests are enlisted in the
following table:
Table E: Stake Holders and Their Interests
Stakeholder Interest
Owners Growth, government initiative and access to finance
Suppliers (Leather
tanners, accessories
providers; buttons,
zips etc.)
Better terms and consistent pricing and lower risk
Customers Product quality, reasonable pricing and timely delivery
Financial
Institutions
Debt servicing, new products, increase in deposits
Government
Economic growth and benefit to community at large
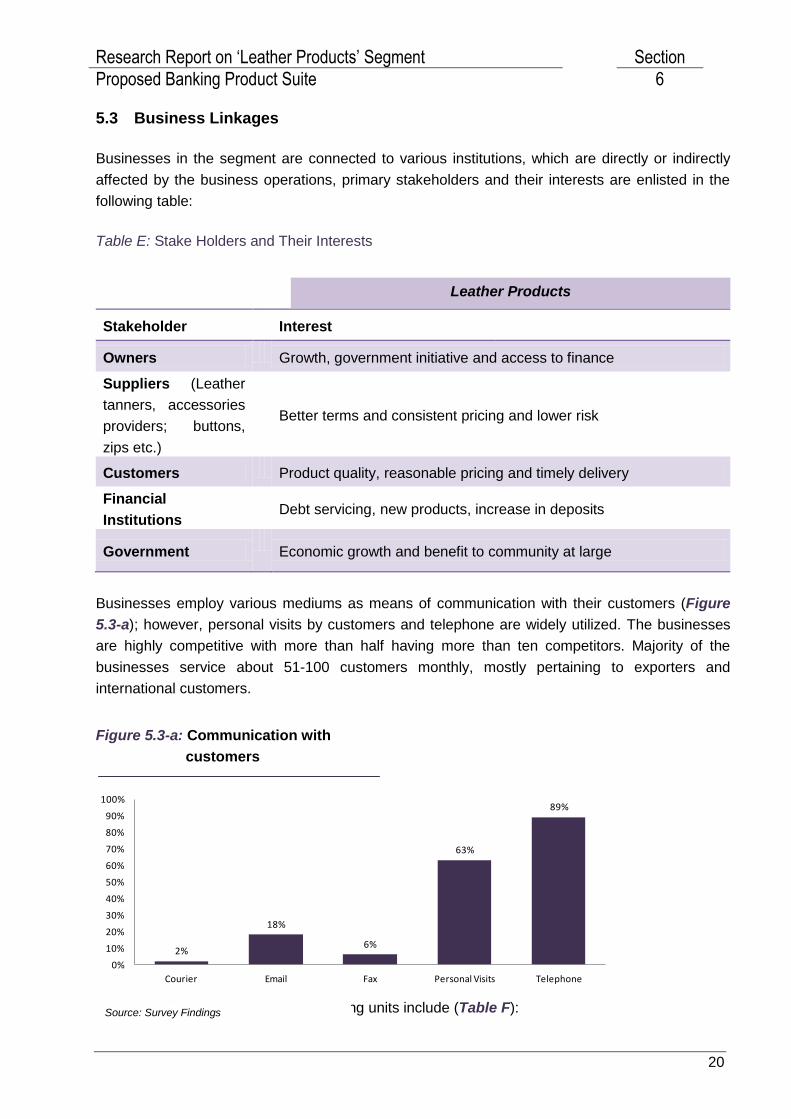
Businesses employ various mediums as means of communication with their customers (Figure
5.3-a); however, personal visits by customers and telephone are widely utilized. The businesses
are highly competitive with more than half having more than ten competitors. Majority of the
businesses service about 51-100 customers monthly, mostly pertaining to exporters and
international customers.
Major supplies for leather product making units include (Table F):
Source: Survey Findings Source: Survey Findings
Leather Products
Figure 5.3-a: Communication with
customers

Research Report on ‘Leather Products’ Segment Section
Proposed Banking Product Suite 6
21
One, 6%
Two to Five, 53%
More than five, 41%
28%
20%
45%
8%
0%
5%
10%
15%
20%
25%
30%
35%
40%
45%
50%
Rely on the same supplier for
material needs
Not consistent in meeting business
material needs
Depend on many to meet business material needs
Need new suppliers due to
inconsistent
material quality supplied
Table F: Raw Material for ‘Leather Products’ Sector
Suede leather
Lining fabric nylon).
Zippers/ buttons/ Thread
Majority of the businesses (45%) in this sector depend on
many suppliers to meet their raw material needs which
ensure consistent supplies are available without dependency on one supplier (Figure 5.3-b). 28%
of the businesses however rely on the same supplier for years, which in some cases may owe to
good quality of raw material supplied or long term supply contract. Some businesses however are
not consistent in suppliers for raw materials or need new suppliers due to inconsistent material
quality with percentages resting at 20% and 8% respectively. This indicates that some risk of raw
material supplies exists in this sector.
Preference is placed on buying the material needs locally from the same location or same city
from local dealers or wholesalers however, excessive export of livestock makes buying from one
location difficult. As leather tanner units are mostly located near leather product making units, it is
easier to procure consistent supply of raw materials. 53% of the businesses rely on two to five
suppliers while 41% depend on more than five suppliers for their business needs (Figure 5.3-c).
Source: Survey Findings
Figure 5.3-b: Supplier Relationship Figure 5.3-c: Number of Suppliers
Research Report on ‘Leather Products’ Segment Section
Proposed Banking Product Suite 6
22
Leather Tanners
International Market Local Market
Leather Product
Manufacturing Units
Accessories (Zips, Buttons, Thread, etc.)
5.4 Business Cycle
Majority of the businesses in the survey claimed that this sector is not seasonal. This could be
due to the fact that in many countries, winter stays throughout the year with the exception of
couple of months with a reasonably warm weather. This sector does, however, go through
favorable phase during winters for obvious reasons of high orders from Europe and other northern
countries. Other than that, with the advent of Eid-ul-Adha, high availability of animal skin from the
slaughtering of the animals prove to be fruitful for those businesses which also have their own
leather tanning units as such times are a source of cheaper raw material.
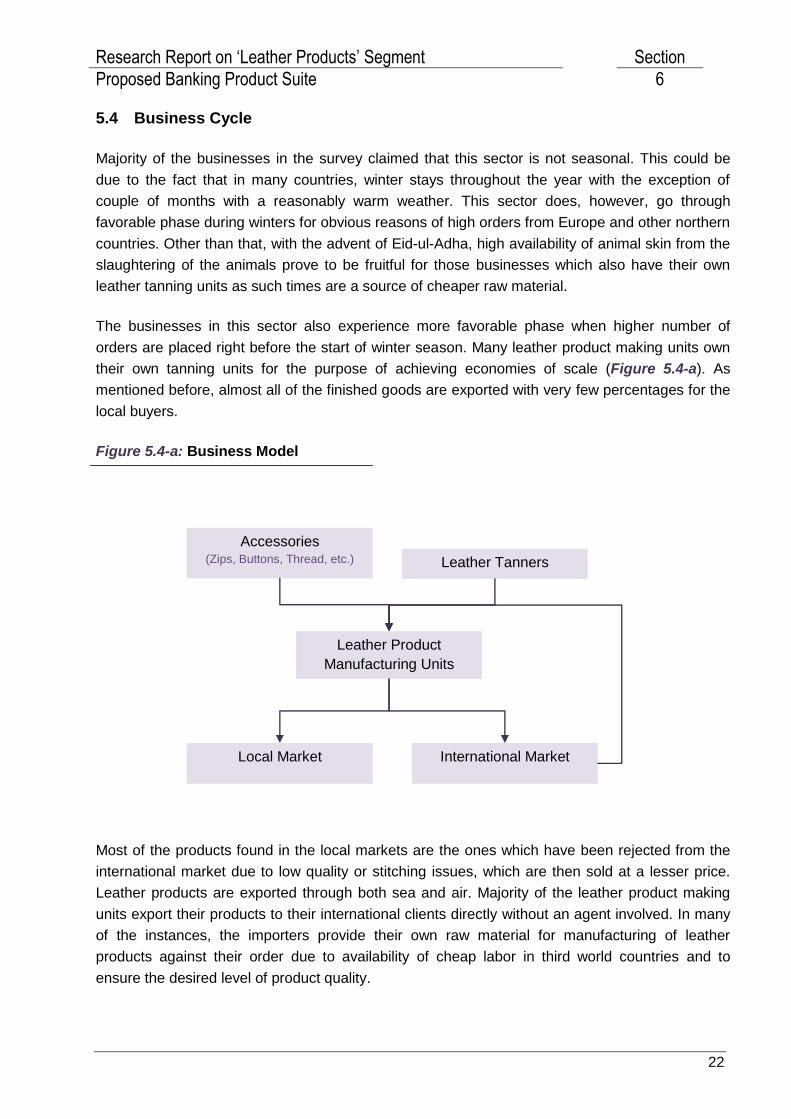
The businesses in this sector also experience more favorable phase when higher number of
orders are placed right before the start of winter season. Many leather product making units own
their own tanning units for the purpose of achieving economies of scale (Figure 5.4-a). As
mentioned before, almost all of the finished goods are exported with very few percentages for the
local buyers.
Figure 5.4-a: Business Model
Most of the products found in the local markets are the ones which have been rejected from the
international market due to low quality or stitching issues, which are then sold at a lesser price.
Leather products are exported through both sea and air. Majority of the leather product making
units export their products to their international clients directly without an agent involved. In many
of the instances, the importers provide their own raw material for manufacturing of leather
products against their order due to availability of cheap labor in third world countries and to
ensure the desired level of product quality.

Research Report on ‘Leather Products’ Segment Section
Proposed Banking Product Suite 6
23
1 month, 80%
3 months, 8%
No credit, 11%
6months, 1%
5.4.1 Working Capital
Working capital is dependent upon payment terms offered to customers and received from
suppliers. Almost all the businesses in „Leather Product‟ sectors claim to have all their payments
made instantly to their suppliers, making payments in foreign currencies to their suppliers to
import quality raw material for international orders.
The repayment offered to the customers by the businesses in this sector varies from 1 month to 3
months, with percentages resting at 80% and 8% respectively (Figure 5.4-b). Only 1% of the
businesses allow repayment terms of up to 6 months, while 11% do not provide any credit terms
to their customers. This may prove to be unfavorable for the business‟s cash cycle as in some
cases, the cash gets held up for as long as three months.
Source: Survey Findings
Source: Survey Findings
Figure 5.4-b: Repayment Terms for customers
Research Report on ‘Leather Products’ Segment Section
Proposed Banking Product Suite 6
24
5.5 Financial Assessment and Profile
All the businesses in this segment prepare Financial Statements, however more than half of the
business owners stated that they have their Financial Statements audited.
More than half of the business owners/managers keep track of accounts themselves, though
because of higher level of education in this sector they seem to have accounting knowledge and
experience which ensures to some extent that they are able to prepare reliable Financial
Statements and keep a good and organized track of their cash movement.
From primary research and interviews conducted from trade associations, it has been identified
that profit margins are between 20-25%, with a great number banking on higher sales volume for
earning better profits due to high cost of production. The businesses are also struggling for higher
investment which is required for leather tanning and leather product making.
As per survey findings, none of the business owners in the sector were willing to disclose their
financial data with regards to capital invested. A rough estimate was given by the business
owners regarding business assets employed, annual revenue, income and expenses.
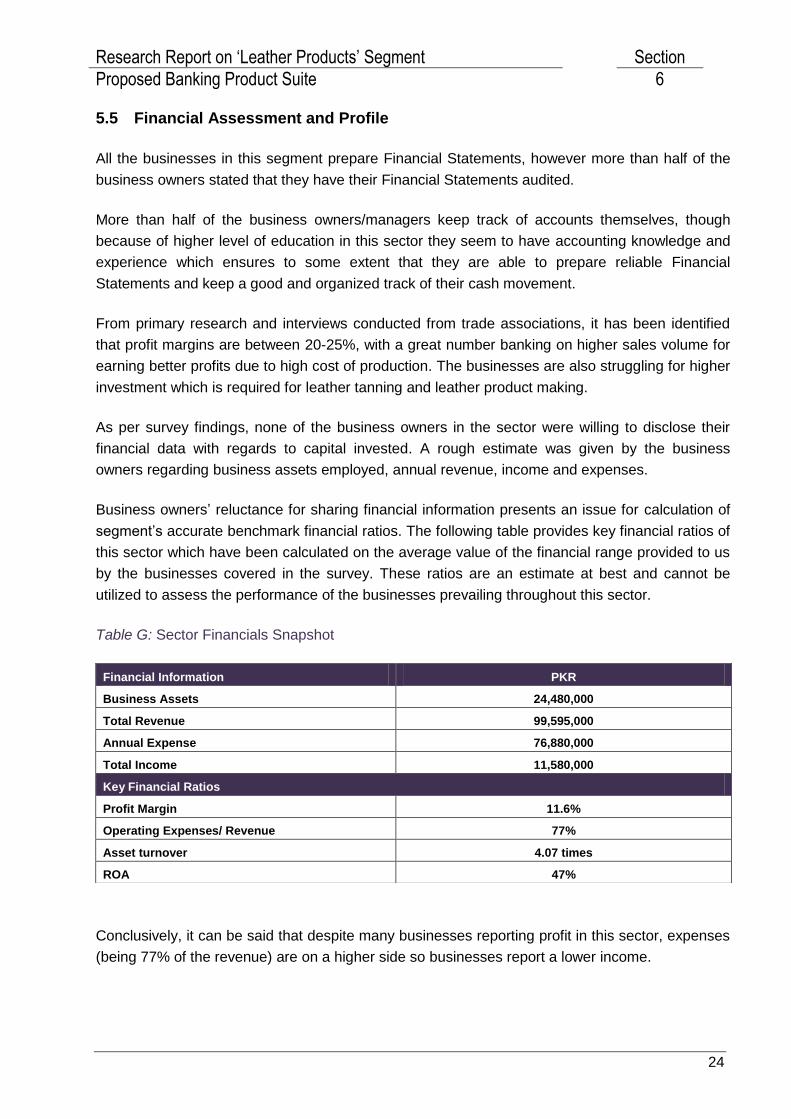
Business owners‟ reluctance for sharing financial information presents an issue for calculation of
segment‟s accurate benchmark financial ratios. The following table provides key financial ratios of
this sector which have been calculated on the average value of the financial range provided to us
by the businesses covered in the survey. These ratios are an estimate at best and cannot be
utilized to assess the performance of the businesses prevailing throughout this sector.
Table G: Sector Financials Snapshot
Conclusively, it can be said that despite many businesses reporting profit in this sector, expenses
(being 77% of the revenue) are on a higher side so businesses report a lower income.
Financial Information PKR
Business Assets 24,480,000
Total Revenue 99,595,000
Annual Expense 76,880,000
Total Income 11,580,000
Key Financial Ratios
Profit Margin 11.6%
Operating Expenses/ Revenue 77%
Asset turnover 4.07 times
ROA 47%
Research Report on ‘Leather Products’ Segment Section
Proposed Banking Product Suite 6
25
Yes, 56%
No, 44%
Less than PKR 10 MN, 24%
PKR 10 – 50 MN, 76%
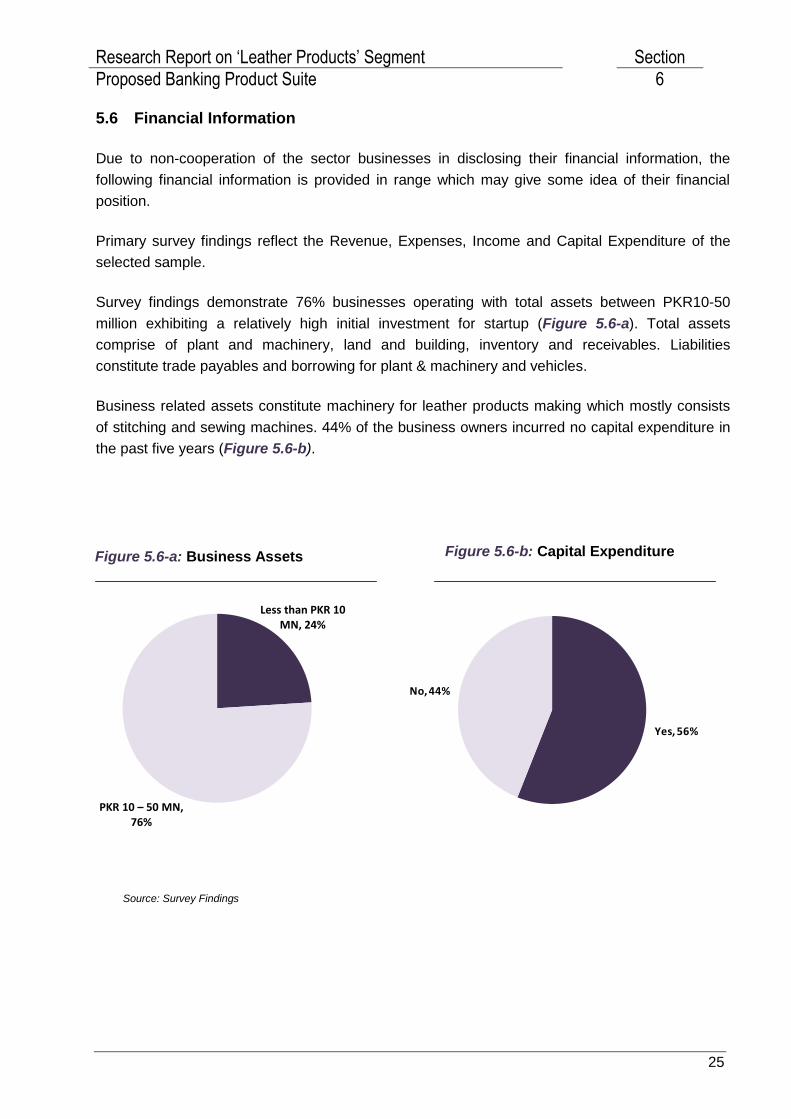
5.6 Financial Information
Due to non-cooperation of the sector businesses in disclosing their financial information, the
following financial information is provided in range which may give some idea of their financial
position.
Primary survey findings reflect the Revenue, Expenses, Income and Capital Expenditure of the
selected sample.
Survey findings demonstrate 76% businesses operating with total assets between PKR10-50
million exhibiting a relatively high initial investment for startup (Figure 5.6-a). Total assets
comprise of plant and machinery, land and building, inventory and receivables. Liabilities
constitute trade payables and borrowing for plant & machinery and vehicles.
Business related assets constitute machinery for leather products making which mostly consists
of stitching and sewing machines. 44% of the business owners incurred no capital expenditure in
the past five years (Figure 5.6-b).
Source: Survey Findings
Figure 5.6-a: Business Assets Figure 5.6-b: Capital Expenditure

Research Report on ‘Leather Products’ Segment Section
Proposed Banking Product Suite 6
26
PKR 10 – 50 MN, 24%
PKR 51 – 100 MN, 29%
More than PKR 100 MN, 47%
PKR 1 – 5 MN, 4%
PKR 6 – 10 MN, 42%More Than 10
MN, 54%
PKR 10 – 50 MN, 30%
PKR 51 – 100 MN, 30%
More than PKR 100 MN, 40%
Annual average revenue was more than PKR 100 million, reported by 47% of the businesses
while 29% have claimed to have an annual average revenue between PKR 51-100 million (Figure
5.6-c). Expenses primarily represent material, employee cost and interest expenses against
borrowings. 40% of the businesses had an average annual expenses of more than PKR 100
million while 30% had an annual average expense ranging between PKR 10 – 50 million and PKR
51 -100 million (Figure 5.6-d).
More than half (54%) of the businesses owners earn more than PKR 10 million while 42% claim to
earn between PKR 6-10 million of average income for the last three years (Figure 5.6-e). Only
4% of the business owners‟ show earnings in the range of PKR 1-5 million annually.
Source: Survey Findings
Source: Survey Findings
Figure 5.6-c: Total Revenue Figure 5.6-d: Annual Expense
Figure 5.6-e: Total Income

Research Report on ‘Leather Products’ Segment Section
Proposed Banking Product Suite 6
27
5.7 Indicative Business Requirements
Business owners require equipment and civil works for startup or expansion. In addition,
individual business owners will have distinctive requirements as per their business needs. The
table below (Table H) is neither comprehensive nor specific and presents only to provide an
indication as to the typical requirement for set up or the expansion needs of a small sized
business within this segment.
Table H: Indicative Equipment Requirement Cost PKR
Flatbed sewing machine 500,000
Cylinder bed sewing machine 300,000
Over lock machine (local) 50,000
Over lock machine (imported) 100,000
Dark Seam Sewing machine 150,000 – 4,000,000
Button sewing machine auto (local) 50,000
Button sewing machine auto (imported) 200,000
Button hole making machine 1,000,000
Leather skiving machine 200,000 – 500,000
Flexible dummy 200,000
Fusing Application 100,000 – 300,000
Leather stitching Machine 50,000 – 100,000
Leather Ironing Press 300,000
Research Report on ‘Leather Products’ Segment Section
Proposed Banking Product Suite 6
28
10%14%
7%2%
11%
65%
0%
10%
20%
30%
40%
50%
60%
70%
Business assets Business vehicle
financing
Long term equipment financing
project financing
Trade financing Working Capital/
Overdraft
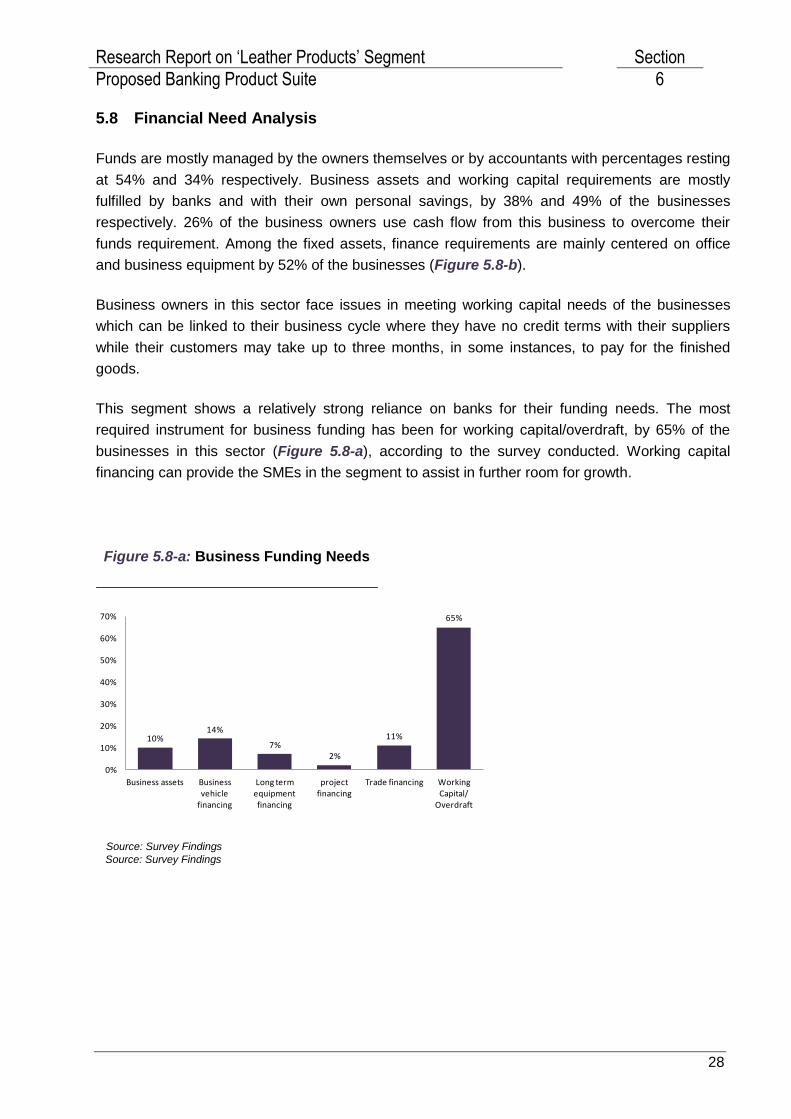
5.8 Financial Need Analysis
Funds are mostly managed by the owners themselves or by accountants with percentages resting
at 54% and 34% respectively. Business assets and working capital requirements are mostly
fulfilled by banks and with their own personal savings, by 38% and 49% of the businesses
respectively. 26% of the business owners use cash flow from this business to overcome their
funds requirement. Among the fixed assets, finance requirements are mainly centered on office
and business equipment by 52% of the businesses (Figure 5.8-b).
Business owners in this sector face issues in meeting working capital needs of the businesses
which can be linked to their business cycle where they have no credit terms with their suppliers
while their customers may take up to three months, in some instances, to pay for the finished
goods.
This segment shows a relatively strong reliance on banks for their funding needs. The most
required instrument for business funding has been for working capital/overdraft, by 65% of the
businesses in this sector (Figure 5.8-a), according to the survey conducted. Working capital
financing can provide the SMEs in the segment to assist in further room for growth.
Source: Survey Findings
Figure 5.8-a: Business Funding Needs
Source: Survey Findings

Research Report on ‘Leather Products’ Segment Section
Proposed Banking Product Suite 6
29
36%
12%
35%
52%
0%
10%
20%
30%
40%
50%
60%
Buildings Furniture and Fittings Machinery and Equipment
Office and Busines Equipment
Figure 5.8-b: Fixed Assets Finance Requirements
Source: Survey Findings

Research Report on ‘Leather Products’ Segment Section
Proposed Banking Product Suite 6
30
5.9 Usage of Banking Products
The owners are mostly unaware of any SME segment specific efforts made by the Government of
Pakistan; however, some business owners are receptive to potential loan products offered by
banks and have also availed the facility of loan products for business funding needs.
More than half of the business owners listed the key driver in choosing a certain bank being family
bank and courteous and friendly staff. Most of the owners are not keen to propose any feature or
product to be offered by the bank. Very few suggested loan with lesser mark up would be
favourable for them.
Approximately 60% of the segment use Banks which is encouraging. The remaining business
owners either cited lack of documentation, not having funding needs requirement or find banks to
be costly as the main reason not using banks.
In addition to that, it was also observed that other services such as cash management, money
transfer, and payroll are encouraged by the segment, the majority of segment showed interest in
availing money transfer facility, the percentage resting at 51%, whereas cash management /
collection services are desired by 40%.
34% of the respondents do not pay for any of the proposed insurance products; amongst the rest
of the business owners, half of them have insurance for motor vehicles. The remaining has legal
expense insurance or property insurance. Almost none of the business owners are interested in
availing any insurance product in future as they prefer to avail such products directly from
insurance companies.
50% of the businesses in the sector were availing advisory services, from which, 26% of the
businesses were paying for it, and the rest were availing the same from their family members or
business colleagues. Some businesses also seek association for nonprofessional advisory with
71% being satisfied with their current source of advisory services. 14% of the business owners
are willingly to pay for such services if provided by the banks.
Banking Product Usage Percentage
Deposit (Checking) Account 61%
Term Deposits 25%
Loan Products 29%
Research Report on ‘Leather Products’ Segment Section
Proposed Banking Product Suite 6
31
5.10 Segment Risk Considerations
The sector is less risky as compared to some of the other businesses operating in Pakistan. The
underlying reason is the country‟s high reserves of raw material sources. More than half of the
owners are operating from owned factory. The risks pertaining to the segment are discussed
below:
Businesses in the segment are largely individual proprietorships having this business as the only
source of income. The sector mostly listed of non-repayment of loans from banks as their biggest
risk to the business, followed by scarce raw material, with the percentage resting at 84% and 41%
respectively. This can be due to the high smuggling of livestock leading to the need to import raw
materials. This leads to incurring high cost and so making it difficult for the small businesses to
buy raw material.
All businesses in the sector prepare Financial Statements but only 58% of the businesses stated
that they have an audit of their financial statements. This indicates that 42% of the businesses
may lack integrity and accuracy in their financial position. The survey analysis also demonstrates
that the segment operates in a competitive market with more than half of the businesses having
more than ten competitors. About 20% of the businesses are not consistent in meeting their
material needs by any particular supplier and 8% need a new supplier due to inconsistent raw
material quality.
88% of the businesses address business risk through more capital investment, followed by man
power training by 33% of the business owners (Figure 5.10-b). Very few businesses (4%) focus
on inventory management.
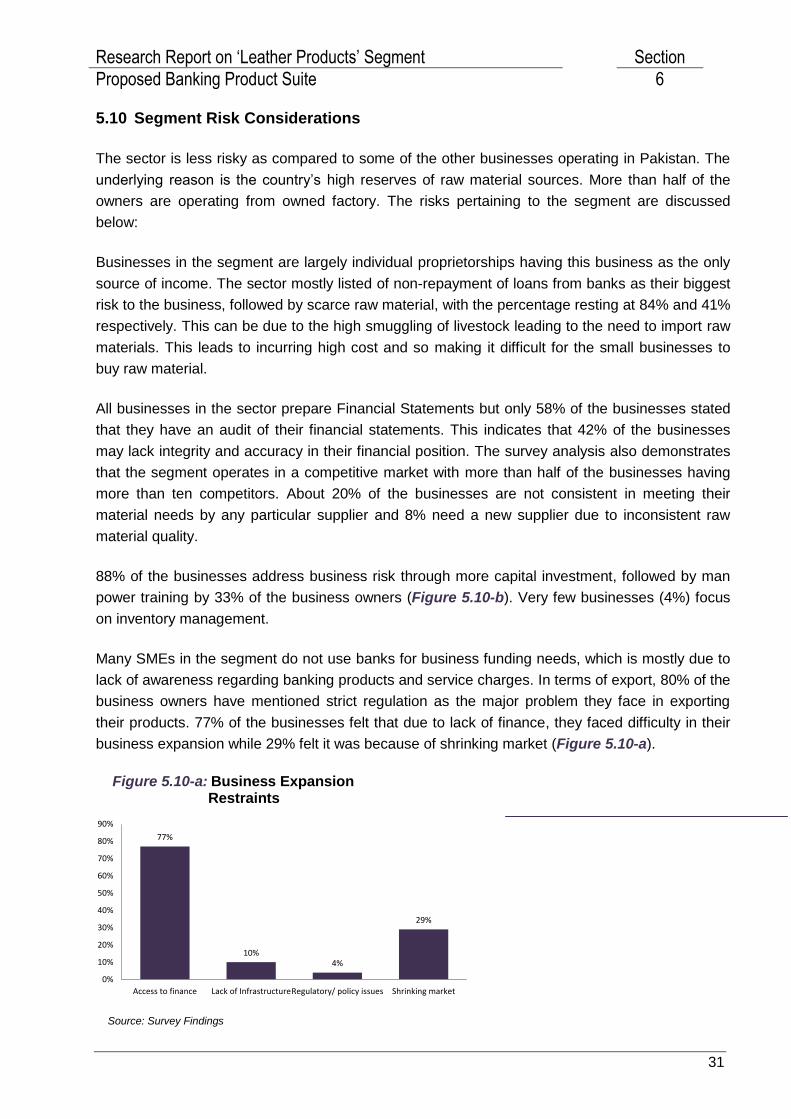
Many SMEs in the segment do not use banks for business funding needs, which is mostly due to
lack of awareness regarding banking products and service charges. In terms of export, 80% of the
business owners have mentioned strict regulation as the major problem they face in exporting
their products. 77% of the businesses felt that due to lack of finance, they faced difficulty in their
business expansion while 29% felt it was because of shrinking market (Figure 5.10-a).
Source: Survey Findings
Figure 5.10-a: Business Expansion Restraints
77%
10%4%
29%
0%
10%
20%
30%
40%
50%
60%
70%
80%
90%
Access to finance Lack of InfrastructureRegulatory/ policy issues Shrinking market

Research Report on ‘Leather Products’ Segment Section
Proposed Banking Product Suite 6
32
88%
4%
33%
3% 2%
0%
10%
20%
30%
40%
50%
60%
70%
80%
90%
100%
Capital Inventorymanagement
Manpower training Productinnovation/cost
reduction
Reduction in profitmargin
Following are the strengths and weaknesses inherent in this sector:
Strengths
High quality of leather production
High capacity for increase in production
Huge export potential
Easy availability of labor
Weaknesses
Low supply of raw material
Low productivity
High cost of production
Export of low value added products
No waste management policy
Further, the risks inherent to the segment include:
Uneven cash flows
Limited resources for expansion
Business uncertainty due to changing import and export policies
Unaudited financial statements
Lack of succession planning
Possible Mitigating Factors:
Lending only to those businesses which have been operating for more than three years
Proposing products to business with a verifiable banking history of more than two years
Review of accounts and register of invoices
Review of ownership documents of business premises
Review to export and import registration documents
Figure 5.10-b: How Business Risk Addressed
Source: Survey Findings

Research Report on ‘Leather Products’ Segment Section
Proposed Banking Product Suite 6
33
6 Proposed Banking Product Suite
6.1 Product Features
Based on our primary and secondary research we propose the following for growth of „Leather
Product‟ sector:
Asset Products:
Working capital/overdraft Finance Facility
Leather good processing machinery leasing
Industrial Power Generator Leasing
Export Refinance
Liability Products:
Business Bank Account
Other products
Banc assurance
Branchless Banking (Mobile)
Utility Bill Payment

Research Report on ‘Leather Products’ Segment Section
Proposed Banking Product Suite 6
34
Table I: Working capital/Overdraft Finance Facility
Particular Details
Initial deposit Minimum initial deposit of PKR 10,000
Tenure 3 years with no requirement of Annual Cleanup for principle amount.
However, regular payment of markup is must for renewal of limit.
Loan Limit
Minimum Limit - PKR 2,000,000
Maximum Limit - PKR 50,000,000
Minimum and maximum loan limits are reviewed annually
Total loan limit offered will not exceed an average six months of usage
determined over a period of the last three years
(Maximum limit is set based on 50% mark-up of average revenue estimated for this
sector)
Documentation One time documentation (as required by banks) for a period of three
years
Repayments &
Withdrawals
Flexible repayment conditions: Regular quarterly payment of mark up.
lump sum payment of principle on the due date or partial repayments
Multiple withdrawals are allowed during the tenure of loan
Cleanup
Borrower is liable to clear the entire loan amount, both principal and
markup, once in a year on a date indicated by the borrower & mutually
agreed by the bank
Markup As per prevailing KIBOR and spread
Markup charges Mark up will be charged only on the amount utilized by the borrower
Renewal Renewal will be on the basis of fresh application, subject to clearing of
markup and satisfactory credit history
Penalty No early repayment penalty may be imposed on the borrower (subject
to banks discretion)
Insurance Mandatory insurance as per SBP guidelines
Security Raw material stock. Mortgage of business premises for those who
operate from owned premises.

Research Report on ‘Leather Products’ Segment Section
Proposed Banking Product Suite 6
35
Table J: Leather Product Making Machinery Leasing
Particular Details
Initial deposit Minimum initial deposit of PKR 50,000
Salient Features
Equipment & machinery leasing will be provided for expansion capital
only to businesses who have been operating for 3 or more years
A list of pre-approved equipment and machinery manufacturers will be
developed based on information received from trade association and
market reputation
Credit facility will be offered directly through pre-approved equipment
and machinery vendors
Tenure 3 - 5 years
Loan Limit
Minimum Limit - PKR 5,000,000
Maximum Limit - PKR 50,000,000
Documentation
One time documentation required for a period of three years
Financial Statements
Repayments &
Withdrawals Repayments will be based upon preset Equal Monthly Installments
Markup As per prevailing KIBOR and spread
Penalty As per existing bank policies and cost of charges
Insurance Mandatory insurance as per SBP guidelines
Security/Collateral 5% of invoice as security deposit and hypothecation of leased assets.
Provision of collateral as per satisfaction of the bank

Research Report on ‘Leather Products’ Segment Section
Proposed Banking Product Suite 6
36
Table K: Industrial Power Generator Leasing
Particular Details
Down Payment Minimum down payment of 20%
Salient Features
Loan amount will be directly transferred to suppliers‟ accounts against
invoices
Credit facility will be offered directly through pre-approved generator
suppliers
Tenure 3-5 years
Documentation
Business Financial Statements
Proof of business operation for last three years
Loan Limit
Minimum Limit - PKR 500,000
Maximum Limit - PKR 10,000,000
Repayments &
Withdrawals Repayments will be based upon present Equal Monthly Installments
Markup As per prevailing KIBOR and spread
Insurance Mandatory Insurance facility as per SBP guidelines
Penalty As per existing bank policies and cost of charges

Research Report on ‘Leather Products’ Segment Section
Proposed Banking Product Suite 6
37
Table M: Other Products
Particular Details
Banc assurance
Bancassurance products such as Business Premises Insurance,
Personal Injury Insurance, Equipment and Vehicle insurance can be
proposed by banks through its channels offering reasonable rates and
servicing through banking channels such as direct debit
Branchless Banking
(Mobile)
Mobile banking services for instance balance check, bill payment and
funds transfer
Utility Bill Payment
Service for easy payment of electricity, gas, telephone and cell phone
bills
Table L: SME Business Bank Account
Particular Details
Account Type Non-remunerative Current Account
Documentation CNIC/Smart NIC, completion of KYC requirements as per SBP
Regulations
Facilities
Cheque Book
Upgraded ATM facilities
Business Visa Debit Card
Phone Banking
Mobile Banking
Internet Banking
Monthly account statement

Research Report on ‘Leather Products’ Segment Section
Proposed Banking Product Suite 6
38
Table N: Export Refinance
Particular Details
Initial deposit Any form of collateral which the banks feel fit.
Tenure Depends on the contract terms of LC
Documentation One time documentation required for a period of one years which may
include financial statements, company legal registration documents etc.
Markup As per prevailing KIBOR and spread
Penalty As per existing bank policies and cost of charges
Insurance Mandatory insurance as per SBP guidelines
Security As per the requirement and satisfaction of bank.

Research Report on ‘Leather Products’ Segment Section
Proposed Banking Product Suite 6
39
6.2 Eligibility Criteria for Asset Products
Table O: Asset Products Criteria
Indicators Description
Borrower
Eligibility
Analysis
During assessment of customers, take into account the total indebtedness of the
potential borrower, his disposable income and ensure that the total financing to
customer does not exceed the prescribed limits as laid down in approved policies of
bank. Borrower should be in business of „Leather Product‟ for the past three years
and hold a valid CNIC/smart NIC.
Business
Analysis
To assess the Borrower‟s position, verification of their revenues can be verified by
the bank. Business premises ownership documents should be verified against name
of the owner.
Credit
worthiness
Credit worthiness of the borrower may be ascertained by collecting information from
e-CIB or other credit information bureaus.
Financial
parameters
To assess average expenses, income generated and repayment capacity of the
borrower.
Adherence to
Lending
Standards
To assess that Customer/ Borrower requirements are in compliance with standards
set for revolving finance scheme by the Bank and/ or Regulatory Authorities.
Banking
History Verifiable banking history of more than one year with active accounts
Business
Operations
Business should be in operation for more than three years. If the business is
involved in exporting their finished goods then they should be involved in export
business for the last 3 years.
Trade body
membership Business should be a member of the sector‟s trade body.
Research Report on ‘Leather Products’ Segment Section
Distribution and Communication Considerations 7
40
7 Distribution and Communication Considerations
SMEs in „Leather Products‟ are spread out mostly in urban cities of the country; therefore they can
be reached and targeted in major clusters to promote banking products of leather product
processing segment in the urban cities.
7.1 Marketing Objectives of Banks
Marketing objectives for building and promoting the brand image of SME Products for „Leather
Products‟ are as follows:
The banks may:
Work with the leather industry associations for events, generate better understanding of the
sector and create awareness
Educate the leather product manufacturers, create awareness for financial needs and banking
products in the identified market regions
Develop strategies to attract a large number of leather product manufacturers to avail banks‟
lending/financial products
Increase direct interaction of Relationship Managers with leather manufacturers to promote
more direct and close communication with the business owners and to assist small
businesses in navigating difficult economic and business conditions
Provide sponsorships for trade fairs and exhibitions which link the promotion of bank‟s brand
image with exposure and building awareness of SME businesses products locally and
worldwide
7.2 Promotional Activities by Banks
To create awareness of SME specific products in the target market, the banks may aggressively
advertise their banking products through various promotional programs and events:
– Conduct Workshops in coordination with Pakistan Leather Garments Manufacturers &
Exporters Association and Pakistan Tanners Association to provide more interaction to
business owners with trade associations to enhance communication between them regarding
industry specific issues.
– Organize promotional events in cluster locations or near businesses to build strong image of
the bank among the target audiences
Banks can service these SMEs through the following proposed channels: (Please note that this
list is not exhaustive):
Direct Sales Agents
Tele Sales
Trade association backed seminars

Research Report on ‘Leather Products’ Segment Section
Distribution and Communication Considerations 7
41
Branches in cluster locations
Involvement in trade fairs and exhibitions
7.3 Distribution Strategy for Banks
As primary means of customer service and sales interaction, distribution channels play a central
role in the customer relationship process, which further increases growth. Banks‟ challenge is to
improve and integrate their multiple distribution channels to consistently deliver an enhanced
experience and foster better customer relationships. Top priority is placed in attracting and
retaining customers within and across these channels.
To reach maximum percentage of target market, Banks need to have a comprehensive
distribution strategy. Banks should aim to cater banking needs of leather product sector through
its products on national basis in major cities of the country where leather manufacturing units are
located. Initially the banks may provide financing facility in main cities of the country but will
however penetrate into other small business markets after establishing strong presence in major
cities.
Banks may adopt following conventional channels for distribution:
Direct Sales Agent: This activity may be outsourced and a trained marketing team should
periodically visit identified areas within the cities, to educate potential customers and create
awareness of the products and services being offered under SME Products Suite.
F2F interactions: A deeper level of interaction may provide an integrated customer focus, by
relationship managers involved in face to face interaction, which will become critical in helping
better communication for product awareness and in addressing hesitations faced by the
business owners.
Following Technology based alternate delivery channels can also be adopted for distribution
Internet Banking: With technology up gradation mobile phones have become sophisticated
and capable of handling advanced applications and services, so banking via mobile phones
appeal to consumers on multiple fronts.
Short Message Service (SMS): Marketing team can send out mass messages in Urdu or
English to „Leather Products‟ segment for advertising bank‟s products