ALASKA NORTH SLOPE ROYALTY STUDY 4 PRESENTATION …
73
PREPARED FOR THE STATE OF ALASKA ALASKA NORTH SLOPE ROYALTY STUDY PRESENTATION TO SENATE RESOURCES COMMITTEE FEBRUARY 10, 2014
Transcript of ALASKA NORTH SLOPE ROYALTY STUDY 4 PRESENTATION …

PREPARED FOR THE STATE OF ALASKA
ALASKA NORTH SLOPE ROYALTY STUDY PRESENTATION TO SENATE RESOURCES COMMITTEE
FEB
RU
AR
Y 1
0, 2
01
4

AL
AS
KA
NO
RT
H S
LO
PE
RO
YA
LT
Y G
AS
ST
UD
Y
2
Peter Abt is a Managing Director in Black & Veatch’s Management Consulting Division. He leads the firm’s Oil & Gas Strategy practice and holds primary responsibility for delivering advisory services to meet client needs. Mr. Abt has over 32 years of experience in the energy industry focused primarily on natural gas and LNG commercial development. Mr. Abt holds an M.B.A., from the University of Houston and a B.S., Petroleum Engineering from the University of Oklahoma
Deepa Poduval is a Principal in Black & Veatch’s Management Consulting Division and is responsible for business strategy and project management. Ms. Poduval focuses on strategic analytical services supporting energy asset valuation and optimization, marketing and business strategy development. She has been involved in providing analysis and commercial support related to Alaska North Slope gas monetization for eight years. Ms. Poduval holds an M.E.M. from Dartmouth College and a M.Sc. Economics and B.E., Mechanical Engineering from BITS, Pilani, India.
Jason De Stigter is a Senior Consultant with Black & Veatch’s Management Consulting Division and is responsible for business analysis and project management. Mr. De Stigter’s client engagements center on economic, financial, market, and risk analysis of large capital projects. He has extensive experience in developing complex and innovative economic and risk analysis models. Mr. De Stigter holds a B.E., Mechanical Engineering and a B.A. Business Administration from Dordt College and is a Professional Engineer.
BLACK & VEATCH PRESENTERS
2

AL
AS
KA
NO
RT
H S
LO
PE
RO
YA
LT
Y G
AS
ST
UD
Y
3
3
This presentation was prepared for the State of Alaska (“Client”) by Black & Veatch Corporation (“Black & Veatch”) and is based in part on information not within the control of Black & Veatch.
In conducting our analysis, Black & Veatch has made certain assumptions with respect to conditions, events, and circumstances that may occur in the future. The methodologies we utilize in performing the analysis and making these projections follow generally accepted industry practices. While we believe that such assumptions and methodologies as summarized in this report are reasonable and appropriate for the purpose for which they are used; depending upon conditions, events, and circumstances that actually occur but are unknown at this time, actual results may materially differ from those projected.
Readers of this presentation are advised that any projected or forecast price levels and price impacts reflect the reasonable judgment of Black & Veatch at the time of the preparation of such information and are based on a number of factors and circumstances beyond our control. Accordingly, Black & Veatch makes no assurances that the projections or forecasts will be consistent with actual results or performance. To better reflect more current trends and reduce the chance of forecast error, we recommend that periodic updates of the forecasts contained in this presentation be conducted so recent historical trends can be recognized and taken into account.
Neither this presentation, nor any information contained herein or otherwise supplied by Black & Veatch in connection with the services, shall be released or used in connection with any proxy, proxy statement, and proxy soliciting material, prospectus, Securities Registration Statement, or similar document without the written consent of Black & Veatch.
Use of this presentation, or any information contained therein, shall constitute the user’s waiver and release of Black & Veatch from and against all claims and liability, including, but not limited to, any liability for special, incidental, indirect or consequential damages, in connection with such use. In addition, use of this presentation or any information contained therein shall constitute an agreement by the user to defend and indemnify Black & Veatch from and against any claims and liability, including, but not limited to, liability for special, incidental, indirect or consequential damages, in connection with such use. To the fullest extent permitted by law, such waiver and release, and indemnification shall apply notwithstanding the negligence, strict liability, fault, or breach of warranty or contract of Black & Veatch. The benefit of such releases, waivers or limitations of liability shall extend to Black & Veatch’s related companies, and subcontractors, and the directors, officers, partners, employees, and agents of all released or indemnified parties. USE OF THIS PRESENTATION SHALL CONSTITUTE AGREEMENT BY THE USER THAT ITS RIGHTS, IF ANY, IN RELATION TO THIS PRESENTATION SHALL NOT EXCEED, OR BE IN ADDITION TO, THE RIGHTS OF THE CLIENT.
BLACK & VEATCH STATEMENT

AL
AS
KA
NO
RT
H S
LO
PE
RO
YA
LT
Y G
AS
ST
UD
Y
4
• The Alaska North Slope Royalty Study was undertaken between June 2013 and November 2013 and, hence, preceded finalization of the Heads of Agreement (“HOA”) between ExxonMobil, ConocoPhillips, BP, TC Alaska, AGDC, and the State Administration as well as the Memorandum of Understanding (“MOU”) between the State Administration and TransCanada.
• While the study informed the State Administration as it negotiated the HOA and the MOU, the study, and this presentation summarizing it, do not analyze the specific terms within these agreements or their impacts on the competitiveness of the AKLNG project.
• The attached supplemental analysis summarizes ongoing analysis of some specific terms in the MOU and HOA and their impacts on the State of Alaska.
4
NOTE ON ALASKA NORTH SLOPE ROYALTY STUDY

AL
AS
KA
NO
RT
H S
LO
PE
RO
YA
LT
Y G
AS
ST
UD
Y
5
5
• The Alaska Liquefied Natural Gas (AKLNG) project is a proposed project to liquefy Alaska North Slope (ANS) gas and export it as LNG, primarily to Asian markets
• The project is comprised of three main components: —Gas treatment plant (GTP), —Pipeline —Liquefied natural gas (LNG) plant
• The total estimated capital cost of the project is $45 billion falling within a range of $39-$54 billion
• Natural gas to supply the project is anticipated to come from the proven reserves at the Prudhoe Bay and Point Thomson units on the Alaska North Slope
• The key project sponsors are Exxon Mobil, ConocoPhillips and BP (referred to in this study as Producers) with potential participation by TransCanada and the State of Alaska
• Target final investment decision for the project is projected around 2017-18 with a commercial operation date around 2023-24
EXECUTIVE SUMMARY – BACKGROUND & SCOPE

AL
AS
KA
NO
RT
H S
LO
PE
RO
YA
LT
Y G
AS
ST
UD
Y
6
6
• The AKLNG Project has recently seen momentum with the 3 Producers along with TransCanada coming together to evaluate and advance the AKLNG Project
• The AKLNG Project has the potential to provide hundreds of billions of dollars in value to the State of Alaska as well as the project’s investors; the benefits to Alaskans include new revenues, affordable energy supplies, new jobs and economic activity
• The State of Alaska, Department of Natural Resources (DNR) commissioned a study to document and understand four major commercial elements that could influence the various stakeholders’ returns from the AKLNG Project:
—LNG markets —Supply chain elements —Fiscal framework – International and Alaska —Risk allocation/commercial structure
EXECUTIVE SUMMARY – BACKGROUND & SCOPE
AL
AS
KA
NO
RT
H S
LO
PE
RO
YA
LT
Y G
AS
ST
UD
Y
7
7
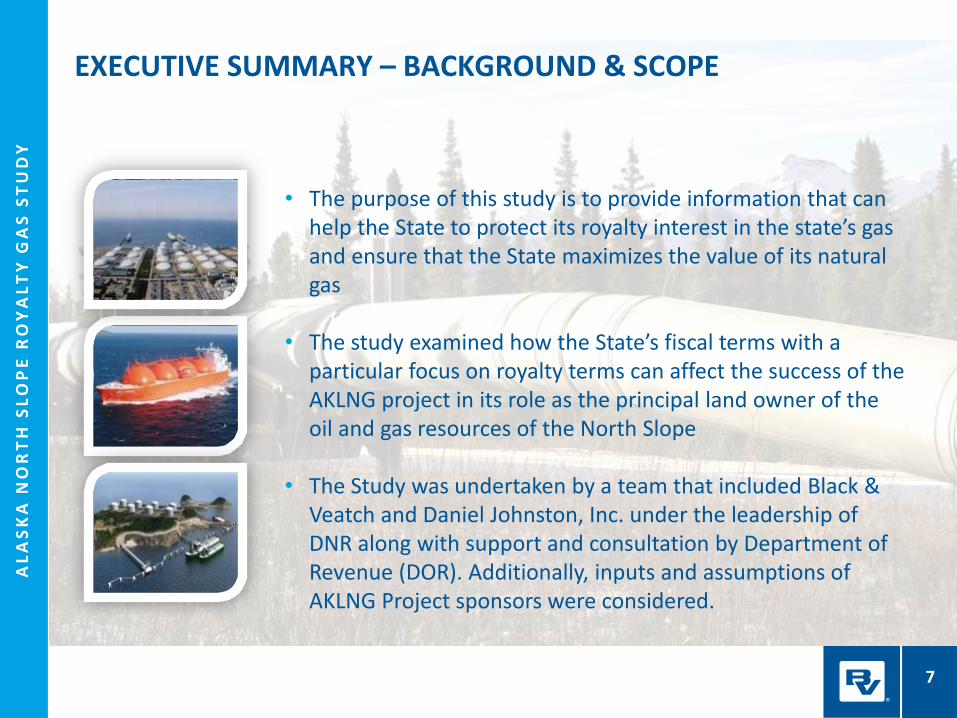
• The purpose of this study is to provide information that can help the State to protect its royalty interest in the state’s gas and ensure that the State maximizes the value of its natural gas
• The study examined how the State’s fiscal terms with a particular focus on royalty terms can affect the success of the AKLNG project in its role as the principal land owner of the oil and gas resources of the North Slope
• The Study was undertaken by a team that included Black &
Veatch and Daniel Johnston, Inc. under the leadership of DNR along with support and consultation by Department of Revenue (DOR). Additionally, inputs and assumptions of AKLNG Project sponsors were considered.
EXECUTIVE SUMMARY – BACKGROUND & SCOPE

AL
AS
KA
NO
RT
H S
LO
PE
RO
YA
LT
Y G
AS
ST
UD
Y
8
8
• Assessment of a project of the scope of AKLNG requires examination of numerous complex variables that cannot be determined with a high degree of certainty
• In most cases, a conservative approach was taken when applying forecasts and assumptions
• Many reasonable scenarios can be derived where the AKLNG
project is economic, and vice versa
• It should be recognized that market and project related variables, that remain as yet unresolved, can modify the economics as presented here
• The findings in this study represent Black & Veatch’s view based on the information available to date and do not necessarily represent the views of the State of Alaska
EXECUTIVE SUMMARY – BACKGROUND & SCOPE

AL
AS
KA
NO
RT
H S
LO
PE
RO
YA
LT
Y G
AS
ST
UD
Y
9
EXECUTIVE SUMMARY – KEY FINDINGS
9
LNG Markets
• The LNG market is characterized by highly capital intensive projects underpinned by long-term contractual relationships across the supply chain
• The LNG market is in an illiquid, opaque market consisting of very few participants and is structured on the basis of long-term, 20+ year contracts as opposed to the global oil market which is highly liquid, extremely transparent, comprised of many participants and is structured on the basis of short term trade
• Global LNG demand is projected to grow by 50% between 2013 and 2020 and to double by 2030. However potential sources of supply are expanding as well thereby creating significant competition for capturing this growing market
• AKLNG project could be economically feasible with changes to the project’s cost structure and the state’s fiscal framework
• AKLNG will have to compete successfully for buyers in order to meet its targeted 2024 in-service date
Source: Team Analysis, various demand studies
Note: Includes AKLNG, other new projects, and projects under development.
Global LNG demand – various forecasts, Mtpa

AL
AS
KA
NO
RT
H S
LO
PE
RO
YA
LT
Y G
AS
ST
UD
Y
10
10
EXECUTIVE SUMMARY – KEY FINDINGS
Supply Chain Elements
• In line with the rising costs of LNG projects world-wide, AKLNG project cost estimates have risen by 67% since an equivalent project was evaluated in 2008 to a current estimate of $45 Billion for the GTP, Pipeline and LNG liquefaction and marine facilities. Equivalent estimates from AKLNG project sponsors are in the range of $37 - $54 Billion.
• Large, complex LNG projects typically have an integrated commercial structure from production through liquefaction to give project sponsors maximum control across the supply chain.
• The AKLNG project is expected to have an integrated structure
• Ensuring transparency along the supply chain, open access for third parties and alignment of interests between the State and Producers become challenging with a Producer-owned integrated project.
AL
AS
KA
NO
RT
H S
LO
PE
RO
YA
LT
Y G
AS
ST
UD
Y
11
EXECUTIVE SUMMARY – KEY FINDINGS
Fiscal Framework
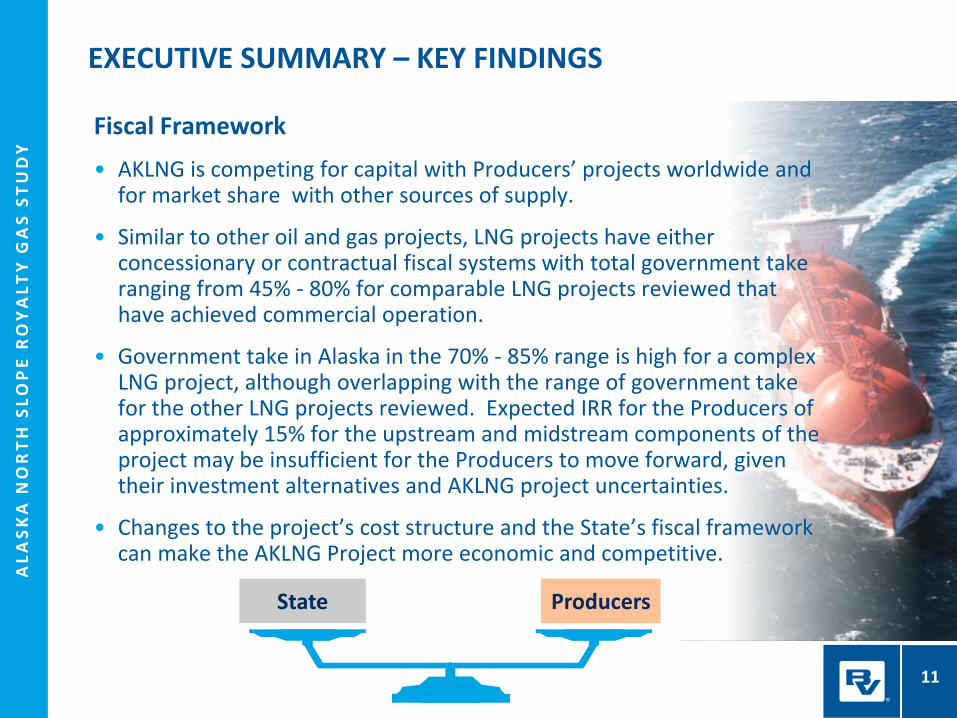
• AKLNG is competing for capital with Producers’ projects worldwide and for market share with other sources of supply.
• Similar to other oil and gas projects, LNG projects have either concessionary or contractual fiscal systems with total government take ranging from 45% - 80% for comparable LNG projects reviewed that have achieved commercial operation.
• Government take in Alaska in the 70% - 85% range is high for a complex LNG project, although overlapping with the range of government take for the other LNG projects reviewed. Expected IRR for the Producers of approximately 15% for the upstream and midstream components of the project may be insufficient for the Producers to move forward, given their investment alternatives and AKLNG project uncertainties.
• Changes to the project’s cost structure and the State’s fiscal framework can make the AKLNG Project more economic and competitive.
State Producers

AL
AS
KA
NO
RT
H S
LO
PE
RO
YA
LT
Y G
AS
ST
UD
Y
12
EXECUTIVE SUMMARY – KEY FINDINGS
Fiscal Framework
• Incentives including modifications in royalty and/or production tax are among the alternatives available to the State to help improve the relative competitiveness of the project under various scenarios.
• There are various risks to the State from significantly reducing or eliminating its royalty share;
—Royalties represent Alaska’s ownership stake and reducing royalties has implications for the Alaska Permanent Fund
—Royalty reduction would not protect the State from risks posed by misalignment between the State and Producers interests wherein Producers are able to shift revenues between upstream and midstream components of the project to the detriment of the State
State Producers

AL
AS
KA
NO
RT
H S
LO
PE
RO
YA
LT
Y G
AS
ST
UD
Y
13
EXECUTIVE SUMMARY – KEY FINDINGS
Fiscal Framework
• In reviewing alternatives for royalty, an election by the State to take its royalty in-kind (RIK) could result in a substantial increase in the State’s risk exposure and potential loss of royalty value.
—An election by the State to take its royalty in-kind could necessitate the need for the State to enter into a large number of complex commercial agreements. The State would be disadvantaged in the creation of such agreements by its statutory and regulatory structure (e.g., the need for legislative modifications), its inexperience in LNG negotiation, its status as a new entrant to the market, and the lack of an LNG supply portfolio to optimize. Risks associated with RIK could result in lower pricing for our LNG
—Producers have more experience managing the exposures to market risk
• An election by the State to take its royalty in value presents potential for dispute on valuation and deductions and misalignment of interests with the Producers.
—However, the State has experience in addressing these challenges through settlement agreements that provide more certainty and clarity
RIK RIV

AL
AS
KA
NO
RT
H S
LO
PE
RO
YA
LT
Y G
AS
ST
UD
Y
14
EXECUTIVE SUMMARY – KEY FINDINGS
Risk Allocation
• Oil and LNG prices and capital costs emerge as the key factors among the various risks impacting the AKLNG project’s economics
• Direct equity participation in the project can align the State with the Producers and reduce the cost structure of project for project sponsors but potentially exposes the State to additional risks
• Commercial terms related to equity participation such as position on the management committee and voting rights will determine the extent to which the State can achieve its objectives for open access and transparency

AL
AS
KA
NO
RT
H S
LO
PE
RO
YA
LT
Y G
AS
ST
UD
Y
15
15
• The AKLNG Project can be economically feasible and competitive with changes to the project’s cost structure and the State’s fiscal framework
• Fiscal and non-fiscal incentives can aid in improving the commercial attractiveness of the project
— Fiscal – cost sharing, reduction in government take — Non-fiscal – stabilization provisions, modifications to existing
lease terms such as the notice period of the State’s rights to switch between RIK and RIV
• Integrated project ownership of AKLNG by the Producers presents the risk of misalignment wherein project revenues could be moved between the upstream and the midstream components to maximize value to the Producers. These decisions could potentially be to the detriment of the State.
EXECUTIVE SUMMARY – CONCLUSIONS

AL
AS
KA
NO
RT
H S
LO
PE
RO
YA
LT
Y G
AS
ST
UD
Y
16
16
• Fiscal structure changes beyond stand-alone royalty share or tax rate modification can help in improving project economics and creating alignment:
— Direct participation by the State in the project — Establishment of a gross share of gas in lieu of production tax
• Direct state equity participation in the project can provide
key benefits to the State including : — Create alignment of interests; — Create transparency through the midstream portion of the
supply chain; — Facilitate third-party access to the mid-stream; — Potentially increase State cash flows, and improve producer
economics.
EXECUTIVE SUMMARY – CONCLUSIONS

AL
AS
KA
NO
RT
H S
LO
PE
RO
YA
LT
Y G
AS
ST
UD
Y
17
17
• Going further, establishment of a gross share of gas in lieu of production tax and corresponding equity investment in the project may provide the needed alignment for a competitive project such that the State can maximize the value of its resources.
• The State has the ability to lessen project risk, but will need to weigh those opportunities circumspectly - risk mitigation and commercial agreements need to be addressed carefully to define the State’s rights and obligations, manage risk exposure and to achieve objectives of transparency and open access for third parties
EXECUTIVE SUMMARY – CONCLUSIONS
AL
AS
KA
NO
RT
H S
LO
PE
RO
YA
LT
Y G
AS
ST
UD
Y
18
LNG MARKETS – SCOPE
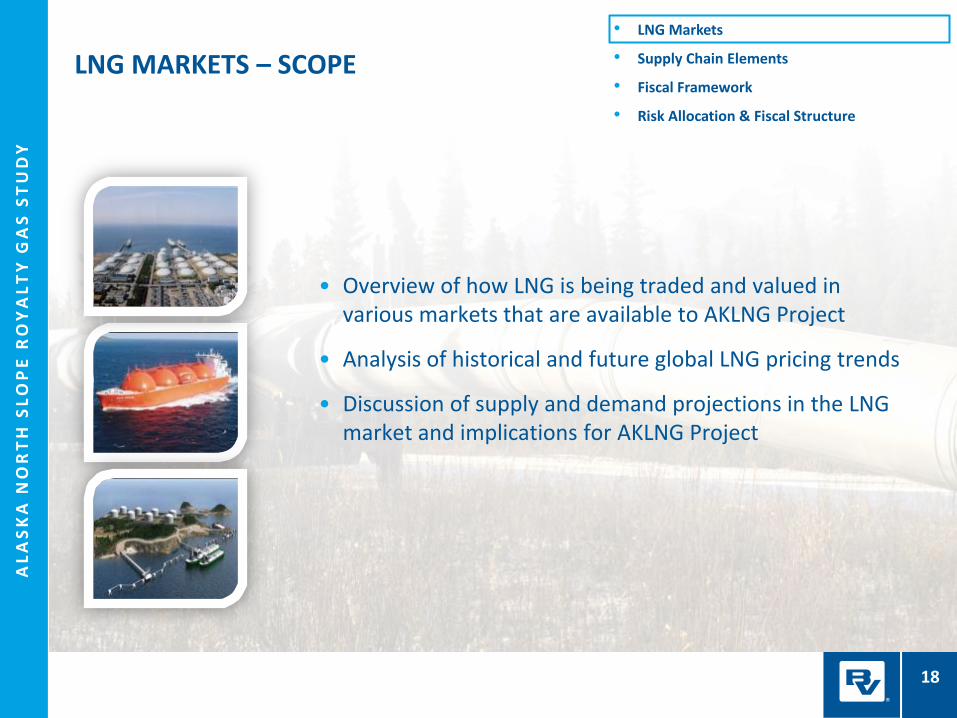
• Overview of how LNG is being traded and valued in various markets that are available to AKLNG Project
• Analysis of historical and future global LNG pricing trends
• Discussion of supply and demand projections in the LNG market and implications for AKLNG Project
• LNG Markets
• Supply Chain Elements
• Fiscal Framework
• Risk Allocation & Fiscal Structure

AL
AS
KA
NO
RT
H S
LO
PE
RO
YA
LT
Y G
AS
ST
UD
Y
19
19
CURRENT LNG MARKET REALITIES
• Highly concentrated – 7 countries account for 70% of demand
• Asia Pacific accounts for 70% of global trade
• Growing rapidly – 8% per annum over the past 5 years
• LNG Supply is also highly concentrated – 8 exporting countries provided 83% of global LNG exports in 2012
• Liquefaction capacity is rarely developed on a speculative basis
– Liquefaction facilities typically cost US$5-20bn
– LNG facilities are generally project financed, requiring firm revenue commitments
– LNG specifications vary by each project and between buyers
• Dominated by long term contracts (LTCs)
– ~75% of global trade was delivered under LTCs in 2011 and in 2012
– Trade in Pacific basin is driven by LTCs more than in Atlantic basin
• No liquid market to provide price markers for LNG
• Price structure needs to give buyers and sellers reasonable certainty over 20 years
• Oil/oil product price linkage has been standard since the 1970s
• This link is usually defined in form of a formula with slope to oil price and constant
Demand/ key markets
Supply
Contracts/ pricing
SOURCE: BP Statistical review of world energy; GROUPE INTERNATIONAL DES IMPORTATEURS DE GAZ NATUREL LIQUEFIE (GIIGNL), Team Analysis

AL
AS
KA
NO
RT
H S
LO
PE
RO
YA
LT
Y G
AS
ST
UD
Y
20
20
• Crude linked contracts are signed by most suppliers excluding North American export terminals
– Between 2002-2006, some low price contracts were signed by China/Japan
– From 2007, most recent contracts signed have a 14% - 15 % effective slope for the relationship of LNG price ($/mmbtu) to crude price ($/Bbl)
• Emergence of Henry Hub linked US LNG tolling agreements has created an alternative to traditional crude linked contracts
– Delivered LNG prices under these are currently lower than oil-linked contract prices
– Buyers in countries such as Japan are increasingly asking for these and holding back on traditional contracts
• Apart from pricing, duration of contracts, the nature of commitment, delivery terms and LNG specifications are important features to be considered
• Participants respond to supply and demand changes in a number of ways to protect the price floor
Crude linked contracts
U.S. export contracts
Non price features/ players’ responses
RECENT MARKET DYNAMICS: SUMMARY
SOURCE: Team Analysis

AL
AS
KA
NO
RT
H S
LO
PE
RO
YA
LT
Y G
AS
ST
UD
Y
21
21
OUTLOOK FOR LNG DEMAND GROWTH VARIES ACROSS FORECASTING AGENCIES
SOURCE: Public reports from or referenced information sourced from Wood Mackenzie; EY; BP; GDF Suez
BP
GDF Suez
Wood Mackenzie
Ernst & Young

AL
AS
KA
NO
RT
H S
LO
PE
RO
YA
LT
Y G
AS
ST
UD
Y
22
22
AKLNG: PRESENT VALUE SHARE OF BREAK EVEN PRICE (ZERO NPV FOR PRODUCERS)
(2013 real US$/MMBtu), LNG price delivered ex ship (DES) in Asia
SOURCE: Team Analysis
1 Discount rate used to calculate present value is 8.5% for mid-stream and 10% for upstream 2 Effective ~17.4 Mtpa LNG capacity due to geographic advantage in Alaska 3 Assumes contractor would take on a project where revenue matches its costs, including expected return on equity
Factors Impacting Break-even Price:
US$12.3/MMBtu is a conservative estimate subject to sensitivities
• Can increase the BEP:
‒ Lower ambient temperature advantage (currently assumed 3.0 Mtpa2)
‒ Negative effect of reduced oil production (currently excluded)
‒ Capex increase, labor cost increase
• Can decrease the BEP
‒ Capital productivity
‒ Lower returns
Mid-stream
Upstream
1.0
3.4
0.6
3.2
0.41.0
1.0
0.51.0 $1.00.2 0
12.3
Upstream Costs
LNG Plant GTP & Pipe Costs
Shipping State Take Federal Take
Contractor Present
Value
Break Even Price
(BEP)
Opex
Capex
3
Producer

AL
AS
KA
NO
RT
H S
LO
PE
RO
YA
LT
Y G
AS
ST
UD
Y
23
23
ON THE GLOBAL SUPPLY CURVE, AKLNG APPEARS TO CURRENTLY BE OUT OF THE MONEY, MODIFICATIONS REQUIRED FOR COMPETIVENESS
SOURCE: Team Analysis
ILLUSTRATIVE CHART, ANALYSIS DONE FOR ALL PROJECTS WITH STARTUP AFTER 2013
Planned capacity of the LNG plant, Mtpa
Project break-even levels
IMPLICATIONS:
AKLNG is currently out of the money:
‒ Alaska break-even price is US$12.3/MMBtu
‒ Projects more economic than Alaska can provide ~340 MTPA new supply, more than required to meet global LNG demand (~250 – 300 MTPA)
AKLNG faces significant competition
‒ There are several projects to the right in supply stack which will compete with AKLNG
However, the risk levels of competing LNG projects also needs to be considered
‒ Due to political, resource and other risks, some in the money projects may be delayed/cancelled, leading to range of needed capacity
AKLNG estimate
Range of supply capacity needed to meet 2025 demand
1
2
3
1 NPV=0 @ discounted at Weighted Average Cost of Capital

AL
AS
KA
NO
RT
H S
LO
PE
RO
YA
LT
Y G
AS
ST
UD
Y
24
24 SOURCE: Team Analysis
IN THE LONG RUN THROUGH 2030, LNG MARKET CAN EVOLVE WITHIN A BROAD RANGE
CASE
HIGH CASE
LOW CASE
FACTORS AFFECTING
• North American LNG exports permitted at slow pace
• Non-NA Conventional supplies compete to serve the remaining demand
• Asian demand grows more rapidly than expected • High cost LNG projects in Australia and Russia are
the marginal supplies • Sellers continue to demand high slope oil-linked
contract terms
• North American LNG supply is unconstrained and can meet all uncontracted demand
• Low cost non-NA conventional supplies compete directly with North American exports
• Henry Hub linked US exports become the price setter for Asian LNG
POSSIBLE PRICE RANGE
0
5
10
15
20
25
2030 2025 2020 2015 2010 2005 2000
0
5
10
15
20
25
2030 2025 2020 2015 2010 2005 2000
Typical price range for new Asian LNG contracts
LNG import to China
LNG import to Japan
Japan Crude Cocktail
US$14-18/MMBtu
US$10-14/MMBtu

AL
AS
KA
NO
RT
H S
LO
PE
RO
YA
LT
Y G
AS
ST
UD
Y
25
The LNG market is characterized by capital intensive projects and long-term contracts across the supply chain
The LNG market is illiquid and opaque, with few players, in contrast with the liquid and transparent oil market
LNG demand is expected to grow quickly over the short and long-term, but supply sources are also rapidly expanding
1
2
3
AKLNG appears to be out of the money within the global LNG supply curve under the status quo; cost and /or fiscal modifications could enhance competitiveness
4
SUMMARY: LNG MARKETS

AL
AS
KA
NO
RT
H S
LO
PE
RO
YA
LT
Y G
AS
ST
UD
Y
26
26
SUPPLY CHAIN ELEMENTS – SCOPE
• Overview of the current capital cost estimates for the AKLNG Project
• Review of the capital structures that are likely to be applicable to AKLNG Project
• Discussion and assessment of applicable commercial structures for AKLNG Project
• LNG Markets
• Supply Chain Elements
• Fiscal Framework
• Risk Allocation & Fiscal Structure

AL
AS
KA
NO
RT
H S
LO
PE
RO
YA
LT
Y G
AS
ST
UD
Y
27
PROJECT CAPITAL COSTS UPDATE INCREASES BASELINE AKLNG PROJECT COST TO $45 BILLION (2013$)
Supply Chain
Element 2008 Estimate1
2013 Updates
State’s Estimate Producers Estimate
GTP $5 Billion $10 Billion $10 - $15 Billion
Pipeline $8 Billion $12 Billion $10 - $15 Billion
LNG $14 Billion $23 Billion $17 - $24 Billion
Total $27 Billion $45 Billion $37 - $54 Billion
Black & Veatch Review & Synthesis
2008 Estimates
Input from Pingo Intl. & Westney Consulting
2013 Estimates
1 Capital cost for a 2.7Bcf/d LNG project estimated by the State’s Technical Team during AGIA proceedings.

AL
AS
KA
NO
RT
H S
LO
PE
RO
YA
LT
Y G
AS
ST
UD
Y
28
CAPITAL STRUCTURES VARY FROM PROJECT TO PROJECT DEPENDING ON RISK PROFILE AND PARTNER PREFERENCES
APLNG
Gorgon
LNG
PNGLNG
Capital Structure
(Debt/Equity) Comments
Located at Caution Bay near Port Moresby,
Papua New Guinea LNG is expected to have a
capacity of 6.9 Mtpa and begin operations in
2014.
PNGLNG is an integrated project and was the
beneficiary of $8.3 billion in loans and guarantees
from public export credit agencies.
Partners
Two train design with a capacity of 9.0 Mtpa and
requiring an investment of $23 billion, Australia
Pacific LNG. Train 1 financed $8.5 billion.
Origin operates the upstream segment of the
project; ConocoPhillips operates the LNG facility.
Gorgon LNG’ is the world’s largest capital
investment in an integrated LNG project. The $53
billion 15 mpta project is currently under
construction and first LNG is expected in 2015.
The project is financed through equity
contributions from the partners.
70/30
70/30
0/100
ExxonMobil
Oil Search
Santos
National Petroleum
Company of PNG
Nippon Oil
MRDC
Origin
ConocoPhillips
Sinopec
Chevron
Shell
ExxonMobil
Chubu
Osaka Gas
Tokyo Gas
The Debt / equity ratio that the market can support for a given project is driven by the financial strength of the partners
Qatargas 2
Qatargas 2 Train 1 produces 7.8 Mtpa , Total is
a partner in the second train, which also
produces 7.8 Mtpa 70/30
Qatar Petroleum
ExxonMobil

AL
AS
KA
NO
RT
H S
LO
PE
RO
YA
LT
Y G
AS
ST
UD
Y
29
COMMERCIAL STRUCTURE OF PROJECT INFLUENCES RISK AND CONTROL
• Aligned interest
• Cost and risk sharing
• Concentrated control Integrated
• Less capital requirement for individual sponsors
• Separation of control between upstream and LNG project
Merchant
• Contractually assured fees and returns
• Accommodates supply from multiple upstream sources
• No market upside for LNG project
Tolling
Each structure affects the operations and financing costs of the GTP, pipeline, LNG plant, and the shipper and impacts key criteria important to State - Commercial viability of AKLNG project, open access, expandability, transparency across the supply chain

AL
AS
KA
NO
RT
H S
LO
PE
RO
YA
LT
Y G
AS
ST
UD
Y
30
KEY CHARACTERISTICS OF LNG PROJECT STRUCTURES
State does not participate in upstream
Structure Advantages Disadvantages
Integrated
• Equity owners may or may not act together to sell the LNG product from an integrated structure • Control over production • Aligned interests between owners • Cost sharing and potential tax benefits
• Capital requirements are high and span the supply chain
• Concentrated control makes expansions and entry of new participants difficult
Merchant
• Lower capital requirement if sponsors of upstream and LNG Project Co are different
• Meets tax requirements for separate P&L center
• Comply with local laws for government ownership of upstream project
• Less control by upstream participants over liquefaction facilities
• Less flexibility for equity participants in production of gas and selling LNG – sold uniformly by LNG Project Co
• Commodity price risk exposure for LNG Project Co
• Can be mitigated with variations of the merchant model, for example, by selling LNG back to project owners’ marketing affiliate to insulate the project from risk
• Exposure to negotiating power of upstream owners
Tolling
• Contractually assured fees and returns
— Low market risk to LNG Plant Co
— Mitigates upstream supply risk for LNG Plant Co
• Potential tax benefits if title transfers are taxed
• Accommodates supply from multiple sources, entities
• Ability to attract other investors/owners to project – lower capital requirements
• Facilitates project financing since liquefaction project revenues are not directly exposed to market risks
• No participation in market upside for LNG Plant Co

AL
AS
KA
NO
RT
H S
LO
PE
RO
YA
LT
Y G
AS
ST
UD
Y
31
31
COMMERCIAL STRUCTURE OF AKLNG PROJECT COULD DRIVE MISALIGNMENT BETWEEN THE STATE AND PRODUCERS
• A Producer-owned project creates risk for the State related to its fiscal revenues due to potential misalignment of interests between
• Under various alternate project structures contemplated, there could be incentive for Producers to shift revenues between the upstream and the midstream segment of the project, as a way of increasing Producer take (and thereby reducing the State’s take) from the project
• This analysis examines a scenario where the LNG plant’s service rates are established using an equity-rich financing structure and with a relatively high return on equity

AL
AS
KA
NO
RT
H S
LO
PE
RO
YA
LT
Y G
AS
ST
UD
Y
32
32
IT IS CRITICAL TO CREATE ALIGNMENT BETWEEN STATE AND PRODUCER INTERESTS TO ENABLE STATE RECEIVING ITS FULL SHARE OF VALUE FROM THE AKLNG PROJECT
$2.40 $2.40 $2.40
$2.98 $2.98 $2.98
$6.73
$10.78 $9.25
$-
$2
$4
$6
$8
$10
$12
$14
$16
$18
Reference Case70% Debt; 30% Equity
12% ROE
100% Equity14% ROE for LNG Plant
30% Debt; 70% Equity14% ROE for LNG Plant
$/m
mb
tu
Project TariffGTP Pipeline LNG
$38.6$24.0 $29.4
$46
$13
$25
$26
$35
$32
$40
$41
$41
$150
$112
$126
$0
$20
$40
$60
$80
$100
$120
$140
$160
Reference Case70% Debt; 30% Equity
12% ROE
100% Equity14% ROE for LNG Plant
30% Debt; 70% Equity14% ROE for LNG Plant
Nom
inal
$Bi
llion
s
State of Alaska Cash Flow Summary
Property Tax SCIT Production Tax Royalty Free Cash Flow
State could lose billions of dollars of value through misalignment Equity-rich financing structure drives a high tariff for LNG Plant
• Although the State could use regulations as potential safeguards, there is potential for misalignment of interests between the Producers and the State in a producer owned project
• Areas of potential misalignment include need for transparency, open access and low tariffs
• Transparency within a producer-owned project into costs and cost allocation is likely to be an ongoing challenge for the State
• Creating alignment between the State and Producers is critical for the State to receive the full value of the AKLNG project

AL
AS
KA
NO
RT
H S
LO
PE
RO
YA
LT
Y G
AS
ST
UD
Y
33
Capital costs for AKLNG project are likely to remain uncertain through the development of the project
Total midstream project cost estimates from the AKLNG project sponsors range from $37-$54 billion
Complex LNG projects typically have an integrated commercial structure to give sponsors maximum control
1
2
3
AKLNG is expected to have an integrated structure; ensuring alignment of interests between the State and Producers is challenging and critical with a Producer-owned integrated project
4
SUMMARY: SUPPLY CHAIN ELEMENTS

AL
AS
KA
NO
RT
H S
LO
PE
RO
YA
LT
Y G
AS
ST
UD
Y
34
34
FISCAL FRAMEWORK – SCOPE
• Overview of the fiscal structures relevant to LNG projects worldwide and comparison with AKLNG Project
• Discussion and analysis of incentives that State could provide to help facilitate the AKLNG Project
• Assessment of how Alaska can leverage its royalty ownership position – royalty in kind relative to royalty in value
• LNG Markets
• Supply Chain Elements
• Fiscal Framework
• Risk Allocation & Fiscal Structure

AL
AS
KA
NO
RT
H S
LO
PE
RO
YA
LT
Y G
AS
ST
UD
Y
35
Petroleum fiscal arrangements
Contractual systems
Concessionary systems
Examples Simple description Fiscal system
THREE MAIN FISCAL SYSTEMS ARE IN USE FOR OIL AND GAS AROUND THE WORLD
Tax-Royalty 1
Production Sharing Contract
2
Service contracts
3
• Title to the hydrocarbons transfers to the company at the wellhead. The host government receives royalties (% of revenues or production) and taxes (% of profits) from the company.
• U.K. • U.S. • Norway • Australia • Russia • Canada
• Title to hydrocarbons resides with host government
• Production in kind is shared between the contractor and the government at the export point – A basic PSC has royalty, cost oil,
profit oil and taxes
• Nigeria • Angola • Russia • Algeria • Kazakhstan • Indonesia • Qatar
• Iran • Iraq • Mexico • Ecuador • Russia
• Title to hydrocarbons resides with host government
• The contractor is reimbursed and paid a fee, typically in cash. These are rare and unpopular
SOURCE: Team Analysis

AL
AS
KA
NO
RT
H S
LO
PE
RO
YA
LT
Y G
AS
ST
UD
Y
36
GOVERNMENT TAKE ON LNG PROJECTS, BY COUNTRY
Equatorial Guinea
Australia
PNG
Russia Sakhalin II
Philippines
Pakistan
US OCS
Indonesia Tangguh
UK
Gabon
Morocco
India Deep Water
Yemen
Peru
Alaska
Timor Gap ZOCA
Norway
Libya Block 59 2005
Egypt Onshore
Myanmar 1990s
Qatar
Malaysia Bintulu
Qatar EGU
UAE “Opec Terms”
Syria Mid 1990s
Indonesia
Argentina
Venezuela 1996
Libya Block 54 2005
Iran 1st Buyback
3-5
0
22.5
0
0
0
0
0
0
10
25
0
16.7
0
0
0
0
61
0
15
0
15
0-70
60
0
10
Yes
35
87.6
100
10
0
2
6
13.5
4
16.7
4
0
22
10
5-10
14.5
23
12.5
0
0
61
38
46
16-20
25
48
12.5
60
14
12-40
35
87.6
30
Government Take LNG2013
Gvt.Participation %
Effective Royalty Rate %
100% 90% 80% 70% 60% 50% 40% 30%
Daniel Johnston & Co., Inc. © 1994-2013
100% 90% 80% 70% 60% 50% 40% 30%
Royalty/Tax System
PSC / Service Agreement
“R” Factor
Rate of Return Feature
R
ROR
LNG
Oil Only
Government take for LNG projects generally falls within a wide 45%-85% range
Royalty/Tax System
PSC / Service Agreement
LNG

AL
AS
KA
NO
RT
H S
LO
PE
RO
YA
LT
Y G
AS
ST
UD
Y
37
37
GOVERNMENT TAKE IN ALASKA IS BETWEEN 70%-80% UNDER SB21/MAPA FISCAL STRUCTURE WITH SIGNIFICANT FEDERAL GOVERNMENT SHARE
With current levies alone, government take is significant in the context of LNG projects worldwide
81% Government Share 72% Government Share * Negative NPV for YTF Fields of $-0.1B not shown
State of Alaska (Upstream), $114, 29%
State of Alaska (Midstream), $47.7, 12%
PBU + PTU (Upstream), $53.7, 13%
YTF (Upstream), $9 , 2%
Producers (Midstream),
$48, 12%
U.S. Federal Government (Upstream),
$54, 14%
U.S. Federal Government (Midstream),
$74, 18%
Gasline Impact Total Cash Flow by Stakeholder (Billions)
~$400 Billion in Total Cash Flow ~$32 Billion in Total NPV
State of Alaska (Upstream),
9.1, 29%
State of Alaska (Midstream),
5.8, 18%PBU + PTU
(Upstream), $4.4, 14%
Producers (Midstream),
$1.6, 5%
Federal Government (Upstream), $4.3, 13%
Federal Government (Midstream),
$6.6, 21%
Gasline Impact NPV10 by Stakeholder (Billions)
AL
AS
KA
NO
RT
H S
LO
PE
RO
YA
LT
Y G
AS
ST
UD
Y
38
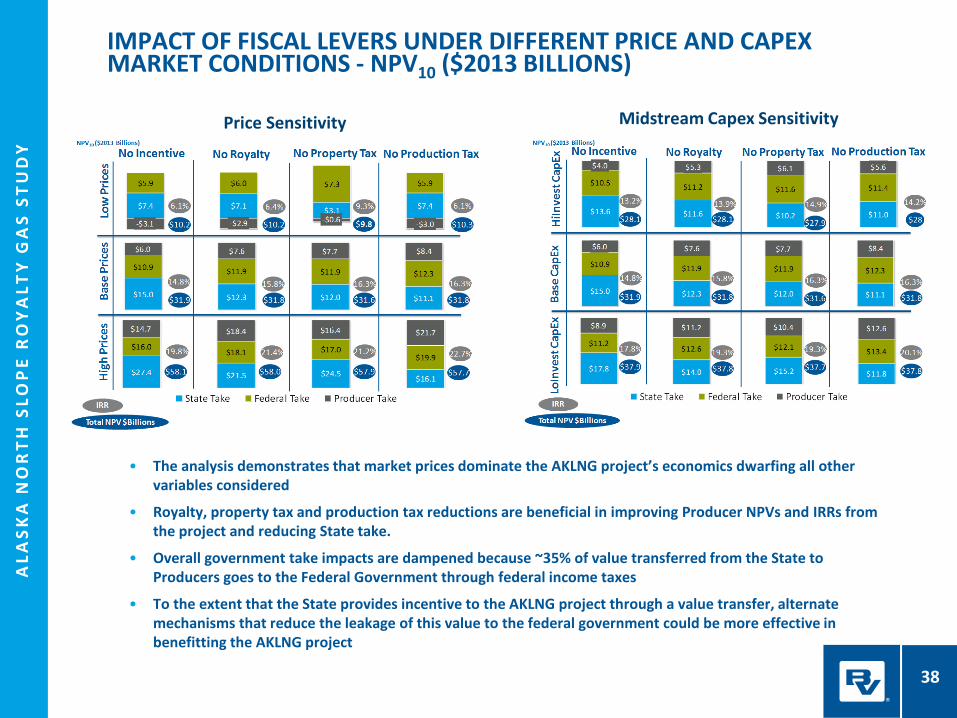
IMPACT OF FISCAL LEVERS UNDER DIFFERENT PRICE AND CAPEX MARKET CONDITIONS - NPV10 ($2013 BILLIONS)
Price Sensitivity Midstream Capex Sensitivity
• The analysis demonstrates that market prices dominate the AKLNG project’s economics dwarfing all other variables considered
• Royalty, property tax and production tax reductions are beneficial in improving Producer NPVs and IRRs from the project and reducing State take.
• Overall government take impacts are dampened because ~35% of value transferred from the State to Producers goes to the Federal Government through federal income taxes
• To the extent that the State provides incentive to the AKLNG project through a value transfer, alternate mechanisms that reduce the leakage of this value to the federal government could be more effective in benefitting the AKLNG project

AL
AS
KA
NO
RT
H S
LO
PE
RO
YA
LT
Y G
AS
ST
UD
Y
39
39
Advantages Disadvantages
Royalty In-Kind
ROYALTY IN KIND VS. ROYALTY IN VALUE
• Attractive to producers • Reduces valuation disputes • Reduces commercial uncertainty for
project • Provides the State with better market
insight
• Exposes State to various additional risks • Requires modifications to current
legislation and authority • Requires marketing expertise • Credit requirements for shipper
agreements
SOURCE: Team Analysis
Note: Equity participation with or without In-Kind Gas is another alternative for the State to consider and has been addressed separately
Royalty In-Value
• Status quo, familiarity • No direct firm capacity commitments • RIV auditing and management capabilities
currently exist
• Lack of transparency • No third party access (TPA) • Valuation disputes: higher of; actual
market price realized • Gaming over cost deductions • Not preferred choice of producers

AL
AS
KA
NO
RT
H S
LO
PE
RO
YA
LT
Y G
AS
ST
UD
Y
40
IMPLEMENTING RIK PRESENTS CHALLENGES AND, HENCE, COSTS FOR THE STATE RELATIVE TO RIV
NPV losses to the State from going RIK could be as much as 75% of value relative to RIV
AL
AS
KA
NO
RT
H S
LO
PE
RO
YA
LT
Y G
AS
ST
UD
Y
41
• Taking its royalty in kind could potentially expose the State to significant risks including:
— The State may need to build its own marketing organization to take care of origination, logistics, contract administration, accounting, etc. if it chooses to market the gas
— State would face challenges in competing with the Producers who have well established LNG marketing expertise and global portfolios
— State would be subject to counterparty risk in all of the contracts it enters into across the LNG supply chain
— State would need to make firm capacity commitments along the LNG supply chain, which could total up to $1 billion per year
• State could realize negative royalties if the LNG price is too low
— State would face production volume risk (if production exceeds or falls short of its sales commitments)
• Producers have the experience of dealing with market uncertainties and would need to help the State address these risks if an RIK path is pursued
RIK CREATES ADDITIONAL RISK AND COST FOR THE STATE RELATIVE TO RIV

AL
AS
KA
NO
RT
H S
LO
PE
RO
YA
LT
Y G
AS
ST
UD
Y
42
SUMMARY: ALASKA FISCAL FRAMEWORK
Government take, at 70-85%, is high for a project of this complexity, and estimated IRR of approximately 15% may be insufficient for Producer investment relative to their alternatives
Well designed incentives to lower project costs and modify fiscal structure can help make the AKLNG project competitive in market
The State taking its royalty as RIK could result in a substantial increase in risk & potential loss of value for the State – Producers have more experience managing associated risks
1
2
3

AL
AS
KA
NO
RT
H S
LO
PE
RO
YA
LT
Y G
AS
ST
UD
Y
43
43
RISK ALLOCATION & COMMERCIAL STRUCTURE – SCOPE
• Overview of key risks that could impact the AKLNG Project stakeholders and risk management
• Assessment of alternatives for financial, equity participation by State in AKLNG Project
• LNG Markets
• Supply Chain Elements
• Fiscal Framework
• Risk Allocation & Fiscal Structure

AL
AS
KA
NO
RT
H S
LO
PE
RO
YA
LT
Y G
AS
ST
UD
Y
44
THERE ARE VARIOUS UNCERTAINTIES RELATED TO THE AKLNG PROJECT THAT COULD IMPACT THE ECONOMIC BENEFITS TO THE DIFFERENT STAKEHOLDERS
AKLNG is exposed to risks beyond control
of the State (and the producers)
Prices
Capital Cost
Escalations Cost of Debt
Schedule

AL
AS
KA
NO
RT
H S
LO
PE
RO
YA
LT
Y G
AS
ST
UD
Y
45
PRICE AND CAPITAL COST RELATED UNCERTAINTIES EMERGE AS THE KEY FACTORS DRIVING THE PROJECT ECONOMICS
Low
PricesHigh
Prices
$0 $5 $10 $15 $20 $25 $30
ROE
Schedule
Cost of Debt
Project
Capital Cost
Oil to LNG
Price Multiplier
Oil Price
Escalation
Oil and LNG Prices
NPV ($Billions)
State of Alaska NPV10 Base Assumption
SensitivityBase Case
-1% Price, -1% OpEx, -1% CapEx
+1%
+ 1 year
+1%
+5B CapEx
-1%
-$10/bbl
+1% Price, +1% OpEx, +1% CapEx
+$10/bbl
+1%
-5B CapEx
-1%
- 1 year
-1%
2.5% Price, 3% OpEx, 3% CapEx
$90/bbl Oil
0.135
$45 Billion
7.05%
2024 In-Service
12%
$90/bbl13.5% Oil to
LNG Multiplier
1 Base Price = $90/bbl oil price in $2013; LNG Price per MMBtu = 0.135*Oil Price + $1 High Price = $120/bbl oil price in $2013; LNG Price per MMBtu = 0.15*Oil Price + $1 Low Price = $60/bbl oil price in $2013; Henry Hub Price = $4/MMBtu in $2013; LNG Price per MMBtu = HH+$6 2 The escalation sensitivity captures a variation in the assumption related to annual change in capital costs, operating costs and
oil and gas prices
Low
PricesHigh
Prices
-$4 -$2 $0 $2 $4 $6 $8 $10 $12 $14 $16
ROE
Schedule
Cost of Debt
Project
Capital Cost
Oil to LNG
Price Multiplier
Escalation
Oil Price
Oil and LNG Prices
NPV ($Billions)
Total Producer (Upstream + Midstream) NPV10 Base AssumptionSensitivity Base Case
-$10/bbl
-1%
+ 1 years
+1%
+5B CapEx
-1%
-1% Price, -1% OpEx, -1% CapEx
+$10/bbl
+1% Price, +1% OpEx, +1% CapEx
+1%
-5B CapEx
-1%
- 1 year
+1%
$90/bbl Oil
2.5% Price, 3% OpEx, 3% CapEx
0.135
$45 Billion
7.05%
2024 In-Service
12%
$90/Bbl 13.5% Oil to
LNG Multiplier

AL
AS
KA
NO
RT
H S
LO
PE
RO
YA
LT
Y G
AS
ST
UD
Y
46
46
• Cost and time risks in project execution depend on the nature and extent of project organization apart from market factors
– Of the recent LNG projects, most have a single operator for upstream, transport and liquefaction
– Integrated project case has been successful in high cost project execution (Snøhvit case example)
• Market risk management is executed by LNG projects in two ways:
– Pre-FID commitments: Majority of project volumes are contracted before FID to ensure market. Example: Gorgon, APLNG
– End user participation: Several projects have equity stake of end buyers providing ensured-market for corresponding equity volumes. Example: Tangguh, Sakhalin II
• Where the Government participates in LNG projects is usually via NOCs with LNG majors who bring in LNG project experience
• State’s equity participation in the project can allow state to capture an upside in prices but exposes it further to a down-side
• Examples: Snøhvit, Yemen LNG, Angola LNG
Cases of risk allocation
Cases of risk mitigation
State participation and implications
RISK ALLOCATION AND MANAGEMENT
SOURCE: Team Analysis

AL
AS
KA
NO
RT
H S
LO
PE
RO
YA
LT
Y G
AS
ST
UD
Y
47
EQUITY PARTICIPATION BY THE STATE OF ALASKA COULD HAVE TANGIBLE BENEFITS FOR THE PROJECT AS WELL AS THE STATE
• To the extent that the State transfers value to the Producers through a modification of fiscal terms as an incentive for the AKLNG project, obtaining an equity interest in the project in exchange for that transfer of value is more beneficial to the State than a simple reduction in fiscal take
• Greater alignment of economic interests between the State and Producers
• State ownership lowers the upfront capital cost to Producers creating potential economic uplift
• Allows for TCPL equity participation and operation of the pipeline and GTP
• Equity in all phases could facilitate greater transparency in the AKLNG Project
• Allows State to influence access for third parties in the most critical potential bottlenecks of the project – pipeline and marine terminal
• Equity investment in the supply chain, while allowing SOA a seat at the table, does not necessarily provide for a vote in the decision making process
• Joint Venture Agreement structuring is critical

AL
AS
KA
NO
RT
H S
LO
PE
RO
YA
LT
Y G
AS
ST
UD
Y
48
ALTERNATIVES FOR THE STATE TO PARTICIPATE WITH AN EQUITY INVESTMENT IN THE AKLNG PROJECT – DESCRIPTION
Equ
ity
Alt
ern
ativ
e
• The State makes an equity investment across the midstream and receives an equivalent share of gas produced as royalty and tax gas
• Two different equity investment levels were considered as representing lower and upper bounds on the State’s equity participation – 15% and 35% 1
00
% S
tate
Ow
ne
rsh
ip o
f P
ipe
line
• The State invests sufficient equity to entirely own the pipeline component of the midstream
• Producers would pay a tariff to the State for transportation services on the pipeline
12
.5%
Sta
te O
wn
ers
hip
of
Mid
stre
am
• The State invests to have a 12.5% equity stake across the midstream corresponding to an approximation of its royalty share
• The State’s share of the capacity would be utilized to treat, transport and liquefy royalty gas
Three different alternative structures for equity participation for the State were considered as indicative examples:
AL
AS
KA
NO
RT
H S
LO
PE
RO
YA
LT
Y G
AS
ST
UD
Y
49
49
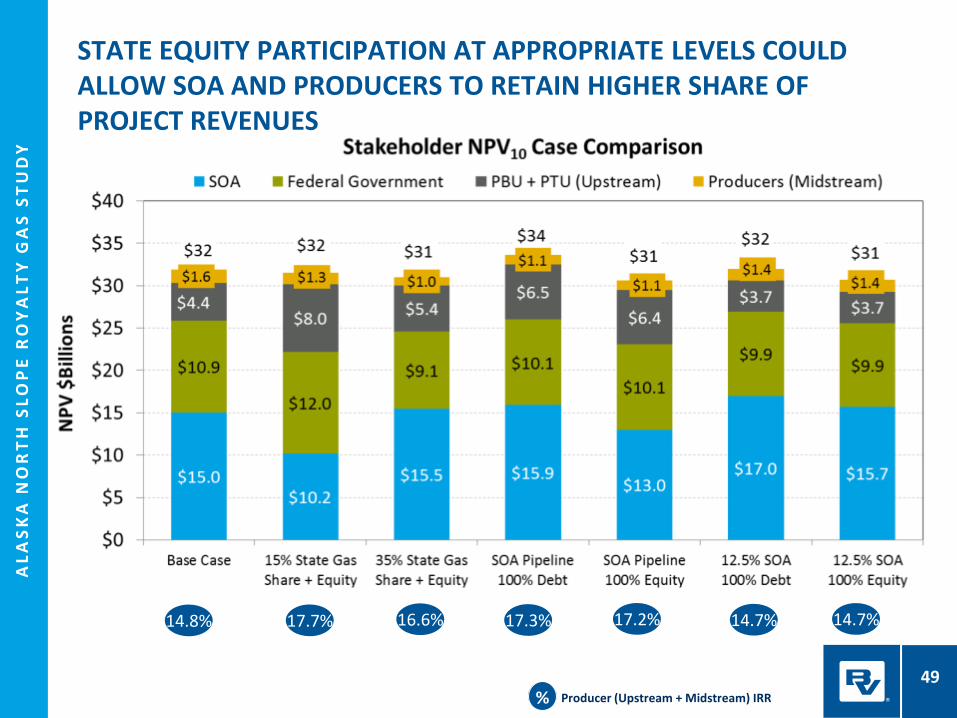
STATE EQUITY PARTICIPATION AT APPROPRIATE LEVELS COULD ALLOW SOA AND PRODUCERS TO RETAIN HIGHER SHARE OF PROJECT REVENUES
% Producer (Upstream + Midstream) IRR
14.8% 16.6% 17.7% 17.3% 14.7% 17.2% 14.7%

AL
AS
KA
NO
RT
H S
LO
PE
RO
YA
LT
Y G
AS
ST
UD
Y
50
APPROPRIATE LEVEL OF STATE EQUITY PARTICIPATION NEEDS TO BE BALANCED TO ACHIEVE BENEFITS TO SOA AND PRODUCERS
• Scenarios examining a range of capital costs and market prices were assessed to understand whether the equity alternative provides positive economic value to the State relative to status quo under each of the scenarios
• 15% and 35% state equity participation levels in combination with equivalent royalty gas & tax gas were considered as indicators of lower and upper bounds to the State’s equity participation
• SB21/MAPA fiscal structure as currently applicable does not include production credits for gas. This analysis assumes a modified status quo wherein the production credits are extended to reflect a $5/BOE credit for gas, similar to the credit extended to new oil production
• The analysis estimated and compared AKLNG project economics under modified status quo and under the equity alternative for both the State and the Producers across a combination of three price and three capital cost scenarios

AL
AS
KA
NO
RT
H S
LO
PE
RO
YA
LT
Y G
AS
ST
UD
Y
51
51
12.5%
-1.6%
-10.1%
30.5%
22.2%
17.0%
36.1%
32.6%
30.6%
-20%
-10%
0%
10%
20%
30%
40%
Low Base High Low Base High Low Base High
Low Price Base Price High Price
Stak
e E
qu
ity
Shar
e
State Equity % Required to Generate NPV10 Equal to the Modified Status Quo
Investment:
Prices:
The level of State equity investment required to equal total state NPV10 under status quo varies with market conditions
State Equity % Required to Generate NPV10 Equal to the Modified Status Quo
STATE EQUITY PARTICIPATION BETWEEN 20% AND 30% OFFERS NPV10 AT OR ABOVE THE MODIFIED STATUS QUO LEVELS FOR THE STATE

AL
AS
KA
NO
RT
H S
LO
PE
RO
YA
LT
Y G
AS
ST
UD
Y
52
52
SOA EQUITY INVESTMENT IN AKLNG CREATES RISK EXPOSURES THAT NEED TO BE CONSIDERED AND MANAGED
• Cost overruns and cash calls above appropriation level
• As an equity owner, the State assumes all Force Majeure risk throughout the GTP, pipeline and LNG terminal
• State has no control over upstream operations and volumes produced by the Producers
— Could have excess or insufficient capacity relative to volumes produced
— Balancing production volumes and volumes through the supply chain on a short-term and long-term basis
• If the State assigns its equity position to a third party such as TransCanada and contracts for capacity with this third-party, the State will likely have to provide credit support to the entity that would assume the state’s equity share in the midstream through long-term commitments for capacity
• State would be responsible for all demand charge obligations throughout the life of the contract regardless of gas supply availability and market conditions
— Possible that revenues earned on LNG sales would not offset costs of treating, transport and liquefaction resulting in negative cash flows to the State

AL
AS
KA
NO
RT
H S
LO
PE
RO
YA
LT
Y G
AS
ST
UD
Y
53
SUMMARY: RISK ALLOCATION & COMMERCIAL STRUCTURE
AKLNG faces various risks that could affect the economic benefits; prices and capital cost are key
1
2
3
Direct equity participation by the State can offer benefits to all parties involved in the project; accompanying risk profile changes should be managed
Various commercial terms related to equity participation will determine whether the State can achieve its transparency and access objectives

SUPPLEMENTAL ANALYSIS – TRANSCANADA PARTICIPATION
PREPARED FOR THE STATE OF ALASKA
FEB
RU
AR
Y 1
0, 2
01
4

AL
AS
KA
NO
RT
H S
LO
PE
RO
YA
LT
Y G
AS
ST
UD
Y
55
• As part of exploring an equity position in the Alaska LNG (“AKLNG”) Project, the State of Alaska (“the State” or “SOA”) is contemplating a commercial arrangement with TransCanada for the Midstream Component where the State:
• shifts initial project capital burden to TransCanada
• secures favorable debt/equity ratio for transportation services
• obtains benefit of TransCanada’s northern pipeline experience
• As part of this commercial arrangement, TransCanada will fund development of the State’s share of the mid-stream assets during the pre-FEED stage and provide the State with an equity option to purchase an interest of up to 40% of this share prior to entering the FEED stage of the project. This means the State would receive up to 40% of the equity return TransCanada receives and be responsible for up to 40% of TransCanada’s cost during FEED and ultimately, construction and operation.
BACKGROUND D
RA
FT –
SU
BJE
CT
TO R
EVIS
ION

AL
AS
KA
NO
RT
H S
LO
PE
RO
YA
LT
Y G
AS
ST
UD
Y
56
• The purpose of this analysis is to evaluate the impact of TransCanada’s ownership in the AKLNG project on the State of Alaska
• This study analyzed two different alternate levels of State equity participation and State Gas Share – 20% and 25%
• Under each equity alternative case, three ownership scenarios were analyzed to determine whether there is benefit from TransCanada’s participation in the AKLNG project:
• SOA Ownership – State retains ownership in its 20%-25% share of the GTP and Pipeline
• TransCanada GTP + Pipeline Ownership – TC assumes the State’s 20%-25% share of the GTP and Pipeline
• TC Ownership + SOA 40% Buyback – TC assumes the State’s 20%-25% share of the GTP and Pipeline, but SOA exercises an option to buy back 40% ownership in these components at the beginning of the FEED stage of project development
• In all three scenarios above, the State retains its 20%-25% share of the LNG Plant
• Key terms proposed for TC’s services provided to the State include:
• Debt/Equity: 70/30 through first year of operation; 75/25 thereafter
• Return on Equity: 12% plus rate tracker
• Cost of Debt: 5% plus rate tracker
• It is assumed that there is a 6% opportunity cost associated with any equity investment by the State (reflecting assumed returns from the Constitutional Budget Reserve Fund)
KEY ASSUMPTIONS D
RA
FT –
SU
BJE
CT
TO R
EVIS
ION

AL
AS
KA
NO
RT
H S
LO
PE
RO
YA
LT
Y G
AS
ST
UD
Y
57
• TransCanada’s participation in the AKLNG project can reduce the State’s total investment in the Project by between $2 billion and $5.5 billion depending on the total equity stake ultimately owned by the State
• Assuming a 70/30 debt to equity ratio for the State, TransCanada’s participation in the AKLNG project can reduce the equity investment required from the State by between $600 million and $1.7 billion depending on the total equity stake
• TransCanada’s involvement creates additional value of $3-$6 billion on a cash flow basis and between $600 million and $1 billion on an NPV basis for the State of Alaska through the initial 30 year project life
TRANSCANADA PARTICIPATION – FINDINGS D
RA
FT –
SU
BJE
CT
TO R
EVIS
ION

AL
AS
KA
NO
RT
H S
LO
PE
RO
YA
LT
Y G
AS
ST
UD
Y
58
STATE OF ALASKA TOTAL CAPITAL INVESTMENT (IN 2013$) D
RA
FT –
SU
BJE
CT
TO R
EVIS
ION

AL
AS
KA
NO
RT
H S
LO
PE
RO
YA
LT
Y G
AS
ST
UD
Y
59
*Assumes a 70/30 debt/equity split for the State’s investment
STATE OF ALASKA EQUITY CASH CALLS* (IN 2013$) D
RA
FT –
SU
BJE
CT
TO R
EVIS
ION

AL
AS
KA
NO
RT
H S
LO
PE
RO
YA
LT
Y G
AS
ST
UD
Y
60
STATE OF ALASKA TOTAL CASH FLOWS ASSOCIATED WITH EQUITY ALTERNATIVE*
* Includes cash flows over initial 30 years; Cash flows exclude additional revenues to the State from the AKLNG Project such as upstream property and income taxes that are not impacted by TC participation. Values include the estimated impact of opportunity cost to the State which may not be a cash flow element.
$64
$51
$70
$56
$68
$54
$0
$10
$20
$30
$40
$50
$60
$70
$80
$90
$100
25% Equity Alternative
20% Equity Alternative
25% Equity Alternative
20% Equity Alternative
25% Equity Alternative
20% Equity Alternative
SOA Ownership TC GTP and Pipe Ownership TC Ownership + SOA 40% Buy Back
$ B
illio
ns
Total Cash Flows to State of Alaska Associated with Equity Alternative
DR
AFT
– S
UB
JEC
T TO
REV
ISIO
N

AL
AS
KA
NO
RT
H S
LO
PE
RO
YA
LT
Y G
AS
ST
UD
Y
61
STATE OF ALASKA NPV10 ASSOCIATED WITH EQUITY ALTERNATIVE*
$5.3
$4.2
$6.3
$5.1
$6.0
$4.8
$0.0
$1.0
$2.0
$3.0
$4.0
$5.0
$6.0
$7.0
$8.0
25% Equity Alternative
20% Equity Alternative
25% Equity Alternative
20% Equity Alternative
25% Equity Alternative
20% Equity Alternative
SOA Ownership TC GTP and Pipe Ownership TC Ownership + SOA 40% Buy Back
$ 20
13 B
illio
ns
NPV to State of Alaska Associated with Equity Alternative
* NPV of cash flows over initial 30 years discounted at 10%; Cash flows exclude additional revenues to the State from the AKLNG Project such as upstream property and income taxes that are not impacted by TC participation. Values include the estimated impact of opportunity cost to the State which may not be a cash flow element.
DR
AFT
– S
UB
JEC
T TO
REV
ISIO
N

AL
AS
KA
NO
RT
H S
LO
PE
RO
YA
LT
Y G
AS
ST
UD
Y
62
STATE OF ALASKA ANNUAL CASH FLOWS ASSOCIATED WITH THE 20% EQUITY ALTERNATIVE*
* Annual cash flows over initial 30 years. Cash flows exclude additional revenues to the State from the AKLNG Project such as upstream property and income taxes that are not impacted by TC participation. Values include the estimated impact of opportunity cost to the State which may not be a cash flow element.
State of Alaska Annual Cash Flows Associated with 20% Equity Alternative
DR
AFT
– S
UB
JEC
T TO
REV
ISIO
N
AL
AS
KA
NO
RT
H S
LO
PE
RO
YA
LT
Y G
AS
ST
UD
Y
63
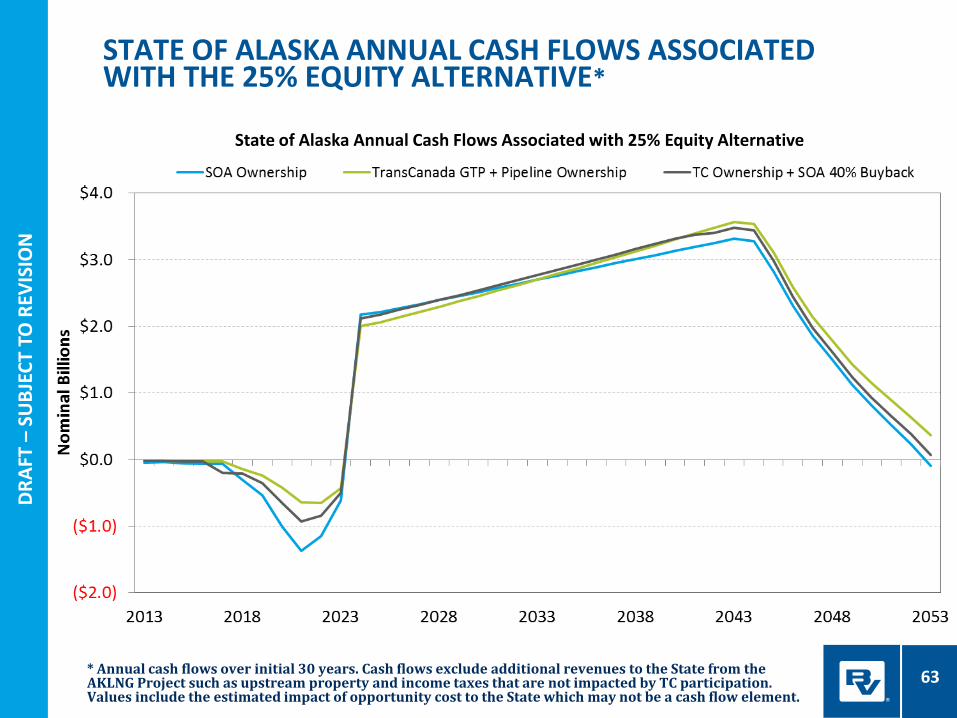
STATE OF ALASKA ANNUAL CASH FLOWS ASSOCIATED WITH THE 25% EQUITY ALTERNATIVE*
State of Alaska Annual Cash Flows Associated with 25% Equity Alternative
* Annual cash flows over initial 30 years. Cash flows exclude additional revenues to the State from the AKLNG Project such as upstream property and income taxes that are not impacted by TC participation. Values include the estimated impact of opportunity cost to the State which may not be a cash flow element.
DR
AFT
– S
UB
JEC
T TO
REV
ISIO
N

AL
AS
KA
NO
RT
H S
LO
PE
RO
YA
LT
Y G
AS
ST
UD
Y
64
• The purpose of this analysis is to examine the relative impact of the capital structure and the return on equity terms on the tariff for the GTP and pipeline and on the net present value to the State of Alaska
• This assessment examined the 25% Equity Alternative case, where TransCanada assumes the State’s share of the GTP and Pipeline
• Sensitivity assumptions
• Base case assumptions reflect the proposed terms of 75% Debt/25% Equity with 12% ROE
• Capital structure sensitivities examine shifts between debt and equity percentages in 10% increments from the base case
• ROE sensitivities examine changes in ROE in increments of 1% from the base case
IMPACT OF CAPITAL STRUCTURE & RETURN ON EQUITY D
RA
FT –
SU
BJE
CT
TO R
EVIS
ION

AL
AS
KA
NO
RT
H S
LO
PE
RO
YA
LT
Y G
AS
ST
UD
Y
65
• Changes in the capital structure assumed to finance the AKLNG Project GTP and pipeline components could have a larger potential impact on the tariffs as well as net present value to the State than changes to the return on equity given to TransCanada
• Each 10% shift in the capital structure from debt to equity could increase the tariff on the GTP and pipeline by ~$0.30/MMBtu and cause a loss of $300 million in NPV10 to the State
• In comparison, each 1% increase in the return on equity could increase the tariff on the GTP and pipeline by ~$0.08/MMBtu and cause a loss of $100 million in NPV10 to the State
CAPITAL STRUCTURE & ROE – FINDINGS
DR
AFT
– S
UB
JEC
T TO
REV
ISIO
N

AL
AS
KA
NO
RT
H S
LO
PE
RO
YA
LT
Y G
AS
ST
UD
Y
66
TARIFF ON GTP AND PIPELINE INCREASES BY ~$0.30/MMBTU FOR EACH 10% INCREASE IN EQUITY WHILE INCREASING BY ~$0.08/MMBTU FOR EACH 1% INCREASE IN ROE
D/E Sensitivity Assuming ROE of 12% ROE Sensitivity Assuming D/E of 75/25
DR
AFT
– S
UB
JEC
T TO
REV
ISIO
N

AL
AS
KA
NO
RT
H S
LO
PE
RO
YA
LT
Y G
AS
ST
UD
Y
67
NPV TO THE STATE DECREASES BY ~$300MM FOR EACH 10% INCREASE IN EQUITY WHILE DECREASING BY ~$100MM FOR EACH 1% INCREASE IN ROE
D/E Sensitivity Assuming ROE of 12% ROE Sensitivity Assuming D/E of 75/25
DR
AFT
– S
UB
JEC
T TO
REV
ISIO
N

AL
AS
KA
NO
RT
H S
LO
PE
RO
YA
LT
Y G
AS
ST
UD
Y
68
• As part of exploring an equity position in the Alaska LNG (“AKLNG”) Project, the State of Alaska (“the State” or “SOA”) has entered into a Heads of Agreement with parties that include the three major producers on the North Slope describing terms facilitating the development of the AKLNG Project.
• Pro-expansion principles have been considered within Appendix A of the HOA that allow any Alaska LNG Party to initiate expansion of the project within the construct of the principles agreed upon.
• Expansion of the AKLNG Project could provide key benefits to the State by facilitating further exploration and production activity on the North Slope by potentially providing an outlet to market for the natural gas produced.
EXPANSION ANALYSIS D
RA
FT –
SU
BJE
CT
TO R
EVIS
ION

AL
AS
KA
NO
RT
H S
LO
PE
RO
YA
LT
Y G
AS
ST
UD
Y
69
• The purpose of this analysis is to evaluate the economic impact of an expansion of the AKLNG Project on the State of Alaska
• Two different alternate levels of State equity participation and State Gas Share – 20% and 25% – were analyzed
• Key terms proposed for TC’s services provided to the State include:
• Debt/Equity: 70/30 through first year of operation; 75/25 thereafter; 70/30 for expansions
• Return on Equity: 12% plus rate tracker
• Cost of Debt: 5% plus rate tracker
• The capital structure and terms associated with the Producers’ portion of the original project include:
• Debt/Equity: 70/30; Return on Equity: 12%; Cost of Debt: 7%
• Expansion analysis assumes one additional LNG train and equivalent capacity at the GTP Plant and pipeline are added to the project five years into its operation. The analysis examines a 30 year period from the in-service date of the project.
• Cost of expansion assumes a 20% reduction in GTP and LNG train costs relative to the original project due to economies. Additional compression costs for the pipeline are assumed to support the expansion volumes. Total expansion cost is ~$10 billion compared to the original project of $45 billion.
• This analysis assumes that gas for expansion comes from State lands. Benefit to the State shown here could be lower if part or all of the expansion gas comes from lands where the State has lower or no royalty/tax stake
EXPANSION ANALYSIS – KEY ASSUMPTIONS D
RA
FT –
SU
BJE
CT
TO R
EVIS
ION

AL
AS
KA
NO
RT
H S
LO
PE
RO
YA
LT
Y G
AS
ST
UD
Y
70
• Expansion of the AKLNG Project can reduce the tariffs on the project for the original shippers due to economies of scale associated with an expansion
• The tariff advantages associated with expansion are impacted significantly by the capital structure of the original project for each of the AKLNG project owners as well as by that of the expansion
• Tariffs for the original project could decrease by ~$0.20/MMBtu assuming an expansion consistent with the 70/30 Debt/Equity structure proposed by TransCanada
• Expansion of the project also results in higher revenues to the State driven by development of new gas resources and associated royalty and tax cash streams
• Potential increase in State revenues of ~$40 billion in cash flows and of NPV10 of $2 billion over the initial 30 years
• The potential increase in State revenues from expansions are driven by the source of the yet-to-find gas resources
EXPANSION BENEFITS – FINDINGS D
RA
FT –
SU
BJE
CT
TO R
EVIS
ION

AL
AS
KA
NO
RT
H S
LO
PE
RO
YA
LT
Y G
AS
ST
UD
Y
71
ANNUAL CASH FLOWS TO STATE OF ALASKA INCREASE WITH AN EXPANSION OF THE AKLNG PROJECT
DR
AFT
– S
UB
JEC
T TO
REV
ISIO
N

AL
AS
KA
NO
RT
H S
LO
PE
RO
YA
LT
Y G
AS
ST
UD
Y
72
STATE OF ALASKA TOTAL CASH FLOWS CAN INCREASE BY 30% WITH AN EXPANSION OF ONE LNG TRAIN
DR
AFT
– S
UB
JEC
T TO
REV
ISIO
N

AL
AS
KA
NO
RT
H S
LO
PE
RO
YA
LT
Y G
AS
ST
UD
Y
73
STATE OF ALASKA NPV10 CAN POTENTIALLY INCREASE BY $2 BILLION WITH AN EXPANSION
$11.01
$13.31
$9.62
$11.60
0
2
4
6
8
10
12
14
16
Original Project Expansion
20
13
$m
illio
ns
State of Alaska NPV (10%)25% Equity Ownership 20% Equity Ownership
DR
AFT
– S
UB
JEC
T TO
REV
ISIO
N