
al JA - NASA time-honored approach to achieve this balance between stability and maneuverability is...
16
al JA _4 AIAA 2000-3913 Research on the F/A-18E/F Using a 22 %-Dynamically-Scaled Drop Model M. Croom, H. Kenney, and D. Murri NASA Langley Research Center Hampton, VA and K. Lawson Naval Air Systems Command Patuxant River, MD AIAA Atmospheric Flight Mechanics Conference and Exhibit 14-17 August 2000 Denver, Colorado For permission to copy or republish, contact the American Institute of Aeronautics and Astronautics 1801 Alexander Bell Drive, SuRe 500, Reston, VA 20191-4344 https://ntrs.nasa.gov/search.jsp?R=20000091591 2018-06-29T21:02:28+00:00Z
Transcript of al JA - NASA time-honored approach to achieve this balance between stability and maneuverability is...

al JA_4
AIAA 2000-3913
Research on the F/A-18E/F Using a
22 %-Dynamically-Scaled Drop Model
M. Croom, H. Kenney, and D. Murri
NASA Langley Research Center
Hampton, VA
and
K. Lawson
Naval Air Systems Command
Patuxant River, MD
AIAA Atmospheric Flight Mechanics Conferenceand Exhibit
14-17 August 2000Denver, Colorado
For permission to copy or republish, contact the American Institute of Aeronautics and Astronautics1801 Alexander Bell Drive, SuRe 500, Reston, VA 20191-4344
https://ntrs.nasa.gov/search.jsp?R=20000091591 2018-06-29T21:02:28+00:00Z

AIAA-2000-3913
RESEARCH ON THE F/A-18E/F
USING A 22%-DYNAMICALLY-SCALED DROP MODEL
Mr. Mark A. Croom, Ms. Holly M. Kenney, and Mr. Daniel G. MurriNASA Langley Research Center
and
Mr. Kenneth P. Lawson*
Naval Air Systems Command
ABSTRACT
Research on the F/A-I 8E/F configuration was
conducted using a 22%-dynamically-scaled drop model
to study flight dynamics in the subsonic regime.
Several topics were investigated including
longitudinal response, departure/spin resistance,
developed spins and recoveries, and the falling leaf
mode. Comparisons to lull-scale flight test results
were made and show the drop model strongly
correlates to the airplane even under very dynamic
conditions. The capability to use the drop model to
expand on the information gained from full-scale
flight testing is also discussed. Finally, a
preliminary analysis of an unusual inclined spinning
motion, dubbed the "cartwheel", is presented here forthe first time.
INTRODUCTION
Flight dynamic issues can significantly impact
the safety and effectiveness of high-performancevehicles such as the Navy's latest strike aircraft, the
F/A-18E/F Super Hornet shown in figure 1.
Dynamic aspects often dominate the aerodynamics and
can strongly influence the flight mechanics,
particularly during the large-amplitude, high-rate
maneuvering that is required of this class of aircraft.
The typical challenge to the designer is to maximize
maneuvering performance while maintaining good
levels of departure resistance throughout the intended
operational envelope and beyond (for margin).
A time-honored approach to achieve this
balance between stability and maneuverability is to
gain a comprehensive understanding of the aircraft
flight dynamic properties by subjecting the
configuration to a battery of tests.
Figure 1.- The F/A-I 8E/F Super Hornet
In the subsonic flight regime these tests (see figure 2)
typically include captive and free-flying wind-tunnel
tests (static force and moment, forced-oscillation, free-
flight, free-spin, and rotary-balance, among others),
outdoor drop model tests, numerical based analyses
(e.g., piloted simulation studies), and culminate with
full-scale flight testing. All of these tests were
performed during the F/A-18E/F development;
however, this paper concentrates on the drop modeleffort.
Statics Free-Flight Simulation
RotaryBalance Free-Spin Drop Model
Figure 2.- Ground-based test methods.
* Member AIAACopyright © 2000 by the American Institute of Aeronautics And Astronautics, Inc. No copyright is asserted in the United States underTitle 17, I.I.S. Code. The U.S. Government has a royalty-free license to exercise all rights under the copyright claimed herein forGovernmental Purposes. All other rights are reserved by the copyright owner.

Drop model and aircraft flight test results
covering a range of flight conditions and
configuration arrangements are presented to illustrate
some of the fundamental subsonic flight dynamic
characteristics of the F/A-18E/F. In so doing, a
sampling of the drop-model test technique capabilitiesis demonstrated.
Some of the drop model maneuvers were
performed to compare to aircraft flight data; these
comparisons are presented where available and showthat the model method accurately represents the full-
scale aircraft. Other drop model maneuvers were
conducted to study areas outside of the scope of the
aircraft flight test program that extended the depth ofinformation on the F/A-18E/F design and flight
dynamics in general.
NOMENCLATURE
Symbols:
Aw_ angle between velocity and
vectors, deg
Cip roll damping coefficient
C L lift coefficient
C m pitching moment coefficient
Cm_ pitch damping coefficient
g acceleration due to gravity
N model-to-airplane scale ratio
p body-axis roll rate, deg/sec
q body-axis pitch rate, deg/sec
r body-axis yaw rate, deg/sec
t time, sec
V free-stream velocity
c_ angle of attack, deg
13 sideslip, deg
_51at normalized lateral stick, +=right
_iped normalized pedal, +=right
p air density
heading angle, deg
rotation
Abbreviations:
CASFCS
LEF
LEX
SRYP
TEF
control augmentation system
flight control system
leading-edge flap
leading-edge extension
synchronous roll yaw parametertrailing-edge flap
DESCRIPTION OF TEST METHODS
The test methods used to generate the primary
results presented within this report were the drop
model technique and flight tests of the actual aircraft.As such, this section will focus on those two test
methods even though the report contains limited
results from other ground-based tests - specifically,
captive wind-tunnel, spin tunnel, wind-tunnel free-
flight, and simulation. Additional information aboutthese test methods can be found in the
references, t'2'3'4 However, a general discussion of the
non-captive scale-model test methods is given
following a description of the aircraft and the full-
scale flight test program.
Aircraft D_¢ription
The F/A-18E/F is a high performance, twin
engine, supersonic fighter/attack aircraft. The
airplane features twin canted vertical tails and
moderately swept variable camber wings with leading
edge extensions (LEX) extending from the wing root
forward on each side of the fuselage. Two General
Electric F414-GE-400 turbofan engines power the
aircraft. The E-model is a single place aircraft; the F-
model is a tandem two-place version of the E-model.
The F/A-18E/F flight control system is a
digital, quadruplex, fly-by-wire, full authority control
augmentation system (CAS). All control law
computations are performed by four digital computersworking in parallel. It includes a built-in redundancy
management system that detects and isolates control
system component failures. Due to control system
component redundancy, multiple like failures arcrequired before degradation in flying qualities or
stability occurs. On the F/A-18E/F aircraft, no
backup control modes are implemented where control
of the actuators revert from CAS closed loop control
to an alternate control function (e.g. no heavy
mechanical backup). Instead, CAS operation always
continues following failures to provide potentially
degraded, but acceptable flying qualities.
Longitudinal control uses symmetric deflection
of the stabilators, leading- and trailing-edge flaps,
ailerons, LEX spoilers, and toe-in of the rudders.Lateral-directional control uses differential deflection
of the stabilators, ailerons, leading- and trailing-edge
flaps, and symmetric rudder deflection. In the takeoff
and landing configuration, there is no differential
deflection of the flaps.
2American Institute of Aeronautics and Astronautics

Full-Scale F/A-18E/F Flight Test Program
The full-scale flight test effort represented the
largest and most aggressive high angle of attack
program ever undertaken for the development of a
production fighter. 5 Its scope included two distinctly
different models (the single place E-model and two-
place F-model), store Ioadings ranging from clean
wing to a full complement of external 480-gallon fuel
tanks and heavy bombs (symmetrically and
asymmetrically loaded), and fully developed spins to
120 deg/sec. The test team used a phased approach,which systematically increased the team's knowledge
of the airplane such that each increment in risk was
led by an increase in the team's confidence in the
airplane and supporting models.
Phase 1 testing examined the departure
susceptibility by the application of single axis inputs
at various flight conditions. Phase 1 also provided the
updates to the simulation aerodynamic model that
proved crucial to the safe execution of later phases.
Phase 2 provided the first look at upright and
inverted spins, and sustained out of control flight
modes. Spins deliberately preceded aggressive
maneuvering (Phase 3) so that any unpredicted
departures would be expected to place the test teamback into familiar terrain.
Phase 3 opened the envelope for aggressive
maneuvering, and included the full spectrum of multi-
axis aggravated maneuvers, spins to high yaw rates
(120 deg/sec), and zero-airspeed tail-slides.
Initially these phases were strictly followed
with no wing stores on a specially equipped single-
place (E-model) airplane. + The sequence was then
repeated in each of the desired symmetric external
store loadings, followed by limited scope tests of the
two-place (F-model) airplane.
Finally, asymmetric stores testing was
completed in phases 4 and 5. Phase 4 consisted of
single and multi-axis aggravated inputs and upright
spins and inverted spins for asymmetric loadings upto 14,000 ft-lbs. Phase 5 consisted only of single
axis inputs across a limited angle of attack range
(<25 °) lot weight asymmetries up to 28,000 ft-lbs.Over the course of three years, a total of 221 flights,
and 378 flights hours were devoted to high-angle-of-
attack maneuvering, departure resistance, and spin
testingJ'
t Modifications included a spin recovery parachute andemergency power accommodations.
Dynamically-Scaled Model Testing
The three non-captive dynamic model test
techniques (spin, free flight, and drop model as shown
in figure 2), have been instrumental in understanding
some of the complex types of behavior of fighter
aircraft at extreme angles of attack. They are
subsonic techniques and, in combination, cover a
wide range of high-angle-of-attack behavior as shown
in figure 3. These techniques complement each other
to improve the overall understanding of the spin and
recovery characteristics. For example, drop model
tests are used to augment the results obtained by spin
tunnel testing. In this regime, drop model test
points, which are typically limited in number, serve
to spot check the more statistically significant spin
tunnel results. Additionally, the influence of model
scale (affecting issues from manufacturing tolerances
to Reynolds number effects) is potentially exposed
owing to the diverse scale factors between the 3.6%-
scale spin-tunnel model and the 22%-scale dropmodel.
Yaw
rate
(stall/departure)
Angle of attack
Figure 3.- Dynamic model test techniques.
The scale models used in all of the non-captive
tests must be dynamically scaled to accurately
represent the full-scale aircraft flight dynamics. This
not only requires geometric scaling, but also requires
maintaining the equality of the scale model and full-
scale airplane ratios of inertial effects to gravitational
effects. 7'_ Therefore, the units of length are scaled
from geometric ratios; units of mass are scaled based
on equal relative density factors; and time is scaled
based on equal Froude numbers. Table I provides the
factors needed to determine the dynamically scaled
model properties. The scaling factors must be
properly applied throughout all areas affecting the
flight dynamics. For example, time scaling sets the
requirements tbr actuator response time, flight control
American Institute of Aeronautics and Astronautics

computerframerate,filterperformance,andany other
time related quantity *.
Table I.- Scale Factors for Dynamic Models.
Model values are obtained by multiplying airplanevalues by the following scale factors where N is the
model-to-airplane scale ratio, c r is the ratio of air density
at the airplane altitude to that at the model altitude, t is arepresentative unit of length, m is the vehicle mass, andg is the acceleration due to gravity.
Quantity Scale Factor
Linear dimension N
Relative density (m/p/3) l
Froude number (V2/l g) 1
Weight N3/_r
Moment of inertia NS/o'r
Linear velocity N °5Linear acceleration 1
Angular velocity N °5Time N °5
parameter identification, and control law refinementsfor accelerated and unaccelerated stability
improvements. 9'_°'_ As mentioned above, the high-
angle-of-attack flight regime was not an afterthought
tbr the F/A-18E/F program; indeed, all three of the
dynamic model methods were conducted for this
airplane including drop model.
The overall operation of the drop-model
technique involves dropping an unpowered,
dynamically-scaled model from a helicopter, flying it
through a series of maneuvers by remote control from
the ground, and recovering it with a flight termination
parachute.
Drop Model Te_t Technique Description
Figure 3 shows that a significant void of
information exists between the pre-stall and stall
departure results produced by the free-flight tests and
the fully developed spin behavior observed in the spin
tunnel tests. The radio-controlled drop model
technique was originally developed in the 1950's to
fill this void, providing information on the post-stall
and spin-entry motions of airplanes.
With the need to provide combat aircraft with
the capacity to aggressively maneuver at and beyond
stall, the drop model technique has been further
developed to permit the investigation of the related
flight dynamics issues while the test configuration is
undergoing large amplitude, high rate maneuvers over
the entire low-speed flight regime and is not solely
focused on spin entry. For example, past drop model
programs of other aircraft configurations have
explored a variety of low-speed phenomena including
highly dynamic motions such as divergent wing-rock,
aggressive tumbling, and roll departures as well as
more docile areas such as pitch control enhancement,
_:This is not a recent discovery nor is it inconsequential.Achieving scale time often has been the most demandingfactor in subsystem selections; for instance, everyupgrade to the drop model flight control computerhardware since the 1970's has been driven by scaledthroughput requirements.
Figure 4.- 22% F/A- 18E drop model.
Weighing from 880 to 1100 pounds
(depending on the airplane store/thei loading condition
of interest), the 22%-scale F/A- 18E/F model (pictured
in figure 4) is dropped from altitudes of up to 15,000
feet (model scale) and is tracked by a manually
operated ground-based tracker on which video cameras,
a radar ranging system, and telemetry antennas aremounted) In addition, a camera is mounted in the
canopy of the model to provide an onboard-pilot'sview.
The equivalent airplane altitude depends on the modelscale factor, the model-to-airplane mass ratio, and the airdensity: 15,000-ft model is about 35,000-ft full-scaleequivalent.
American Institute of Aeronautics and Astronautics

Thepilotsitsatacontrolstationandmonitorsdatadisplaysandthevideoimageswhileprovidingthree-axiscontrolthrougha customizedcockpitasshownin figure5. Theoverallcontrolloopconsistsof downlinkedflight data,a digitalcomputeronwhichthe controllawsare implemented,andacommanduplink. Oncethepilot hasexecutedtheintendedprofile, the onboardflight terminationparachuteisdeployedtodeceleratethemodelpriortosplashingdownintotheocean.
Falling Leaf Out of Control Flight Mode
The elimination of the falling leaf mode from
the Super Hornet is just one of the design team's
great triumphs. Although the mode naturally exists
in the bare, unaugmented airframe, the E/F flight
control laws successfully inhibit any undesirable
motion. Despite extensive development flight testing
and early operational evaluation, no sustained falling
leaf has been observed in any loading, or at any
permissible center of gravity location unless
operating with the feedbacks disabled (CAS-off).
Figure 5.- Drop model cockpit.
The drop model carries an extensive
complement of flight instrumentation to provide real-
time state feedback information to the flight control
computer, to drive real-time data displays for the
ground-based pilot, and for post-flight data analysis.
Duplex flight sensors measure angle of attack,
sideslip, airspeed, 3-axis angular rates and linear
accelerations, and 3-axis attitude. Simplex flight
instruments include pitot and static pressures, radar
range, pilot's-eye-view video, and control surface
position transducers. Various system-monitoringparameters and all of the flight sensor signals are
downlinked to a ground-based data logging system
and, along with pilot comments, video imagery from
the ground, and digital recordings of ground-generated
signals (such as pilot commands and mode selections)
form the collection of data obtained during a flight.
OVERVIEW OF AIRPLANE FLIGHT TEST
RESULTS
For the reader's benefit, a brief overview of the
airplane falling leaf and spin recovery flight test
results are presented here. More comprehensive
discussions of the airplane flight test program and itsresults can be found in the referencesY'
Spin Recovery_
The scope of the spin program included
upright and inverted spins to 120 deg/sec, clean,
symmetric and asymmetric external store loadings,FCS failure states, the full center of gravity range,
misapplied recovery controls, and both E- and F-models.
As with the falling leaf testing, spins wereinitiated with the feedbacks disabled (CAS-off).
Upright and inverted modes were identified. While
the upright modes were more stable and repeatable,
inadvertent entries from CAS-on departures favoredinverted modes.
As predicted, recoveries in Auto Spin
Recovery Mode were generally prompt with the
application of full lateral stick with the yaw rate for
upright spins, and against the yaw rate for inverted.
Releasing the controls completed the recovery as the
airplane restored CAS-on operation with the yaw rate
unwinding through 15 deg/sec.
RESULTS
The results from the drop model test program
are grouped by phenomena: longitudinal control
characteristics; spins (including several subtopics); an
unusual attitude high rotation rate mode dubbed
"cartwheel"; and a synchronized rolling and yawing
motion often referred to as a falling leaf. Resultsfrom the other scale model and the aircraft tests are
discussed along with these results where appropriate.
Airplane and drop model test results are often
best conveyed on the printed page in the form of
time-history plots of various flight parameters.
Many of the quantities measured during drop model
tests (including time itself) need to be scaled using
the proper factors as discussed above. All model
American Institute of Aeronautics and Astronautics

quantitiespresentedin thispaperhavebeenscaledtorepresentfull-scaleequivalentvaluesunlessexplicitlyindicatedotherwise.Note that the lateral-directional
pilot inputs (lateral stick and pedal) are normalizedsuch that full throw equates to _1 unit which is not
the usual convention for the airplane but allows for
co-plotting.
Longitudinal Response
The F/A-18E/F must possess significant
levels of pitch control throughout its large trim
angle-of-attack range to meet the high demands placedon it as an air superiority fighter. _2 One particular
area of interest is its ability to generate nose-down
recoveries from anywhere within this range and to doso with sufficient authority to overcome opposing
moments generated by inertia coupling or othereffects. Several of the aforementioned test methods
provide information relevant to this topic including
static tests, free-flight tests, and drop model tests.
Meeting pitch control margin requirements is a
complex endeavor due to factors that must be
addressed such as thrust effects and entry conditions
and is beyond the scope of this study. However, the
basic longitudinal response characteristics can be
assessed with the drop model.
Results from static low-speed aerodynamictests of a 15%-scale model of the F/A-18E
configuration in the 30- by 60-Foot Wind Tunnel
illustrate some of the fundamental longitudinal
characteristics of the configuration. Untrimmed lift
and pitching moment coefficient data are shown in
figure 6 for symmetric horizontal tail deflections
across the entire deflection range of-24 ° to +20 ° withfixed LEF/TEF deflections of 340/4 ° for an aft center
of gravity location of 29.4% mean aerodynamic cord.As mentioned above, these data indicate that the
configuration can be trimmed across a large angle-of
attack range that encompasses the angle of attack for
maximum lift. Also, the angle of attack for
minimum nose-down control power occurs near the
same point. These static test results were used to
direct studies of similar phenomena using free-flight
and drop model tests.
Cm 0
I I I
_h, deg I
_ © +20 1
[] +10 I©0/x -10
.-2o Ir_ -24 I
i
c.0
I I 1 I I I I-10 0 10 20 30 40 50 60 70 80 90
a, deg
Figure 6.- Effect of horizontal tail deflection on static
longitudinal characteristics.
Maneuvers were performed during the free-
flight and drop model tests where the respectivemodels were stabilized near maximum lift and a
forward pitch stick input was rapidly applied. The
responses through maximum pitch acceleration and
pitch rate were measured and indicated that good levels
of pitch authority exist.
Similar maneuvers were performed with the
airplane as shown in figure 7 where airplane and drop
model time-histories are co-plotted. These data show
that the drop model results correlate well with those
from the airplane.
6American Institute of Aeronautics and Astronautics

I-- Drop Model I
I I I I I
0 1 2 3 4 5 6
time, sec
Figure 7.- Longitudinal response characteristics lbr
drop model and airplane.
Extensive studies of the spin characteristics of
the F/A-18E/F involved spin tunnel, full-scale
aircraft, and drop model testing - each of which has
contributed uniquely and corroboratively to the overall
spin investigation. The free-spin tests conducted in
the Langley 20-Foot Vertical Spin Tunnel with a1/28'h-scale model identified upright and inverted spin
modes for the F/A-18E/F. _3 Those tests encompassed
a wide variety of mass properties (both symmetric and
asymmetric) that spanned the operational envelope forboth the E- and F-models. During each particular
spin test point, the control surfaces either remain
fixed or were moved from one preset position to one
other preset condition (i.e., these were open-loop testswith no state feedbacks). For the symmetrically
loaded configuration the highest rate upright spin was
a last (spin rate = 200 deg/sec), flat (or from 78 ° to90 °) mode occurring with fixed pro-spin controls.
This rate exceeded the spin rotation limit placed on
the airplane during the flight-testing phase. As such,
certain aspects of follow-on spin testing would be
relegated to the drop model as discussed below.
Spin recovery properties were also determined
in the spin tunnel tests for a similarly wide range of
conditions and indicated that the configuration has
satisfactory recovery characteristics using aerodynamic
controls. For example, recovery from the
aforementioned spin mode was 33/4 turns using
ailerons into and rudder against the rotation direction.
Spin tunnel tests also identified the salient features of
the emergency spin recovery parachute system
implemented on the full-scale high-angle-of-attack
7
test aircraft. A complete account of the spin tunnel
investigation is given in reference 13.The remainder of this section relates to the
drop model and full-scale spin tests. Except during
the spin resistance tests, all upright and inverted
limited-rate spin tests of the drop model and airplane
were conducted using the manually activated spin
mode to generate the large control surface deflections
needed to drive the vehicles into spins. The control
and mode sequencing was similar for the upright andinverted cases with the obvious differences. In both,
the longitudinal stick was applied followed by spin
mode selection, pedal deflection, and, after a delay, the
lateral stick was ramped in while the longitudinal
stick was relaxed. Upright spins were initiated from a
full aft stick condition and were generated using cross
controls (lateral stick direction opposite to the pedal
direction); inverted spins started from forward stick
and required coordinated controls. The recovery
method for both the upright and inverted spins was to
disengage the spin switch, neutralize pedal, andreverse the lateral stick (i.e., lateral stick into the
direction of the spin arrow).
The discussions of the spin tests are organizedinto five subsections: the first two address the
incipient spin properties whereas the final three
include the developed spin and recovery aspects.
Spin resistance. The spin tunnel results
indicated that the F/A-18E/F spin modes are fully
recoverable using full-authority control deflections.
Accordingly, the aircraft control system designers
implemented a sophisticated spin mode logic thatprovides full authority command capability from the
command stick and rudder pedals and serves as a pilot-
directed spin recovery scheme (as opposed to a totally
autonomous spin prevention scheme)/4 This mode
is normally armed automatically so that inadvertent
encroachments into the incipient spin regime can be
positively and rapidly arrested by the pilot. Note that
to engage anti-spin controls, the pilot must deflect
the lateral stick in the anti-spin direction; otherwise,the control laws remain in CAS mode. However, the
spin mode can be manually entered to perform
intentional spin maneuvers (discussed later). The
CAS mode provides departure/spin resistance by,
among other means, reducing excessive control
deflections at high angles of attack. The effectiveness
of the scheme is demonstrated by the drop model data
of figure 8 where the pilot applied and sustained full
American Institute of Aeronautics and Astronautics

pro-spin(cross)controlswhileremainingin CASmodefromafull aftstickinitialcondition.Theyaw
70
6050
6, 40deg 30
20
100
201510
13 5 e'go
-10-15
-20
10
0
-10
p,r, -20
deg/sec -30
-40
-50
1.0
0.5
5, 0
unitS.o. 5
-1.0
-1.5
L i i
I 'ji i i
90 100 110 120
time, sec
Figure 8.- Spin resistance in CAS mode for dropmodel.
rate smoothly accelerated reaching a very manageable
maximum of about 30 deg/sec with only slight
oscillations in sideslip: the model showed no
propensity to depart. In fact, the maneuver is a
moderate-angle-of-attack coordinated roll that was very
quickly terminated when the pilot neutralizedcontrols. Thus, the CAS mode provides high levels
of departure/spin resistance while maintaining a good
degree of maneuverability even in the presence of pro-
departure pilot inputs. In the next sections, the
manually activated spin mode was used to generate
greater amplitude control deflections so that the
developed spin properties could be investigated.
Sustaining the spin. Throughout the course
of spin testing, both the drop model and the airplane
had difficulty sustaining a spinning condition
following what appeared to be reasonable spin entry
maneuvers. The typical progression is shown in
figure 9 where both drop model and airplane data are
given.
100
50' 0
deg -50-100-150
100
r, 50
deg_ec 0
-50
200
_, 100
de_lO _
-200
150p 100
de_,_c_
-100-150
100
q, 50
de_sec 0-50
-100
1.0_, 0.5
uni_ 0-0.5-1.0
-- Drop Model I
--.A rp ane ]
...............T L i l
,........._ ..,,,j .........L I I
60 70 80 90 100
time, sec
Figure 9.- Self-recovering spin from spin mode for
drop model and airplane.
After application of pro-spin controls, the motion
progressively became oscillatory (notably in angle of
attack, roll rate, and pitch rate) as the yaw rate
developed. The lateral oscillations grew until the
excursions reached sufficient amplitude, usually in thedirection of the lateral stick (i.e., left roll in a nose-
right spin attempt), to cause the angle of attack to
kinematically decrease. Once at low angle of attackwith large rolling surface deflections, the motions
became roll dominated negating the yawing motion
and producing a self-recovery from the spin. Note,too, that this considerably complex and dynamic
condition is well represented by the drop model.The difficulty to routinely achieve a sustained
spin was most prevalent early in the testing sequencesand became less so as more experience was gained.
For the airplane, the use of split throttles augmented
the aerodynamic yaw acceleration that, of course, was
not available to the unpowered drop model. Instead,
the drop model relied on sustaining a highly stabilized
initial condition through the use of pilot selectable
pitch and roll dampers. Once these methodologies
8American Institute of Aeronautics and Astronautics

weredeveloped,spinsin themanuallyactivatedspinmodewereroutinelyachievable.
Simulation-based spin predictions. A very
extensive mathematical aerodynamic simulation of
the F/A- 18E/F containing approximately one million
data points has been assembled using informationfrom numerous static and dynamic wind-tunnel tests
and analytical methods, t-_ Nonetheless, the ability to
accurately measure and, more importantly, to
construct with confidence the proper math model
formulations capable of representing even the
fundamental dynamics (much less the subtle ones) in
the highly complex non-linear high-angle-of-attack
regime is often beyond the capacity of some of the
current modeling methods. ,6 Due to these
uncertainties, it is prudent to perform a flight-to-
simulation validation effort if possible.
Drop model flight data was used to assess the
simulation math model in the spin regime. Five
optional math model constructs of the rotational
characteristics are included as a part of the simulation
since research to determine the most accurate way to
model rotational characteristics is ongoing.
Simulation-generated data for the five options were
compared to the drop model spin data. Of the five,
the option that best matched the flight data is shown
in figure 10 as "Simulation Option A." The overall
spin rate and average angle of attack agrees well with
the drop model data. However, the simulation
produced smoother motions than the flight data
indicate. The requisite pitch and roll oscillations
needed to transform an emerging spin into a roll-
dominated self-recovering motion are generally not
predicted by any of the options. However, adding
simple degradations in the linear pitch damping
(Cmq) and roll damping (Cip) terms improved the
match as indicated by the "Simulation Option A +
Mods" trace. These comparisons illustrate the
process where flight data (from drop model or aircraft)
can be used to validate or refine an aerodynamic
database in terms of either selecting modeling
approaches or creating incremental modifications.
140120100
c¢, 80deg 60
4020
50"
0r, -50
deg/sec100
-150
-200
150t00
P, 50deg/sec 0
-50-100-150
150100
q, 50
de_se__5_-100
-150
1.0 I
8, 0.5
units 0-0.5
-1.0
3O
-- Drop Model
- - Simulation Option A |
..... Simulat on Opt on A + Mods|
i i i i
i i i
40 50 60 70
time, sec
Figure 10.- Comparison of simulation modifications
to drop model spin.
Limited-rate spins. The drop model technique
is uniquely suited among the scaled model methods to
perform spin entry maneuvers (recall that research in
the Spin Tunnel begins with the developed spin).
Accordingly, the drop model can be used to
investigate spin maneuvers that fall short of reaching
steady-state conditions. Since the airplane was
limited to yaw rates below most of the predicted
steady-state spin rates, the drop model is also the
model method of choice to conduct airplane-to-scale-model correlations.
Limited-rate upright spin maneuvers from the
airplane and the drop model, one of which is shown
in figure 11, indicate that the vehicle is well behaved
in the spin regime. Yaw rate increases smoothly in
response to the command. Once at full lateral stick,the motions become oscillatory, but the yaw ratecontinues to increase. After about 2 turns the call to
recover was made at a peak yaw rate of about 100
deg/sec. A rapid recovery was achieved in less thanone turn.
9
American Institute of Aeronautics and Astronautics
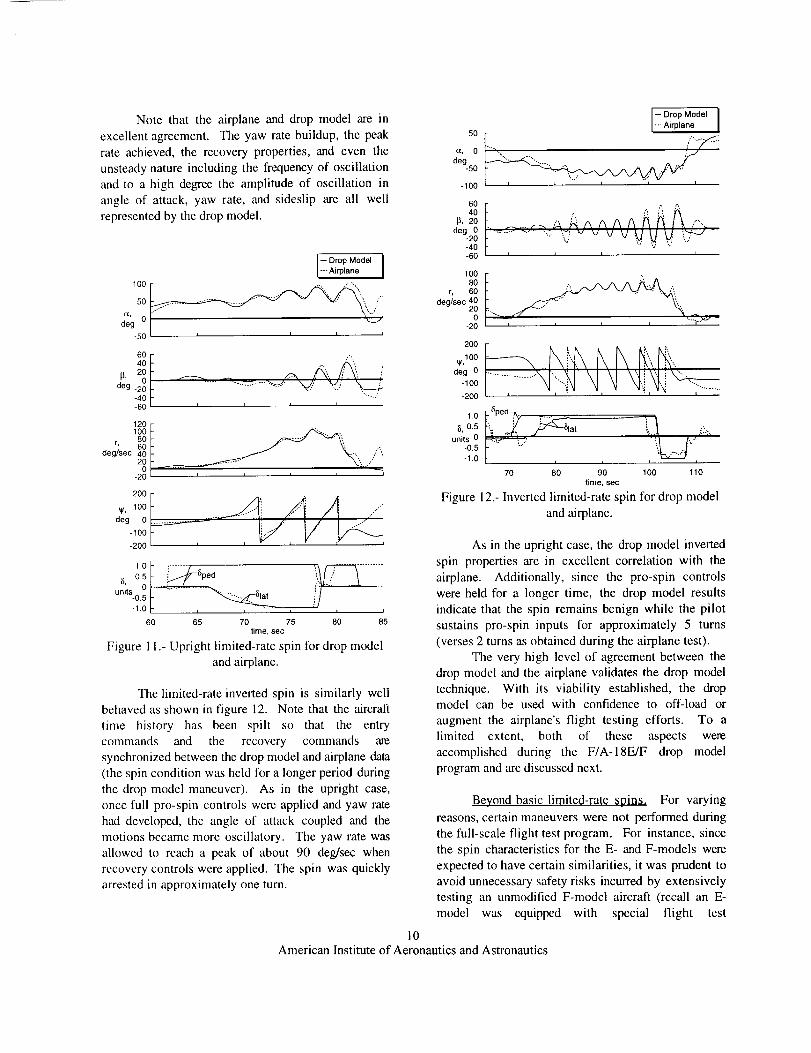
Notethattheairplaneanddropmodelareinexcellentagreement.Theyawratebuildup,thepeakrateachieved,therecoveryproperties,andeventheunsteadynatureincludingthefrequencyof oscillationandto ahighdegreetheamplitudeof oscillationinangleof attack,yawrate,andsideslipareall wellrepresentedbythedropmodel.
-- Drop Model--.Arp ane I
10050__,..,/"o_,
deg 0 ,...j'
-50 t
,-,
40 /
deg.20 .......... -.-_':_.---""_" %,_..,.: V:
-40 "'":-60 _ _ , L t
120 r
t8°I°°I- _ __...<.. y,,.r, 60
deg/sec 40
2o1-_-20 1 , , , ,
_, 100
deg 0 "-
-100
-200
1,0 :....... ; ..........o5I i_ -6ped d7---5o, o / /'/ [ ::_L" t
units'0"5 f ........ _-'---,-_._ :t_t //
-1.0 [- , , _:_"--T "---_ , ,
60 65 70 75 80 85time, sec
Figure 11.- Upright limited-rate spin for drop modeland airplane.
The limited-rate inverted spin is similarly well
behaved as shown in figure 12. Note that the aircraft
time history has been spilt so that the entry
commands and the recovery commands are
synchronized between the drop model and airplane data
(the spin condition was held for a longer period during
the drop model maneuver). As in the upright case,
once full pro-spin controls were applied and yaw rate
had developed, the angle of attack coupled and the
motions became more oscillatory. The yaw rate was
allowed to reach a peak of about 90 deg/sec when
recovery controls were applied. The spin was quickly
arrested in approximately one turn.
5O
o_, 0
deg-50
-100
6040
[3, 20
deg20
°40-60
1008O
r, 60
deg/sec 400
0-20
200
_,100
deg 0
-100
-200
1.0
6,0.5
units 0-0.5
-1.0
Figure
-- Drop Model I-- A rp ane |
m
............ :..,,:?.. vvvuUU',..,'?'_
I i i i i
70 80 90 100 110
time, sec
12.- Inverted limited-rate spin for drop model
and airplane.
As in the upright case, the drop model inverted
spin properties are in excellent correlation with the
airplane. Additionally, since the pro-spin controls
were held for a longer time, the drop model results
indicate that the spin remains benign while the pilot
sustains pro-spin inputs for approximately 5 turns
(verses 2 turns as obtained during the airplane test).
The very high level of agreement between the
drop model and the airplane validates the drop modeltechnique. With its viability established, the dropmodel can be used with confidence to off-load or
augment the airplane's flight testing efforts. To a
limited extent, both of these aspects were
accomplished during the F/A-18E/F drop model
program and are discussed next.
Beyond basic limited-rate spins. For varying
reasons, certain maneuvers were not performed during
the full-scale flight test program. For instance, since
the spin characteristics for the E- and F-models were
expected to have certain similarities, it was prudent to
avoid unnecessary safety risks incurred by extensively
testing an unmodified F-model aircraft (recall an E-
model was equipped with special flight test
10American Institute of Aeronautics and Astronautics

emergencyrecoverysystems).As such,spintestpointsfor the F-modelwerelimitedto uprightattitudesto avoidprolongedexposureto extremenegativeanglesofattackconditionswheretheenginesaremoresusceptibleto stall. However,to furtherincreaseconfidencethat F-modelspin recoverycharacteristicsaresimilarto theE-model,thedropmodelwasusedtoexploretheinvertedspin.
Thedropmodeldataof figure13confirmstrong similaritiesexist in the invertedspincharacteristicsbetweentheE- andF-models.Notethatthe F-modelmaneuveris split in ordertosynchronizetheentryandrecoveryportionsof themaneuver.Verysimilaryawaccelerations,peakrates,andyawdecelerationsareevident.In bothcases,positiverecoverywasquicklyrealizedwithinoneturnafterapplicationofrecoverycontrols.
1O0
ct, 50
deg 0
-50
-100
60
4O
p, 20
deg 0-20
-40
IO08O
r, 60
deg/seo4 i
-20
4OO
3OO
¥' 200
deg 1O0
0
1.0
6,0.5
units 0-0.5-1.0
Drop Model I-- E Model--- F Mode
i
........ v vvvv'.'q ....I I I I J
t I I A I
I
60 70 80 90 100 110time, sec
Figure 13.- Inverted limited-rate spin for E and F dropmodel.
The drop model was also used to augment thefull-scale vehicle testing by exploring conditions
beyond the limits imposed on the airplane, both in
terms of lateral weight asymmetry and rotation rate.
As mentioned above, the phase 4 airplane
flight testing included spins with lateral weight
asymmetries up to 14,000 ft-lbs, and phase 5
expanded the asymmetry to 28,000 ft-lbs, but
restricted the angle of attack; hence, no spins were
conducted with this loading. Drop model tests were
used to examine the spin conditions at the 28,000 ft-
ibs. asymmetric loading out to a spin rate of 90
deg/sec in the more severe direction of heavy wing
out. Tests were performed for the E-model (upright
spins) and the F-model (inverted spins). The datashowed that with the asymmetric store loadings, both
models were more prone to enter the spin, yetrecoveries occurred within 3 turns. These results
indicate that no unexpected accelerations were present
for the extreme store loadings tested.
High rate spins tests were performed with the
drop model to observe the nature of the spin as it
evolves towards steady state beyond the imposed
airplane flight-test spin rate limit of 120 deg/sec.
During these tests an unusual and extreme rotationmode (cartwheel) was uncovered and is the topic ofthe next section. However, note that while the
motion is extreme, it does not occur suddenly, and
recoveries were always achieved. As such, the
interest is more academic since a pilot would have
ample opportunity to affect recovery well before thecartwheel onset.
Cartwheel
High rate spin tests with the drop model were
performed in the same basic manner as the limited-
rate spin studies where the spin mode was engaged
manually to allow for large control surface
deflections. The data of figure 14 show the effect of
sustaining pro-spin controls for approximately 45
seconds. As with the limited-rate spins, the yaw rate
smoothly increased as the pilot applied pro-spinlateral stick. At full lateral stick, the motions
became somewhat oscillatory, yet yaw rate continued
to increase and began to level out at 115 deg/sec.
Sustaining the pro-spin controls for an additional
three turns resulted in an increase in yaw rate and theonset of the cartwheel motion. As the cartwheel
motion evolved, the yaw rate began to level off near
180 deg/sec, but the maneuver was terminated prior to
reaching an equilibrium condition.
The cartwheel is an inclined spinning motion
characterized by the rotation vector becoming normal
(or nearly so) to the velocity vector. The angle
between these vectors, given by Avn, increased to a
11American Institute of Aeronautics and Astronautics

maximumaveragevalueof about 60 ° during the
cartwheel maneuver as shown in figure 14.
150
1005,
deg 50
0
-50
5O
0
r, -50
deg/secl00
-150
-200
i t i
i i i
150100
5OP, 0
deg_ec.50
-100
-150
-200i i i
150
100
q, 50
deg/sec 0
-50
-100
-150
350300
_, 250
deg 200150
1005O
0
100
8O
AVe' 60deg
4O
20
0
1.0
0.5
units 0
-0.5
-1.0
i i i
i
i i i
60 80 100 120time, sec
Figure 14.- Drop model cartwheel.
Rigorously, a pure cartwheel motion occurs when thevectors are truly orthogonal (Avn = 90°) '', and the
*' Note that large values of Avta, may merely indicate thepresence of a pitching motion as is evident at thebeginning of the time history. A pure pitch motion alsoproduces an Avf_ of 90°.
motion is dominated by body-axis yaw rate. Then,
the angle of attack time history would be a series of
steps tt alternating between 0 and 180 ° while sideslip
would sinusoidally vary with an amplitude of __-90°.
Superimposed on this motion is a slow precession ofthe rotation vector, observed in this test to have a
period on the order of 20 seconds. Regarding the
pilot's g-environment, the cartwheel produces
loadings similar to any high-rate spin: inclining the
spin axis realigns the Earth's l-g field with respect to
the pilot, but the rotational contributions dominate as
is the case of a fast un-inclined spin.
As mentioned before, even though the motion
is extreme, it does not come on abruptly: several
unmistakable spin turns precede the yaw acceleration
associated with the cartwheel affording ample
opportunity to recover. Furthermore, the 180 deg/sec
rotation was arrested within 3.5 turns using standard
recovery controls (neutral pedal and lateral stick in the
direction of the yaw rate).This unusual cartwheel motion was also
observed during the free-spin tests in the Spin Tunnel
and during simulation studies. However, for different
reasons, the results from these techniques weredifficult to trust without further corroboration from
the drop model. In the Spin Tunnel, the motion was
difficult to observe for very long since the radius of
the precession path quickly grew larger than thetunnel test section. Furthermore, launch dynamics
could not be completely ruled out: since the model is
hand-launched with pre-rotation, it is possible to
inadvertently incline the spin axis to the velocityvector. In the simulation, the rates and motion
amplitudes were so large that the validity of the
aerodynamic math model was suspect. This was
particularly so in light of the math model's inability
to represent the oscillatory nature of the normal spin
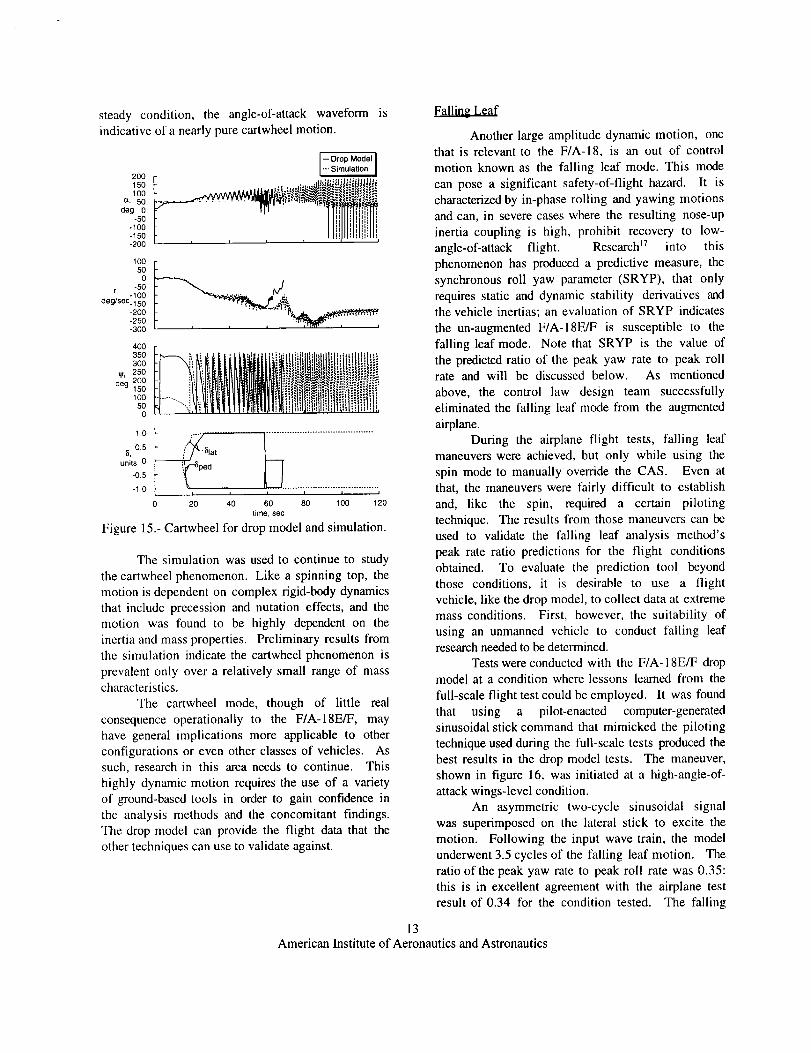
as previously discussed. However, with theaforementioned degradations to the linear pitch and
roll damping terms in place, the simulation is in
good agreement with the drop model flight data asshown in figure 15. The simulation represents the
overall levels of yaw rate and even the oscillations in
the motion. For the simulation run, the controls
were sustained until a steady-state condition was
reached. The simulation prediction indicates a peak
yaw rate of about 280 deg/sec develops before the
motion stabilizes at nearly 200 deg/sec. Once at the
12
tt Sensor dynamics, signal conditioning, and the likemay alter the measured angle of attack waveform.
American Institute of Aeronautics and Astronautics
2001501O0
_', 50deg 0
-50-100- 150-200
IO050
0
r -50. _ -100oeg,/sec. 150
-200-250-300
4OO35O3OO
_, 250
deg 200150IO0
1,0
0.5
units 0
-0.5
-1.0
steady condition, the angle-of-attack waveform is
indicative of a nearly pure cartwheel motion.
-- Drop Model--.Simulation I
_,j.J_ illili'-'it_t_-lJl
,=, F_, ,"i{Eii i
== =i =,"= i
iiI I i I I
: ......__' . .
i I I I 'lrlr" i I
i i' ' i'tttlitilltitltitL IL yL H............i ill llll! lI liiii iIIM iliii!iliii
':' .... W_
lot
°e°I _ I I I I I
0 20 40 60 80 100 120time, sec
Figure 15.- Cartwheel for drop model and simulation.
The simulation was used to continue to study
the cartwheel phenomenon. Like a spinning top, the
motion is dependent on complex rigid-body dynamics
that include precession and nutation effects, and themotion was found to be highly dependent on the
inertia and mass properties. Preliminary results from
the simulation indicate the cartwheel phenomenon is
prevalent only over a relatively small range of masscharacteristics.
The cartwheel mode, though of little real
consequence operationally to the F/A- 18E/F, may
have general implications more applicable to other
configurations or even other classes of vehicles. Assuch, research in this area needs to continue. This
highly dynamic motion requires the use of a variety
of ground-based tools in order to gain confidence in
the analysis methods and the concomitant findings.
The drop model can provide the flight data that the
other techniques can use to validate against.
Another large amplitude dynamic motion, onethat is relevant to the F/A-18, is an out of control
motion known as the falling leaf mode. This mode
can pose a significant safety-of-flight hazard. It is
characterized by in-phase rolling and yawing motionsand can, in severe cases where the resulting nose-up
inertia coupling is high, prohibit recovery to low-
angle-of-attack flight. Research _7 into this
phenomenon has produced a predictive measure, the
synchronous roll yaw parameter (SRYP), that only
requires static and dynamic stability derivatives andthe vehicle inertias; an evaluation of SRYP indicates
the un-augmented F/A-18E/F is susceptible to the
falling leaf mode. Note that SRYP is the value of
the predicted ratio of the peak yaw rate to peak rollrate and will be discussed below. As mentioned
above, the control law design team successfully
eliminated the falling leaf mode from the augmented
airplane.During the airplane flight tests, falling leaf
maneuvers were achieved, but only while using the
spin mode to manually override the CAS. Even atthat, the maneuvers were lairly difficult to establish
and, like the spin, required a certain piloting
technique. The results from those maneuvers can beused to validate the falling leaf analysis method's
peak rate ratio predictions for the flight conditionsobtained. To evaluate the prediction tool beyond
those conditions, it is desirable to use a flight
vehicle, like the drop model, to collect data at extrememass conditions. First, however, the suitability of
using an unmanned vehicle to conduct falling leafresearch needed to be determined.
Tests were conducted with the F/A- 18E/F dropmodel at a condition where lessons learned from the
full-scale flight test could be employed. It was found
that using a pilot-enacted computer-generatedsinusoidal stick command that mimicked the piloting
technique used during the full-scale tests produced the
best results in the drop model tests. The maneuver,shown in figure 16, was initiated at a high-angle-of-
attack wings-level condition.An asymmetric two-cycle sinusoidal signal
was superimposed on the lateral stick to excite the
motion. Following the input wave train, the model
underwent 3.5 cycles of the falling leaf motion. The
ratio of the peak yaw rate to peak roll rate was 0.35:this is in excellent agreement with the airplane test
result of 0.34 for the condition tested. The falling
13American Institute of Aeronautics and Astronautics
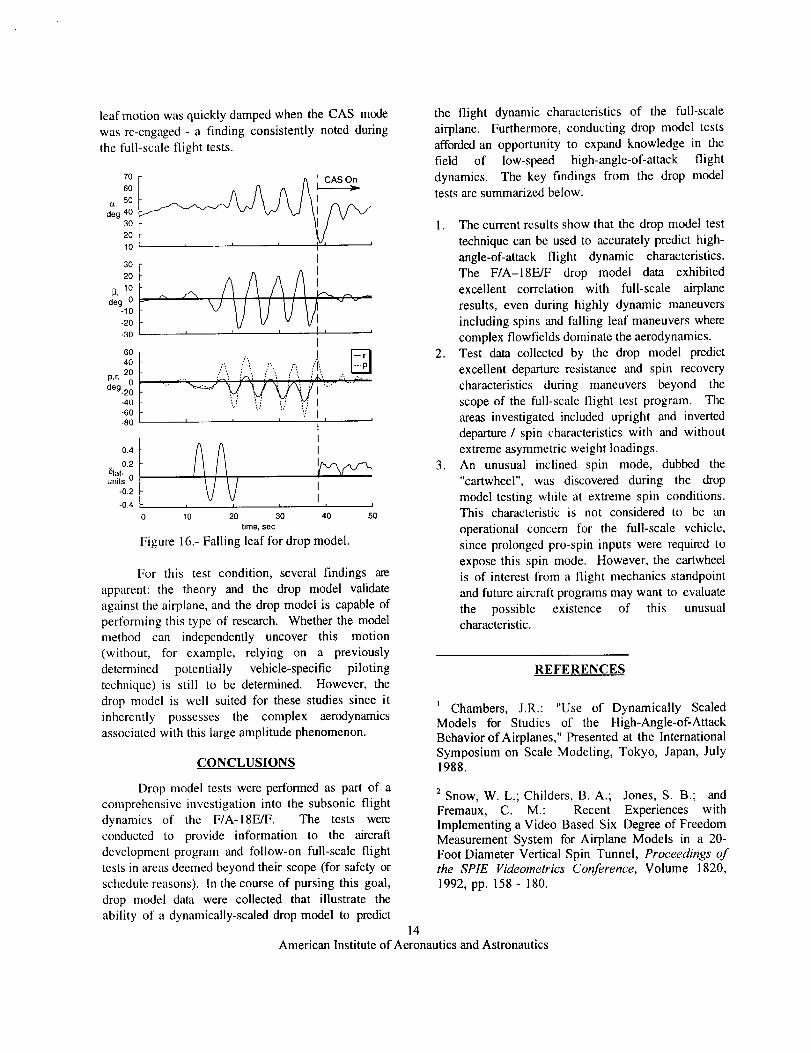
leafmotionwasquicklydampedwhentheCASmodewasre-engaged- a findingconsistentlynotedduringthefull-scaleflighttests.
70
60
5O
deg 403O
2O
10
3O
2O
_, 1odeg 0
-10
-20
-30
6O4O
p r 20
-40
-60
-80
0.4
0.251at, ^units u
-0.2
-0.4
I
I
I
........::"\ :',,, .-'. ['_, .• _' ,,"h' in'; ;' _:..' ".+"
"..:' !: !: .,_ IV I,
I I I I
I
I
II
l I I I I
0 10 20 30 40 50
time, se¢
Figure 15.- Falling leaf for drop model.
For this test condition, several findings are
apparent: the theory and the drop model validate
against the airplane, and the drop model is capable of
performing this type of research. Whether the modelmethod can independently uncover this motion
(without, for example, relying on a previously
determined potentially vehicle-specific piloting
technique) is still to be determined. However, the
drop model is well suited for these studies since it
inherently possesses the complex aerodynamics
associated with this large amplitude phenomenon.
CONCLUSIONS
Drop model tests were performed as part of a
comprehensive investigation into the subsonic flight
dynamics of the F/A- 18E/F. The tests were
conducted to provide information to the aircraft
development program and follow-on full-scale flight
tests in areas deemed beyond their scope (for safety or
schedule reasons). In the course of pursing this goal,
drop model data were collected that illustrate the
ability of a dynamically-scaled drop model to predict
the flight dynamic characteristics of the lull-scale
airplane. Furthermore, conducting drop model tests
afforded an opportunity to expand knowledge in the
field of low-speed high-angle-of-attack flight
dynamics. The key findings from the drop modeltests are summarized below.
1. The current results show that the drop model test
technique can be used to accurately predict high-
angle-of-attack flight dynamic characteristics.
The F/A-18E/F drop model data exhibitedexcellent correlation with full-scale airplane
results, even during highly dynamic maneuvers
including spins and falling leaf maneuvers where
complex flowfields dominate the aerodynamics.
2. Test data collected by the drop model predict
excellent departure resistance and spin recovery
characteristics during maneuvers beyond the
scope of the full-scale flight test program. The
areas investigated included upright and inverted
departure/ spin characteristics with and without
extreme asymmetric weight Ioadings.
3. An unusual inclined spin mode, dubbed the
"cartwheel", was discovered during the drop
model testing while at extreme spin conditions.This characteristic is not considered to be an
operational concern for the full-scale vehicle,
since prolonged pro-spin inputs were required to
expose this spin mode. However, the cartwheelis of interest from a flight mechanics standpoint
and future aircraft programs may want to evaluate
the possible existence of this unusualcharacteristic.
REFERENCES
t Chambers, J.R.: "Use of Dynamically ScaledModels for Studies of the High-Angle-of-AttackBehavior of Airplanes," Presented at the International
Symposium on Scale Modeling, Tokyo, Japan, July1988.
2 Snow, W. L.; Childers, B.A.; Jones, S. B.; andFremaux, C. M.: Recent Experiences with
Implementing a Video Based Six Degree of FreedomMeasurement System for Airplane Models in a 20-Foot Diameter Vertical Spin Tunnel, Proceedings ofthe SPIE Videometrics Conference, Volume 1820,1992, pp. 158- 180.
14American Institute of Aeronautics and Astronautics

3 Murri,DanielG.; Grafton,SueB.; andHoffier,KeithD.: "Wind-TunnelInvestigationandFree-FlightEvaluationof aModeloftheF-15STOLandManeuverTechnologyDemonstrator." NASATP-3003,August1990.
4 Cunningham,K.; Kenney,P.S.; Leslie,R.A.;Geyer,D.W.; Madden,M.M.; andGlaab,P.C.:"SimulationofaF/A-18E/FDropModelUsingtheLaSRS++Framework,"AIAA-98-4160,1998.
Madenwald,NiewoehnerandHoy,"F/A-18E/FHighAOA Flight Test DevelopmentProgram,"SETP 1998 Report to the Aerospace Profession:Proceedings', September, 1998, pg. 128-142.
6 Heller, M.; Niewoehner, R.J.; and Lawson, K.P.:
"High Angle of Attack Control Law Developmentand Testing for the F/A-18E/F Super Hornet,"
AIAA-99-4051, August 1999.
7 Scherberg, M.; and Rhode, R.V.: "MassDistribution and Performance of Free Flight Models,"NACA TN 268, 1927.
8 Wolowicz, C.H.; Bowman, J.S.; and Gilbert,W.P.: "Similitude Requirements and Scaling
Relationship as Applied to Model Testing," NASATP-1435, August 1979.
Croom, M.A.; et al.: "Dynamic Model Testing of
the X-31 Configuration For High-Angle-of-AttackResearch," AIAA 93-3674 CP, August 1993.
_o Croom, M.A.; et al.: "High-Alpha Flight
Dynamics Research on the X-29 Configuration UsingDynamic Model Test Techniques," SAE-881420,October 1988.
_J Villeta, Jose R.: "Lateral-Directional Static and
Dynamic Stability Analysis at High Angles of Attackfor the X-31 Configuration," M.S. Thesis, George
Washington University, August 1992.
12Ogburn, M.E.; et al.: "High-Angle-of-Attack Nose-Down Pitch Control Requirements for Relaxed StaticStability Combat Aircraft," NASA CP-3149, October1990.
_3Fremaux, C.M.; et al.: "Spin-Tunnel Investigationof 1/28-Scale Models of the McDonnell Douglas
F-18E and F-18F Airplanes," NASA TM SX-4678,
August 1995.
_4 DeMand, R.P.: "F/A-18E/F Flight Control
System Design Report, Volume II, Control LawOperation and Mechanization, Revision F," TheBoeing Company MDC 95A0037, March 1998.
t5 Dzenitis, E.G.; Evans, C.L.; Marks, B.A.; and
Miller, G.A.: "F/A-18E/F Stability and ControlAnalysis/Data Report," McDonnell Aircratt andMissile Systems MDC 97A0092, December 1995.
_6Brandon, J.M.; and Foster, J.V.: "Recent DynamicMeasurements and Considerations for AerodynamicModeling of Fighter Airplane Configurations," AIAA
98-4447, August 1998.
17 Foster, John V.: "Investigation of the
Susceptibility of Fighter Airplanes to the Out-of-Control Falling Leaf Mode," High-Angle-of-AttackTechnology Conference, NASA Langley Research
Center, VA. September 1996.
15
American Institute of Aeronautics and Astronautics