Akuntansi Manajemen Edisi 8 oleh Hansen & Mowen Bab 13
28
1 PowerPoint PowerPoint Presentation by Presentation by Gail B. Wright Gail B. Wright Professor Emeritus of Professor Emeritus of Accounting Accounting Bryant University Bryant University © Copyright 2007 Thomson South-Western, a part of The Thomson Corporation. Thomson, the Star Logo, and South-Western are trademarks used herein under license. MANAGEMENT ACCOUNTING 8 th EDITION BY HANSEN & MOWEN 13 CAPITAL INVESTMENT DECISIONS STUDENT EDITION
description
Akuntansi Manajemen Edisi 8 oleh Hansen & Mowen Bab 13 Capital Investment Decisions
Transcript of Akuntansi Manajemen Edisi 8 oleh Hansen & Mowen Bab 13

1
PowerPointPowerPoint Presentation by Presentation by
Gail B. WrightGail B. WrightProfessor Emeritus of AccountingProfessor Emeritus of AccountingBryant UniversityBryant University
© Copyright 2007 Thomson South-Western, a part of The Thomson Corporation. Thomson, the Star Logo, and
South-Western are trademarks used herein under license.
MANAGEMENT ACCOUNTING
8th EDITION
BY
HANSEN & MOWEN
13 CAPITAL INVESTMENT DECISIONS
STUDENT EDITION
2
1. Explain what a capital investment decision is; distinguish between independent & mutually exclusive decisions.
2. Compute payback period, accounting rate of return for proposed investment; explain their roles.
3. Use net present value analysis for capital investment decision of independent projects.
LEARNING OBJECTIVESLEARNING OBJECTIVES
Continued
3
4. Use internal rate of return to assess acceptability of independent projects.
5. Discuss the role and value of postaudits.
6. Explain why NPV is better than IRR for capital investment decisions of mutually exclusive projects.
LEARNING OBJECTIVESLEARNING OBJECTIVES
Continued

4
7. Convert gross cash flows to after-tax flows.
8. Describe capital investment in advanced manufacturing environment.
LEARNING OBJECTIVESLEARNING OBJECTIVES

5
How do the 2 types of capital budgeting differ?
In capital budgeting, decisions to accept/reject an independent project
does not affect decisions about another project whereas acceptance of
a mutually exclusive project precludes other projects.
LO 1
6
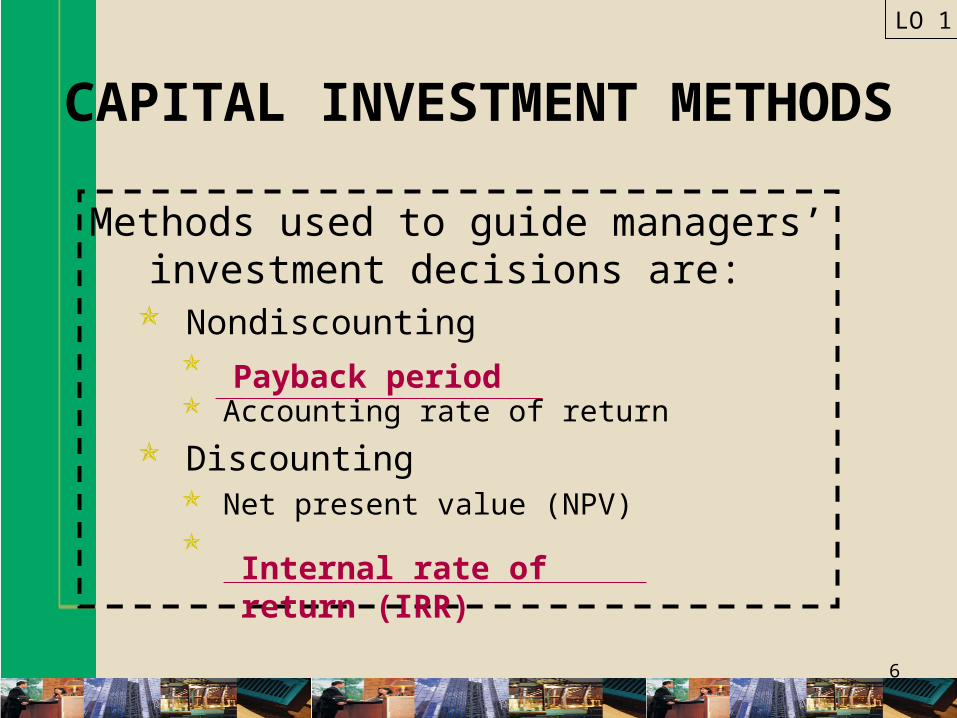
CAPITAL INVESTMENT METHODS
Methods used to guide managers’ investment decisions are:
Nondiscounting Payback period Accounting rate of return
Discounting Net present value (NPV) Internal rate of return (IRR)
LO 1
Payback period
Internal rate of return (IRR)
7
PAYBACK PERIOD: DefinitionPAYBACK PERIOD: Definition
Is the time required for a firm to recover its original
investment.
LO 2

8
FORMULA: Payback Period
Payback period tells how long it will take a project to break even.
LO 2
Payback period
= Original investment ÷ Annual cash flows
= $1,000,000 / $500,000
= 2 years
9
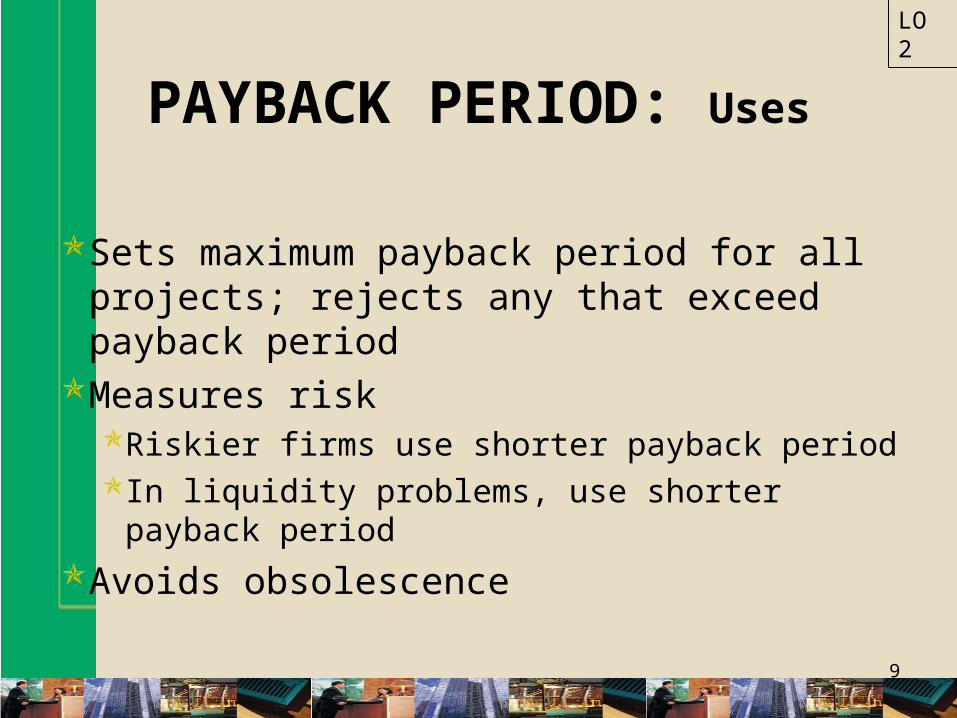
PAYBACK PERIOD: Uses
Sets maximum payback period for all projects; rejects any that exceed payback period
Measures riskRiskier firms use shorter payback periodIn liquidity problems, use shorter payback period
Avoids obsolescence
LO 2
10
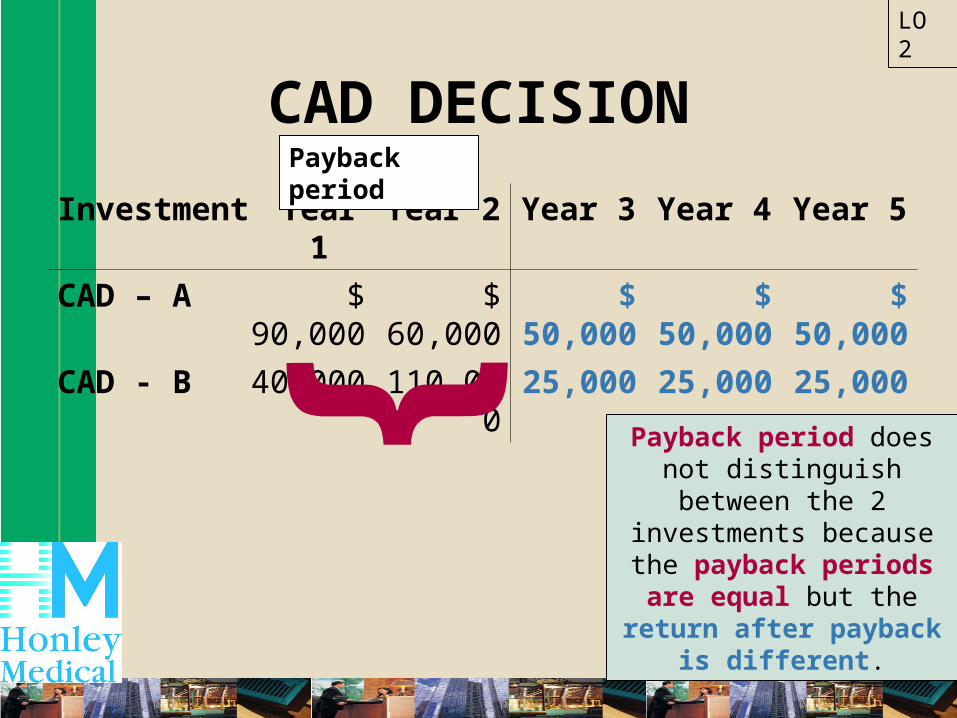
CAD DECISION
LO 2
Investment Year 1 Year 2 Year 3 Year 4 Year 5
CAD – A $ 90,000 $ 60,000 $ 50,000 $ 50,000 $ 50,000
CAD - B 40,000 110,000 25,000 25,000 25,000
Payback period does not distinguish between the 2 investments because the
payback periods are equal but the return after payback
is different.
Payback period
}
11
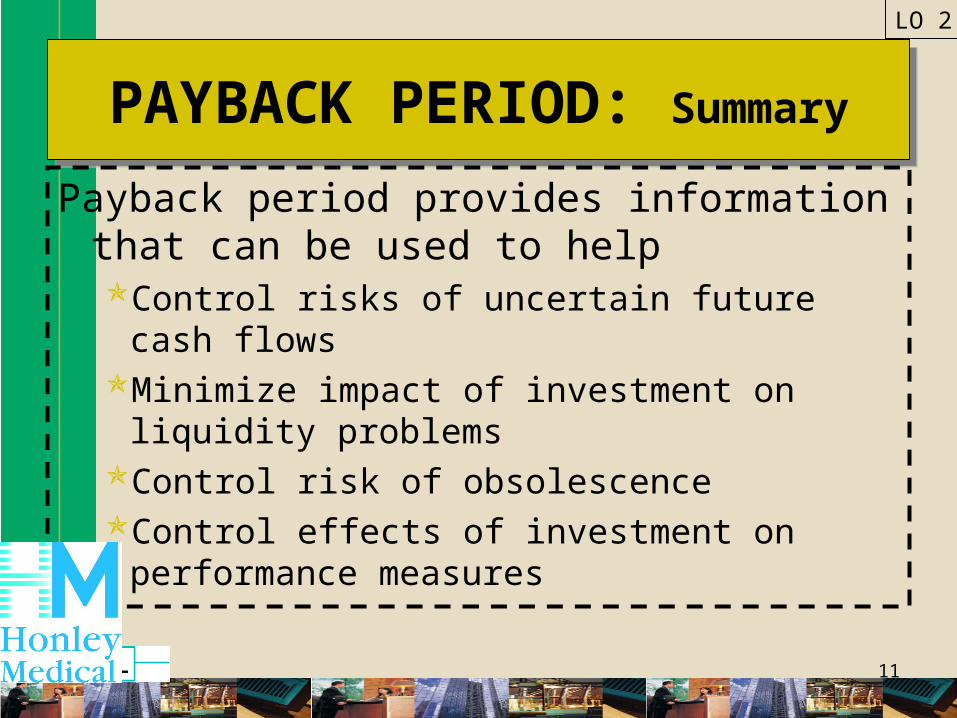
PAYBACK PERIOD: SummaryPAYBACK PERIOD: Summary
Payback period provides information that can be used to helpControl risks of uncertain future cash flowsMinimize impact of investment on liquidity
problemsControl risk of obsolescenceControl effects of investment on performance
measures
LO 2

12
FORMULA: Accounting Rate of Return
Accounting rate of return is a nondiscounting model of return on a project.
LO 3
Accounting rate of return
= Average income ÷ Original investment (or Average investment)
= ($36,000 - $20,000) / $100,000 = 16% or
= ($36,000 - $20,000) / $50,000 = 32%
13
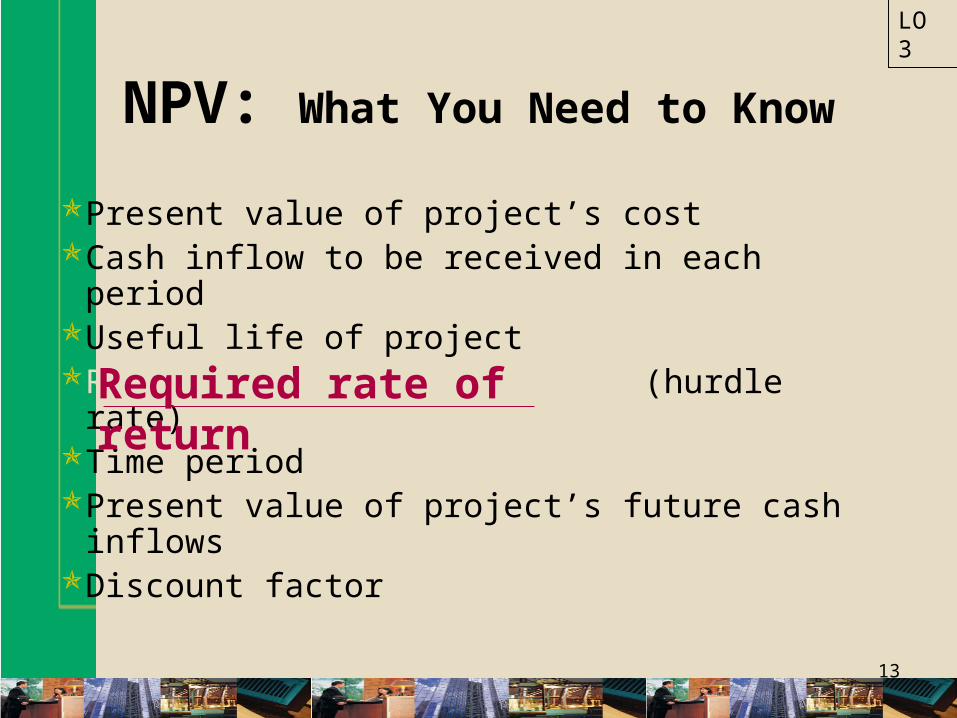
NPV: What You Need to Know
Present value of project’s costCash inflow to be received in each periodUseful life of projectRequired rate of return (hurdle rate)Time periodPresent value of project’s future cash inflowsDiscount factor
LO 3
Required rate of return
14
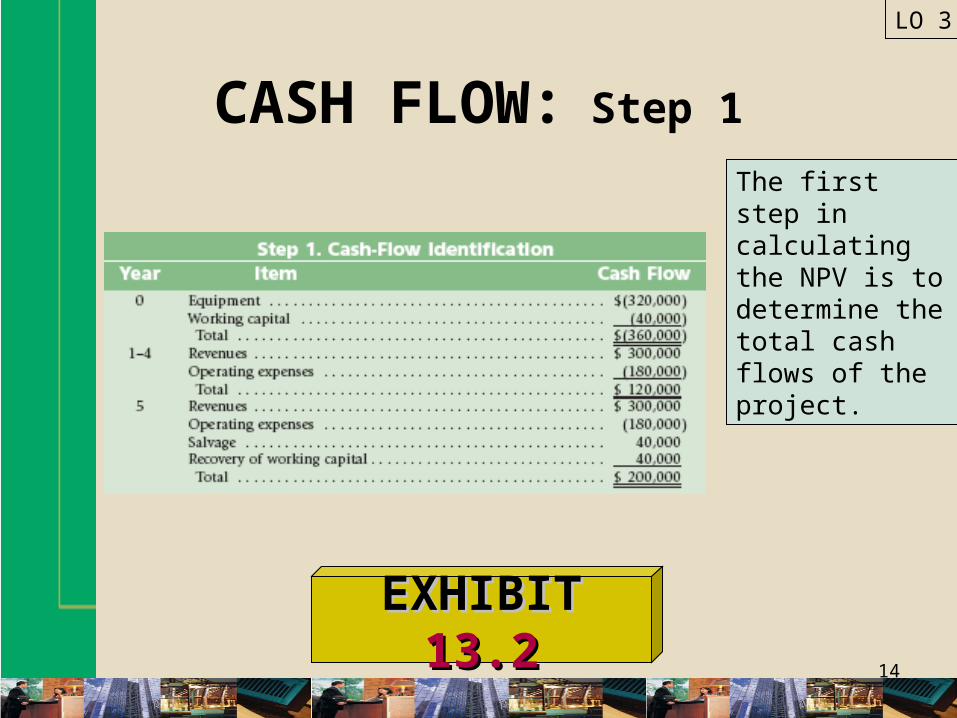
CASH FLOW: Step 1
LO 3
EXHIBITEXHIBIT 13.213.2
The first step in calculating the NPV is to determine the total cash flows of the project.
15
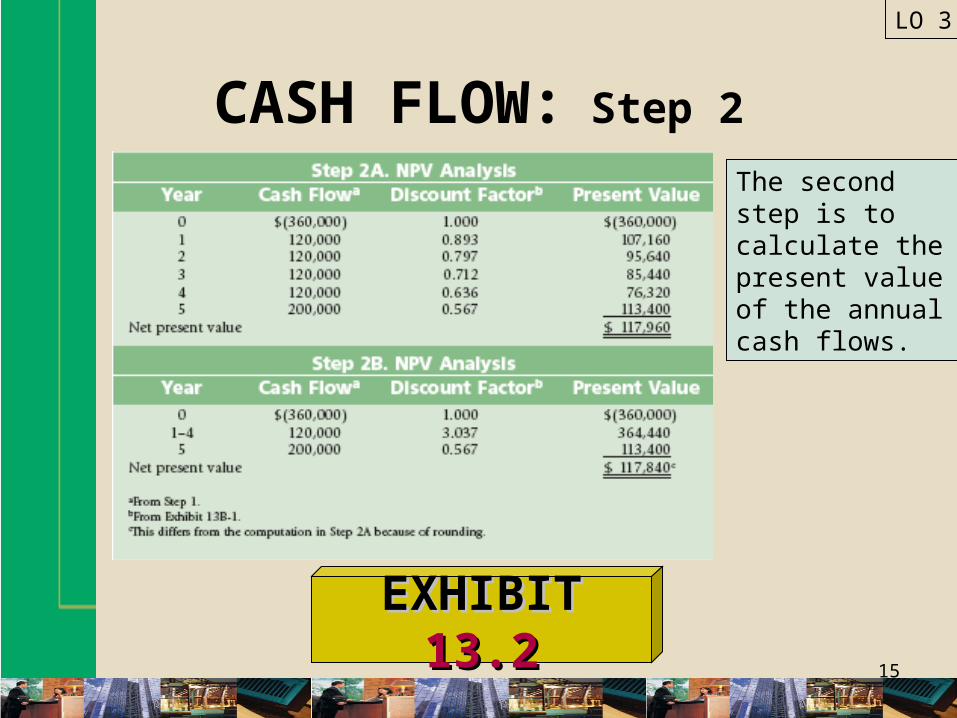
CASH FLOW: Step 2
LO 3
EXHIBITEXHIBIT 13.213.2
The second step is to calculate the present value of the annual cash flows.

16
FORMULA: IRR
IRR measures a project’s rate of return against a hurdle rate for accepting projects.
LO 4
IRR
= Investment ÷ Annual cash flows
= $1,200,000 / $499,500
= 2.402 (12%)
17
POSTAUDIT: DefinitionPOSTAUDIT: Definition
Compares actual benefits to estimated benefits & actual operating costs to estimated
operating costs.
LO 5
18
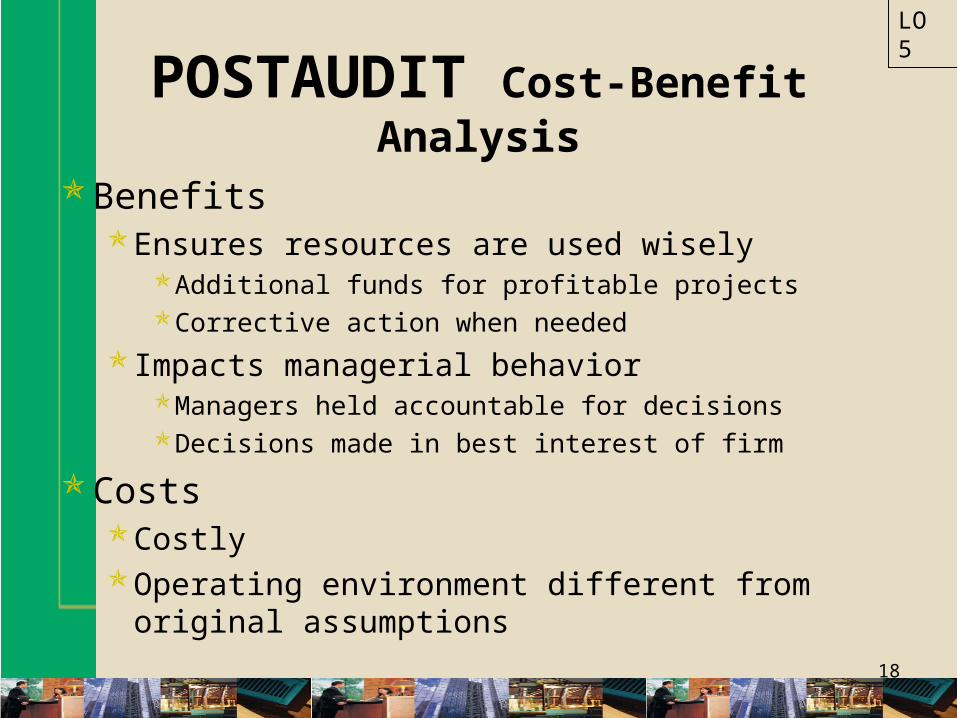
POSTAUDIT Cost-Benefit Analysis
BenefitsEnsures resources are used wisely
Additional funds for profitable projectsCorrective action when needed
Impacts managerial behaviorManagers held accountable for decisionsDecisions made in best interest of firm
CostsCostlyOperating environment different from original assumptions
LO 5
19
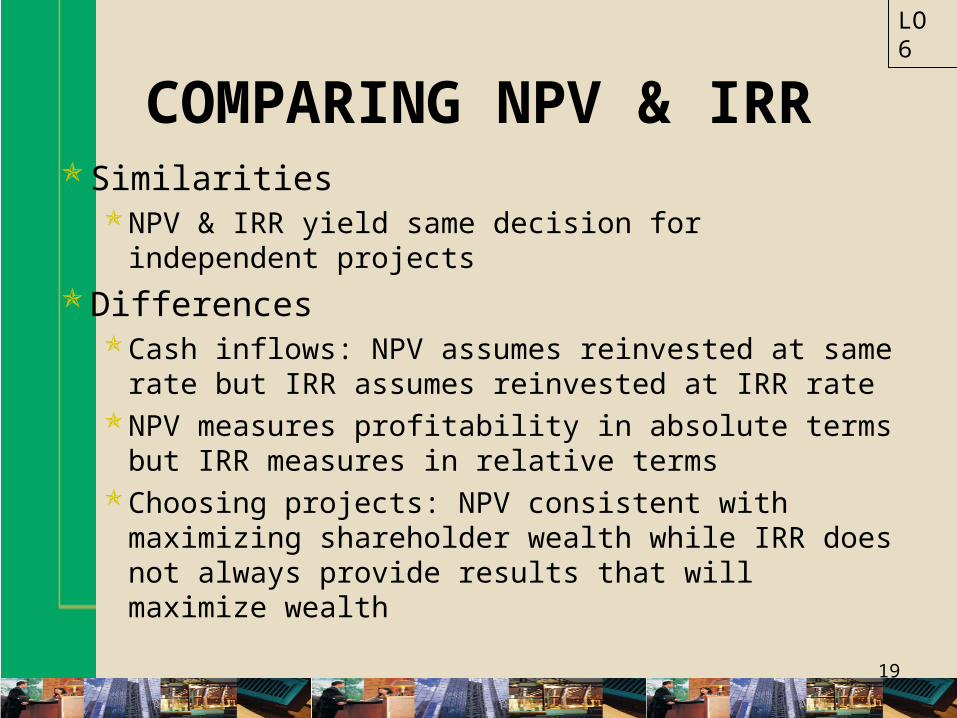
COMPARING NPV & IRRSimilarities
NPV & IRR yield same decision for independent projects
DifferencesCash inflows: NPV assumes reinvested at same rate but
IRR assumes reinvested at IRR rateNPV measures profitability in absolute terms but IRR
measures in relative termsChoosing projects: NPV consistent with maximizing
shareholder wealth while IRR does not always provide results that will maximize wealth
LO 6
20
SELECTING BEST PROJECTS
Selection processAssess cash flow pattern for each projectCompute NPV for each projectIdentify project with greatest NPV
LO 6
21
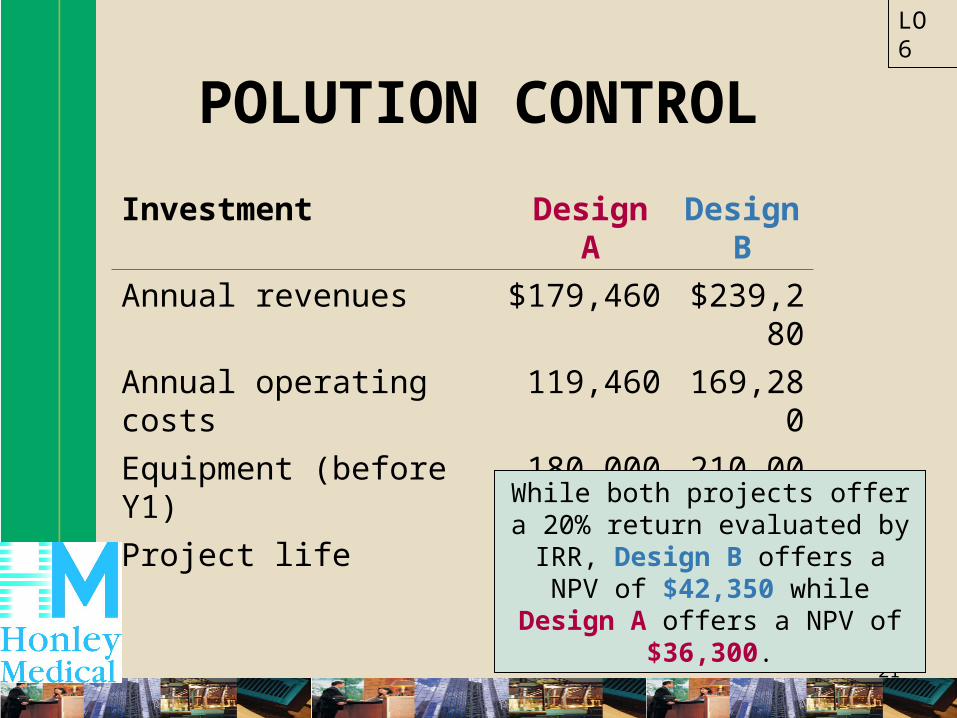
POLUTION CONTROL
LO 6
Investment Design A Design B
Annual revenues $179,460 $239,280
Annual operating costs 119,460 169,280
Equipment (before Y1) 180,000 210,000
Project life 5 years 5 years
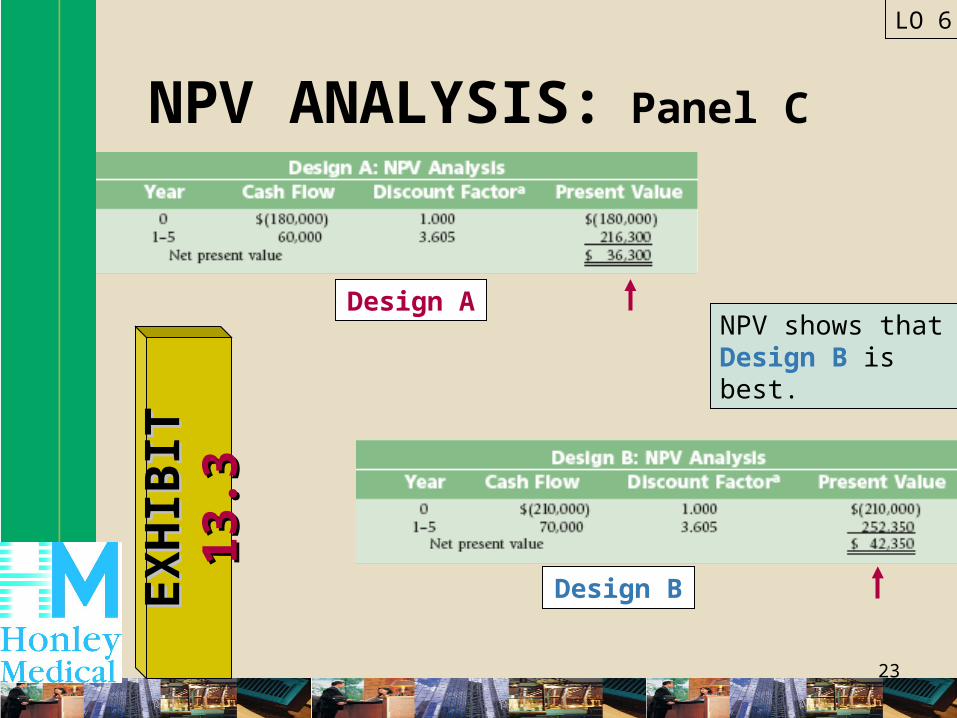
While both projects offer a 20% return evaluated by IRR, Design B
offers a NPV of $42,350 while Design A offers a NPV of $36,300.
22
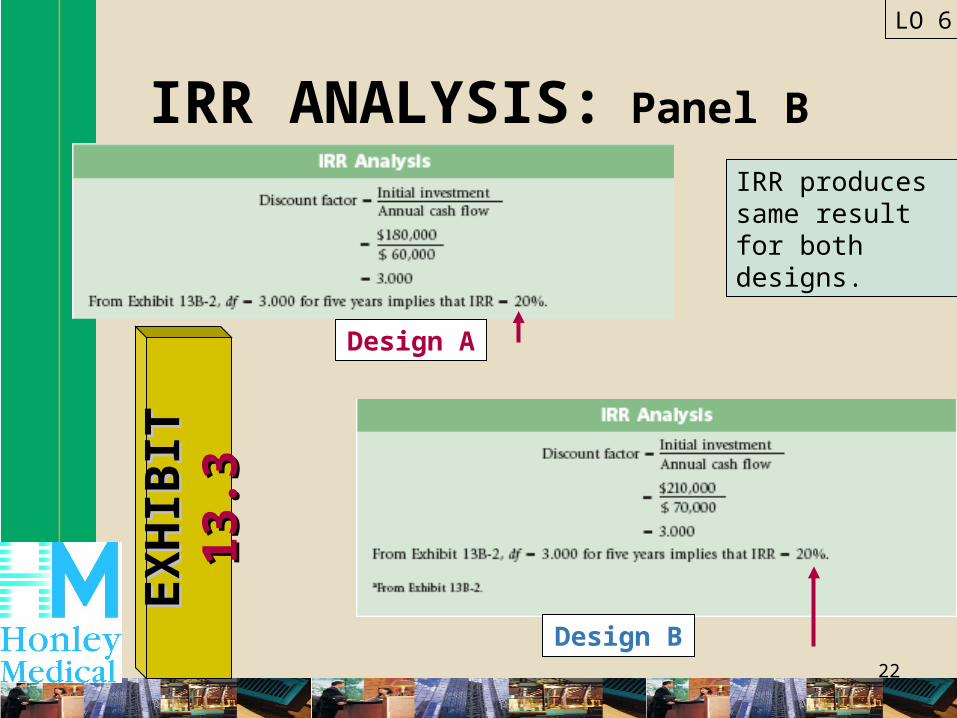
IRR ANALYSIS: Panel B
LO 6
EX
HIB
ITE
XH
IBIT
13.
313
.3IRR produces same result for both designs.
Design A
Design B
23
NPV ANALYSIS: Panel C
LO 6
EX
HIB
ITE
XH
IBIT
13.
313
.3
NPV shows that Design B is best.
Design A
Design B
24
COMPUTING CASH FLOWS
To compute project cash flows,First forecast revenues, expenses, & capital
outlaysThen adjust gross cash flows for inflation & tax
effects
LO 7
inflation

25
CASH FLOWS & INFLATION
LO 7
EXHIBITEXHIBIT 13.413.4
The project will not be accepted unless an inflation adjustment is done.
26
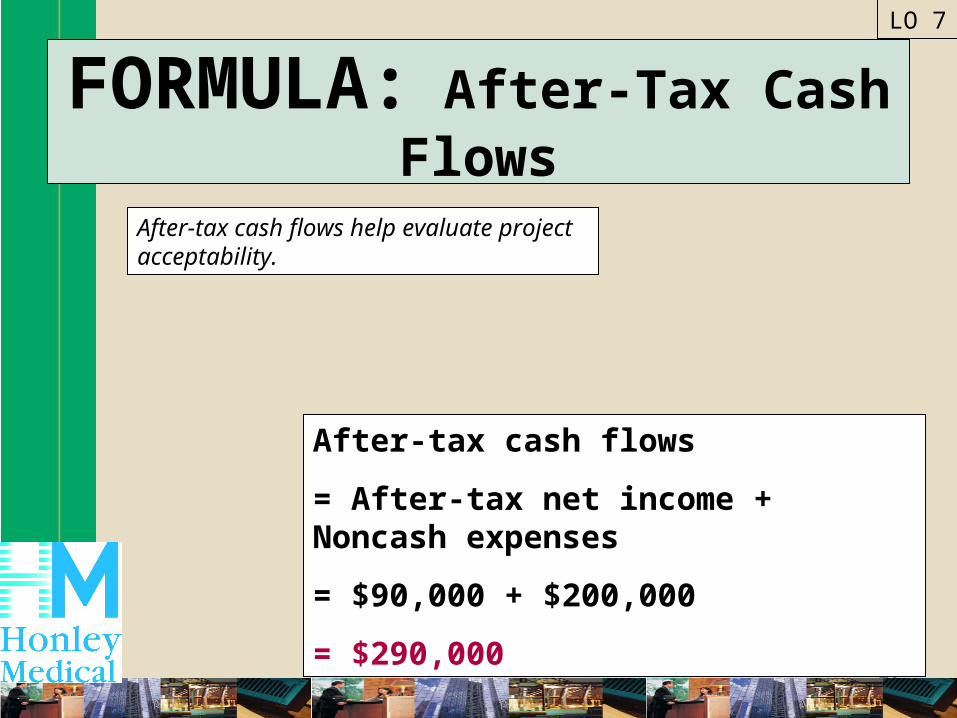
FORMULA: After-Tax Cash Flows
After-tax cash flows help evaluate project acceptability.
LO 7
After-tax cash flows
= After-tax net income + Noncash expenses
= $90,000 + $200,000
= $290,000
27
Is financial information the only information used to set
criteria for project evaluation?
NO. Both financial and nonfinancial information are used to set criteria in
an advanced manufacturing environment.
LO 8

28
THE ENDTHE END
CHAPTER 13