Airport Surveillance Radar (ASR-9) Wind Shear Processor ... · PDF fileWind Shear Processor:...
34
Lincoln Laboratory MASSACHUSETTS INSTITUTE OF TECHNOLOGY LEXINGTON, MASSACHUSETTS Project Report ATC-189 Airport Surveillance Radar (ASR-9) Wind Shear Processor: 1991 Test at Orlando, FL M.E. Weber 1 June 1992 Prepared for the Federal Aviation Administration, Washington, D.C. 20591 This document is available to the public through the National Technical Information Service, Springfield, VA 22161
Transcript of Airport Surveillance Radar (ASR-9) Wind Shear Processor ... · PDF fileWind Shear Processor:...

Lincoln LaboratoryMASSACHUSETTS INSTITUTE OF TECHNOLOGY
LEXINGTON, MASSACHUSETTS
Project ReportATC-189
Airport Surveillance Radar (ASR-9) Wind Shear Processor:
1991 Test at Orlando, FL
M.E. Weber
1 June 1992
Prepared for the Federal Aviation Administration,
Washington, D.C. 20591
This document is available to the public through the National Technical Information Service,
Springfield, VA 22161

This document is disseminated under the sponsorship of the Federal Aviation Administration, Department of Transportation, in the interest of information
exchange. The U.S. Government assumes no liability for its contents or use thereof.

1. Report No.
ATC-189
2. Government Accession No.
DOTIFAAlNR-92/7
TECHNICAL REPORT STANDARD TITLE PAGE
3. Recipient's Catalog No.
4. Title and SubtitleAirport Surveillance Radar (ASR-9) Wind ShearProcessor: 1991 Test at Orlando, FL
7. Author(s)
Mark E. Weber
9. Performing Organization Name and Address
Lincoln Laboralory, MITP.O. Box 73Lexington, MA 02173-9108
12. Sponsoring Agency Name and AddressDepartment of TransportationFederal Aviation AdministrationSystems Research and Development ServiceWashington, DC 20591
15. Supplementary Notes
5. Report Date1 June 1992
6. Performing Organization Code
8. Performing Organization Report No.
ATC-189
10. Work Unit No. (TRAIS)
11. Contract or Grant No.
DTFA-O1-89-Z-02030
13. Type 01 Report and Period Covered
Project Reporl
14. Sponsoring Agency Code
This report is based on studies performed at Lincoln Laboratory, a center for research operated by Massachusetts Institutp ofTechnology. The work was sponsored by the Department of the Air Force under Contract FI9628-90-C-0002.
16. Abstract
An operational test of a Wind Shear Processor (WSP) add-on to the Federal Aviation Administration's airportsurveillance radar (ASR-9) took place at Orlando International Airport during July and August 1991. Thp test allowedfor both quantitative assessment of the WSP's signal processing and wind shear detection algorithms and for feedbackfrom air traffic controllers and their supervisors on the strengths and weaknesses of the system. Thunderstorm activityduring the test period was intense; low-altitude wind shear impacted the runways or approach/departure corridors on 40of the 53 test days. As in previous evaluations of the WSP in the southeastern United States, microburst detectionperformance was very reliable. Over 95% of the strong microbursts that affected the Orlando airport during the testperiod were detected by the system. Gust front detection during the test, while operationally useful, was not as reliable asit should have been, given the quality of gust front signatures in the base reflectivity and radial velocity data from theWSP. Subsequent development of a "Machine Intelligent" gust front algorithm has resulted in significantly improveddetection capability. Results from the operational test are being utilized in ongoing refmement ofthe WSP.
17. Key Words
airport surveillance radarmicroburstair traffic control
wind shear processorgust front
18. Distribution Statement
This document is available to the public through theNational Technical Information Service,Springfield, VA 22161.
19. Security Classif. (of this report)
Unclassified
FORM DOT F 1700.7 (8-72)
20. Security Classif. (of this page)
Unclassified
Reproduction of completed page authorized
21. No. of Pages
48
22. Price

ABSTRACT
An operational test of a Wind Shear Processor (WSP) add- on to the Federal Aviation Administration's airport surveillance radar (ASR-9) took place at Orlando International Airport during July and August 1991. The test allowed for both quantitativeassessment of the WSP's signal processing and wind shear detection algorithms and forfeedback from air traffic controllers and their supervisors on the strengths and weaknesses of the system. Thunderstorm activity during the test period was intense; lowaltitude wind shear impacted the runways or approach/departure corridors on 40 of the53 test days. As in previous evaluations of the WSP in the southeastern United States,microburst detection performance was very reliable. Over 95% of the strong microbursts (> 30 knots) that affected the Orlando airport during the test period were detected by the system. Gust front detection during the test, while operationally useful,was not as reliable as it should have been, given the quality of gust front signatures inthe base reflectivity and radial velocity data from the WSP' Subsequent developmentof a "Machine Intelligent" gust front algorithm has resulted in significantly improveddetection capability. Results from the operational test are being utilized in ongoingrefinement of the WSP'
111

ACKNOWLEDGMENTS
John Saia, Bill Drury and John Maccini designed and built the WSP receivers. BillDrury developed the ASR-9signal interface for the WS:P. Jim Pieronek developed thedigital signal processor and recording system; real-time programming was accomplished by Oliver Newell and Bill Moser. TheWSP microburst detection algorithm wasdesigned and implemented by Oliver Newell. The "advanced gust front algorithm"used during the 1991 test was developed and implemented by Steve Olson,Adam Abrevaya, Wes WJ.1son, Seth noxel and "!erri Noyes. The "machine intelligent gust algorithm" is the work of Dick Delanoy, with meteorological interpretation support fromSeth lioxeL Joe Cullen performed much ofthe algorithm scoring reported herein. RodCole developed the IDWRlEnhanced LLWAS "message level" integration algorithmand supervised development of the "path-oriented" scoring methodology. Wes Johnston, Jay Laseman and Craig McFarland operated the WSP testbed.
We appreciate the cooperation of Orlando Air naffic Control personnel. ChrisWebb, Bryce Courtney and Wil Mowdy, in particular, provided invaluable assistancein controller training, test conduct and evaluation. Marv Dalton and J.D. Smith of Orlando's Airport Facilities office have been extremely helpful in establishing and maintaining the ASR-9 testbed.
v
TABLE OF CONTENTS
Section ~
ABSTRACT III
ACKNOWLEDGEMENTS v
LIST OF FIGURES ix
LIST OF TABLES ix
l.INTRODUCfION 1
2. ORLANDO WSP TESTBED 3
2.1 WSP Radar Interfaces and Receivers 3
2.2 Digital Processor and Recording System 8
2.3 User Displays 9
2.4 Supporting Sensors 9
3. SYNOPSIS OF 1991 OPERATIONAL TEST 17
3.1 Microburst Detection Performance 17
3.2 Gust Front Detection Performance 19
3.3 Six-Level Precipitation and Storm Motion Algorithm 21
3.4 FAA Technical Center and Air Traffic Controller Evaluations 22
4. SUMMARY AND FUTURE ACTIVITIES 25
REFERENCES 27
APPENDIX A: DATA PROCESSING ALGORITHMS 29
A.l Signal Processing Algorithms 29
A.2 Microburst Detection Algorithm 29
A.3 Gust Front Detection Algorithm 32
A.4 Storm 1tacking Algorithm 32
A.5 Anomalous Propagation Censoring 33
APPENDIX B: OFF-LINE EVALUATION OF ASR-9 WSP/ENHANCEDLLWAS INTEGRATION
35
VlI

LIST OF ILLUSTRATIONS
Figure
N Pageo.1. High-level block diagram of the 1991 Orlando ASR-9 Wmd Shear
Processor testbed. 4
2. Photograph of ASR-9 Wind Shear Processor testbed onOrlando International Airport. 5
3. Wmd Shear Processor receivers. 7
4a. Geographic Situation Display. 11
4b. Alphanumeric ("ribbon") display. The first line is read as "microburstalert on runway 17 arrival, 30 knot loss at 1 mile fmal, threshold winds11 knots from 150 degrees." 13
5. Map showing locations of Doppler radars, anemometers and lightningdetection system (L) relative to Orlando International Airport. Thevertical black lines in the center of the picture are the three parallelrunways at the airport. 15
6. Examl,lle of WSP's anomalous propagation censoring function. Six-levelprecipItation reflectivity data are encoded as in Figure 4a. 23
A.l.Signal processing block diagram. 30
A.2.Microburst detection algorithm block diagram. 31
B.1. Locations of anemometers and runways (real and imaginary) used foranalysis of ASR-9 WSPlEnhanced LLWAS integration algorithm. 36
UST OF TABLES
Table
No.1. Microburst Algorithm Hit-Miss Scoring Statistics
2. Microburst Algorithm Path-Oriented Scoring Statistics
3. Gust Front Signature Detection Performance (1h1th Based on WSP Data)
4. WSP End-to-End Gust Front Detection Performance (1iuth Based onlDWRData)
B.l WSPflLWAS Microburst Detection Performance
ix
Page
18
19
20
21
35

l.INTRODUCI10N
An operational test ofa Wind Shear Processor (WSP) add -on to the Airport SurveillanceRadar (ASR- 9) was conducted at the Orlando International Airport (MeO) during July andAugust of 1991. The test followed a similar evaluation of the WSP in 1990 [1] and featuredaugmented range coverage, improved meteorological hazard detection algorithms, and use ofa production ASR-9 in place of the ASR-8 testbed used previously. This report describesthe experimental WS:p' the test conditions and an assessment of the WSP's performance duringthe operational evaluation.
The WSP has been under development since 1985, under sponsorship by the Federal Aviation Administration's ASR-9 Program Office. [2] When implemented nationally, the WSPwill provide broad- area wind shear detection capability at smaller airports not slated to receive a dedicated Terminal Doppler Weather Radar (TDWR). [3] Based on a recently completed windshear detection systems cost-benefit study, [4] the FAA plans to deploy 58 WSPsystems; 35 in a stand-alone mode and 23 in an integrated configuration with the EnhancedLowLevel Wmdshear Alert System (LLWAS). [5] The WSP procurement is nominally scheduled to begin in 1994.
The 1991 operational test was conducted to validate the operational utility of the WSP andto obtain data necessary to continue system refinement. The evaluation had two components:
1. Quantitative assessment of the performance of the WSP's signal processing and wind shear detection algorithms in the moist, convectivelyunstable environment of the Florida peninsula; and
2. Feedback from users (air traffic controllers and supervisors) on strengthsand weaknesses of the system and their recommendations for modifications.
The first objectivewas achieved by recordingwind shear alarms generated by the WSP andcorrelating these off line with observations from the other meteorological sensing systems described in Section 2. User feedback was obtained through periodic meetings with air trafficcontrol personnel using the system at the Orlando facility. The results of the operational testare being utilized in ongoing refinement of the WSP system.
Section 2 of this report provides an overview of the testbed WSP and the other sensorsused to document low altitude wind shear and other weather phenomena. Sections 3 reviewsthe 1991 operational test and the performance ofthe WSP. Details on the data processing algorithms are contained in the appendices.
1

2. ORLANDO WSP TESTBED
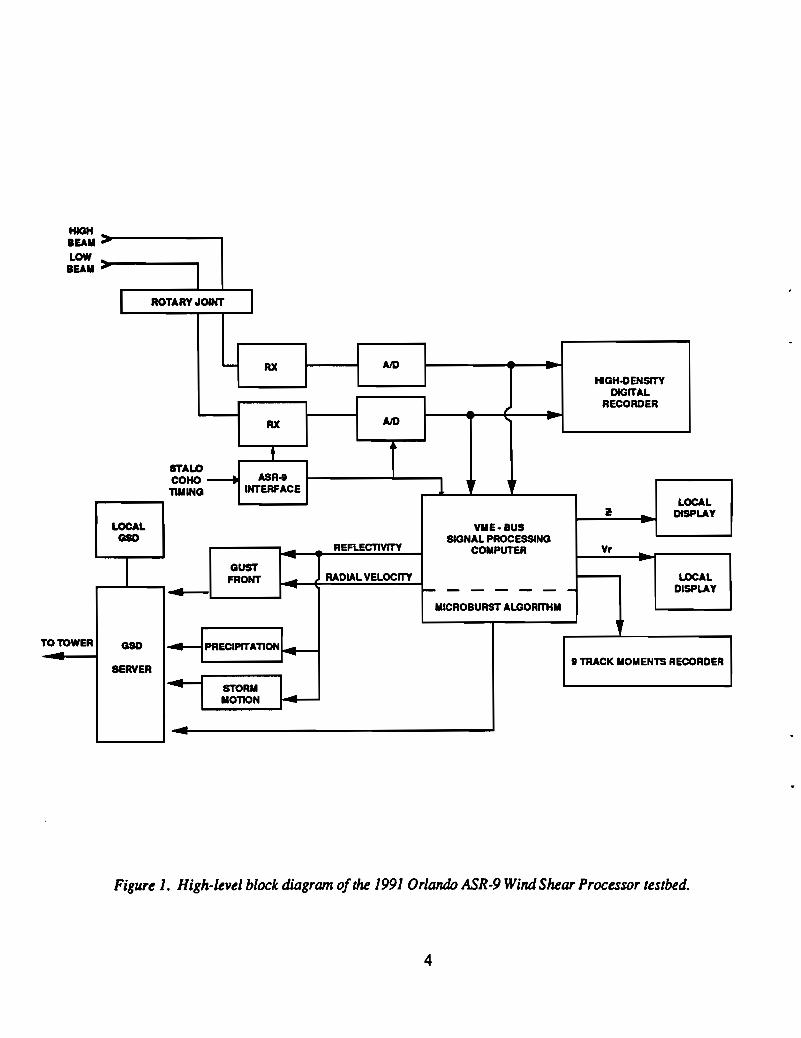
Figure 1 is a high level block diagram of the Wind Shear Processor testbed as operated in1991. The system is comprised of:
1. A production ASR-9;
2. Interfaces to extract necessary RF and timing signals;
3. Identical high dynamic range receivers and AID converters for the highand low beam receiving channels of the ASR-9;
4. A digital signal processor that performs signal pre-conditioning (e.g.,ground clutter filtering) and computes estimates of the precipitation reflectivity factor, low-altitude radial velocity and spectrum width in eachrange-azimuth resolution cell;
5. A high-density digital recorder to archive unprocessed in phase andquadrature (I and Q) signals from both receiving beams;
6. Local workstations that run the microburst and gust front detection algorithms, the storm motion algorithm, generate precipitation reflectivitymaps, and transmit the resulting products to the air traffic control tower;and
7. Remote workstations and monitors that provide graphical and alphanumeric displays to air traffic controllers and their supervisors.
Figure 2 is a photograph of the test site on the Orlando airport. Both channels of theASR-9 (transmit and receive cabinets, target processors, six-level weather processors andRMS) are deployed in the mobile five-foot trailer in the foreground. This trailer also housesthe signal interface module, receivers and NO converters for the WSE Digitized signals aretransmitted over a fiber optic tinkto the adjacent office trailerwhich contains the data processing and recording system.
2.1 WSP RADAR INTERFACES AND RECEIVERS
As indicated in Figure 1, the WSP requires simultaneous access to both high and low receiving beams in order to accurately calculate the low-altitude radial wind field. [2] In orderto generate identical RF paths for both beams, the ASR-9's high!1ow-beam switch was bypassed and an additional band pass filter and low noise amplifier were added. This providedidentical paths for both beam channels to the WSP receivers. In the production implementation for theWS~ a network of switches and RF couplers will be employed so as to provide signals simultaneously to the WSP and the ASR-9's target and six-level weather processors. [2]
The WSP receivers (Figure 3) are double conversion receivers with digital automatic gaincontrol (AGC) in the IF stage and quadrature video detectors providingbaseband output. Thestable local oscillator (STALO) and coherent local oscillator (COHO) signals are
3
HIGHBEAll .,
LOWBEAll ~
I ROTARY JOINT I
"- RX AIDHIGH-DENSITY
DIGITALRECORDER
AX AID
tSTALOCOHO ----t ASR-I
1, ,
TIllING INTERFACELOCAL
~ DISPLAYLOCAL VilE· BUS
QSD SIGNAL PROCESSINGREFLECTIVITY COMPUTER Vr
I- ~
OUSTFRONT - RADIAL VELOCITY LOCAL
~ - ------- DISPLAY
IIICROBURST ALGORITHII
:PRECIPITATlON~TO TOWER GID- • TRACK MOMENTS RECORDERSERVER -
~I STORIIlIanoN
-
Figure 1. High-level block diagram ofthe 1991 Orlando ASR-9 Wind Shear Processor testbed.
4

Figure 2. Photograph ofASR-9 Wind Shear Processor testbed on Orlando International Airport.

RF 31 MHz 10dBCOUPLER
DIGITAL QUADATTENUATOR DETECTOR
AID
AID a
STALOAID
LOG AMP L....-_......
TOPROM 1-..L....4~SIGNAL COHO
PROCESSOR
Figure 3. Wind Shear Processor receivers.

tapped from the ASR-9 and are isolated from the radar by circulators. The IF signal (at 31.1MHz) issplit into two paths in order to implement the AGC. One path is through a linear channel with 1.1 microsecond delay introduced by means of a coaxial delay line. The other pathis through a logarithmic amplifierwhose output is sampled at a 10.35 MHz rate by an eight-bitflash NOconverter. A PROM converts the highest flash -conversion sample from each radarrange gate (773 ns or 1/16 nmi) to an attenuation factor which varies from 0 to 45 dB in 3 dBincrements. This factor drives a digital PIN diode attenuator at the output ofthe linearchanneldelay line so that the IF signal will not exceed the dynamic range of the NO converters in thequadrature video detection stage. The attenuation factor for each range gate is supplied tothe digital signal processor along with the corresponding in phase and quadrature samples sothat the appropriate corrections to signal amplitude can be implemented. The quadraturevideo detector employs 14 bit NO convertors so that total system dynamic range is 129 dB. Inaddition toSTALO and COHOsignals, the WSPsignal interface module extracts the followingdigital signals from the ASR-9:
1. 10.35 MHz clock
2. 1.29 MHz range-gate clock
3. Azimuth change pulse (ACP)
4. Azimuth reference pulse (ARP)
5. 'Ii'ansmitter pre-trigger
Data for each pulse transmitted by the radar are packaged as a "record" consisting ofeight32-bit "header" words containing status information such as time, antenna azimuth, pulserepetition interval (PRI), etc., followed by two 32-bit words for each range gate. These encode the in phase and quadrature samples for both receiving channels along with the corresponding AGC attenuation factor.
2.2 DIGITAL PROCESSOR AND RECORDING SYSTEM
In phase and quadrature samples and ancillary data are transmitted via fiber optic link toa Radar Data Bus in the processing and display trailer. This 50-conductor ribbon cable supplies data simultaneously to the high-density digital recorder and the signal-processing computer.
The signal processing computer operates as a looselycoupled multiprocessor, incorporating several single-board computing systems connected byVME busses. A data input processor (a Mercury MC3200 processor) receives the incoming I and Q samples and distributesthese to six signal processing boards (Mercury MC860 processors). Each of these boards performs the full suite of signal processing operations on a specific interval of range gates. Theoutput products (reflectivity, radial velocity, spectrum width and signal-to-noise ratio) arereassembled by an output processor and passed on to the meteorological detection algorithms.
8

The microburst algorithm was implemented on a single-board computer on this sameVME backplane. For convenience, the gust front, storm motion and six-level precipitationalgorithms were implemented on UNIX workstations (SUN3 and SUN4) connected via anethemet LAN. In a production WSp' these outboard workstations would probably be replacedby additional single- board computers in order to minimize processor size and expense.
2.3 USER DISPLAYS
Figures 4a and 4b show the graphical and alphanumeric displays provided to air trafficcontrollers at the Orlando FAA facility. The displays, products and operational proceduresfor using these products are essentially identical to those developed for the TDWR.
The color workstation, a Geographic Situation Display (GSD) was provided for the areamanagers in the Terminal Radar Control Room (TRACON) and tower cab. This device givesgraphical representations of the location and intensity of precipitation, microbursts and gustfronts as well as estimates of the speed and direction of motion for precipitation cells and gustfronts. When wind shear events intersect active runways or approach/departure corridors,runway specific alphanumeric messages are generated on the "ribbon" display. These are readoff by the local controller when planes are cleared for takeoff or final approach. Reference[1] provides more detailed information on the user interfaces and operational procedures.
2.4 SUPPORTING SENSORS
Figure S shows the additional meteorological sensors deployed near the Orlando airportduring the operational test period. Lincoln Laboratory's TDWR testbed, the University ofNorth Dakota's C-Band radar, and the MIT Weather Radar Laboratory's C-Band radarprovided a short baseline triple-Doppler network that allows for reconstruction of the fullwind vector in thunderstorms occurring near the airport. Data from these radars were usedfor quantitative scoring of the WSP's microburst and gust front detection algorithms. A MESONET consisting of Orlando airport's 1S-station enhanced LLWAS and an additional 15anemometers deployed by Lincoln Laboratory provided dense surface wind measurements inthe vicinity of MCO. The anemometer network, in addition to providing another source of"truth" for the WSP's algorithms assessment, was used for the initial evaluation of WSP/Enhanced LLWAS integration discussed in Appendix B. Note that the Orlando EnhancedLLWAS was not commissioned during 1991; therefore, the integration algorithm evaluationwas conducted offline. A two -station interferometric lightning detection and localization system was deployed and operated by the French Government Laboratory ONERA. Data on intracloud and cloud to ground lightning activity obtained with this system are being analyzedto develop applications for aviation weather hazard detection.
9

"I
..........
Figur.e 4a. Geographic Situation Display. Filled red circles are detected microbursts with the measured wind changes across the event (in knots) indicated. Open red circlesshow divergent outflows with measured wind changes less than 30 knots ("wind shear with loss"). Purple arc is a detected gust front with the estimated location ofthe front 10 and20 minutes in the future indicated l7y dashed purple lines; an estimate ofthe wind speed and direction behind the front is given l7y the purple vector. Six levels ofprecipitationreflectivity are shown and the speed and direction ofstorm movement is given l7y the black vector and associated number. The blue arrows and numbers show the wind speed anddirection measured l7y UWAS S anemometers.

.' " ..
Figure 4b. Alphanumeric ("ribbon") display. Theftrst line is read as "microburst alert on runway 17 arrival, 30 knot loss at 1 mileftnal,threshold winds 11 knots from 150 degrees."


3. SYNOPSIS OF 1991 OPERATIONAL TEST
The 1991 ASR-9 WSP operational test followed a similar evaluation using Lincoln Laboratory's TDWR testbed in Mayand June. The WSP evaluation took place seven days perweekfrom 10 July to 31 August during the hours 1200 to 1900 ED'f. The test period was frequentlyextended beyond 1900 owing to continued weather activity in the vicinity ofMeO. During thetwo-month operational period, the WSP was inoperable a total of 6.5 hours due to softwareor hardware failures. This downtime represents less than two percent of the total operatingtime.
In contrast to the initial WSP test in 1990, thunderstorm activity during the 1991 test period was intense. Low-altitude wind shear impacted the runways or approach/departure corridors at MeO on 40 of the 53 test days. A total of almost 500 microbursts were detected by theWS~ 71 of which impacted the airport. Approximately 50 gust fronts were observed, 31 ofwhich passed over the airport.
3.1 MICROBURST DETECI10N PERFORMANCE
Overall, the performance of the WSP's microburst detection function was good, both interms of quantitative detection and false - alarm statistics and in terms of the favorable assessment of this function by Orlando's air traffic control team. Implementation of more precisefitting ofuser-displayed microburst shapes to the actual region ofstrong shear and incorporation of a "shear integration" technique in the generation of alphanumeric alarm messageslargely eliminated the sense of4coverwarning" that had been voiced by Orlando air traffic controllers during the 1990 TDWR and WSP tests.
1\vo statistical scoring methodologies were employed to quantify the performance of theWSP's microburst detection function. 4CHit- miss" scoring tabulateswhether microburst alarmregions generated by the WSP intersected "true" microbursts. Ifany overlap existed, the WSPalarm was scored as a detection; otherwise, it was deemed to be a false alarm. "TIue" microbursts were identified based on manual examination ofsingle-Doppler data from the TDWRtestbed.
Thble 1 tabulates hit-miss detection and false-alarm probabilities for 11 days during theoperational demonstration (10, 11,17,28,29 July and 1,2,9,10,15,31 August). These daysincluded the most active weather periods during the operational period. The data set containsa total of almost 9000 single-scan observations of microburst events. Only wind shear eventswithin 12 km of the radar (the region of operational significance for an ASR-9 WSP) wereincluded in the analysis. The statistics are tabulated separately for all 4'wind shears with loss"(divergences with total loss greater than 15 kts), "microbursts" (total loss greater than 30 kts)and "strong microbursts" (total loss greater than 40 kts).
17

TABLE 1.MICROBURST ALGORITIlM IDT-MISS SCORING STATISTICS
Probability of Detection Probability of False Alarm
Wind Shear withLoss
Microburst
Strong Microburst
0.94
0.98
1.00
0.23
0.08
0.01
As with previous evaluations of the WSP in the southeastern United States, the detectionprobability for microbursts was well above the 90% criterion established for the TDWR in itsSystems Requirement Statement (SRS). The false-alarm probability was low for "microburst" strength divergences, but increased significantly within the ''wind shear with loss" category. Most of the false alarms in this category had reported losses in the 15 to 25 let range.The higher incidence of "wind shear with loss" false alarms was not reported as a problemby the Orlando air traffic controllers. (The alarms were almost always associated with heavyprecipitation and gustywinds; thus, air traffic operationswere normally curtailed for other reasons.)
"Path-oriented" scoring quantified the accuracy ofthe WSP's alphanumeric alarms relative to the actual loss that would have been experienced by a landing or departing aircraft onone ofMeO's runways. For this analysis "truth" was determined using a dual-Doppler analysis of the surface wind field from TDWR and UND radar measurements. For each runway,the integrated loss measured along the approach and departure corridors was computed andcorrelated with the WSP's alarms for that runway. In general, path -oriented scoring providesa more stringent performance assessment than hit-miss statistics; good performancewith thismetric requires reliable detection, accurate localization and accurate strength characterization for the wind shear event.
Table 2 lists various performance metrics derived from the path-oriented scoring. Datafrom nine days during the operational demonstration (coinciding with time periods for a similar analysis ofTDWR and enhanced LLWAS system performance) were analyzed. The analysis periods included approximately 8000 single-scan observations ofmicrobursts (loss greaterthan 30 lets), 12000 observations of weaker divergences (loss between 20 and 30 lets), and60,000 null observations (no true wind shear events near MeO). The detection metrics aregiven as conditional probabilities. Thus P(LOSS I MB) is the probability that the WSP reported a "wind shear with loss" or "microburst" given that the dual-Doppler analysis indicated an airplane would have experienced "microburst" strength shear. The listed false alarmmetrics are:
1. PFA(MB) - - the probability that a "microburst" strength alarm fromthe WSP does not correlate with at least a "wind shear with loss";
18
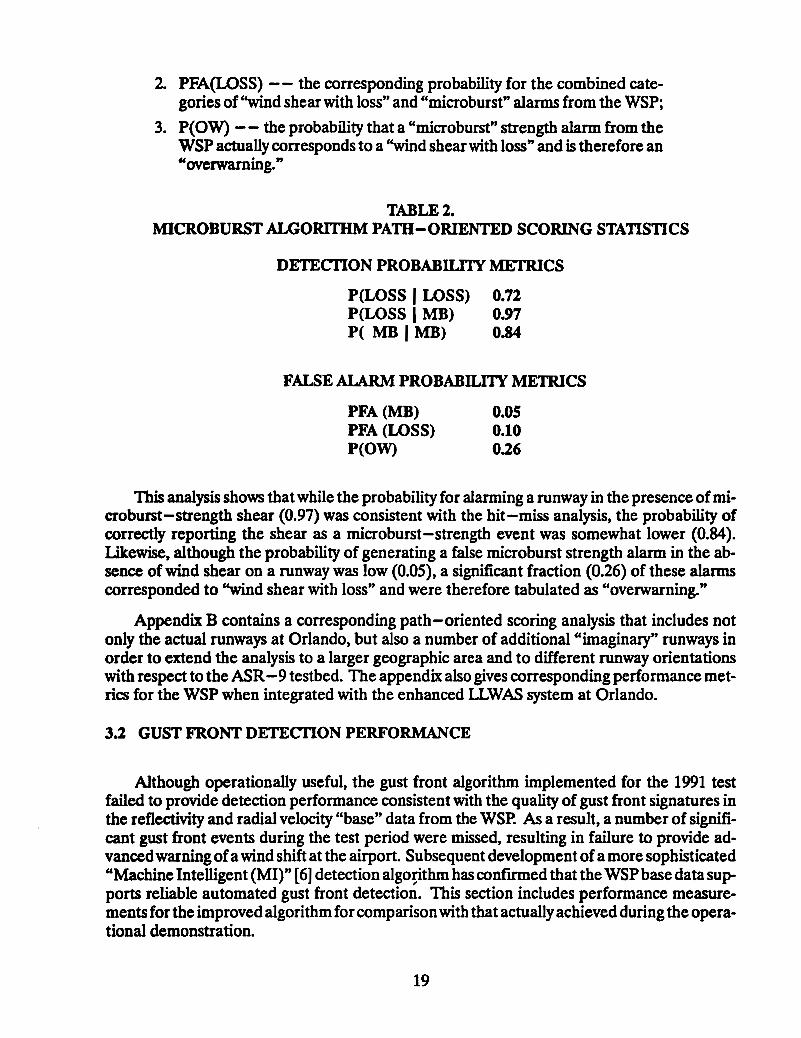
2. PFA(LOSS) -- the corresponding probability for the combined categories of "wind shear with loss" and "microburst" alarms from the WSP;
3. P(OW) - - the probability that a "microburst" strength alarm from theWSP actually corresponds to a ''wind shear with loss" and is therefore an"overwarning."
TABLE 2.MICROBURST ALGORITHM PAm-ORIENTED SCORING STATISTICS
DEfECTION PROBABILITY METRICS
P(LOSS I WSS) 0.72P(LOSS 1MB) 0.97P( MB I MB) 0.84
FALSE ALARM PROBABILIlY METRICS
PFA (MB) 0.05PFA (WSS) 0.10P(OW) 0.26
This analysis shows that while the probability for alarming a runway in the presence ofmicroburst-strength shear (0.97) was consistent with the hit-miss analysis, the probability ofcorrectly reporting the shear as a microburst-strength event was somewhat lower (0.84).likewise, although the probability of generating a false microburst strength alarm in the absence of wind shear on a runway was low (0.05), a significant fraction (0.26) of these alarmscorresponded to ''wind shear with loss" and were therefore tabulated as "overwarning."
Appendix B contains a corresponding path-oriented scoring analysis that includes notonly the actual runways at Orlando, but also a number of additional "imaginary" runways inorder to extend the analysis to a larger geographic area and to different runway orientationswith respect to the ASR-9 testbed. The appendix also gives corresponding performance metrics for the WSP when integrated with the enhanced LLWAS system at Orlando.
3.2 GUST FRONT DETECTION PERFORMANCE
Although operationally useful, the gust front algorithm implemented for the 1991 testfailed to provide detection performance consistent with the quality of gust front signatures inthe reflectivity and radial velocity "base" data from the WSP. As a result, a number of significant gust front events during the test period were missed, resulting in failure to provide advancedwarning ofa wind shift at the airport. Subsequent development ofa more sophisticated"Machine Intelligent (MI)" [6] detection alg09thm has confl1l11ed that the WSP base data supports reliable automated gust front detection. This section includes performance measurements for the improved algorithm for comparisonwith that actuallyachieved during the operational demonstration.
19
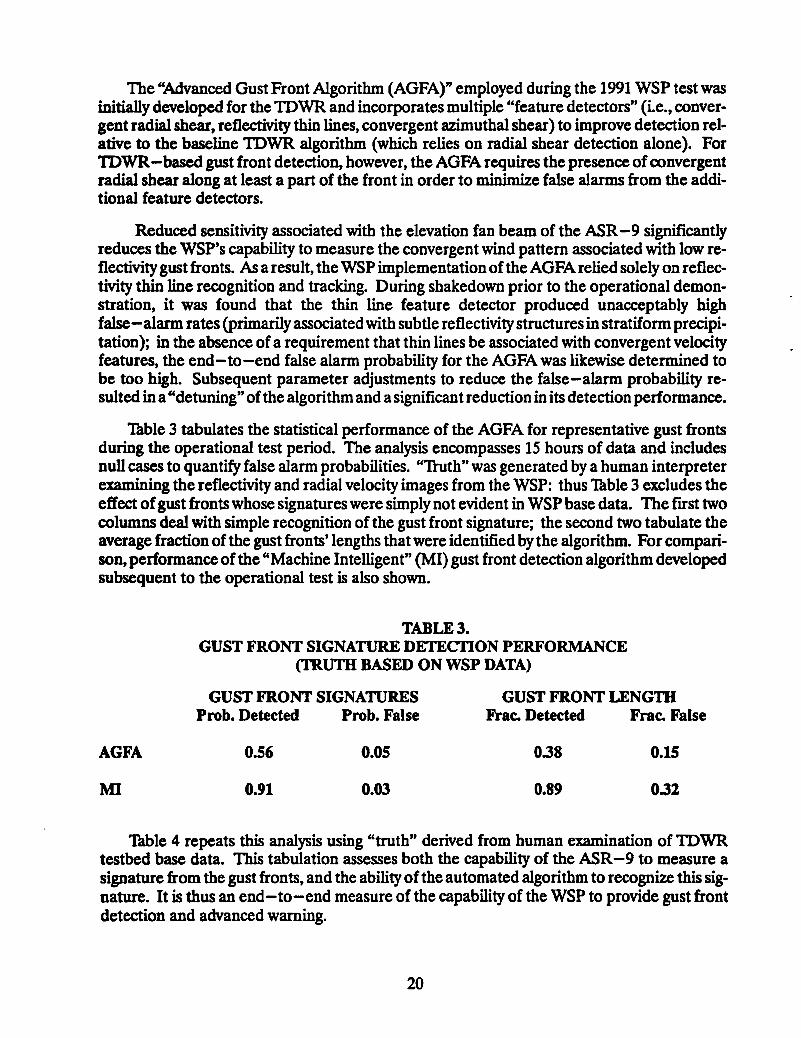
The "Advanced Gust Front Algorithm (AGFA)" employed during the 1991 WSP test wasinitially developed for the IDWR and incorporates multiple "feature detectors" (ie., convergent radial shear, reflectivity thin lines, convergent azimuthal shear) to improve detection relative to the baseline lDWR algorithm (which relies on radial shear detection alone). ForTDWR-based gust front detection, however, the AGFA requires the presence ofconvergentradial shear along at least a part of the front in order to minimize false alarms from the additional feature detectors.
Reduced sensitivity associated with the elevation fan beam of the ASR-9 significantlyreduces the WSP's capability to measure the convergent wind pattern associated with low reflectivity gust fronts. As a result, the WSP implementation ofthe AGFA relied solely on reflectivity thin line recognition and tracking. During shakedown prior to the operational demonstration, it was found that the thin line feature detector produced unacceptably highfalse-alarm rates (primarily associated with subtle reflectivity structures in stratiform precipitation); in the absence of a requirement that thin lines be associated with convergent velocityfeatures, the end-to-end false alarm probability for the AGFAwas likewise determined tobe too high. Subsequent parameter adjustments to reduce the false-alarm probability resulted in a "detuning" ofthe algorithm and a significant reduction in its detection performance.
Thble 3 tabulates the statistical performance of the AGFA for representative gust frontsduring the operational test period. The analysis encompasses 15 hours of data and includesnull cases to quantify false alarm probabilities. "TIuth" was generated by a human interpreterexamining the reflectivity and radial velocity images from the WSP: thus Thble 3 excludes theeffect ofgust fronts whose signatures were simply not evident in WSP base data. The first twocolumns deal with simple recognition of the gust front signature; the second two tabulate theaverage fraction of the gust fronts' lengths that were identified by the algorithm. For comparison, performance of the "Machine Intelligent" (MI) gust front detection algorithm developedsubsequent to the operational test is also shown.
TABLE 3.GUST FRONT SIGNATURE DETECTION PERFORMANCE
(TRUTH BASED ON WSP DATA)
GUST FRONT SIGNATURESProbe Detected Probe False
GUST FRONT LENGTIIFrac. Detected Frac. False
AGFA
MI
0.56
0.91
0.05
0.03
0.38
0.89
O.lS
0.32
Thble 4 repeats this analysis using "truth" derived from human examination of lDWRtestbed base data. This tabulation assesses both the capability of the ASR-9 to measure asignature from the gust fronts, and the ability of the automated algorithm to recognize this signature. It is thus an end-to-end measure of the capability of the WSP to provide gust frontdetection and advanced warning.
20

TABLE 4.WSP END-TO-END GUST FRONT DETECTION PERFORMANCE
(TRUTH BASED ON TDWR DATA)
GUST FRONTSProbe Detected Probe False
GUST FRONT LENGlHFrac. Detected Frac. False
AGFA
MI
0.40
0.78
0.07
0.00
0.18
0.58
0.07
0.04
The tables emphasize that the gust front detection performance achieved during the operational test was suboptimal; the AGFA correctly identified the gust front on only 56% of thescans where a signature was in fact recognizable by a human analyst. This suboptimal detection performance, in combination with the approximately 15% ofOrlando gust fronts that produced no visible thin line feature in the WSP base data, resulted in and end-to-end detectionprobability of only 0.4.
The machine-intelligent algorithm has produced markedly improved detection statisticsin off-line testing. Over 90% ofrecognizable gust front signatures in the WSP datawere automatically detected by the MY technique, and a corresponding fraction oftheir total length wasidentified. Comparison ofThbles 3 and 4 shows that the MI algorithm's apparent high falsealarm probability with respect to fraction of length detected is, in fact, indicative of the algorithm's ability to detect segments ofgust fronts not observed by the human truthers in the WSPdata. (These segments are, however, tabulated in the IDWR "truth" set owing to the greatersensitivityof that radar.) The end- to-end gust front detection probability for the WSP usingthe MI approach was approximately 0.8; this is comparable to currently demonstrated IDWRperformance.
3.3 SIX-LEVEL PRECIPITATION AND STORM MOTION ALGORITHM
These products were enthusiastically received by Orlando Air naffic personnel. Whileno quantitative evaluations were performed, monitoring of these products during the operational test indicated that the information provided was accurate.
A significant change for the 1991 test was implementation of an anomalous propagation(AP) censoring function. False weather echoes resulting from ground clutter breakthroughassociated with AP have been a significant operational problem in Air naffic's utilization ofthe ASR-9's six-level weather reflectivity processor. When the WSP's censor function wasactivated (via a user controllable switch on the geographic situation display), the signal meanDoppler and spectrum width estimates for each radar resolution cell were tested in order todiscriminate between true weather echoes and ground clutter breakthrough associated withAE
21

Figure 6 illustrates the AP censoring function by means of GSD displays with the censorturned on and off. Cool, moist outflowair from a line of thunderstorms has resulted in ductingof radar energy to the surface and associated strong ground clutter to the west of Orlando'sairport. With the mean Doppler/spectrum width test activated, most of the AP-inducedground clutter echoes are censored. Note that the display of true weather (in this example,the line ofthunderstorms east ofthe airport) is not significantly altered by the censoring process.
Further work is underway to:
1. Implement spatial fJltering to eliminate the speckled, AP breakthroughresidue that remains after the censoring process;
2. Develop an interface to the ASR-9's Surveillance Communication Interface Processor (SeIP) that will allow the WSP to remove AP-induced false weather from the six-level ASR-9 weather display on controllers' DEDS.
3.4 FAA TECHNICAL CENTER AND AIR TRAFFIC CONTROLLER EVALUATIONS
A debrief meeting at the Orlando Air naffic Control tower took place following completion of the operational test. Representatives from the FAA Technical Center (FAATC) andOrlando Air naffic attended. Overall, the FAATCviewed the performance ofthe WSP as verygood and stated that development and testing should continue. They noted that the gust frontalgorithm needed additional development since a number ofclearly discernable gust front signatures were not detected by the algorithm used during the test period. A quick look reportfrom FAATC [6] has been published for the 1991 operational test.
The Orlando Air naffic (AT) personnel present confirmed statements made during thetest period that, from AT's viewpoint, there were no significant differences between WSP performance and that observed during the preceding TDWR test. ATwas enthusiastic about theperformance ofboth systems over the summer and stated that algorithm refinements made asa result of the 1990 tests had largely eliminated their concerns about microburst "overwarning." At the close of the meeting, AT requested that either the WSP or TDWR (they didn'tcare which) continue to provide data to the tower when active weather affects the airport.
22

Figure 6. Example o!WSP's anomalous propagation censoring function. Six-level precipitation reflectivity data are encoded as in Figure 4a.

4. SUMMARY AND FUTURE ACTIVITIES
The 1991 operational evaluation of the ASR-9 WSP provided a valuable opportunity toassess the system over an extended period of intense weather activity. System performancewas consistent with previous evaluations of the WSP in the southeastern United States, confirming the capability for highly reliable detection of microbursts. Gust front detection duringthe test, while operationally useful, was not as reliable as it should have been, given the qualityof gust front signatures in the base reflectivity and radial velocity data from the WSP. Subsequent development ofa "Machine Intelligent" gust front algorithm has resulted in significantlyimproved detection capability.
A follow-on demonstration will take place during 1992 to completevalidation of the WSPin the southeastern United States. Significant changes relative to the 1991 test will include:
1. Implementation of RF waveguide switches and couplers that allow theWSP to operate in parallel with the ASR-9's target and six-levelweather processors. The 1992 test will therefore utilize a full-up emulation of production WSP radar interfaces;
2. Utilization of the Machine Intelligent gust front algorithm; and
3. On-line demonstration of the WSP operating in an integrated modewith Orlando's Enhanced LLWAS system. This demonstration is contingent on commissioning of the additional sensors required for the Enhanced LLWAS.
4. Utilization of refined algorithms for data quality editing (e.g., suppression of second-trip weather).
Following the 1992 demonstration, the WSP testbed will be moved to a midwest or HighPlains airport for data collection and system evaluations in different environments. This activity will support national deployment of WSPs by providing the data base necessary to adjustprocessing algorithm parameters for differing storm structures encountered in the diverse meteorological regimes of the United States.
25

REFERENCES
1. Noyes, '1:, S. lroxel, M. Weber, O. Newell, J. Cullen, The 1990 airport surveillance radilrwind shearprocessor (ASR - WSP) operational test at Orlando InternationalAirport, Massachusetts Institute of Thchnology lincoln Laboratory Project Report ATC-178, DOTFAA-NR-91-1, 1991.
2. Weber, M., M. Stone, C. Primeggia, J. Anderson, Airport surveillance radar based windshear detection, Preprint Volume: Fourth Intemational Conference on Aviation WeatherSystems, Paris, France, June 24-28,1991, American Meteorological Society.
3. Evans, J. and D. Thmbull, Development ofan automated wind sheardetection system usingDoppler weather radilr, IEEE Proceedings, 77, 1661-1673, 1989.
4. Cark, M., Fisher, Land J. Gibson, Integrated windshear systems cost-benefit and deployment study, Martin Marietta Report ATS-90-xxx, 1991.
S. Wllson, F:VY, R. Gramzow, The redesigned low level wind shear alert system, Preprint Volume: Fourth International Conference on Aviation Weather Systems, Paris, France, June24-28,1991, American Meteorological Society.
6. Delanoy, R. and S. lroxel, Machine intelligentgust front algorithm, Massachusetts Instituteof Thchnology Lincoln Laboratory Project Report, in preparation.
7. Martinez, R.,A quick-lookreportfor the 1991 demonstration and operationaltestandevaluation ofthe airport surveillance radilr wind shearprocessor (ASR - WSP) at Orlando InternationalAirport in Orlando, Fla., FAA Thchnical Center Report CN-240-92-01, 1991.
8. Weber, M., Dual-beam autocorrelation based windestimatesfrom airportsurveillance radilrsignals, Massachusetts Institute of Thchnology Lincoln Laboratory Project ReportATC-167, FAA- PS-89-S, 1989.
9. Chomoboy, E.S., Dopplermean velocity estimation: smallsample analysis and a new estimator, Massachusetts Institute ofThchnology Lincoln Laboratory Technical Report TR-942,FAA-NR-92-S.
10. Cole, R., Message Level TDWRIEnhanced LLWAS Integration Algorithm, MassachusettsInstitute of Thchnology Lincoln Laboratory Project Report, in preparation.
27

APPENDIX ADATA PROCESSING ALGORITHMS
A.I Signal Processing Algorithms
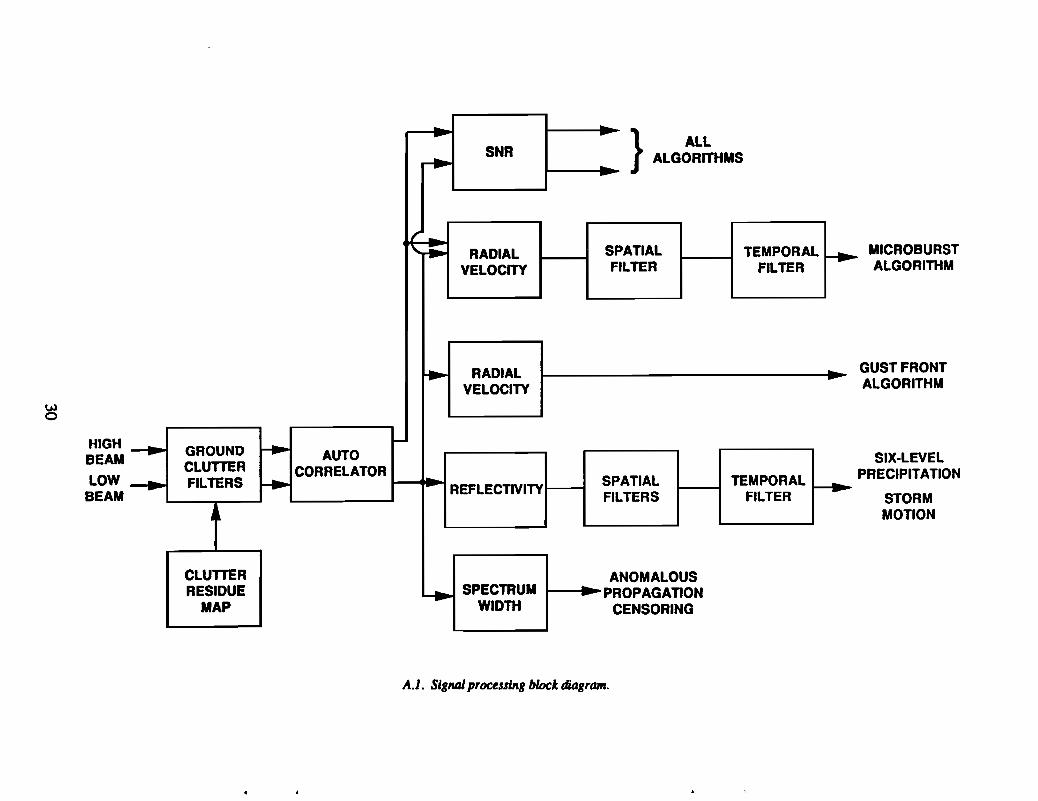
Figure A.1 diagrams the signal processing flow used during the 1991 test. Pulse samplesfrom the high and low receiving beams were processed in parallel using 26-sample coherentprocessing intervals (CPIs): these consisted of two eight -pulse, lowPRFblocks and one intervening lO-pulse, high PRF block from the ASR-9. Thus, the data processing intervals span1.5 antenna beamwidths and successive azimuth samples overlap by 50%.
For each resolution cell, a map stores mean residual clutter power out of each of three17-point finite impulse response (FIR) high-pass mters and an all-pass filter. The processor selects the least attenuating clutter filter that maintains signal-to-stored clutter residuepower in excess of a 10 dB threshold. A "bad data" flag is set for resolution cells where themost attenuating mter output does not exceed this threshold. Outter suppression for the threeFIR filters varied from 12 to 50 dB.
Autocorrelation function estimates for lags varying from zero to four times the averagepulse repetition interval (R(O) through R(4» were computed for both beams and used to compute the weather echo spectrum moments estimates used by the meteorological detection algorithms. Signal-to-noise power ratio (SNR) and the precipitation reflectivity factor werecomputed using R(O) and a stored estimate for the system noise level in each beam receivingchannel. The Doppler velocity estimate supplied to the gust front algorithm was computedusing the phase angle of the low-beam R(1) estimate. The microburst algorithm employeda Dopplervelocity field derived through combination oflow- and high- beam R(O) and R(1)estimates in order to cancel signal contributions not associated with winds near the surface [8].Spectrum width was calculated for the low beam using a weighted, quadratic regression to thelogarithms of the magnitudes of R(O) through R(4). [9]
A.2 Microburst Detection Algorithm
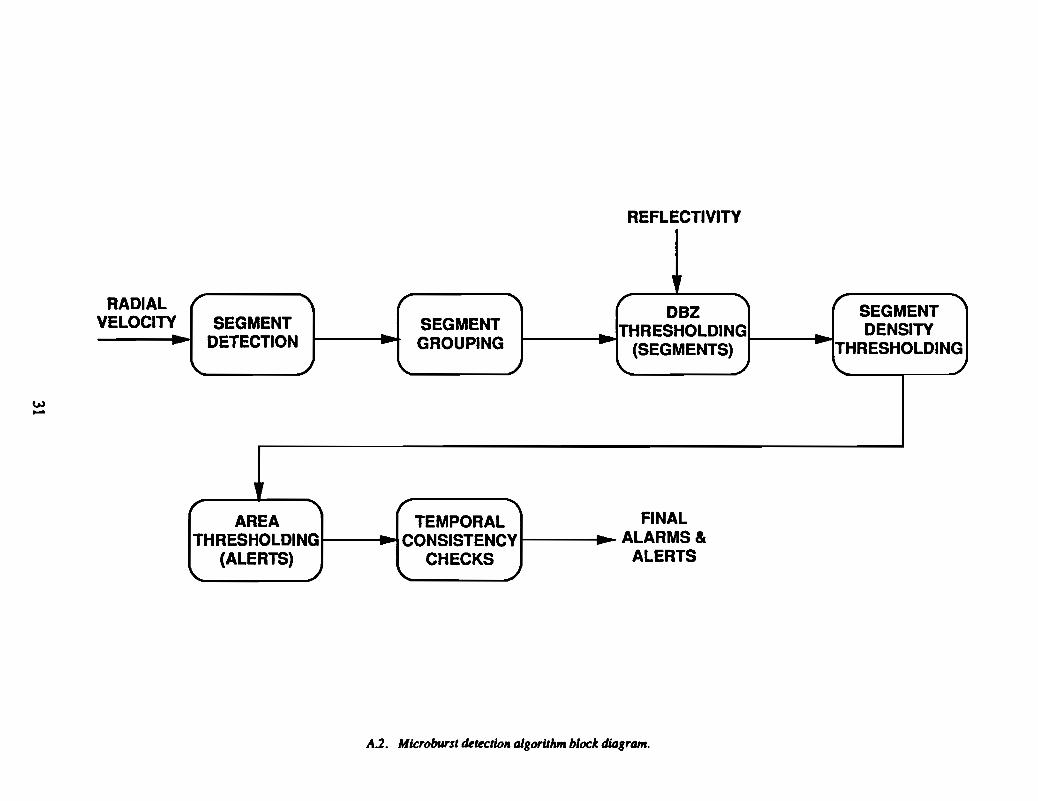
Figure A.2 is a block diagram ofthe microburst detection algorithm. The Dopplervelocityfield is searched radial by radial for the characteristic increasing velocity signature associatedwith divergent outflows. The endpoints of these "shear segments" are recursively averagedfrom scan to scan. The segments are then grouped azimuthally into "clusters." Since Orlandomicrobursts are essentially always associated with heavy precipitation, the likelihood of falsealarms was reduced by discarding segments that are too far from regions of significant reflectivity (30 dBz).
The initial segment grouping operation skips over missing segments (up to a maximumnumber set by algorithm parameters). The segment density threshold prevents this processfrom generating large regions of low segment density, for example, in noisy or weak shear portions of the velocity field. A filter passed over the segments azimuthally is used to calculatesegment density for this thresholding process.
29
GUST FRONTALGORITHM
MICROBURSTALGORITHM
SIX-LEVELPRECIPITATION
STORMMOTION
-.. --.
} ALL
~SNR ALGORITHMS--
/ -' .... RADIAL SPATIAL TEMPORAL~
VELOCITY FILTER FILTER
~ RADIAL -..VELOCITY
--. .... ~
GROUND AUTOCLUTTER CORRELATOR-. FILTERS -. 1_ SPATIAL TEMPORAL
REFLECTIVITY -FILTERS FILTER
..•
CLUTTER ANOMALOUSRESIDUE SPECTRUM - PROPAGATION--. -MAP WIDTH CENSORING
HIGHBEAM
LOWBEAM
wo
A.I. Siglllll procesnng block ditJgram.
w-
REFLECTIVITY
rr r SEGMENT ~RADIAL r " r " DBZ
VELOCITY SEGMENT SEGMENTa THRESHOLDING - DENSITY- DETECTION
.GROUPING - THRESHOLDING
... - - (SEGMENTS)~ "- ..) " ~ " ~"-
,It
~ r " FINALAREA TEMPORALTHRESHOLDING CONSISTENCY - ALARMS &- -
(ALERTS) CHECKS ALERTS"- ~ \... ~
A.2. Microbursl dekctioll algorithm block diagram.
Minimum area thresholds (functions of range and alarm strength) are then applied, followed by scan-to-scan consistency checks. Before being output to user displays, a microburst is required to have been detected on at least three scans (15 seconds). Once established,an alarm will not be cancelled until detection has ceased for 12 successive scans (1 minute).
A.3 Gust Front Detection Algorithm
The '~vancedGust Front Algorithm" used for the 1991 WSP test consists of three stages:
1. Reflectivity thin line feature extraction;
2. Feature association and discrimination; and
3. Wind shift and wind shear estimation.
The feature extractor utilizes a successive thresholding scheme to extract segments associated with localized "ridges" in the reflectivity field. Segments are generated in two passesthrough the reflectivity field. The first pass constructs segments along radials (constant azimuth) and the second along arcs of constant range. Up to 10 fixed threshold levels are usedto extract the segments. Once generated, the segments are associated bymeans ofspatial proximity tests to generate thin line features. The final features passed to the association and discrimination module consist of lists of points connecting the midpoints of detected reflectivityridges.
The association and discrimination stage uses a rule base, coupled with spatial and temporal association tests, to combine potentially fragmented thin line features into gust front detections, and to reject features not associated with actual fronts. A track history is formed for detected gust fronts and used to generate forecasts of future gust front positions.
The wind shift/shear estimation module generates an estimate of the wind speed and direction behind the gust front and the change in wind speed across the front. The estimate ofwind speed behind the front is derived using the WSP's Doppler velocity measurements in thereflectivity thin line region; post-frontal wind direction is set equal to the propagation direction of the thin line. Prefrontal wind speed and direction (necessary in generating wind shearestimates) is taken as the LLWAS network mean wind velocity prior to the front's arrival atthe airport.
A.4 Storm Tracking Algorithm
The storm motion algorithm uses scan-to-scan correlation of the WSP's reflectivitymeasurements to estimate the speed and direction of storm movement. The reflectivityimages are thresholded to produce binary representations of storm cells. These are partitioned into "correlation boxes" (typically 10 kmx 10 km). For each box, a scan-to-scan displacement vector is computed by finding that displacement which maximizes the cross correlation between scans Nand N-1. The uniform grid of displacement vectors so derived issmoothed spatially (nine-point median filter) and temporally (single-pole recursive filter).
The fmal stage ofprocessing is an analysis of the original reflectivity image to identify localmaxima corresponding to distinct storm cells. The closest gridded displacement vector is usedto generate the speed and direction estimate for each identified cell.
32

A.5 Anomalous Propagation Censoring
Anomalous propagation conditions result in ground clutter more intense than the valuesstored in the signal processor's clutter residue map. When this occurs, inadequate clutter suppression is invoked and the reflectivity and Doppler estimates are contaminated by clutterbreakthrough. This condition is flagged by testing the mean Doppler and spectrum width ofthe (post clutter filtered) signal to discriminate between true weather echoes and AP-inducedground clutter breakthrough. While precipitation echoes may have a low mean Dopplervelocity (for example, when moving tangential to the radar's beam) their spectrum width is almostalways significantly broader than that of antenna scan modulated ground clutter owing to turbulence and vertical shear within the ASR-9's fan elevation beam. The AP censor flag wasset "true" in resolution cells where signal spectrum width was less than 2 mls and the meanDoppler velocitywas less than 1 mls. This binary field ofcensor flags was then smoothed alongthe range axis using an M-of-N filter.
33
APPENDIXBOFF-LINE EVALUATION OF ASR-9 WSP/ENHANCED
LLWAS INTEGRATION
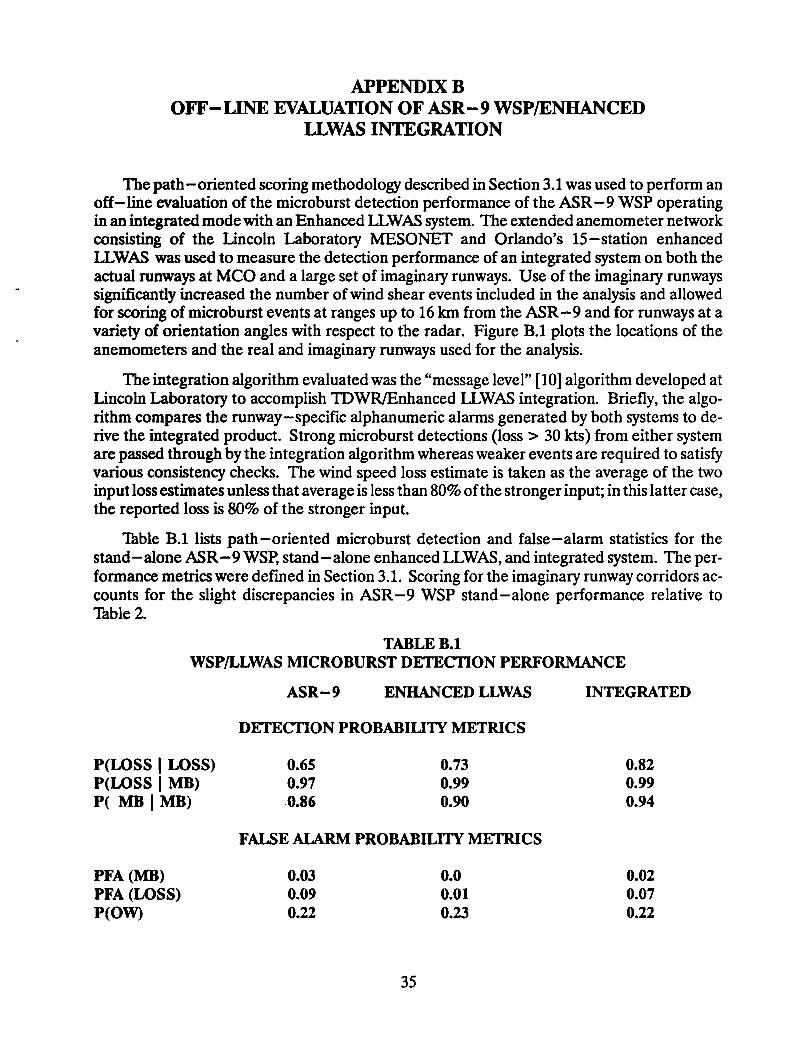
The path-oriented scoring methodology described in Section 3.1 was used to perform anoff-line evaluation of the microburst detection performance of the ASR- 9 WSP operatingin an integrated mode with an Enhanced LLWAS system. The extended anemometer networkconsisting of the Lincoln Laboratory MESONET and Orlando's IS-station enhancedLLWAS was used to measure the detection performance of an integrated system on both theactual runways at MeO and a large set of imaginary runways. Use of the imaginary runwayssignificantly increased the number of wind shear events included in the analysis and allowedfor scoring of microburst events at ranges up to 16 km from the ASR-9 and for runways at avariety of orientation angles with respect to the radar. Figure B.l plots the locations of theanemometers and the real and imaginary runways used for the analysis.
The integration algorithm evaluated was the "message level" [10] algorithm developed atLincoln Laboratory to accomplish lDWR/Enhanced LLWAS integration. Briefly, the algorithm compares the runway-specific alphanumeric alarms generated by both systems to derive the integrated product. Strong microburst detections (loss> 30 kts) from either systemare passed through by the integration algorithm whereas weaker events are required to satisfyvarious consistency checks. The wind speed loss estimate is taken as the average of the twoinput loss estimates unless that average is less than 80% ofthe stronger input; in this latter case,the reported loss is 80% of the stronger input.
Table B.l lists path -oriented microburst detection and false-alarm statistics for thestand-alone ASR-9WS~ stand-alone enhanced LLWAS, and integrated system. The performance metrics were defined in Section 3.1. Scoring for the imaginary runway corridors accounts for the slight discrepancies in ASR-9 WSP stand-alone performance relative toTable 2.
TABLEB.lWSP/LLWAS MICROBURST DETECfION PERFORMANCE
ASR-9 ENHANCED LLWAS INTEGRATED
DETECfION PROBABILIlY METRICS
P(WSS I WSS)P(WSS 1MB)P( MB I MB)
0.650.970.86
0.730.990.90
0.820.990.94
FALSE ALARM PROBABILITY METRICS
PFA (MB)PFA (LOSS)P(OW)
0.030.090.22
35
0.00.010.23
0.020.070.22

ORLANDO AIRPORT
•
•INTERFEROMETER
70 deg
•
•
350 deg
•
•
•
•
••
230 deg
x
',,',~~X
X ~ -- II •II
x
FL-2
x
"MIT
LL SENSOR.
20
19
18
17
16
15
14
13
12
11
10
9
8
7
6
5
4
3
w 2
0\ 1
0
-1
-2
-3 •-4 INTERFEROMETER-5
-6
-7
-8
-9-10 L- .....J
-15-14-13-12-11-10 -~ -8 -7 -6 -5 -4 -3 -2 -1 0 1 2 3 .. 5 6 7 8 9 10 11 12 13 14 15 18 17 18 19 20
B.l. Locations ofaMmomtttrs and nuaways (rtal and imaginary) ustd/or Q1UJlysis 0/ASR-9 WSPIEnhanctd LLWAS inttgrtJIion algorithm.

This scoring indicates two benefits for the integrated system. The probability of detectinga weak microburst ("wind shearwith loss") was increased significantly relative to either systemstand-alone, as was the probability of correctly reporting a "microburst strength loss"(> 30 lets) as a microburst.
37