Manipulating shear-induced non-equilibrium transitions in ...
Upload
nguyenlienCategory
view
227download
1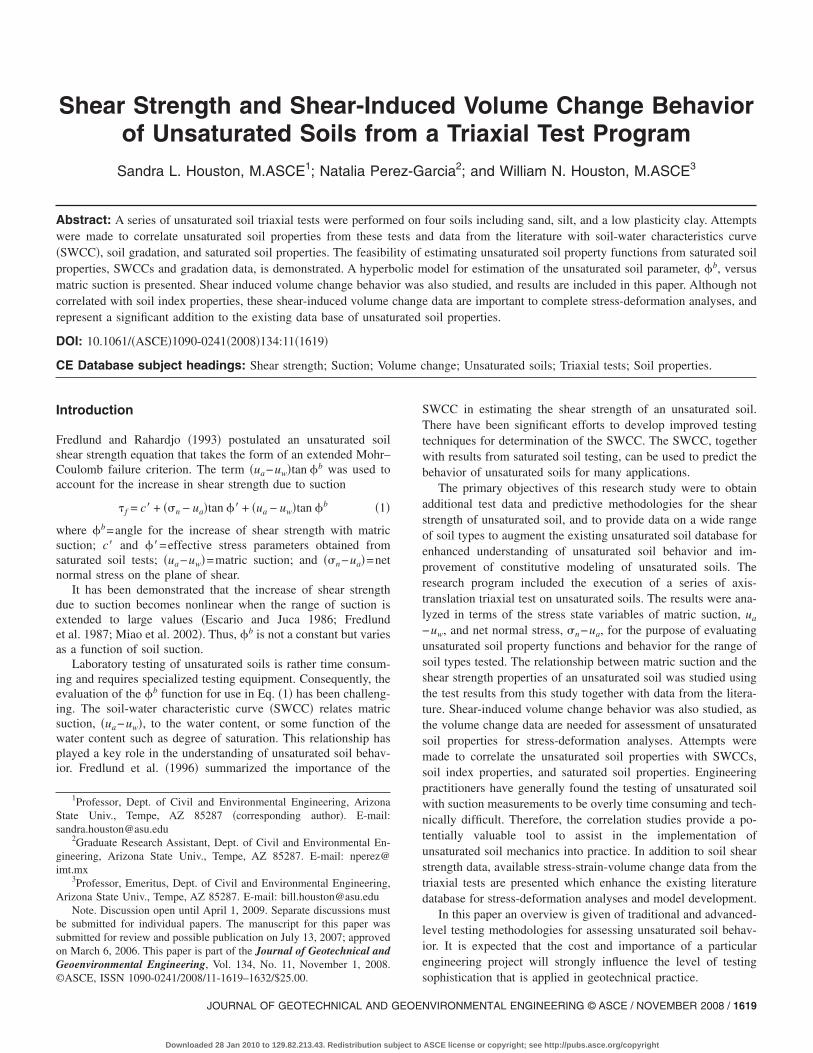
Shear Strength and Shear-Induced Volume Change Behaviorof Unsaturated Soils from a Triaxial Test Program
Sandra L. Houston, M.ASCE1; Natalia Perez-Garcia2; and William N. Houston, M.ASCE3
Abstract: A series of unsaturated soil triaxial tests were performed on four soils including sand, silt, and a low plasticity clay. Attemptswere made to correlate unsaturated soil properties from these tests and data from the literature with soil-water characteristics curve�SWCC�, soil gradation, and saturated soil properties. The feasibility of estimating unsaturated soil property functions from saturated soilproperties, SWCCs and gradation data, is demonstrated. A hyperbolic model for estimation of the unsaturated soil parameter, �b, versusmatric suction is presented. Shear induced volume change behavior was also studied, and results are included in this paper. Although notcorrelated with soil index properties, these shear-induced volume change data are important to complete stress-deformation analyses, andrepresent a significant addition to the existing data base of unsaturated soil properties.
DOI: 10.1061/�ASCE�1090-0241�2008�134:11�1619�
CE Database subject headings: Shear strength; Suction; Volume change; Unsaturated soils; Triaxial tests; Soil properties.
Introduction
Fredlund and Rahardjo �1993� postulated an unsaturated soilshear strength equation that takes the form of an extended Mohr–Coulomb failure criterion. The term �ua−uw�tan �b was used toaccount for the increase in shear strength due to suction
� f = c� + ��n − ua�tan �� + �ua − uw�tan �b �1�
where �b=angle for the increase of shear strength with matricsuction; c� and ��=effective stress parameters obtained fromsaturated soil tests; �ua−uw�=matric suction; and ��n−ua�=netnormal stress on the plane of shear.
It has been demonstrated that the increase of shear strengthdue to suction becomes nonlinear when the range of suction isextended to large values �Escario and Juca 1986; Fredlundet al. 1987; Miao et al. 2002�. Thus, �b is not a constant but variesas a function of soil suction.
Laboratory testing of unsaturated soils is rather time consum-ing and requires specialized testing equipment. Consequently, theevaluation of the �b function for use in Eq. �1� has been challeng-ing. The soil-water characteristic curve �SWCC� relates matricsuction, �ua−uw�, to the water content, or some function of thewater content such as degree of saturation. This relationship hasplayed a key role in the understanding of unsaturated soil behav-ior. Fredlund et al. �1996� summarized the importance of the
1Professor, Dept. of Civil and Environmental Engineering, ArizonaState Univ., Tempe, AZ 85287 �corresponding author�. E-mail:[email protected]
2Graduate Research Assistant, Dept. of Civil and Environmental En-gineering, Arizona State Univ., Tempe, AZ 85287. E-mail: [email protected]
3Professor, Emeritus, Dept. of Civil and Environmental Engineering,Arizona State Univ., Tempe, AZ 85287. E-mail: [email protected]
Note. Discussion open until April 1, 2009. Separate discussions mustbe submitted for individual papers. The manuscript for this paper wassubmitted for review and possible publication on July 13, 2007; approvedon March 6, 2006. This paper is part of the Journal of Geotechnical andGeoenvironmental Engineering, Vol. 134, No. 11, November 1, 2008.
©ASCE, ISSN 1090-0241/2008/11-1619–1632/$25.00.JOURNAL OF GEOTECHNICAL AND GEOE
Downloaded 28 Jan 2010 to 129.82.213.43. Redistribution subject to
SWCC in estimating the shear strength of an unsaturated soil.There have been significant efforts to develop improved testingtechniques for determination of the SWCC. The SWCC, togetherwith results from saturated soil testing, can be used to predict thebehavior of unsaturated soils for many applications.
The primary objectives of this research study were to obtainadditional test data and predictive methodologies for the shearstrength of unsaturated soil, and to provide data on a wide rangeof soil types to augment the existing unsaturated soil database forenhanced understanding of unsaturated soil behavior and im-provement of constitutive modeling of unsaturated soils. Theresearch program included the execution of a series of axis-translation triaxial test on unsaturated soils. The results were ana-lyzed in terms of the stress state variables of matric suction, ua
−uw, and net normal stress, �n−ua, for the purpose of evaluatingunsaturated soil property functions and behavior for the range ofsoil types tested. The relationship between matric suction and theshear strength properties of an unsaturated soil was studied usingthe test results from this study together with data from the litera-ture. Shear-induced volume change behavior was also studied, asthe volume change data are needed for assessment of unsaturatedsoil properties for stress-deformation analyses. Attempts weremade to correlate the unsaturated soil properties with SWCCs,soil index properties, and saturated soil properties. Engineeringpractitioners have generally found the testing of unsaturated soilwith suction measurements to be overly time consuming and tech-nically difficult. Therefore, the correlation studies provide a po-tentially valuable tool to assist in the implementation ofunsaturated soil mechanics into practice. In addition to soil shearstrength data, available stress-strain-volume change data from thetriaxial tests are presented which enhance the existing literaturedatabase for stress-deformation analyses and model development.
In this paper an overview is given of traditional and advanced-level testing methodologies for assessing unsaturated soil behav-ior. It is expected that the cost and importance of a particularengineering project will strongly influence the level of testing
sophistication that is applied in geotechnical practice.NVIRONMENTAL ENGINEERING © ASCE / NOVEMBER 2008 / 1619
ASCE license or copyright; see http://pubs.asce.org/copyright
Equipment, Soils, and Specimen Preparation
Unsaturated soil triaxial shear strength testing was carried out onfour compacted soils; namely: ASU east �SM�, Price Club soil�CL-ML�, Yuma sand �SP�, and Sheely clay �CL�. Basic soilproperties, including gradation, for these soils are shown inTables 1 and 2. A relatively large volume of each test soil wasobtained from the field and thoroughly homogenized. Test speci-mens were prepared by compaction to enhance reproducibility inthe test results. All specimens were initially compacted at opti-mum plus 1% water content and at 90% of maximum dry densityas determined by Standard Proctor testing, except for Yuma sandwhich was compacted to 16.4 kN /m3 dry unit weight and 5%initial water content. Conventional triaxial tests were performedon saturated specimens to obtain the effective stress shearstrength parameters for all test soils. These data are summarizedin Table 3.
Consolidated drained �CD� tests were conducted using an axis-translation method with suction control/measurement. The rate ofspecimen shearing was 0.004 mm /min for the soils exhibiting aplasticity index �PI�, and averaged about 0.02 mm /min for thenonplastic soils. The strain rate was set at a rate that providedreasonably uniform suction distribution throughout the 225 mmhigh and 101 mm diameter triaxial test specimens as well as the170 mm high and 71 mm diameter specimens. Specimen watercontent variation was measured at the end of each test to confirmreasonable equilibration of soil suction throughout the test speci-men. The triaxial equipment used in the study included traditionaltriaxial test systems modified for axis-translation suction-controlled testing. These systems were equipped with 5 bar highair entry disks and were subjected to a maximum applied suctionof 400 kPa. The pore-air pressure was controlled at the top of thespecimen, and the pore-water pressure was controlled at the baseof the specimen. Advanced unsaturated soil triaxial testing sys-tems, having high-air entry disks up to 15 bars, were also used inthe testing. The advanced unsaturated soils testing systems havecomputer-controlled capabilities for conducting unconsolidatedundrained triaxial test �UU�, consolidated undrained triaxial test�CU�, CD, and constant water content �CW� tests as well as con-
Table 1. Description of Test Soils
Soil typeUSCSclass
Compactioncharacteristics
wopt
�%��dmax
�kN /m3� �
Price Club CL-ML 10.8 19.6 2
Sheely CL 22.5 16.0 4
ASU east SM 10.5 19.5
Yuma sand SP — —awPI=weighted plasticity index= P200 �as decimal��PI �%�.
Table 2. Gradation of Soil Samples
Soil type 19 mm 9.5 mm No. 4
Price Club �CL-ML� 100 100 100
Sheely �CL� 100 99.9 99.9
ASU east �SM� 99.7 97.8 94.1
Yuma sand �SP� 100 100 99.8
1620 / JOURNAL OF GEOTECHNICAL AND GEOENVIRONMENTAL ENGIN
Downloaded 28 Jan 2010 to 129.82.213.43. Redistribution subject to
solidation, determination of soil-water characteristic curve, per-meability, and dynamic testing �Padilla et al. 2006�. A double-walled triaxial chamber is used for improved overall volumechange measurements. The system has a flushing device for re-moval of diffused air that may accumulate below the high-airentry ceramic disk during the test. The modified triaxial systemswere used for shear testing without volume change measure-ments. The advanced unsaturated soil triaxial systems were usedfor both shear strength and volume change testing. One disadvan-tage of the traditional systems was the lack of a flushing system toremove air from below the high-air entry disk. The removal ofdiffused air assisted in obtaining an accurate water volumechange measurement over long term tests. Diffused air can alsobe a problem at high suction values �greater than 400 kPa� as thevolume of diffused air may be sufficient to retard flow of waterinto or out of the specimen. The traditional triaxial cells are alsosingle walled, further decreasing the accuracy of the volumechange measurements. Therefore, all reported volume changedata are from the advanced testing systems with the double-walled cells and diffused air flushing capabilities. Only shearstrength data are reported from the single-walled triaxial cells.
One of the main disadvantages of testing unsaturated soilsusing the suction control method is the long time required toequilibrate a specimen under applied suction and net normalstress conditions. Equilibration times can vary from weeks toeven months, and tests can become infeasible from a time andresources standpoint. Further, corrections for system complianceand diffused air are more challenging for long-term tests. Forthese reasons, a more efficient specimen preparation method wasdeveloped with respect to the time a specimen was in the triaxialtesting chamber. Many of the test specimens were equilibrated tothe desired value of suction prior to placement in the triaxialapparatus. The procedure for the pre-equilibration process in-volved first compacting the specimen to the predetermined com-paction dry density and compaction water content. Then the watercontent corresponding to the target test suction value was esti-mated from the as-measured suction versus water content dryingcurve, and the specimen was allowed to dry or wet graduallyoutside of the triaxial cell until the target water content was
Atterberg limits
Gs
Passing200P200
�%� wPIaPL�%�
PI�%�
18.0 7.6 2.71 54.8 4.2
23.7 17.4 2.79 94.8 16.5
NP NP 2.71 27.0 0
NP NP 2.66 0.36 0
Gradation�% finer�
No.8 No. 10 No.40 No.100 No.200
96.8 88.6 72.5 63.4 54.8
99.9 99.9 99.3 97.5 94.8
87.3 85.0 54.6 34.8 27.0
99.5 99.4 65.2 5.3 0.36
LL%�
5.6
1.1
NP
NP
EERING © ASCE / NOVEMBER 2008
ASCE license or copyright; see http://pubs.asce.org/copyright
achieved. For drying, the specimen was placed on a base pedestalof a triaxial cell and enclosed in a membrane. The membrane wasthen rolled back exposing at least half of the specimen for drying�for some part of the day�, and the weight was monitored. Eachevening the specimen was completely covered with the mem-brane to allow equilibration. This process was repeated until thedesired water content, corresponding to the target suction value,was achieved. In the case of wetting, the process was similar butsmall amounts of water were gradually added to the specimen.Because it is not possible to precisely determine the soil suctionfrom the as-measured drying curve due to hysteresis, the soilsuction achieved using this procedure must subsequently be di-rectly measured in the triaxial cell. In general, the SWCC esti-mates appeared to provide the desired water contents thatcorresponded fairly closely to the target suction. The technique ofpre-equalization appeared to be feasible, and saved test chambertime.
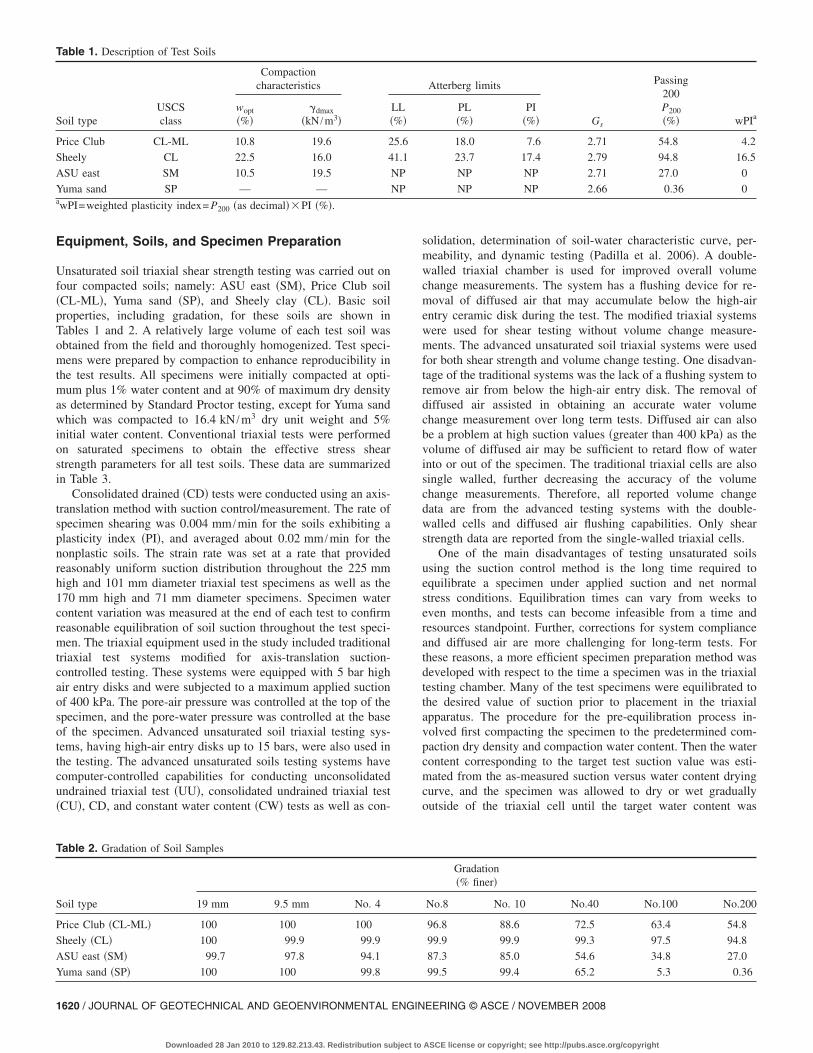
Using this pre-equalization procedure, the test specimens wereallowed to dry �or wet� to target suction values of 50, 150, 400,600, and 700 kPa. The as-measured drying suction versus watercontent curves for the compacted test specimens are shown in Fig.1. The SWCC results shown are for a net normal stress of 20 kPa.SWCC testing was also conducted at other values of net normalstress, consistent with the net normal stress values used in thetriaxial testing program. For these tests soils, the SWCC charac-teristics, including the air entry value �AEV�, were not found tobe sensitive to net normal stress within the range considered inthis program �Perez-Garcia 2006�. A typical water content distri-bution from a pre-equilibrated specimen, before triaxial consoli-dation and shear testing, is shown in Fig. 2 for the Arizona StateUniversity �ASU� east soil. Once the equilibration was judgedcomplete, the test specimen was transferred to the test chamber
Table 3. Effective Stress Parameters for Test Soils
Soil typec�
�kPa���
�deg�
Price Club �CL-ML� 10 27.1
Sheely �CL� 2.5 33.1
ASU east �SM� 2.3 36.1
Yuma sand �SP� 0 37.4
Fig. 1. Soil-water characteristic curves for test soils, gravimetricwater content versus matric suction
JOURNAL OF GEOTECHNICAL AND GEOE
Downloaded 28 Jan 2010 to 129.82.213.43. Redistribution subject to
for testing. The existing soil suction was simply measured at thispoint by first applying the best-estimate suction value and thenadjusting the applied suction slightly as required to prevent watercontent �and volume� change of the test specimen. Subsequently,the suction was controlled to be constant and equal to the initiallymeasured value. As a result of use of the pre-equilibration pro-cess, the suction values for the actual test specimens varied some-what about the target values. For example, for the ASU East soil�SM�, the average suction was 345 kPa for three test specimens,and the range in suction values was 320–360 kPa.
Presentation of Triaxial Test Shear Strength Data
The approach used to obtain the secant �b parameter for a par-ticular value of suction consisted of drawing the Mohr circles inthe net normal stress ��−ua� versus shear strength ��� plane. It isdesirable to have at least three different net normal stress valuesfor each level of suction considered. The values of c� and ��’ aretaken to be independent of suction, and the contribution of matricsuction to shear strength is incorporated into the total cohesionintercept obtained from the Mohr circle plots. The value of �b isbackcalculated from the total cohesion intercept value. This isdone by rearranging Eq. �1� and ascribing the difference c−c� tothe increase in shear strength due to suction, as shown by Eq. �2�,yielding the secant value of �b.
�b = arctan� c − c�
�ua − uw�� �2�
where c=total cohesion intercept; and �b=secant slope angle, asdiscussed below.
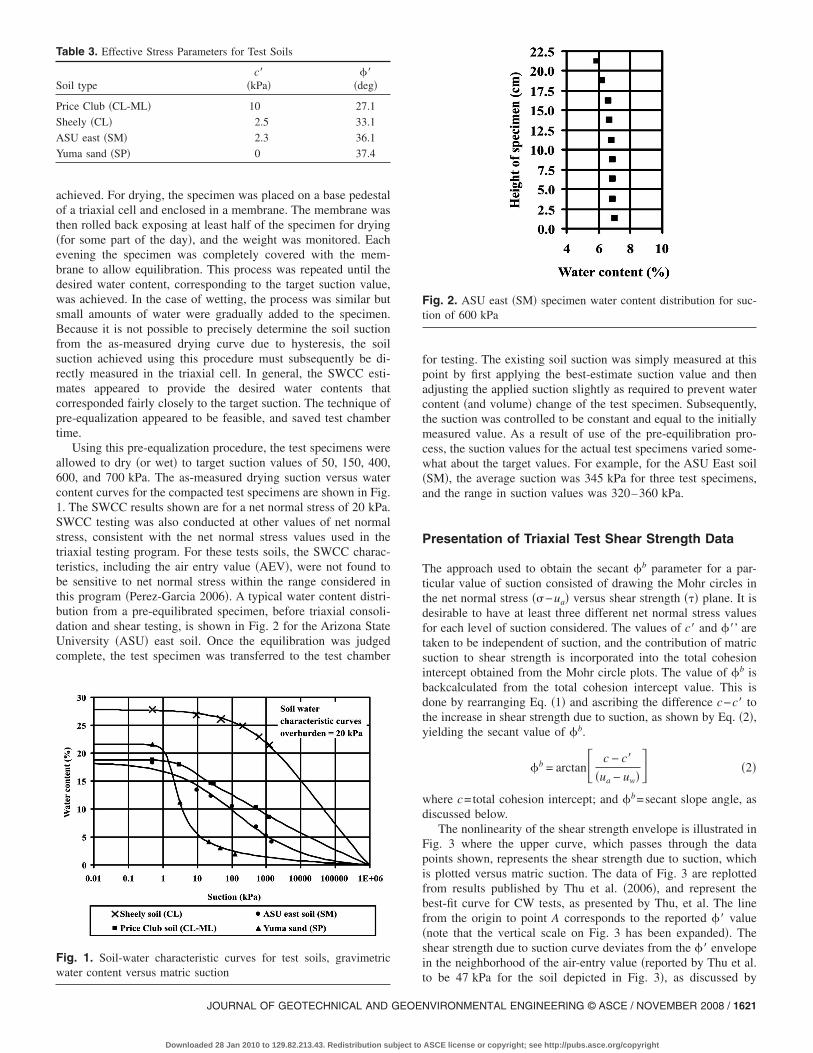
The nonlinearity of the shear strength envelope is illustrated inFig. 3 where the upper curve, which passes through the datapoints shown, represents the shear strength due to suction, whichis plotted versus matric suction. The data of Fig. 3 are replottedfrom results published by Thu et al. �2006�, and represent thebest-fit curve for CW tests, as presented by Thu, et al. The linefrom the origin to point A corresponds to the reported �� value�note that the vertical scale on Fig. 3 has been expanded�. Theshear strength due to suction curve deviates from the �� envelopein the neighborhood of the air-entry value �reported by Thu et al.
Fig. 2. ASU east �SM� specimen water content distribution for suc-tion of 600 kPa
to be 47 kPa for the soil depicted in Fig. 3�, as discussed by
NVIRONMENTAL ENGINEERING © ASCE / NOVEMBER 2008 / 1621
ASCE license or copyright; see http://pubs.asce.org/copyright
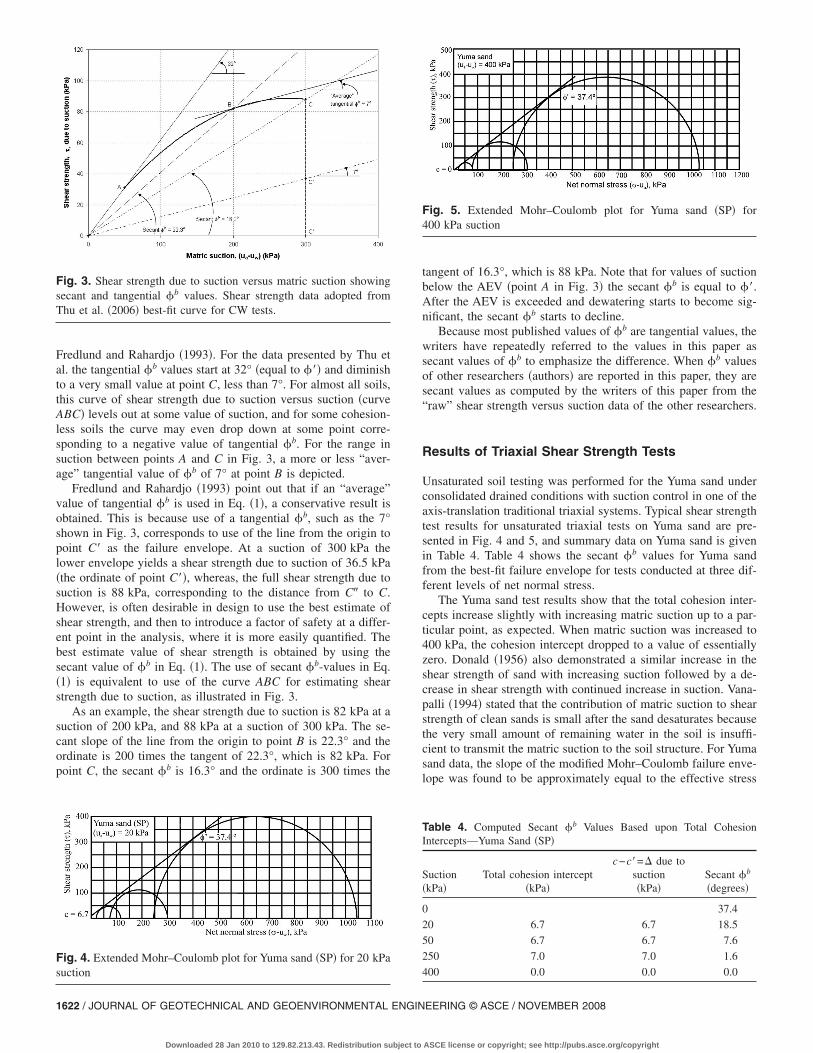
Fredlund and Rahardjo �1993�. For the data presented by Thu etal. the tangential �b values start at 32° �equal to ��� and diminishto a very small value at point C, less than 7°. For almost all soils,this curve of shear strength due to suction versus suction �curveABC� levels out at some value of suction, and for some cohesion-less soils the curve may even drop down at some point corre-sponding to a negative value of tangential �b. For the range insuction between points A and C in Fig. 3, a more or less “aver-age” tangential value of �b of 7° at point B is depicted.
Fredlund and Rahardjo �1993� point out that if an “average”value of tangential �b is used in Eq. �1�, a conservative result isobtained. This is because use of a tangential �b, such as the 7°shown in Fig. 3, corresponds to use of the line from the origin topoint C� as the failure envelope. At a suction of 300 kPa thelower envelope yields a shear strength due to suction of 36.5 kPa�the ordinate of point C��, whereas, the full shear strength due tosuction is 88 kPa, corresponding to the distance from C� to C.However, is often desirable in design to use the best estimate ofshear strength, and then to introduce a factor of safety at a differ-ent point in the analysis, where it is more easily quantified. Thebest estimate value of shear strength is obtained by using thesecant value of �b in Eq. �1�. The use of secant �b-values in Eq.�1� is equivalent to use of the curve ABC for estimating shearstrength due to suction, as illustrated in Fig. 3.
As an example, the shear strength due to suction is 82 kPa at asuction of 200 kPa, and 88 kPa at a suction of 300 kPa. The se-cant slope of the line from the origin to point B is 22.3° and theordinate is 200 times the tangent of 22.3°, which is 82 kPa. Forpoint C, the secant �b is 16.3° and the ordinate is 300 times the
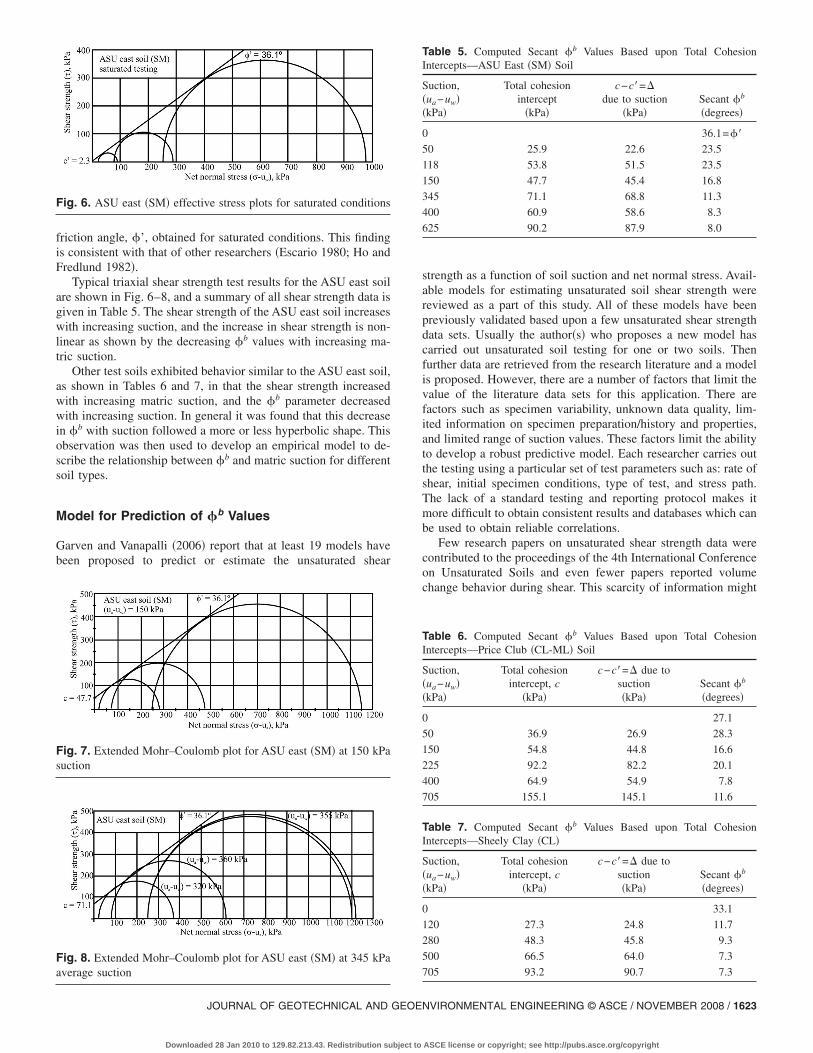
Fig. 4. Extended Mohr–Coulomb plot for Yuma sand �SP� for 20 kPasuction
Fig. 3. Shear strength due to suction versus matric suction showingsecant and tangential �b values. Shear strength data adopted fromThu et al. �2006� best-fit curve for CW tests.
1622 / JOURNAL OF GEOTECHNICAL AND GEOENVIRONMENTAL ENGIN
Downloaded 28 Jan 2010 to 129.82.213.43. Redistribution subject to
tangent of 16.3°, which is 88 kPa. Note that for values of suctionbelow the AEV �point A in Fig. 3� the secant �b is equal to ��.After the AEV is exceeded and dewatering starts to become sig-nificant, the secant �b starts to decline.
Because most published values of �b are tangential values, thewriters have repeatedly referred to the values in this paper assecant values of �b to emphasize the difference. When �b valuesof other researchers �authors� are reported in this paper, they aresecant values as computed by the writers of this paper from the“raw” shear strength versus suction data of the other researchers.
Results of Triaxial Shear Strength Tests
Unsaturated soil testing was performed for the Yuma sand underconsolidated drained conditions with suction control in one of theaxis-translation traditional triaxial systems. Typical shear strengthtest results for unsaturated triaxial tests on Yuma sand are pre-sented in Fig. 4 and 5, and summary data on Yuma sand is givenin Table 4. Table 4 shows the secant �b values for Yuma sandfrom the best-fit failure envelope for tests conducted at three dif-ferent levels of net normal stress.
The Yuma sand test results show that the total cohesion inter-cepts increase slightly with increasing matric suction up to a par-ticular point, as expected. When matric suction was increased to400 kPa, the cohesion intercept dropped to a value of essentiallyzero. Donald �1956� also demonstrated a similar increase in theshear strength of sand with increasing suction followed by a de-crease in shear strength with continued increase in suction. Vana-palli �1994� stated that the contribution of matric suction to shearstrength of clean sands is small after the sand desaturates becausethe very small amount of remaining water in the soil is insuffi-cient to transmit the matric suction to the soil structure. For Yumasand data, the slope of the modified Mohr–Coulomb failure enve-lope was found to be approximately equal to the effective stress
Fig. 5. Extended Mohr–Coulomb plot for Yuma sand �SP� for400 kPa suction
Table 4. Computed Secant �b Values Based upon Total CohesionIntercepts—Yuma Sand �SP�
Suction�kPa�
Total cohesion intercept�kPa�
c−c�=� due tosuction�kPa�
Secant �b
�degrees�
0 37.4
20 6.7 6.7 18.5
50 6.7 6.7 7.6
250 7.0 7.0 1.6
400 0.0 0.0 0.0
EERING © ASCE / NOVEMBER 2008
ASCE license or copyright; see http://pubs.asce.org/copyright
friction angle, �’, obtained for saturated conditions. This findingis consistent with that of other researchers �Escario 1980; Ho andFredlund 1982�.
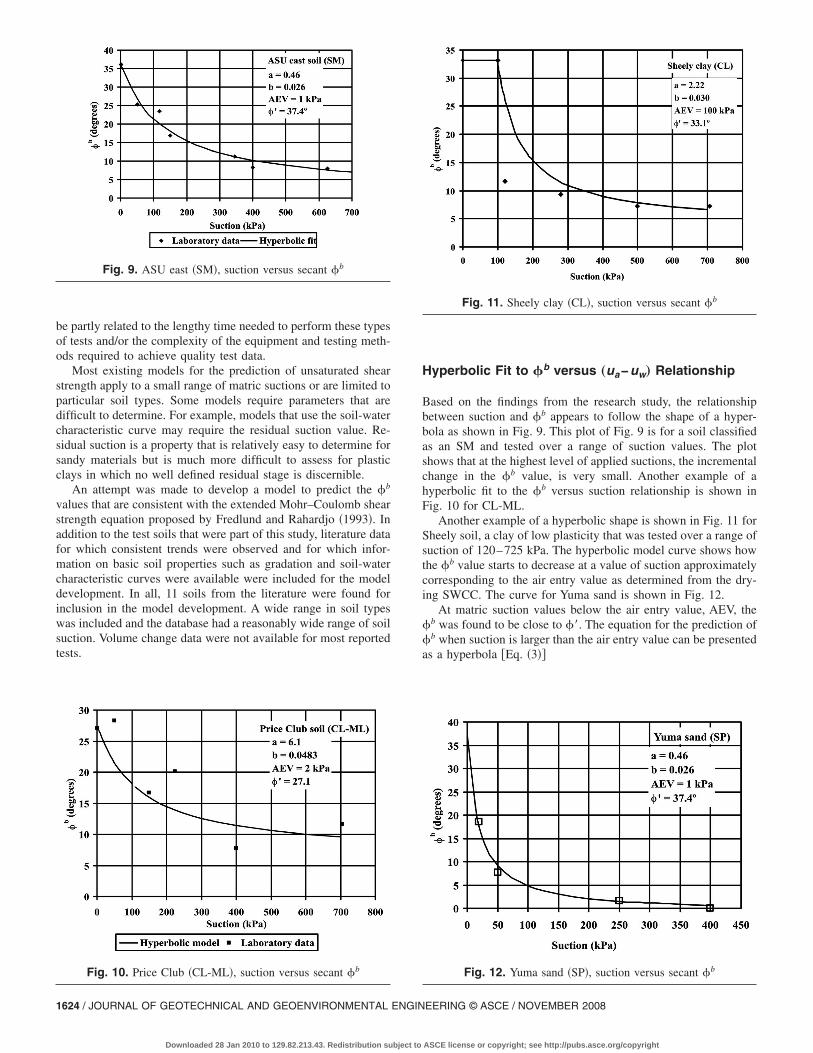
Typical triaxial shear strength test results for the ASU east soilare shown in Fig. 6–8, and a summary of all shear strength data isgiven in Table 5. The shear strength of the ASU east soil increaseswith increasing suction, and the increase in shear strength is non-linear as shown by the decreasing �b values with increasing ma-tric suction.
Other test soils exhibited behavior similar to the ASU east soil,as shown in Tables 6 and 7, in that the shear strength increasedwith increasing matric suction, and the �b parameter decreasedwith increasing suction. In general it was found that this decreasein �b with suction followed a more or less hyperbolic shape. Thisobservation was then used to develop an empirical model to de-scribe the relationship between �b and matric suction for differentsoil types.
Model for Prediction of �b Values
Garven and Vanapalli �2006� report that at least 19 models havebeen proposed to predict or estimate the unsaturated shear
Fig. 7. Extended Mohr–Coulomb plot for ASU east �SM� at 150 kPasuction
Fig. 8. Extended Mohr–Coulomb plot for ASU east �SM� at 345 kPaaverage suction
Fig. 6. ASU east �SM� effective stress plots for saturated conditions
JOURNAL OF GEOTECHNICAL AND GEOE
Downloaded 28 Jan 2010 to 129.82.213.43. Redistribution subject to
strength as a function of soil suction and net normal stress. Avail-able models for estimating unsaturated soil shear strength werereviewed as a part of this study. All of these models have beenpreviously validated based upon a few unsaturated shear strengthdata sets. Usually the author�s� who proposes a new model hascarried out unsaturated soil testing for one or two soils. Thenfurther data are retrieved from the research literature and a modelis proposed. However, there are a number of factors that limit thevalue of the literature data sets for this application. There arefactors such as specimen variability, unknown data quality, lim-ited information on specimen preparation/history and properties,and limited range of suction values. These factors limit the abilityto develop a robust predictive model. Each researcher carries outthe testing using a particular set of test parameters such as: rate ofshear, initial specimen conditions, type of test, and stress path.The lack of a standard testing and reporting protocol makes itmore difficult to obtain consistent results and databases which canbe used to obtain reliable correlations.
Few research papers on unsaturated shear strength data werecontributed to the proceedings of the 4th International Conferenceon Unsaturated Soils and even fewer papers reported volumechange behavior during shear. This scarcity of information might
Table 5. Computed Secant �b Values Based upon Total CohesionIntercepts—ASU East �SM� Soil
Suction,�ua−uw��kPa�
Total cohesionintercept
�kPa�
c−c�=�due to suction
�kPa�Secant �b
�degrees�
0 36.1=��50 25.9 22.6 23.5
118 53.8 51.5 23.5
150 47.7 45.4 16.8
345 71.1 68.8 11.3
400 60.9 58.6 8.3
625 90.2 87.9 8.0
Table 6. Computed Secant �b Values Based upon Total CohesionIntercepts—Price Club �CL-ML� Soil
Suction,�ua−uw��kPa�
Total cohesionintercept, c
�kPa�
c−c�=� due tosuction�kPa�
Secant �b
�degrees�
0 27.1
50 36.9 26.9 28.3
150 54.8 44.8 16.6
225 92.2 82.2 20.1
400 64.9 54.9 7.8
705 155.1 145.1 11.6
Table 7. Computed Secant �b Values Based upon Total CohesionIntercepts—Sheely Clay �CL�
Suction,�ua−uw��kPa�
Total cohesionintercept, c
�kPa�
c−c�=� due tosuction�kPa�
Secant �b
�degrees�
0 33.1
120 27.3 24.8 11.7
280 48.3 45.8 9.3
500 66.5 64.0 7.3
705 93.2 90.7 7.3
NVIRONMENTAL ENGINEERING © ASCE / NOVEMBER 2008 / 1623
ASCE license or copyright; see http://pubs.asce.org/copyright
be partly related to the lengthy time needed to perform these typesof tests and/or the complexity of the equipment and testing meth-ods required to achieve quality test data.
Most existing models for the prediction of unsaturated shearstrength apply to a small range of matric suctions or are limited toparticular soil types. Some models require parameters that aredifficult to determine. For example, models that use the soil-watercharacteristic curve may require the residual suction value. Re-sidual suction is a property that is relatively easy to determine forsandy materials but is much more difficult to assess for plasticclays in which no well defined residual stage is discernible.
An attempt was made to develop a model to predict the �b
values that are consistent with the extended Mohr–Coulomb shearstrength equation proposed by Fredlund and Rahardjo �1993�. Inaddition to the test soils that were part of this study, literature datafor which consistent trends were observed and for which infor-mation on basic soil properties such as gradation and soil-watercharacteristic curves were available were included for the modeldevelopment. In all, 11 soils from the literature were found forinclusion in the model development. A wide range in soil typeswas included and the database had a reasonably wide range of soilsuction. Volume change data were not available for most reportedtests.
Fig. 9. ASU east �SM�, suction versus secant �b
Fig. 10. Price Club �CL-ML�, suction versus secant �b
1624 / JOURNAL OF GEOTECHNICAL AND GEOENVIRONMENTAL ENGIN
Downloaded 28 Jan 2010 to 129.82.213.43. Redistribution subject to
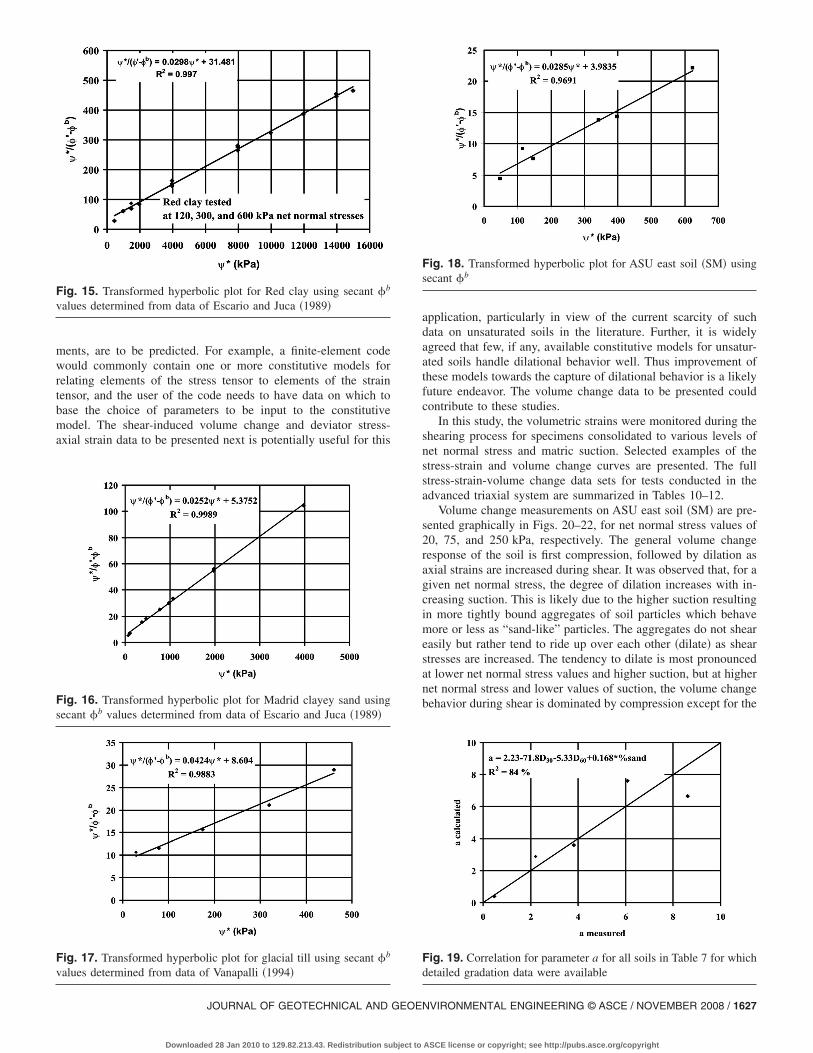
Hyperbolic Fit to �b versus „ua−uw… Relationship
Based on the findings from the research study, the relationshipbetween suction and �b appears to follow the shape of a hyper-bola as shown in Fig. 9. This plot of Fig. 9 is for a soil classifiedas an SM and tested over a range of suction values. The plotshows that at the highest level of applied suctions, the incrementalchange in the �b value, is very small. Another example of ahyperbolic fit to the �b versus suction relationship is shown inFig. 10 for CL-ML.
Another example of a hyperbolic shape is shown in Fig. 11 forSheely soil, a clay of low plasticity that was tested over a range ofsuction of 120–725 kPa. The hyperbolic model curve shows howthe �b value starts to decrease at a value of suction approximatelycorresponding to the air entry value as determined from the dry-ing SWCC. The curve for Yuma sand is shown in Fig. 12.
At matric suction values below the air entry value, AEV, the�b was found to be close to ��. The equation for the prediction of�b when suction is larger than the air entry value can be presentedas a hyperbola �Eq. �3��
Fig. 11. Sheely clay �CL�, suction versus secant �b
Fig. 12. Yuma sand �SP�, suction versus secant �b
EERING © ASCE / NOVEMBER 2008
ASCE license or copyright; see http://pubs.asce.org/copyright
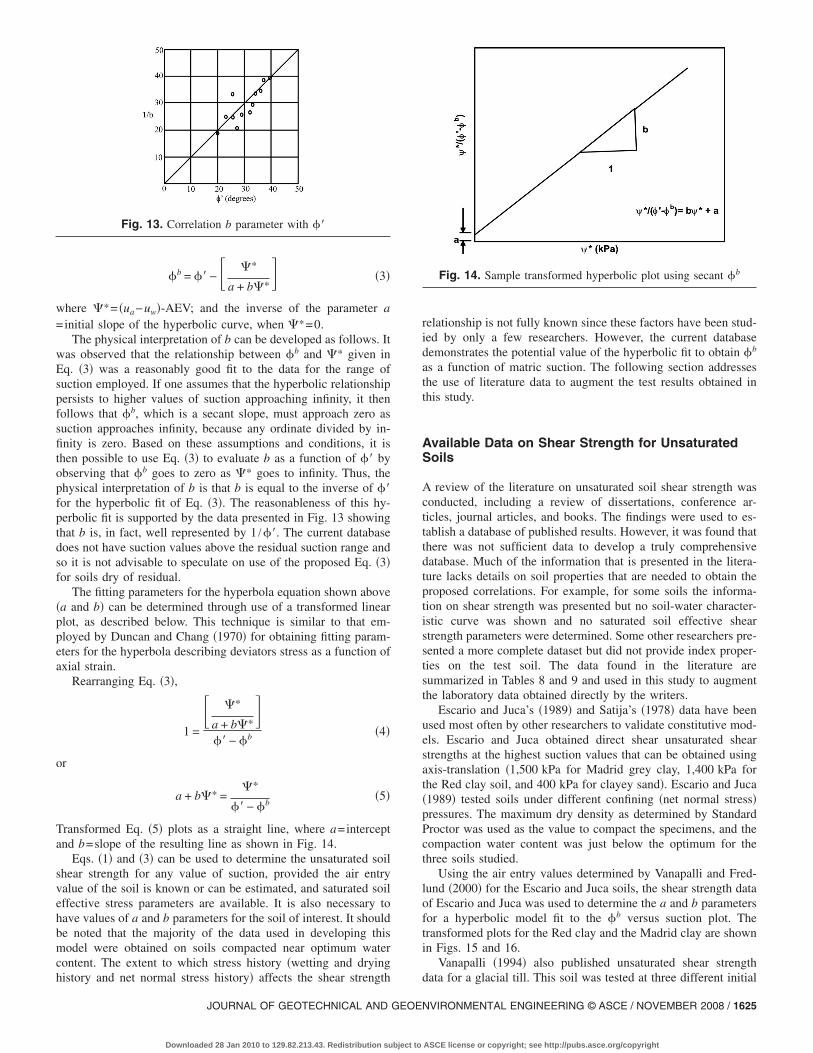
�b = �� − � �*
a + b�*� �3�
where �*= �ua−uw�-AEV; and the inverse of the parameter a=initial slope of the hyperbolic curve, when �*=0.
The physical interpretation of b can be developed as follows. Itwas observed that the relationship between �b and �* given inEq. �3� was a reasonably good fit to the data for the range ofsuction employed. If one assumes that the hyperbolic relationshippersists to higher values of suction approaching infinity, it thenfollows that �b, which is a secant slope, must approach zero assuction approaches infinity, because any ordinate divided by in-finity is zero. Based on these assumptions and conditions, it isthen possible to use Eq. �3� to evaluate b as a function of �� byobserving that �b goes to zero as �* goes to infinity. Thus, thephysical interpretation of b is that b is equal to the inverse of ��for the hyperbolic fit of Eq. �3�. The reasonableness of this hy-perbolic fit is supported by the data presented in Fig. 13 showingthat b is, in fact, well represented by 1 /��. The current databasedoes not have suction values above the residual suction range andso it is not advisable to speculate on use of the proposed Eq. �3�for soils dry of residual.
The fitting parameters for the hyperbola equation shown above�a and b� can be determined through use of a transformed linearplot, as described below. This technique is similar to that em-ployed by Duncan and Chang �1970� for obtaining fitting param-eters for the hyperbola describing deviators stress as a function ofaxial strain.
Rearranging Eq. �3�,
1 =� �*
a + b�*�
�� − �b �4�
or
a + b�* =�*
�� − �b�5�
Transformed Eq. �5� plots as a straight line, where a=interceptand b=slope of the resulting line as shown in Fig. 14.
Eqs. �1� and �3� can be used to determine the unsaturated soilshear strength for any value of suction, provided the air entryvalue of the soil is known or can be estimated, and saturated soileffective stress parameters are available. It is also necessary tohave values of a and b parameters for the soil of interest. It shouldbe noted that the majority of the data used in developing thismodel were obtained on soils compacted near optimum watercontent. The extent to which stress history �wetting and drying
Fig. 13. Correlation b parameter with ��
history and net normal stress history� affects the shear strength
JOURNAL OF GEOTECHNICAL AND GEOE
Downloaded 28 Jan 2010 to 129.82.213.43. Redistribution subject to
relationship is not fully known since these factors have been stud-ied by only a few researchers. However, the current databasedemonstrates the potential value of the hyperbolic fit to obtain �b
as a function of matric suction. The following section addressesthe use of literature data to augment the test results obtained inthis study.
Available Data on Shear Strength for UnsaturatedSoils
A review of the literature on unsaturated soil shear strength wasconducted, including a review of dissertations, conference ar-ticles, journal articles, and books. The findings were used to es-tablish a database of published results. However, it was found thatthere was not sufficient data to develop a truly comprehensivedatabase. Much of the information that is presented in the litera-ture lacks details on soil properties that are needed to obtain theproposed correlations. For example, for some soils the informa-tion on shear strength was presented but no soil-water character-istic curve was shown and no saturated soil effective shearstrength parameters were determined. Some other researchers pre-sented a more complete dataset but did not provide index proper-ties on the test soil. The data found in the literature aresummarized in Tables 8 and 9 and used in this study to augmentthe laboratory data obtained directly by the writers.
Escario and Juca’s �1989� and Satija’s �1978� data have beenused most often by other researchers to validate constitutive mod-els. Escario and Juca obtained direct shear unsaturated shearstrengths at the highest suction values that can be obtained usingaxis-translation �1,500 kPa for Madrid grey clay, 1,400 kPa forthe Red clay soil, and 400 kPa for clayey sand�. Escario and Juca�1989� tested soils under different confining �net normal stress�pressures. The maximum dry density as determined by StandardProctor was used as the value to compact the specimens, and thecompaction water content was just below the optimum for thethree soils studied.
Using the air entry values determined by Vanapalli and Fred-lund �2000� for the Escario and Juca soils, the shear strength dataof Escario and Juca was used to determine the a and b parametersfor a hyperbolic model fit to the �b versus suction plot. Thetransformed plots for the Red clay and the Madrid clay are shownin Figs. 15 and 16.
Vanapalli �1994� also published unsaturated shear strength
Fig. 14. Sample transformed hyperbolic plot using secant �b
data for a glacial till. This soil was tested at three different initial
NVIRONMENTAL ENGINEERING © ASCE / NOVEMBER 2008 / 1625
ASCE license or copyright; see http://pubs.asce.org/copyright
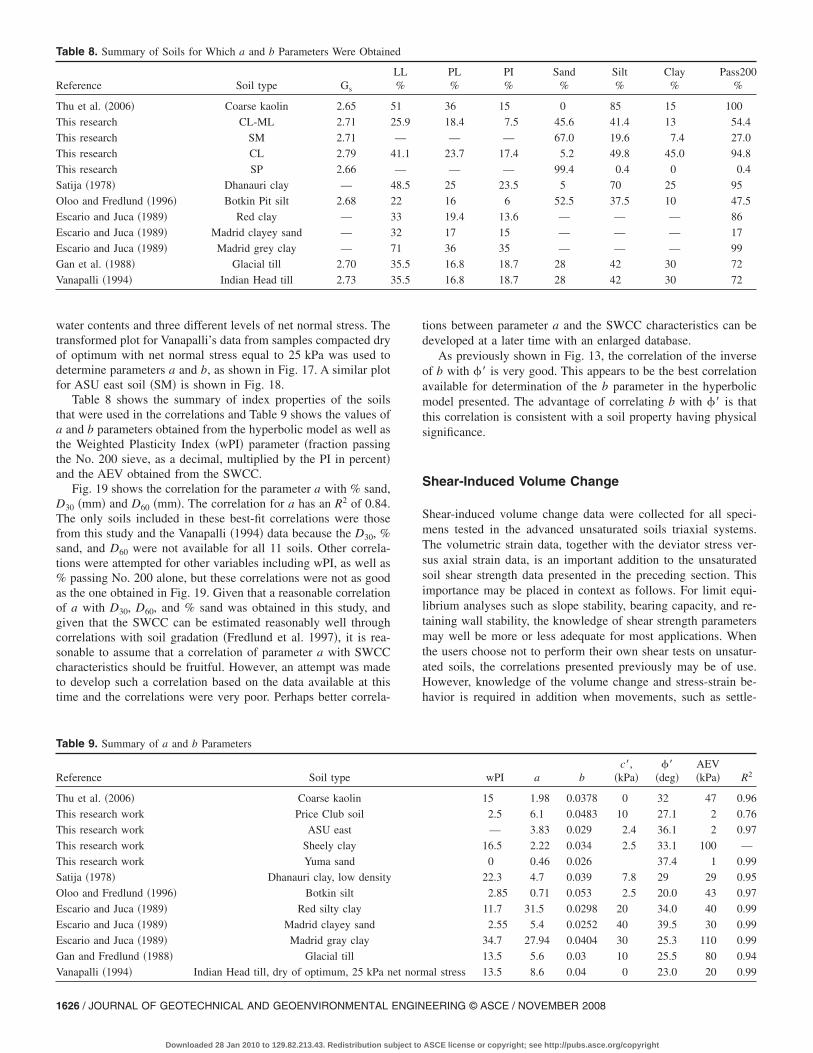
water contents and three different levels of net normal stress. Thetransformed plot for Vanapalli’s data from samples compacted dryof optimum with net normal stress equal to 25 kPa was used todetermine parameters a and b, as shown in Fig. 17. A similar plotfor ASU east soil �SM� is shown in Fig. 18.
Table 8 shows the summary of index properties of the soilsthat were used in the correlations and Table 9 shows the values ofa and b parameters obtained from the hyperbolic model as well asthe Weighted Plasticity Index �wPI� parameter �fraction passingthe No. 200 sieve, as a decimal, multiplied by the PI in percent�and the AEV obtained from the SWCC.
Fig. 19 shows the correlation for the parameter a with % sand,D30 �mm� and D60 �mm�. The correlation for a has an R2 of 0.84.The only soils included in these best-fit correlations were thosefrom this study and the Vanapalli �1994� data because the D30, %sand, and D60 were not available for all 11 soils. Other correla-tions were attempted for other variables including wPI, as well as% passing No. 200 alone, but these correlations were not as goodas the one obtained in Fig. 19. Given that a reasonable correlationof a with D30, D60, and % sand was obtained in this study, andgiven that the SWCC can be estimated reasonably well throughcorrelations with soil gradation �Fredlund et al. 1997�, it is rea-sonable to assume that a correlation of parameter a with SWCCcharacteristics should be fruitful. However, an attempt was madeto develop such a correlation based on the data available at thistime and the correlations were very poor. Perhaps better correla-
Table 8. Summary of Soils for Which a and b Parameters Were Obtaine
Reference Soil type Gs
Thu et al. �2006� Coarse kaolin 2.65 5
This research CL-ML 2.71 2
This research SM 2.71
This research CL 2.79 4
This research SP 2.66
Satija �1978� Dhanauri clay — 4
Oloo and Fredlund �1996� Botkin Pit silt 2.68 2
Escario and Juca �1989� Red clay — 3
Escario and Juca �1989� Madrid clayey sand — 3
Escario and Juca �1989� Madrid grey clay — 7
Gan et al. �1988� Glacial till 2.70 3
Vanapalli �1994� Indian Head till 2.73 3
Table 9. Summary of a and b Parameters
Reference Soil type
Thu et al. �2006� Coarse kaolin
This research work Price Club soil
This research work ASU east
This research work Sheely clay
This research work Yuma sand
Satija �1978� Dhanauri clay, low density
Oloo and Fredlund �1996� Botkin silt
Escario and Juca �1989� Red silty clay
Escario and Juca �1989� Madrid clayey sand
Escario and Juca �1989� Madrid gray clay
Gan and Fredlund �1988� Glacial till
Vanapalli �1994� Indian Head till, dry of optimum, 25 kPa n
1626 / JOURNAL OF GEOTECHNICAL AND GEOENVIRONMENTAL ENGIN
Downloaded 28 Jan 2010 to 129.82.213.43. Redistribution subject to
tions between parameter a and the SWCC characteristics can bedeveloped at a later time with an enlarged database.
As previously shown in Fig. 13, the correlation of the inverseof b with �� is very good. This appears to be the best correlationavailable for determination of the b parameter in the hyperbolicmodel presented. The advantage of correlating b with �� is thatthis correlation is consistent with a soil property having physicalsignificance.
Shear-Induced Volume Change
Shear-induced volume change data were collected for all speci-mens tested in the advanced unsaturated soils triaxial systems.The volumetric strain data, together with the deviator stress ver-sus axial strain data, is an important addition to the unsaturatedsoil shear strength data presented in the preceding section. Thisimportance may be placed in context as follows. For limit equi-librium analyses such as slope stability, bearing capacity, and re-taining wall stability, the knowledge of shear strength parametersmay well be more or less adequate for most applications. Whenthe users choose not to perform their own shear tests on unsatur-ated soils, the correlations presented previously may be of use.However, knowledge of the volume change and stress-strain be-havior is required in addition when movements, such as settle-
PL%
PI%
Sand%
Silt%
Clay%
Pass200%
36 15 0 85 15 100
18.4 7.5 45.6 41.4 13 54.4
— — 67.0 19.6 7.4 27.0
23.7 17.4 5.2 49.8 45.0 94.8
— — 99.4 0.4 0 0.4
25 23.5 5 70 25 95
16 6 52.5 37.5 10 47.5
19.4 13.6 — — — 86
17 15 — — — 17
36 35 — — — 99
16.8 18.7 28 42 30 72
16.8 18.7 28 42 30 72
wPI a bc�,
�kPa���
�deg�AEV�kPa� R2
15 1.98 0.0378 0 32 47 0.96
2.5 6.1 0.0483 10 27.1 2 0.76
— 3.83 0.029 2.4 36.1 2 0.97
16.5 2.22 0.034 2.5 33.1 100 —
0 0.46 0.026 37.4 1 0.99
22.3 4.7 0.039 7.8 29 29 0.95
2.85 0.71 0.053 2.5 20.0 43 0.97
11.7 31.5 0.0298 20 34.0 40 0.99
2.55 5.4 0.0252 40 39.5 30 0.99
34.7 27.94 0.0404 30 25.3 110 0.99
13.5 5.6 0.03 10 25.5 80 0.94
al stress 13.5 8.6 0.04 0 23.0 20 0.99
d
LL%
1
5.9
—
1.1
—
8.5
2
3
2
1
5.5
5.5
et norm
EERING © ASCE / NOVEMBER 2008
ASCE license or copyright; see http://pubs.asce.org/copyright
ments, are to be predicted. For example, a finite-element codewould commonly contain one or more constitutive models forrelating elements of the stress tensor to elements of the straintensor, and the user of the code needs to have data on which tobase the choice of parameters to be input to the constitutivemodel. The shear-induced volume change and deviator stress-axial strain data to be presented next is potentially useful for this
Fig. 15. Transformed hyperbolic plot for Red clay using secant �b
values determined from data of Escario and Juca �1989�
Fig. 16. Transformed hyperbolic plot for Madrid clayey sand usingsecant �b values determined from data of Escario and Juca �1989�
Fig. 17. Transformed hyperbolic plot for glacial till using secant �b
values determined from data of Vanapalli �1994�
JOURNAL OF GEOTECHNICAL AND GEOE
Downloaded 28 Jan 2010 to 129.82.213.43. Redistribution subject to
application, particularly in view of the current scarcity of suchdata on unsaturated soils in the literature. Further, it is widelyagreed that few, if any, available constitutive models for unsatur-ated soils handle dilational behavior well. Thus improvement ofthese models towards the capture of dilational behavior is a likelyfuture endeavor. The volume change data to be presented couldcontribute to these studies.
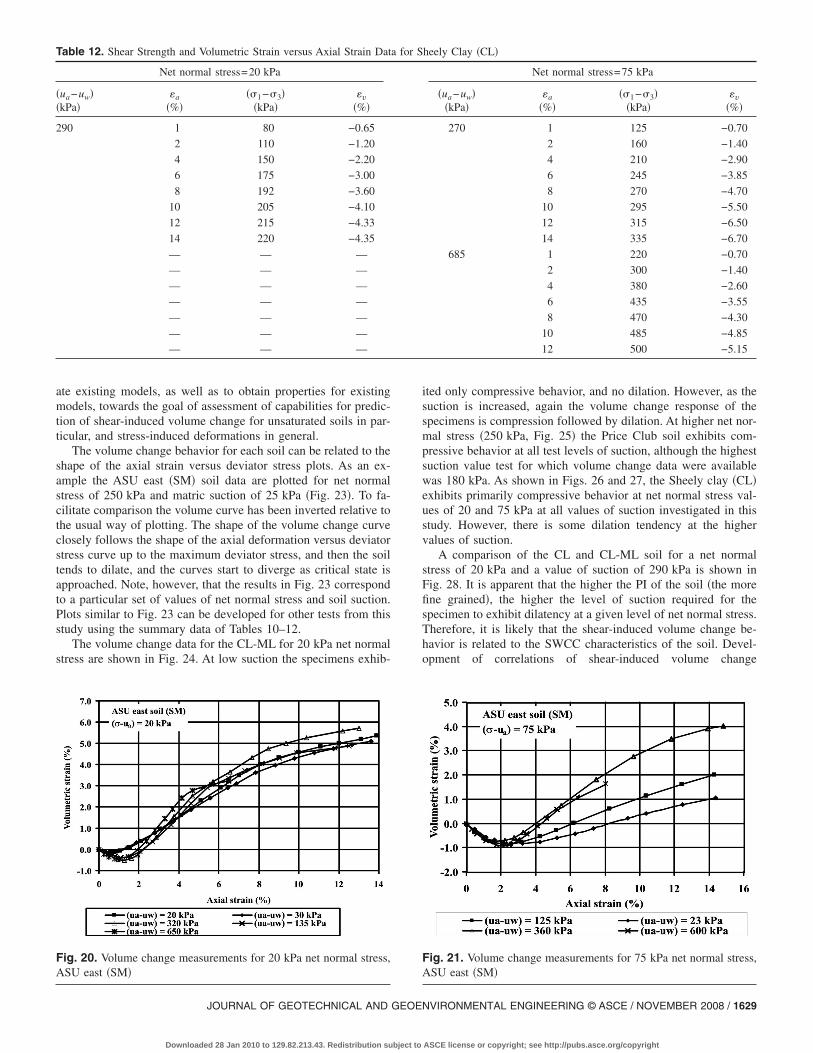
In this study, the volumetric strains were monitored during theshearing process for specimens consolidated to various levels ofnet normal stress and matric suction. Selected examples of thestress-strain and volume change curves are presented. The fullstress-strain-volume change data sets for tests conducted in theadvanced triaxial system are summarized in Tables 10–12.
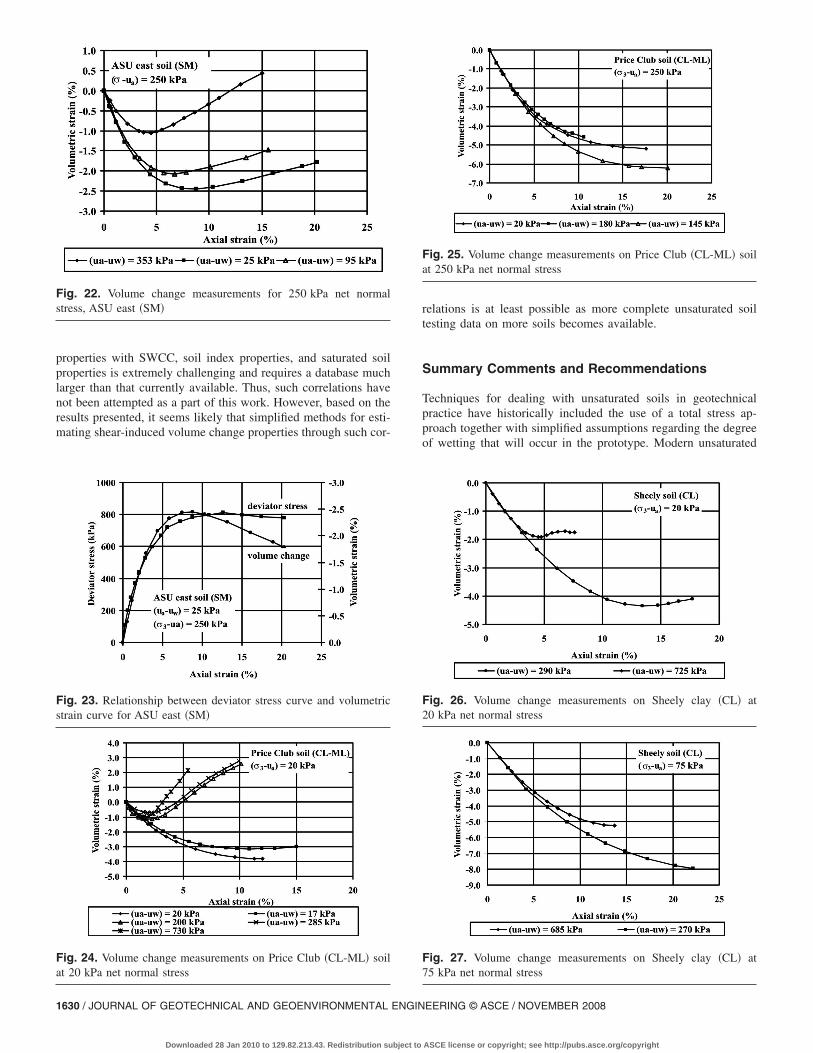
Volume change measurements on ASU east soil �SM� are pre-sented graphically in Figs. 20–22, for net normal stress values of20, 75, and 250 kPa, respectively. The general volume changeresponse of the soil is first compression, followed by dilation asaxial strains are increased during shear. It was observed that, for agiven net normal stress, the degree of dilation increases with in-creasing suction. This is likely due to the higher suction resultingin more tightly bound aggregates of soil particles which behavemore or less as “sand-like” particles. The aggregates do not sheareasily but rather tend to ride up over each other �dilate� as shearstresses are increased. The tendency to dilate is most pronouncedat lower net normal stress values and higher suction, but at highernet normal stress and lower values of suction, the volume changebehavior during shear is dominated by compression except for the
Fig. 18. Transformed hyperbolic plot for ASU east soil �SM� usingsecant �b
Fig. 19. Correlation for parameter a for all soils in Table 7 for whichdetailed gradation data were available
NVIRONMENTAL ENGINEERING © ASCE / NOVEMBER 2008 / 1627
ASCE license or copyright; see http://pubs.asce.org/copyright
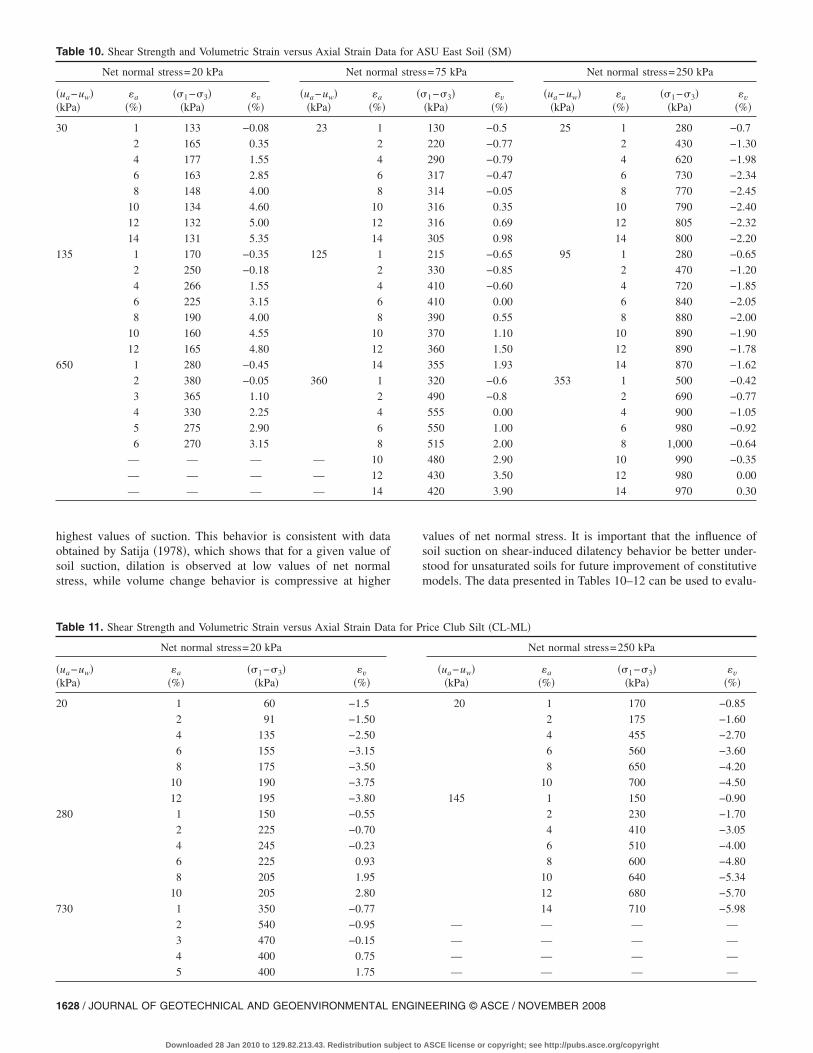
highest values of suction. This behavior is consistent with dataobtained by Satija �1978�, which shows that for a given value ofsoil suction, dilation is observed at low values of net normalstress, while volume change behavior is compressive at higher
Table 10. Shear Strength and Volumetric Strain versus Axial Strain Dat
Net normal stress=20 kPa Net norma
�ua−uw��kPa�
�a
�%���1−�3�
�kPa��v
�%��ua−uw�
�kPa��a
�%�
30 1 133 −0.08 23 1
2 165 0.35 2
4 177 1.55 4
6 163 2.85 6
8 148 4.00 8
10 134 4.60 10
12 132 5.00 12
14 131 5.35 14
135 1 170 −0.35 125 1
2 250 −0.18 2
4 266 1.55 4
6 225 3.15 6
8 190 4.00 8
10 160 4.55 10
12 165 4.80 12
650 1 280 −0.45 14
2 380 −0.05 360 1
3 365 1.10 2
4 330 2.25 4
5 275 2.90 6
6 270 3.15 8
— — — — 10
— — — — 12
— — — — 14
Table 11. Shear Strength and Volumetric Strain versus Axial Strain Data
Net normal stress=20 kPa
�ua−uw��kPa�
�a
�%���1−�3�
�kPa��v
�%�
20 1 60 −1.5
2 91 −1.50
4 135 −2.50
6 155 −3.15
8 175 −3.50
10 190 −3.75
12 195 −3.80
280 1 150 −0.55
2 225 −0.70
4 245 −0.23
6 225 0.93
8 205 1.95
10 205 2.80
730 1 350 −0.77
2 540 −0.95
3 470 −0.15
4 400 0.75
5 400 1.75
1628 / JOURNAL OF GEOTECHNICAL AND GEOENVIRONMENTAL ENGIN
Downloaded 28 Jan 2010 to 129.82.213.43. Redistribution subject to
values of net normal stress. It is important that the influence ofsoil suction on shear-induced dilatency behavior be better under-stood for unsaturated soils for future improvement of constitutivemodels. The data presented in Tables 10–12 can be used to evalu-
SU East Soil �SM�
s=75 kPa Net normal stress=250 kPa
1−�3��kPa�
�v�%�
�ua−uw��kPa�
�a
�%���1−�3�
�kPa��v
�%�
130 −0.5 25 1 280 −0.7
220 −0.77 2 430 −1.30
290 −0.79 4 620 −1.98
317 −0.47 6 730 −2.34
314 −0.05 8 770 −2.45
316 0.35 10 790 −2.40
316 0.69 12 805 −2.32
305 0.98 14 800 −2.20
215 −0.65 95 1 280 −0.65
330 −0.85 2 470 −1.20
410 −0.60 4 720 −1.85
410 0.00 6 840 −2.05
390 0.55 8 880 −2.00
370 1.10 10 890 −1.90
360 1.50 12 890 −1.78
355 1.93 14 870 −1.62
320 −0.6 353 1 500 −0.42
490 −0.8 2 690 −0.77
555 0.00 4 900 −1.05
550 1.00 6 980 −0.92
515 2.00 8 1,000 −0.64
480 2.90 10 990 −0.35
430 3.50 12 980 0.00
420 3.90 14 970 0.30
rice Club Silt �CL-ML�
Net normal stress=250 kPa
�ua−uw��kPa�
�a
�%���1−�3�
�kPa��v
�%�
20 1 170 −0.85
2 175 −1.60
4 455 −2.70
6 560 −3.60
8 650 −4.20
10 700 −4.50
145 1 150 −0.90
2 230 −1.70
4 410 −3.05
6 510 −4.00
8 600 −4.80
10 640 −5.34
12 680 −5.70
14 710 −5.98
— — — —
— — — —
— — — —
— — — —
a for A
l stres
��
for P
EERING © ASCE / NOVEMBER 2008
ASCE license or copyright; see http://pubs.asce.org/copyright
ate existing models, as well as to obtain properties for existingmodels, towards the goal of assessment of capabilities for predic-tion of shear-induced volume change for unsaturated soils in par-ticular, and stress-induced deformations in general.
The volume change behavior for each soil can be related to theshape of the axial strain versus deviator stress plots. As an ex-ample the ASU east �SM� soil data are plotted for net normalstress of 250 kPa and matric suction of 25 kPa �Fig. 23�. To fa-cilitate comparison the volume curve has been inverted relative tothe usual way of plotting. The shape of the volume change curveclosely follows the shape of the axial deformation versus deviatorstress curve up to the maximum deviator stress, and then the soiltends to dilate, and the curves start to diverge as critical state isapproached. Note, however, that the results in Fig. 23 correspondto a particular set of values of net normal stress and soil suction.Plots similar to Fig. 23 can be developed for other tests from thisstudy using the summary data of Tables 10–12.
The volume change data for the CL-ML for 20 kPa net normalstress are shown in Fig. 24. At low suction the specimens exhib-
Table 12. Shear Strength and Volumetric Strain versus Axial Strain Dat
Net normal stress=20 kPa
�ua−uw��kPa�
�a
�%���1−�3�
�kPa��v
�%�
290 1 80 −0.65
2 110 −1.20
4 150 −2.20
6 175 −3.00
8 192 −3.60
10 205 −4.10
12 215 −4.33
14 220 −4.35
— — —
— — —
— — —
— — —
— — —
— — —
— — —
Fig. 20. Volume change measurements for 20 kPa net normal stress,ASU east �SM�
JOURNAL OF GEOTECHNICAL AND GEOE
Downloaded 28 Jan 2010 to 129.82.213.43. Redistribution subject to
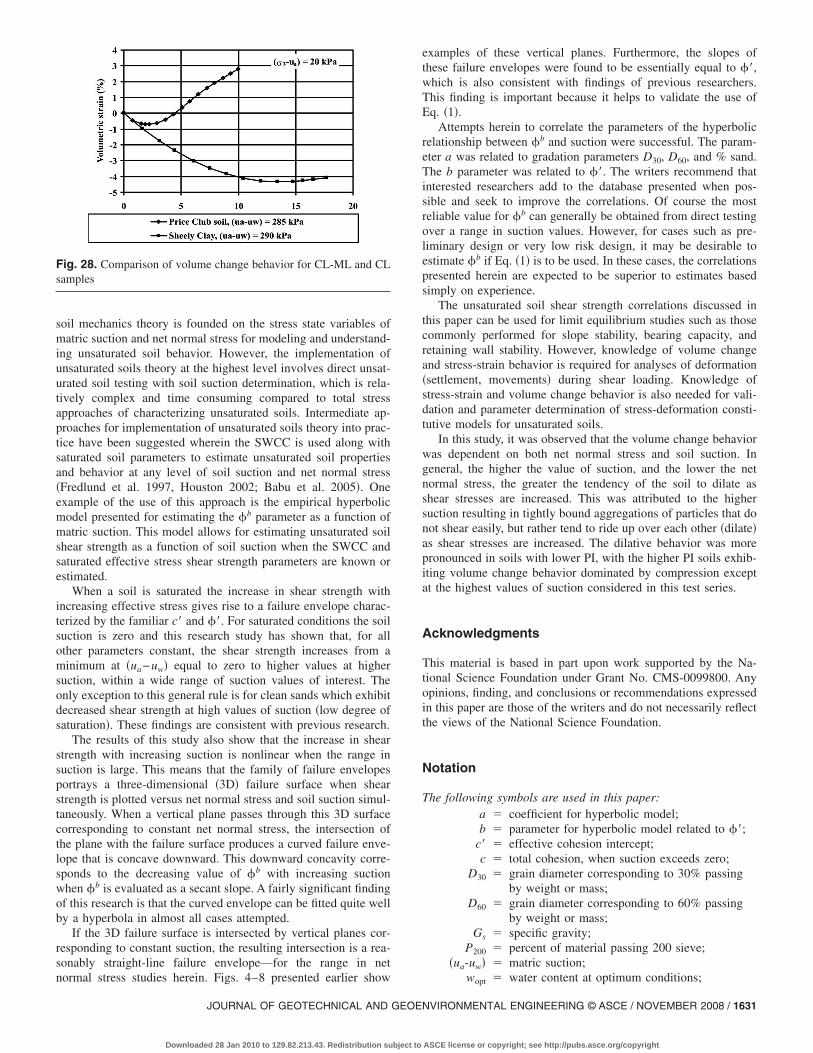
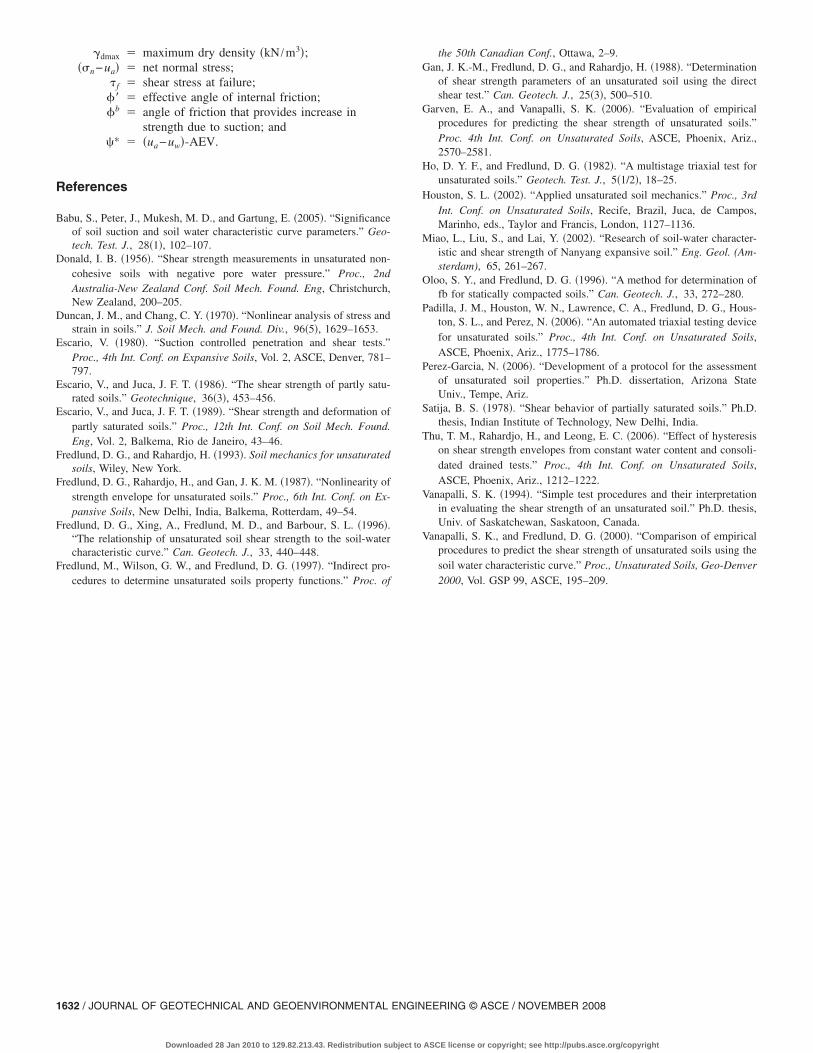
ited only compressive behavior, and no dilation. However, as thesuction is increased, again the volume change response of thespecimens is compression followed by dilation. At higher net nor-mal stress �250 kPa, Fig. 25� the Price Club soil exhibits com-pressive behavior at all test levels of suction, although the highestsuction value test for which volume change data were availablewas 180 kPa. As shown in Figs. 26 and 27, the Sheely clay �CL�exhibits primarily compressive behavior at net normal stress val-ues of 20 and 75 kPa at all values of suction investigated in thisstudy. However, there is some dilation tendency at the highervalues of suction.
A comparison of the CL and CL-ML soil for a net normalstress of 20 kPa and a value of suction of 290 kPa is shown inFig. 28. It is apparent that the higher the PI of the soil �the morefine grained�, the higher the level of suction required for thespecimen to exhibit dilatency at a given level of net normal stress.Therefore, it is likely that the shear-induced volume change be-havior is related to the SWCC characteristics of the soil. Devel-opment of correlations of shear-induced volume change
heely Clay �CL�
Net normal stress=75 kPa
�ua−uw��kPa�
�a
�%���1−�3�
�kPa��v
�%�
270 1 125 −0.70
2 160 −1.40
4 210 −2.90
6 245 −3.85
8 270 −4.70
10 295 −5.50
12 315 −6.50
14 335 −6.70
685 1 220 −0.70
2 300 −1.40
4 380 −2.60
6 435 −3.55
8 470 −4.30
10 485 −4.85
12 500 −5.15
Fig. 21. Volume change measurements for 75 kPa net normal stress,ASU east �SM�
a for S
NVIRONMENTAL ENGINEERING © ASCE / NOVEMBER 2008 / 1629
ASCE license or copyright; see http://pubs.asce.org/copyright
properties with SWCC, soil index properties, and saturated soilproperties is extremely challenging and requires a database muchlarger than that currently available. Thus, such correlations havenot been attempted as a part of this work. However, based on theresults presented, it seems likely that simplified methods for esti-mating shear-induced volume change properties through such cor-
Fig. 22. Volume change measurements for 250 kPa net normalstress, ASU east �SM�
Fig. 23. Relationship between deviator stress curve and volumetricstrain curve for ASU east �SM�
Fig. 24. Volume change measurements on Price Club �CL-ML� soilat 20 kPa net normal stress
1630 / JOURNAL OF GEOTECHNICAL AND GEOENVIRONMENTAL ENGIN
Downloaded 28 Jan 2010 to 129.82.213.43. Redistribution subject to
relations is at least possible as more complete unsaturated soiltesting data on more soils becomes available.
Summary Comments and Recommendations
Techniques for dealing with unsaturated soils in geotechnicalpractice have historically included the use of a total stress ap-proach together with simplified assumptions regarding the degreeof wetting that will occur in the prototype. Modern unsaturated
Fig. 25. Volume change measurements on Price Club �CL-ML� soilat 250 kPa net normal stress
Fig. 26. Volume change measurements on Sheely clay �CL� at20 kPa net normal stress
Fig. 27. Volume change measurements on Sheely clay �CL� at75 kPa net normal stress
EERING © ASCE / NOVEMBER 2008
ASCE license or copyright; see http://pubs.asce.org/copyright
soil mechanics theory is founded on the stress state variables ofmatric suction and net normal stress for modeling and understand-ing unsaturated soil behavior. However, the implementation ofunsaturated soils theory at the highest level involves direct unsat-urated soil testing with soil suction determination, which is rela-tively complex and time consuming compared to total stressapproaches of characterizing unsaturated soils. Intermediate ap-proaches for implementation of unsaturated soils theory into prac-tice have been suggested wherein the SWCC is used along withsaturated soil parameters to estimate unsaturated soil propertiesand behavior at any level of soil suction and net normal stress�Fredlund et al. 1997, Houston 2002; Babu et al. 2005�. Oneexample of the use of this approach is the empirical hyperbolicmodel presented for estimating the �b parameter as a function ofmatric suction. This model allows for estimating unsaturated soilshear strength as a function of soil suction when the SWCC andsaturated effective stress shear strength parameters are known orestimated.
When a soil is saturated the increase in shear strength withincreasing effective stress gives rise to a failure envelope charac-terized by the familiar c� and ��. For saturated conditions the soilsuction is zero and this research study has shown that, for allother parameters constant, the shear strength increases from aminimum at �ua−uw� equal to zero to higher values at highersuction, within a wide range of suction values of interest. Theonly exception to this general rule is for clean sands which exhibitdecreased shear strength at high values of suction �low degree ofsaturation�. These findings are consistent with previous research.
The results of this study also show that the increase in shearstrength with increasing suction is nonlinear when the range insuction is large. This means that the family of failure envelopesportrays a three-dimensional �3D� failure surface when shearstrength is plotted versus net normal stress and soil suction simul-taneously. When a vertical plane passes through this 3D surfacecorresponding to constant net normal stress, the intersection ofthe plane with the failure surface produces a curved failure enve-lope that is concave downward. This downward concavity corre-sponds to the decreasing value of �b with increasing suctionwhen �b is evaluated as a secant slope. A fairly significant findingof this research is that the curved envelope can be fitted quite wellby a hyperbola in almost all cases attempted.
If the 3D failure surface is intersected by vertical planes cor-responding to constant suction, the resulting intersection is a rea-sonably straight-line failure envelope—for the range in net
Fig. 28. Comparison of volume change behavior for CL-ML and CLsamples
normal stress studies herein. Figs. 4–8 presented earlier show
JOURNAL OF GEOTECHNICAL AND GEOE
Downloaded 28 Jan 2010 to 129.82.213.43. Redistribution subject to
examples of these vertical planes. Furthermore, the slopes ofthese failure envelopes were found to be essentially equal to ��,which is also consistent with findings of previous researchers.This finding is important because it helps to validate the use ofEq. �1�.
Attempts herein to correlate the parameters of the hyperbolicrelationship between �b and suction were successful. The param-eter a was related to gradation parameters D30, D60, and % sand.The b parameter was related to ��. The writers recommend thatinterested researchers add to the database presented when pos-sible and seek to improve the correlations. Of course the mostreliable value for �b can generally be obtained from direct testingover a range in suction values. However, for cases such as pre-liminary design or very low risk design, it may be desirable toestimate �b if Eq. �1� is to be used. In these cases, the correlationspresented herein are expected to be superior to estimates basedsimply on experience.
The unsaturated soil shear strength correlations discussed inthis paper can be used for limit equilibrium studies such as thosecommonly performed for slope stability, bearing capacity, andretaining wall stability. However, knowledge of volume changeand stress-strain behavior is required for analyses of deformation�settlement, movements� during shear loading. Knowledge ofstress-strain and volume change behavior is also needed for vali-dation and parameter determination of stress-deformation consti-tutive models for unsaturated soils.
In this study, it was observed that the volume change behaviorwas dependent on both net normal stress and soil suction. Ingeneral, the higher the value of suction, and the lower the netnormal stress, the greater the tendency of the soil to dilate asshear stresses are increased. This was attributed to the highersuction resulting in tightly bound aggregations of particles that donot shear easily, but rather tend to ride up over each other �dilate�as shear stresses are increased. The dilative behavior was morepronounced in soils with lower PI, with the higher PI soils exhib-iting volume change behavior dominated by compression exceptat the highest values of suction considered in this test series.
Acknowledgments
This material is based in part upon work supported by the Na-tional Science Foundation under Grant No. CMS-0099800. Anyopinions, finding, and conclusions or recommendations expressedin this paper are those of the writers and do not necessarily reflectthe views of the National Science Foundation.
Notation
The following symbols are used in this paper:a coefficient for hyperbolic model;b parameter for hyperbolic model related to ��;
c� effective cohesion intercept;c total cohesion, when suction exceeds zero;
D30 grain diameter corresponding to 30% passingby weight or mass;
D60 grain diameter corresponding to 60% passingby weight or mass;
Gs specific gravity;P200 percent of material passing 200 sieve;
�ua-uw� matric suction;
wopt water content at optimum conditions;NVIRONMENTAL ENGINEERING © ASCE / NOVEMBER 2008 / 1631
ASCE license or copyright; see http://pubs.asce.org/copyright
�dmax maximum dry density �kN /m3�;��n−ua� net normal stress;
� f shear stress at failure;�� effective angle of internal friction;�b angle of friction that provides increase in
strength due to suction; and* �ua−uw�-AEV.
References
Babu, S., Peter, J., Mukesh, M. D., and Gartung, E. �2005�. “Significanceof soil suction and soil water characteristic curve parameters.” Geo-tech. Test. J., 28�1�, 102–107.
Donald, I. B. �1956�. “Shear strength measurements in unsaturated non-cohesive soils with negative pore water pressure.” Proc., 2ndAustralia-New Zealand Conf. Soil Mech. Found. Eng, Christchurch,New Zealand, 200–205.
Duncan, J. M., and Chang, C. Y. �1970�. “Nonlinear analysis of stress andstrain in soils.” J. Soil Mech. and Found. Div., 96�5�, 1629–1653.
Escario, V. �1980�. “Suction controlled penetration and shear tests.”Proc., 4th Int. Conf. on Expansive Soils, Vol. 2, ASCE, Denver, 781–797.
Escario, V., and Juca, J. F. T. �1986�. “The shear strength of partly satu-rated soils.” Geotechnique, 36�3�, 453–456.
Escario, V., and Juca, J. F. T. �1989�. “Shear strength and deformation ofpartly saturated soils.” Proc., 12th Int. Conf. on Soil Mech. Found.Eng, Vol. 2, Balkema, Rio de Janeiro, 43–46.
Fredlund, D. G., and Rahardjo, H. �1993�. Soil mechanics for unsaturatedsoils, Wiley, New York.
Fredlund, D. G., Rahardjo, H., and Gan, J. K. M. �1987�. “Nonlinearity ofstrength envelope for unsaturated soils.” Proc., 6th Int. Conf. on Ex-pansive Soils, New Delhi, India, Balkema, Rotterdam, 49–54.
Fredlund, D. G., Xing, A., Fredlund, M. D., and Barbour, S. L. �1996�.“The relationship of unsaturated soil shear strength to the soil-watercharacteristic curve.” Can. Geotech. J., 33, 440–448.
Fredlund, M., Wilson, G. W., and Fredlund, D. G. �1997�. “Indirect pro-
cedures to determine unsaturated soils property functions.” Proc. of1632 / JOURNAL OF GEOTECHNICAL AND GEOENVIRONMENTAL ENGIN
Downloaded 28 Jan 2010 to 129.82.213.43. Redistribution subject to
the 50th Canadian Conf., Ottawa, 2–9.Gan, J. K.-M., Fredlund, D. G., and Rahardjo, H. �1988�. “Determination
of shear strength parameters of an unsaturated soil using the directshear test.” Can. Geotech. J., 25�3�, 500–510.
Garven, E. A., and Vanapalli, S. K. �2006�. “Evaluation of empiricalprocedures for predicting the shear strength of unsaturated soils.”Proc. 4th Int. Conf. on Unsaturated Soils, ASCE, Phoenix, Ariz.,2570–2581.
Ho, D. Y. F., and Fredlund, D. G. �1982�. “A multistage triaxial test forunsaturated soils.” Geotech. Test. J., 5�1/2�, 18–25.
Houston, S. L. �2002�. “Applied unsaturated soil mechanics.” Proc., 3rdInt. Conf. on Unsaturated Soils, Recife, Brazil, Juca, de Campos,Marinho, eds., Taylor and Francis, London, 1127–1136.
Miao, L., Liu, S., and Lai, Y. �2002�. “Research of soil-water character-istic and shear strength of Nanyang expansive soil.” Eng. Geol. (Am-sterdam), 65, 261–267.
Oloo, S. Y., and Fredlund, D. G. �1996�. “A method for determination offb for statically compacted soils.” Can. Geotech. J., 33, 272–280.
Padilla, J. M., Houston, W. N., Lawrence, C. A., Fredlund, D. G., Hous-ton, S. L., and Perez, N. �2006�. “An automated triaxial testing devicefor unsaturated soils.” Proc., 4th Int. Conf. on Unsaturated Soils,ASCE, Phoenix, Ariz., 1775–1786.
Perez-Garcia, N. �2006�. “Development of a protocol for the assessmentof unsaturated soil properties.” Ph.D. dissertation, Arizona StateUniv., Tempe, Ariz.
Satija, B. S. �1978�. “Shear behavior of partially saturated soils.” Ph.D.thesis, Indian Institute of Technology, New Delhi, India.
Thu, T. M., Rahardjo, H., and Leong, E. C. �2006�. “Effect of hysteresison shear strength envelopes from constant water content and consoli-dated drained tests.” Proc., 4th Int. Conf. on Unsaturated Soils,ASCE, Phoenix, Ariz., 1212–1222.
Vanapalli, S. K. �1994�. “Simple test procedures and their interpretationin evaluating the shear strength of an unsaturated soil.” Ph.D. thesis,Univ. of Saskatchewan, Saskatoon, Canada.
Vanapalli, S. K., and Fredlund, D. G. �2000�. “Comparison of empiricalprocedures to predict the shear strength of unsaturated soils using thesoil water characteristic curve.” Proc., Unsaturated Soils, Geo-Denver
2000, Vol. GSP 99, ASCE, 195–209.EERING © ASCE / NOVEMBER 2008
ASCE license or copyright; see http://pubs.asce.org/copyright


![Shear stress-induced pathological changes in endothelial ... · 1/7/2020 · Fluid shear stress induced [Ca2 +]i overload is force and time dependent . Shear stress is a physiological](https://static.fdocuments.in/doc/165x107/606ea5e1c71f9c48290448a9/shear-stress-induced-pathological-changes-in-endothelial-172020-fluid-shear.jpg)