AIRLINE FLIGHTS % TOTAL % EURSAM TRAFFIC PER AIRLINE IN ... · Next table shows the number of...
14
APPENDIX – D: Flight Level Occupancy in the EUR-SAM Corridor _ 2017 Next table shows the number of flights per month belonging to EUR/SAM or random/transversal traffic (Canarias FIR). The total number of flights registered in the EUR/SAM area of Canarias FIR has been 2.422 flights. Most of them are considered traffics belonging to EUR/SAM Corridor (92.5 % of total). Table 1. Global Figures of Flights – EUR/SAM Area – Canarias FIR The following table shows, for the most significant airlines in terms of registered figures, the number of flights and percentage referred to the total number of registered flights in the EUR/SAM Area – Canarias FIR during the studied period. Table 2. Global Figures per airline – Canarias FIR AUGUST 2018 % EUR/SAM 92.6% TRANSVERSAL 1.1% RANDOM 6.4% TOTAL 2422 Canarias FIR 26 2242 154 AIRLINE FLIGHTS % TOTAL % EURSAM TAP 586 24.2% 23.9% IBE 211 8.7% 7.9% AEA 168 6.9% 5.9% TOM 126 5.2% 5.2% TAM 122 5.0% 5.0% AFR 104 4.3% 3.8% DLH 82 3.4% 3.3% TCV 72 3.0% 3.0% AZU 61 2.5% 2.5% KLM 58 2.4% 2.3% TUI 54 2.2% 2.2% RAM 54 2.2% 2.2% TRAFFIC PER AIRLINE IN CANARIAS FIR
Transcript of AIRLINE FLIGHTS % TOTAL % EURSAM TRAFFIC PER AIRLINE IN ... · Next table shows the number of...

APPENDIX – D: Flight Level Occupancy in the EUR-SAM Corridor _ 2017
Next table shows the number of flights per month belonging to EUR/SAM or random/transversal traffic
(Canarias FIR). The total number of flights registered in the EUR/SAM area of Canarias FIR has been 2.422
flights. Most of them are considered traffics belonging to EUR/SAM Corridor (92.5 % of total).
Table 1. Global Figures of Flights – EUR/SAM Area – Canarias FIR
The following table shows, for the most significant airlines in terms of registered figures, the number of
flights and percentage referred to the total number of registered flights in the EUR/SAM Area – Canarias
FIR during the studied period.
Table 2. Global Figures per airline – Canarias FIR
AUGUST 2018 %
EUR/SAM 92.6%
TRANSVERSAL 1.1%
RANDOM 6.4%
TOTAL 2422
Canarias FIR
26
2242
154
AIRLINE FLIGHTS % TOTAL % EURSAM
TAP 586 24.2% 23.9%
IBE 211 8.7% 7.9%
AEA 168 6.9% 5.9%
TOM 126 5.2% 5.2%
TAM 122 5.0% 5.0%
AFR 104 4.3% 3.8%
DLH 82 3.4% 3.3%
TCV 72 3.0% 3.0%
AZU 61 2.5% 2.5%
KLM 58 2.4% 2.3%
TUI 54 2.2% 2.2%
RAM 54 2.2% 2.2%
TRAFFIC PER AIRLINE IN CANARIAS FIR
On the other hand, considering the foreseen evolution of EUR/SAM Corridor, several additional analyses
have been accomplished for each FIR:
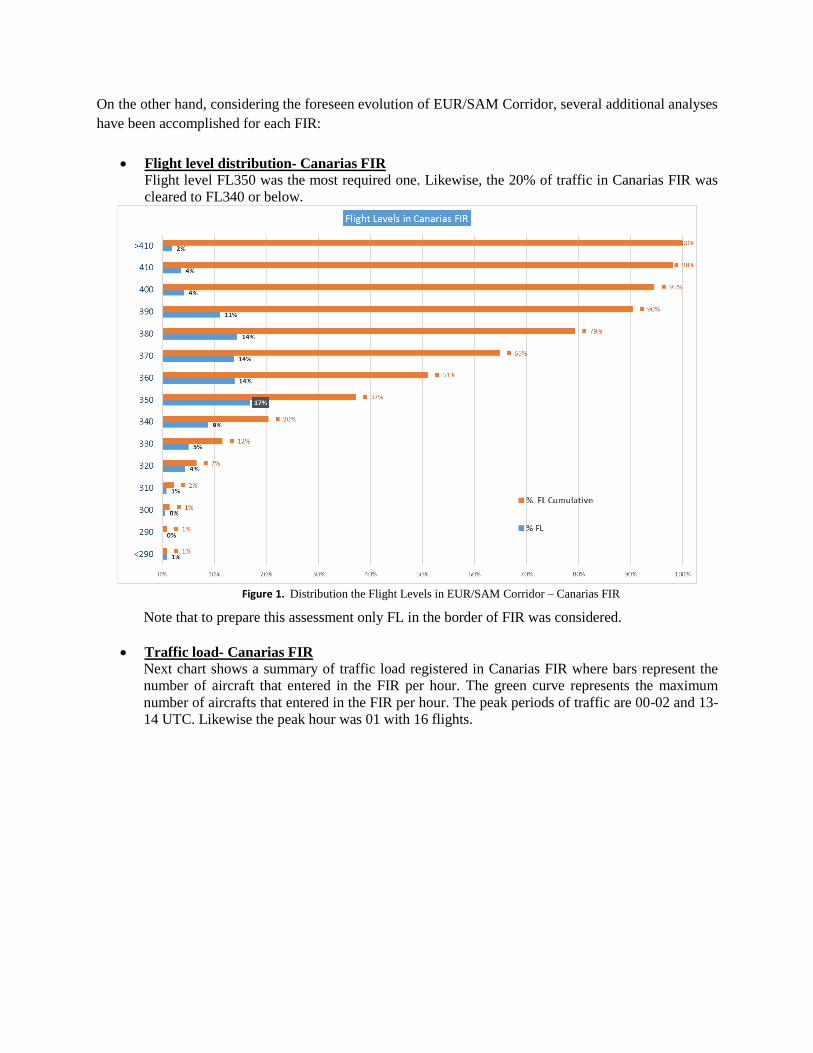
Flight level distribution- Canarias FIR Flight level FL350 was the most required one. Likewise, the 20% of traffic in Canarias FIR was
cleared to FL340 or below.
Figure 1. Distribution the Flight Levels in EUR/SAM Corridor – Canarias FIR
Note that to prepare this assessment only FL in the border of FIR was considered.
Traffic load- Canarias FIR Next chart shows a summary of traffic load registered in Canarias FIR where bars represent the
number of aircraft that entered in the FIR per hour. The green curve represents the maximum
number of aircrafts that entered in the FIR per hour. The peak periods of traffic are 00-02 and 13-
14 UTC. Likewise the peak hour was 01 with 16 flights.

Figure 2. Traffic load in EUR/SAM Corridor – Canarias FIR
Traffic distribution per ATS Route– Canarias FIR:
The following figures and tables try to sum up the operational data provided to SATMA. In
Canarias FIR the main flow is via IPERA (UN873), afterwards this traffic planned other ATS routes
depending on their origin/destination. UN741 and UN866 have also relevant figures but less than
the first one due to their unidirectional characteristic. Note that UN857 figures have already
overcome UN741 and UN866, even though it is a bidirectional route. Finally, it is remarkable that
Canarias FIR registered several “random routes” which are based on published DCT.
Table 3. Distribution per ATS Route – Canarias FIR
Figure 3. Distribution per ATS Route – Canarias FIR
TRAFFIC RANDOM UN741 UN866 UN873 UN857 TRANSVERSAL
NORTHBOUND 89 0 335 627 161 26
SOUTHBOUND 65 178 0 750 191
TOTAL 154 178 335 1377 352 26
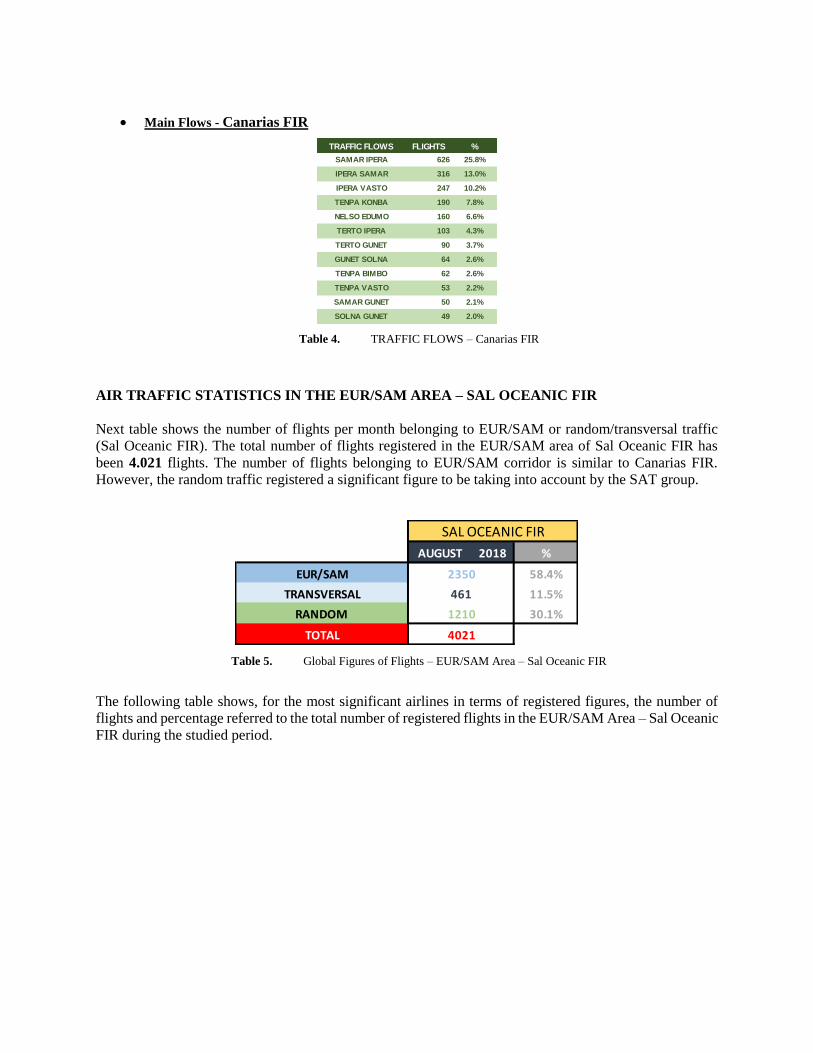
Main Flows - Canarias FIR
Table 4. TRAFFIC FLOWS – Canarias FIR
AIR TRAFFIC STATISTICS IN THE EUR/SAM AREA – SAL OCEANIC FIR
Next table shows the number of flights per month belonging to EUR/SAM or random/transversal traffic
(Sal Oceanic FIR). The total number of flights registered in the EUR/SAM area of Sal Oceanic FIR has
been 4.021 flights. The number of flights belonging to EUR/SAM corridor is similar to Canarias FIR.
However, the random traffic registered a significant figure to be taking into account by the SAT group.
Table 5. Global Figures of Flights – EUR/SAM Area – Sal Oceanic FIR
The following table shows, for the most significant airlines in terms of registered figures, the number of
flights and percentage referred to the total number of registered flights in the EUR/SAM Area – Sal Oceanic
FIR during the studied period.
TRAFFIC FLOWS FLIGHTS %
SAMAR IPERA 626 25.8%
IPERA SAMAR 316 13.0%
IPERA VASTO 247 10.2%
TENPA KONBA 190 7.8%
NELSO EDUMO 160 6.6%
TERTO IPERA 103 4.3%
TERTO GUNET 90 3.7%
GUNET SOLNA 64 2.6%
TENPA BIMBO 62 2.6%
TENPA VASTO 53 2.2%
SAMAR GUNET 50 2.1%
SOLNA GUNET 49 2.0%
AUGUST 2018 %
EUR/SAM 58.4%
TRANSVERSAL 11.5%
RANDOM 30.1%
TOTAL
SAL OCEANIC FIR
461
2350
1210
4021
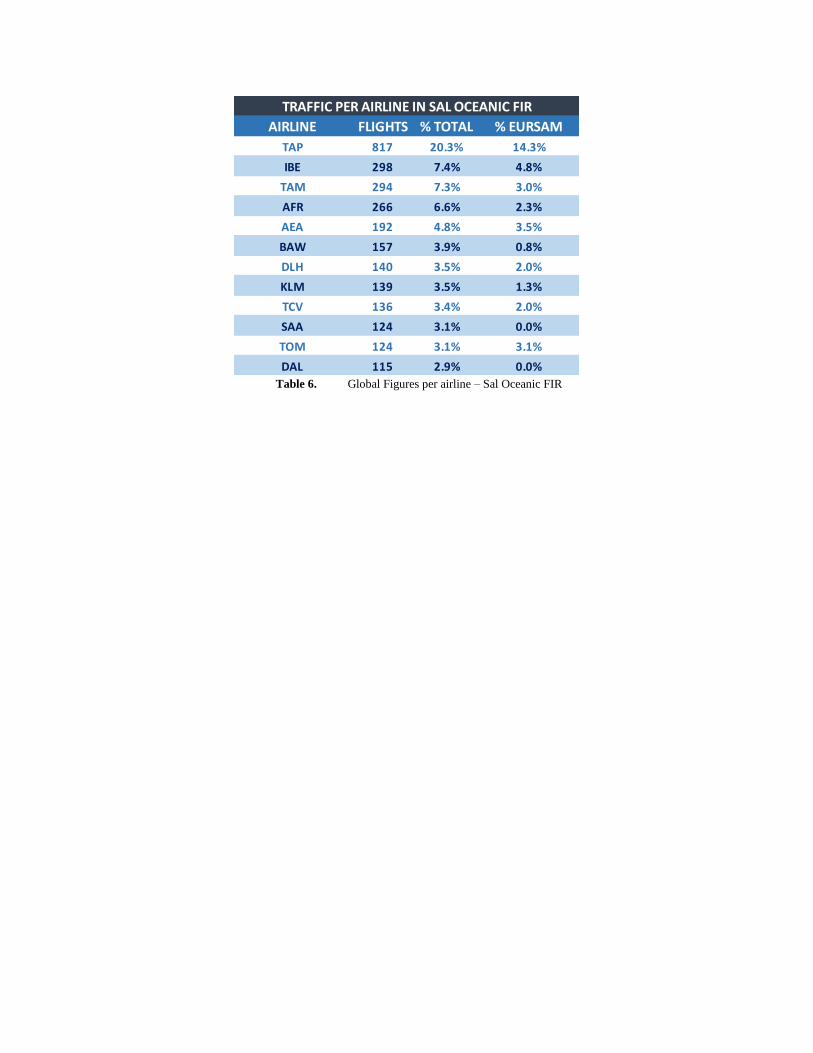
Table 6. Global Figures per airline – Sal Oceanic FIR
AIRLINE FLIGHTS % TOTAL % EURSAM
TAP 817 20.3% 14.3%
IBE 298 7.4% 4.8%
TAM 294 7.3% 3.0%
AFR 266 6.6% 2.3%
AEA 192 4.8% 3.5%
BAW 157 3.9% 0.8%
DLH 140 3.5% 2.0%
KLM 139 3.5% 1.3%
TCV 136 3.4% 2.0%
SAA 124 3.1% 0.0%
TOM 124 3.1% 3.1%
DAL 115 2.9% 0.0%
TRAFFIC PER AIRLINE IN SAL OCEANIC FIR

On the other hand, considering the foreseen evolution of EUR/SAM Corridor, several additional analyses
have been accomplished for each FIR:
Flight level distribution – Sal Oceanic FIR Flight level FL350 and FL370 were the most required one. Likewise, the 27% of traffic in SAL
Oceanic FIR was cleared to FL340 or below.
Figure 4. Distribution the Flight Levels in EUR/SAM Corridor – Sal Oceanic FIR
Note that to prepare this assessment only FL in the border of FIR was considered.
Traffic load – Sal Oceanic FIR Next chart shows a summary of traffic load registered in Sal Oceanic FIR where bars represent the
number of aircraft that entered in the FIR per hour. The green curve represents the maximum
number of aircrafts that entered in the FIR per hour. The peak periods of traffic are 23-03 and 13-
14 UTC. Likewise the peak hour was 01 with 20 flights.
Figure 5. Traffic load in EUR/SAM Corridor – Sal Oceanic FIR
Traffic distribution per ATS Route– Sal Ocenacic FIR:
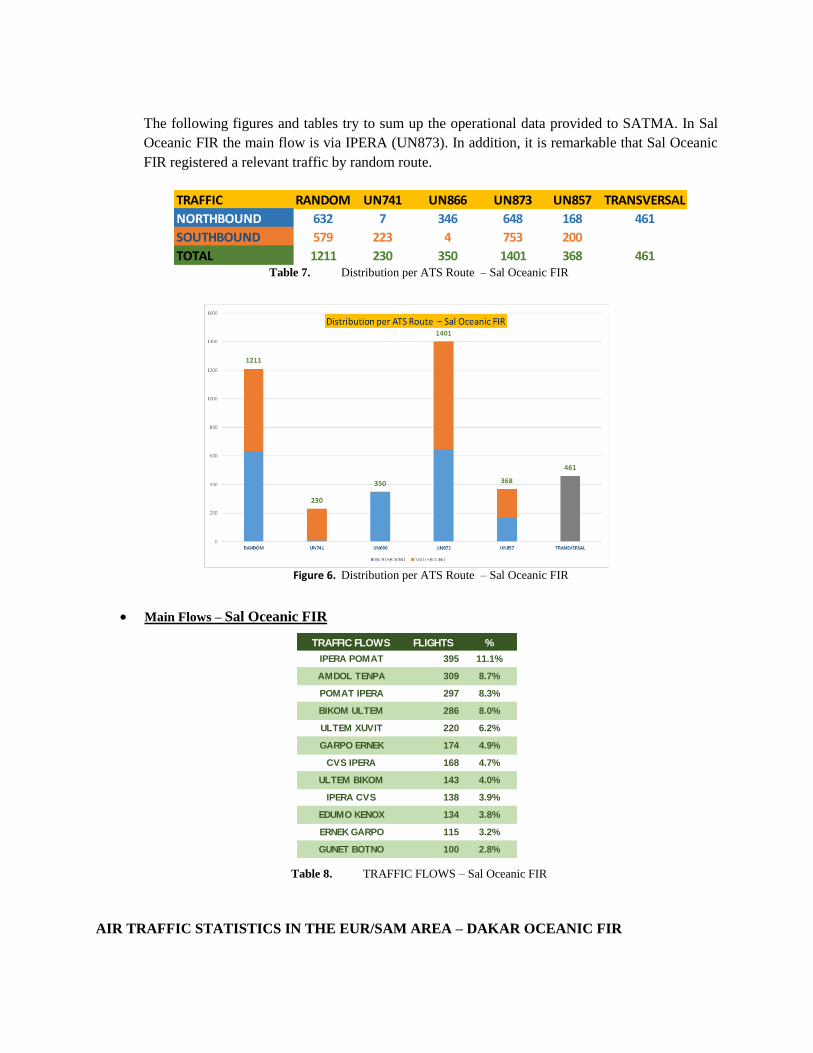
The following figures and tables try to sum up the operational data provided to SATMA. In Sal
Oceanic FIR the main flow is via IPERA (UN873). In addition, it is remarkable that Sal Oceanic
FIR registered a relevant traffic by random route.
Table 7. Distribution per ATS Route – Sal Oceanic FIR
Figure 6. Distribution per ATS Route – Sal Oceanic FIR
Main Flows – Sal Oceanic FIR
Table 8. TRAFFIC FLOWS – Sal Oceanic FIR
AIR TRAFFIC STATISTICS IN THE EUR/SAM AREA – DAKAR OCEANIC FIR
TRAFFIC RANDOM UN741 UN866 UN873 UN857 TRANSVERSAL
NORTHBOUND 632 7 346 648 168 461
SOUTHBOUND 579 223 4 753 200
TOTAL 1211 230 350 1401 368 461
TRAFFIC FLOWS FLIGHTS %
IPERA POMAT 395 11.1%
AMDOL TENPA 309 8.7%
POMAT IPERA 297 8.3%
BIKOM ULTEM 286 8.0%
ULTEM XUVIT 220 6.2%
GARPO ERNEK 174 4.9%
CVS IPERA 168 4.7%
ULTEM BIKOM 143 4.0%
IPERA CVS 138 3.9%
EDUMO KENOX 134 3.8%
ERNEK GARPO 115 3.2%
GUNET BOTNO 100 2.8%
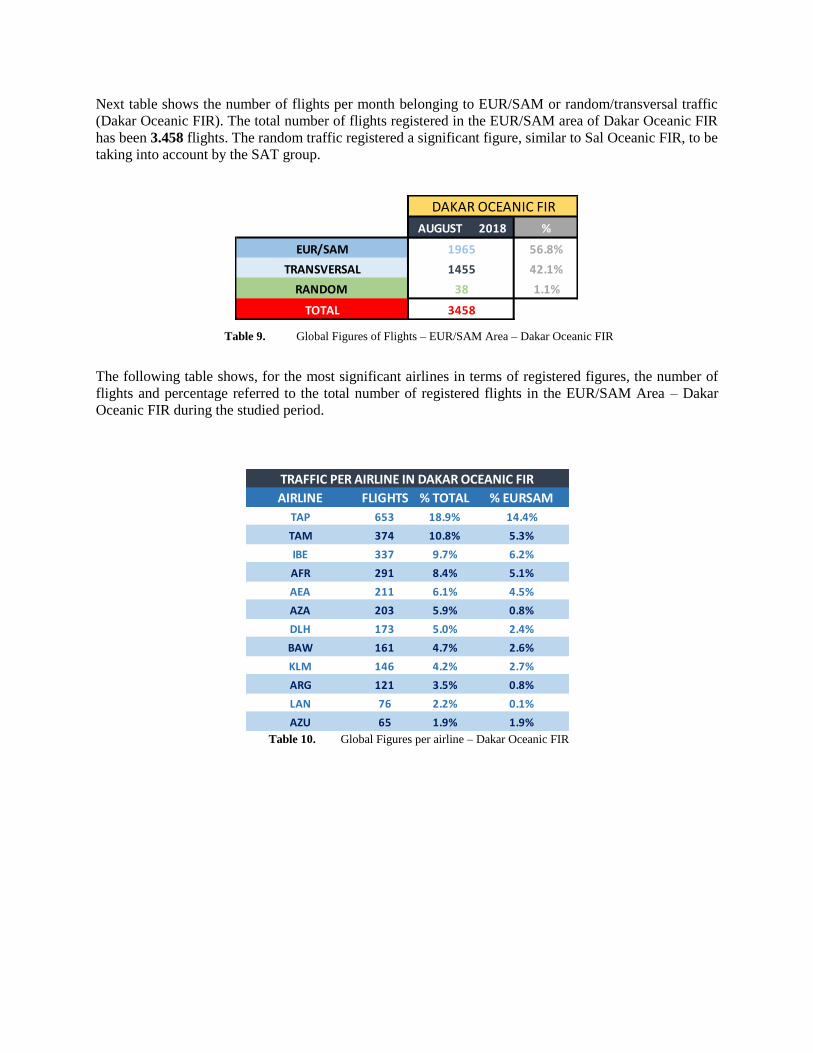
Next table shows the number of flights per month belonging to EUR/SAM or random/transversal traffic
(Dakar Oceanic FIR). The total number of flights registered in the EUR/SAM area of Dakar Oceanic FIR
has been 3.458 flights. The random traffic registered a significant figure, similar to Sal Oceanic FIR, to be
taking into account by the SAT group.
Table 9. Global Figures of Flights – EUR/SAM Area – Dakar Oceanic FIR
The following table shows, for the most significant airlines in terms of registered figures, the number of
flights and percentage referred to the total number of registered flights in the EUR/SAM Area – Dakar
Oceanic FIR during the studied period.
Table 10. Global Figures per airline – Dakar Oceanic FIR
AUGUST 2018 %
EUR/SAM 56.8%
TRANSVERSAL 42.1%
RANDOM 1.1%
TOTAL
DAKAR OCEANIC FIR
1455
1965
38
3458
AIRLINE FLIGHTS % TOTAL % EURSAM
TAP 653 18.9% 14.4%
TAM 374 10.8% 5.3%
IBE 337 9.7% 6.2%
AFR 291 8.4% 5.1%
AEA 211 6.1% 4.5%
AZA 203 5.9% 0.8%
DLH 173 5.0% 2.4%
BAW 161 4.7% 2.6%
KLM 146 4.2% 2.7%
ARG 121 3.5% 0.8%
LAN 76 2.2% 0.1%
AZU 65 1.9% 1.9%
TRAFFIC PER AIRLINE IN DAKAR OCEANIC FIR
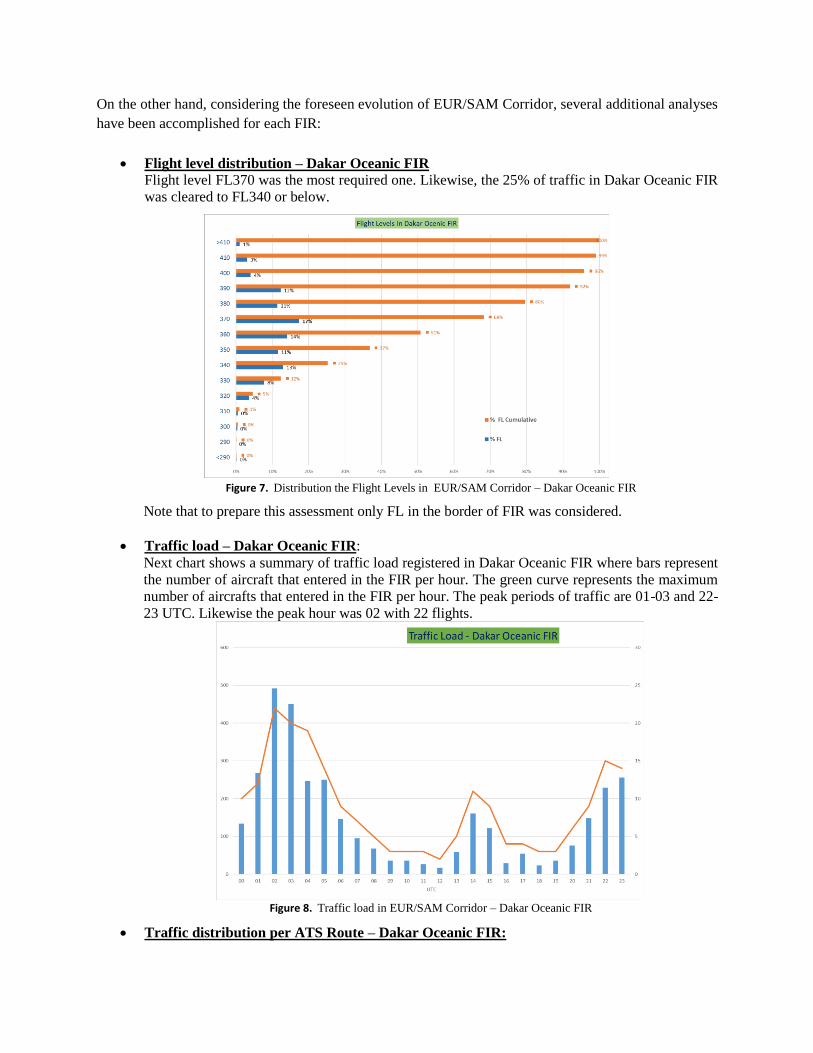
On the other hand, considering the foreseen evolution of EUR/SAM Corridor, several additional analyses
have been accomplished for each FIR:
Flight level distribution – Dakar Oceanic FIR Flight level FL370 was the most required one. Likewise, the 25% of traffic in Dakar Oceanic FIR
was cleared to FL340 or below.
Figure 7. Distribution the Flight Levels in EUR/SAM Corridor – Dakar Oceanic FIR
Note that to prepare this assessment only FL in the border of FIR was considered.
Traffic load – Dakar Oceanic FIR:
Next chart shows a summary of traffic load registered in Dakar Oceanic FIR where bars represent
the number of aircraft that entered in the FIR per hour. The green curve represents the maximum
number of aircrafts that entered in the FIR per hour. The peak periods of traffic are 01-03 and 22-
23 UTC. Likewise the peak hour was 02 with 22 flights.
Figure 8. Traffic load in EUR/SAM Corridor – Dakar Oceanic FIR
Traffic distribution per ATS Route – Dakar Oceanic FIR:
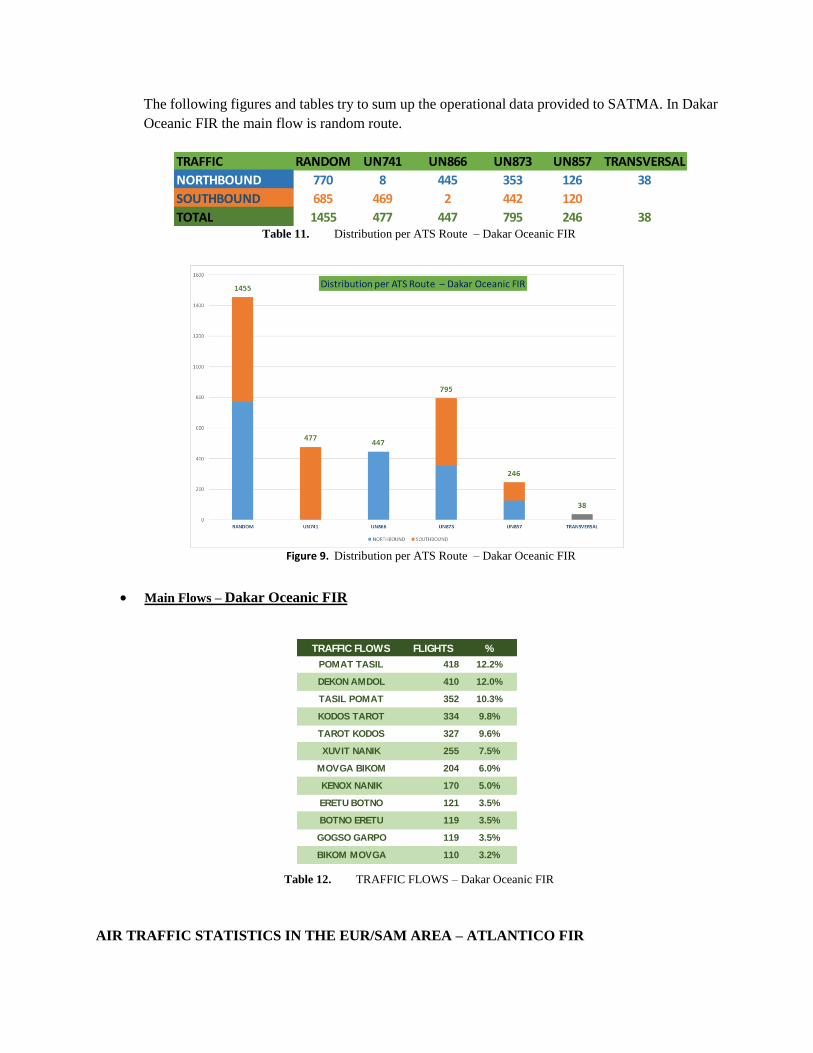
The following figures and tables try to sum up the operational data provided to SATMA. In Dakar
Oceanic FIR the main flow is random route.
Table 11. Distribution per ATS Route – Dakar Oceanic FIR
Figure 9. Distribution per ATS Route – Dakar Oceanic FIR
Main Flows – Dakar Oceanic FIR
Table 12. TRAFFIC FLOWS – Dakar Oceanic FIR
AIR TRAFFIC STATISTICS IN THE EUR/SAM AREA – ATLANTICO FIR
TRAFFIC RANDOM UN741 UN866 UN873 UN857 TRANSVERSAL
NORTHBOUND 770 8 445 353 126 38
SOUTHBOUND 685 469 2 442 120
TOTAL 1455 477 447 795 246 38
TRAFFIC FLOWS FLIGHTS %
POMAT TASIL 418 12.2%
DEKON AMDOL 410 12.0%
TASIL POMAT 352 10.3%
KODOS TAROT 334 9.8%
TAROT KODOS 327 9.6%
XUVIT NANIK 255 7.5%
MOVGA BIKOM 204 6.0%
KENOX NANIK 170 5.0%
ERETU BOTNO 121 3.5%
BOTNO ERETU 119 3.5%
GOGSO GARPO 119 3.5%
BIKOM MOVGA 110 3.2%

Next table shows the number of flights per month belonging to EUR/SAM or random/transversal traffic
(Atlantico FIR). The total number of flights registered in the EUR/SAM area of Atlantico FIR has been
3.387 flights. Eastern –Western flows are based on ATS Routes, that afterwards entry/exit in random areas
Dakar Oceanic FIR.
Table 13. Global Figures of Flights – EUR/SAM Area – Atlantico FIR
The following table shows, for the most significant airlines in terms of registered figures, the number of
flights and percentage referred to the total number of registered flights in the EUR/SAM Area – Atlantico
FIR during the studied period.
Table 14. Global Figures per airline – Atlantico FIR
AUGUST 2018 %
EUR/SAM 54.8%
TRANSVERSAL 1.2%
EASTERN-WESTERN 40.5%
RANDOM 3.4%
TOTAL
1373
ATLANTICO FIR
42
1856
116
3387
AIRLINE FLIGHTS % TOTAL % EURSAM
TAP 653 18.9% 14.4%
TAM 374 10.8% 5.3%
IBE 337 9.7% 6.2%
AFR 291 8.4% 5.1%
AEA 211 6.1% 4.5%
AZA 203 5.9% 0.8%
DLH 173 5.0% 2.4%
BAW 161 4.7% 2.6%
KLM 146 4.2% 2.7%
ARG 121 3.5% 0.8%
LAN 76 2.2% 0.1%
AZU 65 1.9% 1.9%
TRAFFIC PER AIRLINE IN DAKAR OCEANIC FIR
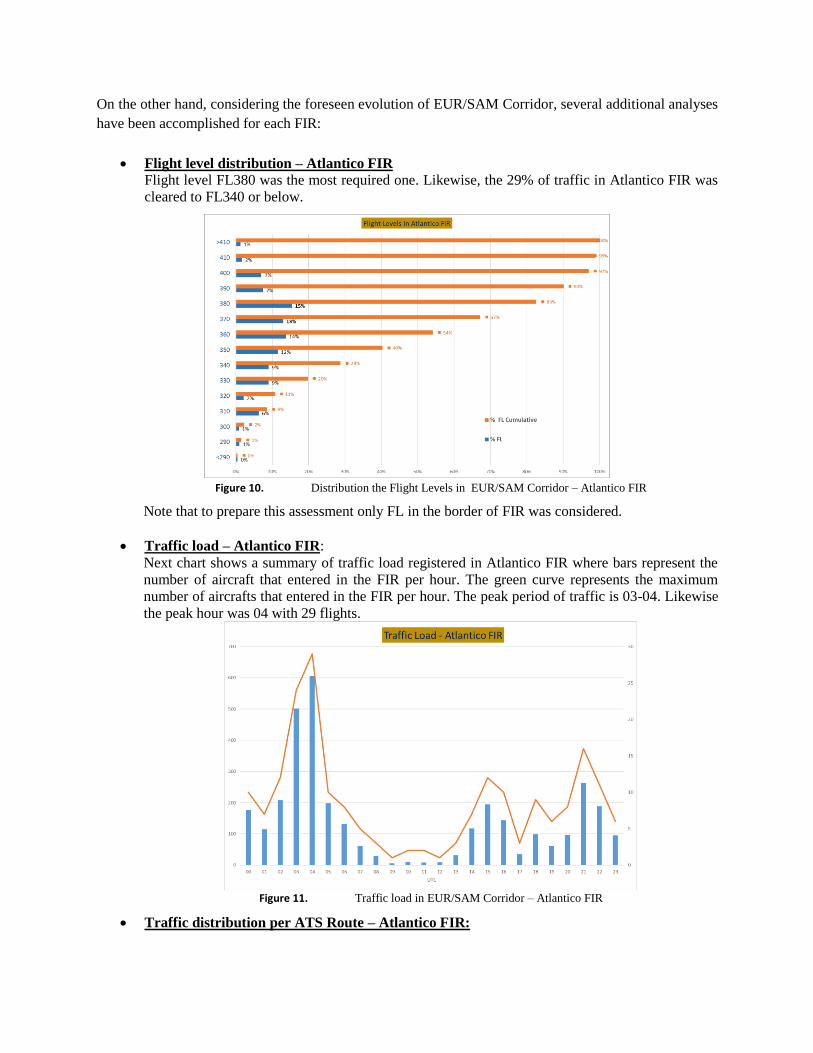
On the other hand, considering the foreseen evolution of EUR/SAM Corridor, several additional analyses
have been accomplished for each FIR:
Flight level distribution – Atlantico FIR Flight level FL380 was the most required one. Likewise, the 29% of traffic in Atlantico FIR was
cleared to FL340 or below.
Figure 10. Distribution the Flight Levels in EUR/SAM Corridor – Atlantico FIR
Note that to prepare this assessment only FL in the border of FIR was considered.
Traffic load – Atlantico FIR:
Next chart shows a summary of traffic load registered in Atlantico FIR where bars represent the
number of aircraft that entered in the FIR per hour. The green curve represents the maximum
number of aircrafts that entered in the FIR per hour. The peak period of traffic is 03-04. Likewise
the peak hour was 04 with 29 flights.
Figure 11. Traffic load in EUR/SAM Corridor – Atlantico FIR
Traffic distribution per ATS Route – Atlantico FIR:

The following figures and tables try to sum up the operational data provided to SATMA. In
Atlantico FIR the main flow is via IPERA (UN873). Note that western –eastern flow cover a huge
area with several routes.
Table 15. Distribution per ATS Route – Atlantico FIR
Figure 12. Distribution per ATS Route – Atlantico FIR
Main Flows – Atlantico FIR
Table 16. TRAFFIC FLOWS – Atlantico FIR
EASTERN-
WESTERNUN741 UN866 UN873 UN857 TRANSVERSAL RANDOM
NORTHBOUND 694 362 371 117 42 67
SOUTHBOUND 679 456 451 99 49
TOTAL 1373 456 362 822 216 42 116
TRAFFIC
TRAFFIC FLOWS FLIGHTS %
NANIK JOBER 450 13.5%
TASIL VUNOK 445 13.4%
VUNOK TASIL 370 11.1%
MAGNO DEKON 361 10.8%
BUTAP CALVO 280 8.4%
DAKAP MOVGA 277 8.3%
CALVO BUTAP 219 6.6%
BUTAP VURBI 115 3.5%
ERETU UTRAM 95 2.9%
UTRAM ERETU 83 2.5%
MOVGA ESLEL 73 2.2%
MOVGA DAKAP 68 2.0%