Air Quality: National Air Pollution Control Programme · The National Air Pollution Control...
66
EN 1 EN Air Quality: National Air Pollution Control Programme March 2019
Transcript of Air Quality: National Air Pollution Control Programme · The National Air Pollution Control...

EN 1
EN
Air Quality: National Air Pollution Control Programme
March 2019

EN 2
EN
The National Air Pollution Control Programme (NAPCP) is a UK wide document. It sets out measures and technical analysis which demonstrate how the legally binding 2020 and 2030 emission reduction commitments (ERCs) for 5 damaging pollutants (nitrogen oxides, ammonia, non-methane volatile organic compounds, particulate matter and sulphur dioxide) can be met across the UK.
© Crown copyright 2019
You may re-use this information (excluding logos) free of charge in any format or medium, under the terms of the Open Government Licence v.3. To view this licence visit www.nationalarchives.gov.uk/doc/open-government-licence/version/3/ or email [email protected]
This publication is available at www.gov.uk/government/publications
Any enquiries regarding this publication should be sent to us at
PB 14571
www.gov.uk/defra

EN 3 EN
EN
ANNEX
Common format for the national air pollution control programme pursuant to Article 6 of Directive (EU) 2016/2284
1. FIELD DESCRIPTIONS All fields in this common format that are marked (M) are mandatory and those marked (O) are optional.
2. COMMON FORMAT 2.1 Title of the programme, contact information and websites
2.1.1 Title of the programme, contact information and websites (M) Title of the programme: UK National Air Pollution Control Programme Date: 14/02/2019 Member State: United Kingdom Name of competent authority responsible for drawing up the programme: Department for Environment, Food and Rural Affairs Telephone number of responsible service: See Citizen Space Email address of responsible service: See Citizen Space Link to website where the programme is published: See Citizen Space

EN 4 EN
Link(s) to website(s) on the consultation(s) on the programme: See Citizen Space 2.2 Executive summary (O) The executive summary can also be a standalone document (ideally of no more than 10 pages). It should be a concise summary of sections 2.3 to 2.8. Where possible, consider the use of graphics to illustrate the executive summary.
2.2.1 The national air quality and pollution policy framework Policy priorities and their relationship to priorities set in other relevant policy areas:
Responsibilities attributed to national, regional and local authorities:
2.2.2 Progress made since 2005 by current policies and measures in reducing emissions and improving air quality Achieved emission reductions:
Progress against air quality objectives:
Current transboundary impact of domestic emission sources:
2.2.3 Projected further evolution to 2030 assuming no change to already adopted policies and measures (PaMs) Projected emissions and emission reductions (With Measures (WM) scenario):
Projected impact on improving air quality (WM scenario):
Uncertainties:

EN 5 EN
2.2.4 Policy options considered in order to comply with the emission reduction commitments for 2020 and 2030, intermediate emission levels for 2025
Main sets of policy options considered:
2.2.5 Summary of policies and measures selected for adoption by sector, including a timetable for their adoption, implementation and review and the competent authorities responsible
Sector affected
Policies and Measures (PaMs)
Selected PaMs Timetable for implementation of the selected PaMs:
Responsible competent authorit(y)(ies) for implementation and enforcement of the selected PaMs (type and name):
Timetable for review of the selected PaMs:
Energy supply:
Energy consumption:
Transport:
Industrial processes:
Agriculture:
Waste management/waste:

EN 6 EN
Cross-cutting:
Other (to be specified):
2.2.6 Coherence An assessment of how the selected PaMs ensure coherence with plans and programmes set up in other relevant policy areas:
2.2.7 Projected combined impacts of the policies and measures (‘With Additional Measures’ - WAM) on emission reductions, air quality in own territories and neighbouring Member States and the environment, and the associated uncertainties
Projected attainment of emission reduction commitments (WAM):
Use of flexibilities (where relevant):
Projected improvement in air quality (WAM):
Projected impacts on the environment (WAM):
Methodologies and uncertainties:
2.3 The national air quality and pollution policy framework
2.3.1 Policy priorities and their relationship to priorities set in other relevant policy areas

EN 7 EN
The national emission reduction commitments compared with 2005 base year (in %) (M):
SO2 NOx NMVOC NH3 PM2.5
2020-2029 (M): 59% 55% 32% 8% 30%
From 2030 (M): 88% 73% 39% 16% 46%
The air quality priorities: national policy priorities related to EU or national air quality objectives (incl. limit values and target values, and exposure concentration obligations) (M): Reference can also be made to recommended air quality objectives by the WHO.
The UK air quality framework is derived from a mixture of domestic, EU and international legislation and consists of three main strands:
1) Legislation regulating total national emissions of air pollutants – the UK is bound by both EU law (the National Emission Ceilings Directive) and international law (the Gothenburg Protocol to the UNECE Convention on Long-range Transboundary Air Pollution);
2) Legislation regulating concentrations of pollutants in ambient air
3) Legislation regulating emissions from specific sources such as legislation implementing the Industrial Emissions Directive, Medium Combustion Plant Directive, and the Clean Air Act.
Directive 2008/50/EC of 21 May 2008, on ambient air quality and cleaner air for Europe sets objectives for the following pollutants; sulphur dioxide, nitrogen dioxides, particulate matter (as PM10 and PM2.5), lead, benzene, carbon monoxide and ozone.
Directive 2004/107/EC of 15th December 2004, relating to arsenic, cadmium, mercury, nickel and polycyclic aromatic hydrocarbons in ambient air, covers the four elements cadmium, arsenic, nickel and mercury, together with polycyclic aromatic hydrocarbons (PAH) including benzo[a]pyrene.
The UK Air Quality Strategy

EN 8 EN
The Environment Act 1995 required that a National Air Quality Strategy be published, containing policies for assessment and management of air quality. The Air Quality Strategy for England, Scotland, Wales and Northern Ireland was first published in March 1997. The overall objectives of the Strategy are to:
(a) Map out future ambient air quality policy in the United Kingdom in the medium term; (b) Provide best practicable protection to human health by setting health-based
objectives for air pollutants; (c) Contribute to the protection of the natural environment through objectives for the
protection of vegetation and ecosystems; (d) Describe current and future levels of air pollution; (e) Establish a framework to help identify what we all can do to improve air quality.
The Strategy has established objectives for eight key air pollutants, based on the best available medical and scientific understanding of their effects on health, as well as taking into account relevant developments in Europe and the World Health Organisation. These Air Quality Objectives are at least as stringent as the limit values of the relevant EU Directives – in some cases, more so. The most recent review of the Strategy was carried out in 2007.
England’s Clean Air Strategy
In May 2018, Defra launched the Clean Air Strategy as a consultation document. The Strategy sets out a range of initiatives in England that will help reduce air pollution, providing healthier air to breathe, enhancing the economy and protecting nature. The Government consulted over the summer of 2018 on the key actions proposed. The CAS highlights action to be taken to reduce emissions across all sectors, including transport, the home, farming, and industrial sources. The consultation CAS can be found at https://consult.defra.gov.uk/environmental-quality/clean-air-strategy-consultation/user_uploads/clean-air-strategy-2018-consultation.pdf

EN 9 EN
In January 2019 Defra published the final Clean Air Strategy, which reflects the extensive comments received during the consultation process. The final CAS additionally sets out proposals to halve the population living in areas with concentrations of fine particulate matter above WHO guideline levels (10 μg/m3) by 2025. The Final Clean Air Strategy for England can be found at https://www.gov.uk/government/publications/clean-air-strategy-2019
Cleaner Air for Scotland
In November 2015, the Scottish Government published ‘Cleaner Air for Scotland – The Road to a Healthier Future’ (CAFS, available at https://www.gov.scot/publications/cleaner-air-scotland-road-healthier-future/), Scotland’s first separate air quality strategy. CAFS sets out in detail how Scotland intends to deliver further air quality improvements over the coming years.
CAFS sets out a national approach to improving air quality. The strategy contains 40 key actions within six policy areas – transport, health, climate change, legislation, placemaking and communications. CAFS also introduces two important new policy initiatives, the National Modelling Framework (NMF) and the National Low Emission Framework (NLEF).
The NMF promotes a standard approach to evaluating and assessing air quality, providing evidence to support the actions and decision making process around land use and traffic management to improve local air quality. The NMF consists of two elements, a local modelling approach and a regional modelling approach. The local approach involves building detailed air quality and traffic models for Scotland’s four largest cities – Aberdeen, Dundee, Edinburgh and Glasgow. The regional approach draws on air quality modelling methodology adopted in the Netherlands and reflects the fact that land use and transport planning decisions made across local authority boundaries can have implications for local air quality. The regional approach is focused on the strategic development planning authority areas surrounding the four cities.

EN 10 EN
The outputs from the NMF will be used to inform the NLEF. This is designed to enable local authorities to appraise, justify the business case for and implement a range of transport related policy interventions to improve local air quality.
Since CAFS was published, the Scottish Government has announced plans to establish Scotland’s first Low Emission Zone (LEZ) by the end of 2018, in Glasgow. This will be followed by further LEZs in Aberdeen, Dundee and Edinburgh by 2020, and in all remaining local Air Quality Management Areas by 2023, where appraisal suggests such an approach would be appropriate.
The second CAFS annual progress report was published in August 2018 and summarises progress on delivering the actions.
In November 2018 the Scottish Government announced a comprehensive independently led review of CAFS will be undertaken, to be completed by autumn 2019.
Clean Air Wales
The Welsh Government is committed to building healthier communities and better environments. Clean air has a central role in creating the right conditions for better health, well-being and greater physical activity in Wales. In September 2017, the Welsh Government published their national strategy: ‘Prosperity for All’, available at https://gov.wales/docs/strategies/170919-prosperity-for-all-en.pdf This document sets out a cross-Government commitment to reducing emissions and delivering vital improvements in air quality through planning, infrastructure, regulation, and health communication measures.
The Welsh Government provides the strategic direction for air policy in Wales, which is framed within a complex set of regulatory and operational responsibilities.
The Welsh Government in their Well-being of Future Generations (Wales) Act 2015 (WFG Act) has established average population exposure to nitrogen dioxide as one of the Welsh

EN 11 EN
Government national indicators which are used to measure progress towards well-being goals in Wales. Regulations made under the WFG Act require public services boards to consider air quality when carrying out their statutory assessments of local well-being under the Act.
The Environment (Wales) Act 2016 sets out the “sustainable management of natural resources” (SMNR). SMNR means using natural resources in a way and at a rate that promotes the achievement of the objective to maintain and enhance the resilience of ecosystems and the benefits they provide, and that, in doing so, meets the needs of present generations without compromising the ability of future generations to meet their needs. The definition of “natural resources” includes air. The Act sets out a framework for the delivery of SMNR, which includes a statutory evidence base: The State of Natural Resources Report published by Natural Resources Wales in 2016 (available at https://naturalresources.wales/evidence-and-data/research-and-reports/the-state-of-natural-resources-report-assessment-of-the-sustainable-management-of-natural-resources/?lang=en), and a statutory Natural Resources Policy which was published in August 2017 (available at https://gov.wales/topics/environmentcountryside/consmanagement/natural-resources-management/natural-resources-policy/?lang=en).
The Welsh Government Natural Resources Policy sets out the challenges and opportunities for managing Wales’ natural resources sustainably, which includes reducing pollution levels in air and enhancing air quality. Actions for air quality include taking practical steps to improve air quality across Wales, not just in the most polluted hotspots but across Wales. This will require a mix of action to address pollution from traffic and other sources and to improve the ability of the natural environment to reduce public exposure to air pollution through intelligent tree planting and better access to green infrastructure.
In order to be effective in tackling air pollution, the Welsh Government believe it is essential to take a cross-Government approach. To achieve this, the Welsh Government established a cross-Government Clean Air Wales Programme during summer 2018 to

EN 12 EN
reduce the burden of poor air quality on human health and the natural environment. In the nearer term, it will support delivery of actions required to comply with our European and domestic legislative air quality obligations.
This programme is considering evidence and developing and implementing actions required across Government Departments including environment, health, education, Decarbonisation, transport, local government, planning, agriculture and industry to achieve Clean Air for Wales.
For example, a focus has been placed on measures to reduce atmospheric ammonia and fine particulate matter emissions, in line with the requirements of the National Emissions Ceiling Directive. Such measures should be cost-effective and based on specific information and data, taking account of scientific progress and previous measures undertaken by Member States. In addition, the Welsh Government issued guidance with Public Health Wales to the NHS. This acknowledges that the NHS in Wales makes a contribution at local, regional and national levels to dealing with air pollution risks. The guidance includes actions to support the assessment and mitigation of air pollution and associated health risks. It provides information on behaviour change, using the planning system, improving environmental sustainability, and managing public health risks.
Any future targets need to be underpinned by evidence in the context of Wales to ensure they deliver the most effective change, supporting the delivery of our well-being goals. Sources of particulate matter comprise of local primary emissions direct to the atmosphere and secondary particles formed by chemical reactions in the air. Particulate matter can also travel large distances over national boundaries, with impacts occurring far from the original source. The Welsh Government has committed to consider the WHO guideline levels along with existing evidence across Wales to assess the practical aspects of achieving improvements in ambient concentrations.
A key future action for the Programme is the development of a Clean Air Plan for Wales, which the Welsh Government intends consult on and publish in 2019. The Clean Air Plan for Wales will include of range of measures to support aspirations for clean air in Wales. The Programme will build on existing cross-Government work to reduce air pollution. For

EN 13 EN
example, in December 2018, the Welsh Government published Planning Policy Wales (PPW). This is the Welsh Government’s main planning policy document, which has been completely restructured and rewritten in the context of the Well-being of Future Generations Act.
Air quality and soundscape are addressed in the new PPW as a key component of the natural and built environment, placing the issues on an equal footing with other objectives such as housing, transport and economic development. PPW recognises the importance of air quality and appropriate soundscapes to the health and well-being of people and the environment. It is expected that the new PPW will ensure long-term approaches are taken to prevent creation of new problems or worsening of existing issues. It will also seek to encourage integrated solutions which aim to reduce average levels of airborne pollution. The Welsh Government will produce further guidance for local planning authorities, specifically on air quality and soundscape, within this National Assembly for Wales term.
The Welsh Government plan to supplement the existing CoGAP to include further guidance on ammonia reductions taking into account the UNECE Framework Code for Good Agricultural Practice for Reducing Ammonia Emissions on 1 April 2019.
Northern Ireland The Northern Ireland Executive’s draft Programme for Government includes a supporting indicator on air quality, based on monitored levels of roadside nitrogen dioxide across Northern Ireland. One of the key measures in the Delivery Plan for this indicator is the preparation of an Air Quality Strategy for Northern Ireland. The Strategy examines the evidence base for air pollution on a sectoral basis (e.g. transport, household emissions, industry and agriculture) and puts forward policy proposals for consideration in tackling the sources of pollution in these sectors. The Strategy also includes a comprehensive review of current air quality policy and legislation in Northern Ireland. It is planned to launch the Strategy for public consultation in 2019. Northern Ireland has provided input into the UK’s national Air Quality Plan for nitrogen dioxide, and this sets out measures that are being planned or have been taken in Northern Ireland to reduce emissions of nitrogen dioxide. This includes, for example, the

EN 14 EN
Belfast Rapid Transit (‘Glider’) system, which became operational in September 2018, and the continuing expansion of the Park and Ride Programme, which provides suburban and rural commuters with high quality public transport access to Belfast city centre, from specially designated car parks. These measures, alongside the promotion of walking, cycling and the introduction of charging infrastructure for electric vehicles have been designed to decrease reliance on conventional petrol and diesel cars, encouraging modal shift to more sustainable forms of transport. The Department of Agriculture, Environment and Rural Affairs (DAERA) has set up an Project Board on Ammonia Reduction which is developing a comprehensive approach on how best to achieved tangible and sustained reductions in ammonia emissions, including responding to the recommendations of an annex to the Sustainable Agricultural Land Management Strategy report ‘Making Ammonia Visible’. The Project Board is proposing to consult on the draft Ammonia Action plan, which is scheduled for consultation during 2019. A Code of Good Agricultural Practice on Ammonia is being prepared for Northern Ireland and will be published during 2019. The Project Board’s work is supported by a recently commissioned research programme funded by DAERA and led by the Agri-Food Biosciences Institute, to expand the current evidence base on ammonia and provide further information on emissions, concentration levels, emissions factors and mitigation measures.
2017 UK Plan for Tackling Roadside Nitrogen Dioxide Concentations
In July 2017, government published the UK Plan for Tackling Roadside Nitrogen Dioxide Concentrations, setting out how we will achieve compliance in the shortest possible time, supported by a £3.5 billion investment into air quality and cleaner transport.
Although this Plan deals with achieving ambient air quality objectives with a primary focus on local issues, the actions being taken to deliver this plan will reduce emissions and contribute to achieving our national ERCs. The documents of this plan, setting out details including expected dates of compliance, can be found at the following link: https://www.gov.uk/government/publications/air-quality-plan-for-nitrogen-dioxide-no2-
EN 15 EN
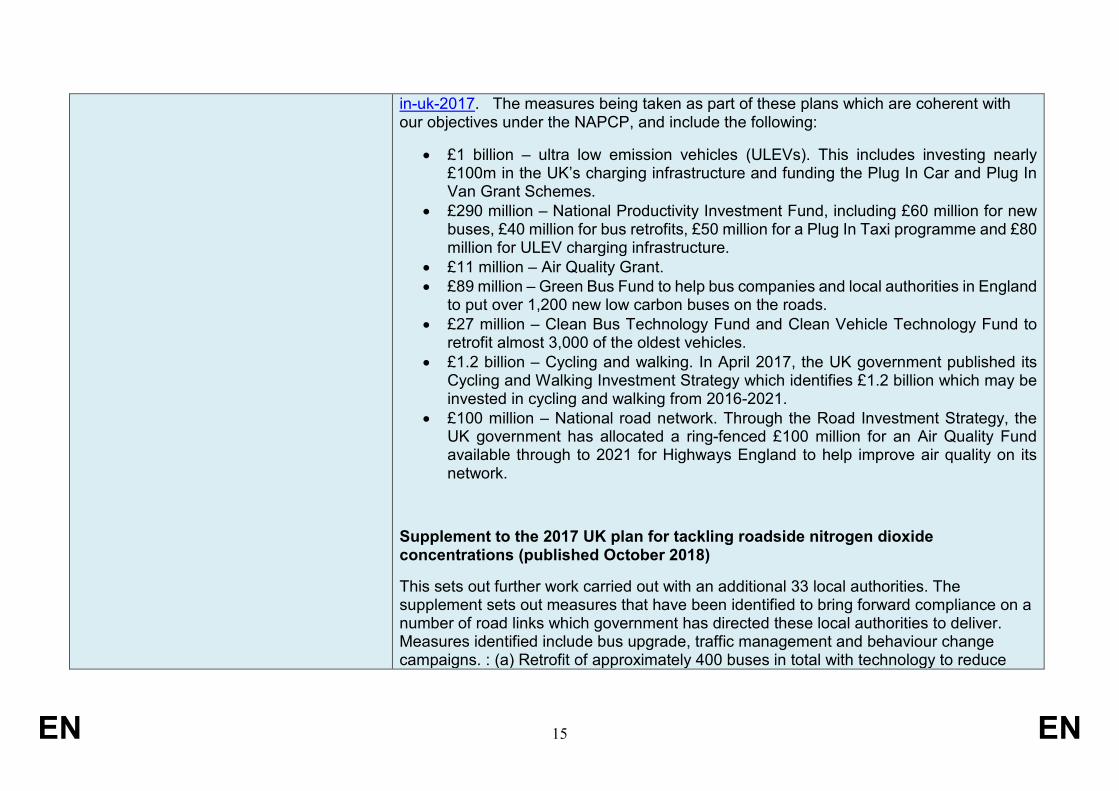
in-uk-2017. The measures being taken as part of these plans which are coherent with our objectives under the NAPCP, and include the following:
• £1 billion – ultra low emission vehicles (ULEVs). This includes investing nearly £100m in the UK’s charging infrastructure and funding the Plug In Car and Plug In Van Grant Schemes.
• £290 million – National Productivity Investment Fund, including £60 million for new buses, £40 million for bus retrofits, £50 million for a Plug In Taxi programme and £80 million for ULEV charging infrastructure.
• £11 million – Air Quality Grant. • £89 million – Green Bus Fund to help bus companies and local authorities in England
to put over 1,200 new low carbon buses on the roads. • £27 million – Clean Bus Technology Fund and Clean Vehicle Technology Fund to
retrofit almost 3,000 of the oldest vehicles. • £1.2 billion – Cycling and walking. In April 2017, the UK government published its
Cycling and Walking Investment Strategy which identifies £1.2 billion which may be invested in cycling and walking from 2016-2021.
• £100 million – National road network. Through the Road Investment Strategy, the UK government has allocated a ring-fenced £100 million for an Air Quality Fund available through to 2021 for Highways England to help improve air quality on its network.
Supplement to the 2017 UK plan for tackling roadside nitrogen dioxide concentrations (published October 2018)
This sets out further work carried out with an additional 33 local authorities. The supplement sets out measures that have been identified to bring forward compliance on a number of road links which government has directed these local authorities to deliver. Measures identified include bus upgrade, traffic management and behaviour change campaigns. : (a) Retrofit of approximately 400 buses in total with technology to reduce

EN 16 EN
harmful emissions in Dudley, Wolverhampton, Sandwell, Reading, Newcastle-under-Lyme and Portsmouth; (b) Traffic management measures such as signal optimisation in Dudley, Sandwell, Wolverhampton and South Gloucestershire; (c) Other measures such as behavioural change campaigns in Solihull and Leicester. The supplement also sets out local authorities that have identified more persistent, long-term exceedances and government has directed the local authorities to develop and implement plans to bring forward compliance. The document is available here: https://assets.publishing.service.gov.uk/government/uploads/system/uploads/attachment_data/file/746100/air-quality-no2-plan-supplement.pdf Welsh Government Supplement to the UK plan for tackling roadside nitrogen dioxide concentrations (November 2018) This document (available from https://gov.wales/docs/desh/policy/181129-final-supplemental-air-quality-plan-en.pdf) sets out action the Welsh Government is taking on five sites on the Welsh Government Managed Road Network and in two Welsh local authority areas. The actions are designed to achieve legal limits for NO2 within the shortest possible time and, most importantly, protect public health. Temporary 50 mph speed limits were introduced in June at the five sections of the Motorway and Trunk Road Network which exceed legal limits. The plan proposes to make these speed limits permanent, along with the introduction of variable diversion routes in Newport. The speed limits and diversion will be subject to review periodically. The Welsh Government has placed a Direction on Cardiff and Caerphilly Councils to undertake an assessment by 30 June 2019 to identify the best option to achieve statutory NO2 limit values within the shortest possible time. The Welsh Government has also allocated £20 million towards supporting the two local authorities to achieve compliance.
Relevant climate change and energy policy priorities (M):
UK Government strategy for reducing carbon emissions have been set out in the ‘Clean Growth Strategy’, published in October 2017 and available from: https://www.gov.uk/government/publications/clean-growth-strategy .
EN 17 EN
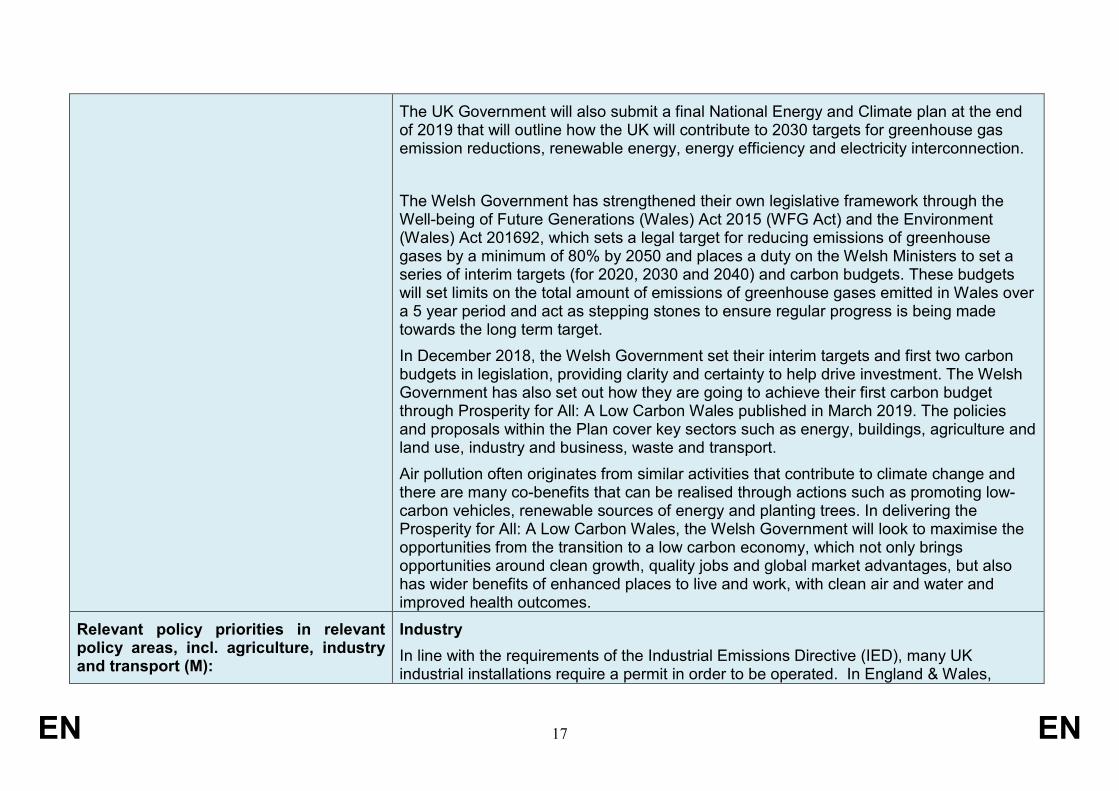
The UK Government will also submit a final National Energy and Climate plan at the end of 2019 that will outline how the UK will contribute to 2030 targets for greenhouse gas emission reductions, renewable energy, energy efficiency and electricity interconnection. The Welsh Government has strengthened their own legislative framework through the Well-being of Future Generations (Wales) Act 2015 (WFG Act) and the Environment (Wales) Act 201692, which sets a legal target for reducing emissions of greenhouse gases by a minimum of 80% by 2050 and places a duty on the Welsh Ministers to set a series of interim targets (for 2020, 2030 and 2040) and carbon budgets. These budgets will set limits on the total amount of emissions of greenhouse gases emitted in Wales over a 5 year period and act as stepping stones to ensure regular progress is being made towards the long term target. In December 2018, the Welsh Government set their interim targets and first two carbon budgets in legislation, providing clarity and certainty to help drive investment. The Welsh Government has also set out how they are going to achieve their first carbon budget through Prosperity for All: A Low Carbon Wales published in March 2019. The policies and proposals within the Plan cover key sectors such as energy, buildings, agriculture and land use, industry and business, waste and transport. Air pollution often originates from similar activities that contribute to climate change and there are many co-benefits that can be realised through actions such as promoting low-carbon vehicles, renewable sources of energy and planting trees. In delivering the Prosperity for All: A Low Carbon Wales, the Welsh Government will look to maximise the opportunities from the transition to a low carbon economy, which not only brings opportunities around clean growth, quality jobs and global market advantages, but also has wider benefits of enhanced places to live and work, with clean air and water and improved health outcomes.
Relevant policy priorities in relevant policy areas, incl. agriculture, industry and transport (M):
Industry In line with the requirements of the Industrial Emissions Directive (IED), many UK industrial installations require a permit in order to be operated. In England & Wales,

EN 18 EN
activities requiring permitting are set out in the Environmental Permitting Regulations (England and Wales) 2016 (available at http://www.legislation.gov.uk/uksi/2016/1154/contents/made). These regulations cover all of the activities in Annex 1 to the IED, plus a small number of additional activities not listed in the IED. Permitted activities are regulated either by the national regulator (Environment Agency in England, Natural Resources Wales in Wales) for Part A processes, or local authorities for Part B processes. In Scotland, the Pollution Prevention and Control (Scotland) Regulations 2012 (available at http://www.legislation.gov.uk/ssi/2012/360/contents/made) implement the requirements of IED. Permitted processes in Scotland are regulated by Scottish Environment Protection Agency (SEPA). In Northern Ireland, the Pollution Prevention and Control Regulations (Northern Ireland) 2013 (available from http://www.legislation.gov.uk/nisr/2013/160/contents/made) implemented the IED. Permitted installations are mostly regulated by the Northern Ireland Environment Agency (NIEA) but District Councils regulate certain smaller sites (Part C installations), for example dry cleaners, petrol stations and some vehicle respraying processes. Agriculture The estimated ammonia emission reductions are modelled across a range of scenarios from the 0% abatement baseline which assumes no additional measures and is therefore highly unlikely given the clear commitments already made publicly and further elaborated above, up to the full package of measures which may be deployed over the coming years. Clean Air Strategy: The CAS commits to regulation to reduce ammonia emissions from farming, including introducing a requirement to store digestate in covered stores and a requirement to adopt low-emission spreading equipment. It also intends to continue to build upon the commitments made in the 25 Year Environment Plan to put in place a

EN 19 EN
robust framework to limit inputs of nitrogen-rich fertilisers and improve fertiliser use efficiency. Code of good Agricultural Practice: The Code of Good Agricultural Practice (COGAP) for reducing ammonia emissions is a guidance document produced by Defra in collaboration with the farming industry. It explains the practical steps farmers, growers, land managers, advisors and contractors in England can take to minimise ammonia emissions from the storage and application of organic manures, the application of manufactured fertiliser, and through modifications to livestock diet and housing. The COGAP report can be found here: https://www.gov.uk/government/publications/code-of-good-agricultural-practice-for-reducing-ammonia-emissions/code-of-good-agricultural-practice-cogap-for-reducing-ammonia-emissions. The Scottish Government’s Climate Change Plan sets out action being taken to promote and encourage best practice in relation to agricultural activities. Emissions from agriculture will also be considered as part of the review of the Scottish Government’s Cleaner Air for Scotland strategy. The Welsh Government has completed a gap analysis between the Code of Good Agricultural Practice for the Protection of Water, Soil and Air for Wales and the UNECE Framework Code for Good Agricultural Practice for Reducing Ammonia Emissions and will provide additional guidance to bring COGAP in line with the with the UNECE framework by 31 March 2019. The Welsh Government is currently consulting on future support for agriculture following Brexit. A number of public goods, including the resolution of air quality issues arising from agricultural practice, are being considered for inclusion within the proposed new schemes. Woodlands are known to contribute to improving air quality, not just in urban areas but in the wider rural environment.

EN 20 EN
The report “Valuation of Welsh Forest Resources” by Forest Research, 2017, gives an indication of the non-market benefits provided by Welsh forests. This report provides an annual value of service flow in relation to air quality improvement of £385 million in 2015. The figures provided in the report are experimental environmental accounts at an all-Wales level, using methodologies employed by ONS and the best available data for the Welsh context. The report is available here: https://www.forestresearch.gov.uk/research/valuation-of-welsh-forest-resources/ Increasing woodland cover in Wales will increase benefits of improved air quality, particularly where woodland is adjacent to agricultural or industrial buildings, urban or transport corridors. An increase in woodland cover is now essential to enable Wales to achieve various international and domestic climate change targets and is in line with the Welsh Government Natural Resources Policy. The UK Committee on Climate Change advised that the main decarbonisation option for the land use sector required more tree planting and suggested a target for woodland creation of around 2,000ha per year between 2020 - 2030 and beyond. This target has been adopted in Welsh Government forestry policy and is set out in their Woodlands for Wales strategy. Support for new woodland creation is available through the Wales agri-environment scheme Glastir, and is being considered under the proposed land management scheme being developed to replace CAP. In Northern Ireland, DAERA are working with stakeholders to develop an Action Plan on Ammonia Reduction. The aim of this document is to outline proposals for achieving sustained and tangible reductions in total ammonia emissions. The Action Plan will set out a series of potential on-farm measures for ammonia reduction and outline the delivery mechanisms to encourage uptake of the measures highlighted. The Action Plan will represent a comprehensive government response to the recommendations of the independent Expert Working Group which examined the issue of ammonia and reported to government in December 2016 through its “Making Ammonia Visible” document. DAERA expects to issue a consultation on the Action Plan during 2019. Further

EN 21 EN
information on DAERA’s policy on ammonia including the “Making Ammonia Visible” report and the initial DAERA response to the recommendations can be found at https://www.daera-ni.gov.uk/articles/ammonia-emissions-northern-ireland. DAERA is also currently developing a Code of Good Agricultural Practice (COGAP) for reducing ammonia emissions in Northern Ireland. This document will provide guidance to farms on the steps they can take to lower emissions of ammonia from farming activities. The Crop Residue (Burning) Regulations 1993: These regulations apply in England and Wales and prohibit the burning on agricultural land of crop residues. Transport UK’s Road to Zero Strategy: This sets out plans to enable a significant expansion of vehicle charging infrastructure across the UK, reduce emissions from the vehicles already on the UK’s roads, and drive the uptake of zero emission cars, vans and trucks, which includes ending the sale of conventional petrol and diesel cars and vans by 2040, with an interim target of at least half of new cars to be ultra low emission by 2030. The Road to Zero Strategy can be found here: https://assets.publishing.service.gov.uk/government/uploads/system/uploads/attachment_data/file/739460/road-to-zero.pdf UK’s Maritime 2050: navigating the future policy paper. This strategy sets out the government’s vision and ambitions for the future of the British maritime sector. Maritime 2050 is about anticipating the challenges and opportunities ahead and recognising the UK’s strengths so we are well placed to capitalise on them. Our ambitions and goals will be achieved by focusing on the following 7 themes:
• UK competitive advantage • Technology • People • Environment

EN 22 EN
• Infrastructure • Trade • Security
Short, medium and long-term recommendations are identified under each theme. Delivery of the vision and recommendations in Maritime 2050 will be supported by a series of thematic route maps. These set out the steps government and industry will take now and in the coming years to achieve the ambitions of our strategy in greater detail. Aviation 2050 — the future of UK aviation: The Department for Transport is seeking feedback on its green paper which outlines proposals for a new aviation strategy. The strategy will set out the challenges and opportunities for aviation to 2050 and beyond and will emphasise the significance of aviation to the UK economy and regional growth. The strategy will focus on:
• Developing a partnership for sustainable growth which meets rising passenger demand, balanced with action to reduce environmental and community impacts
• Improving the passenger experience, including through technology and innovation, a new passenger charter and action to reduce delays at the border
• Building on the UK’s success to establish new connections across the world and create greater choice for consumers
Additional supporting documents have also been published. A final white paper version of the aviation strategy will be published by the middle of 2019. Responsibility for some elements of transport air quality policy, mainly related to road and rail, are devolved to the four regions of the United Kingdom. Action is underway in all 4 administrations to reduce emissions of pollutants: In England the Clean Air Strategy 2019 indicated how we will:

EN 23 EN
• Support research into rail freight emissions to enable better comparisons with HGV emissions and therefore understand how shifts from road to rail can be best used to deliver reductions in emissions
• Develop and deploy options to shift freight from road to rail, including low emission rail freight for delivery into urban areas with zero emission last mile deliveries
• Invest £1.2bn in cycling and walking from 2016-21 to double the level of cycling by 2025 and reverse the decline in walking
• Drive productivity via the £1.7bn Transforming Cities Fund, which will improve public transport connectivity in some of England’s largest cities. This will tackle congestion through increased public transport and therefore reduce exhaust and non-exhaust emissions
• Develop the evidence on and testing for alternative fuels for rail transport, including hydrogen fuel cells
• Build on work at Birmingham New Street station, where poor air quality issues were identified and solutions identified. This includes sponsoring independent assessments of air quality at a range of stations in 2019 to identify whether this is a more widespread problem
In Scotland:
• As discussed in the air quality priorities box above, the Scottish Government is developing a National Modelling Framework (NMF) and a National Low Emission Framework (NLEF) to enable local authorities to appraise, justify the business case for and implement a range of transport related policy interventions to improve local air quality. Further information on transport policy in Scotland is set out in the National Transport Strategy.
In Wales:

EN 24 EN
• A broad range of actions to tackle transport emissions across the whole of Wales have been and will be implemented by the Welsh Government and further measures are being considered. Many within the context of the decarbonisation of transport. Improving air quality by reducing emissions from transport will be a key pillar in the development of a new Wales Transport Strategy by the end of 2019.
• Encouraging a shift from an overreliance on the private car to more sustainable modes of transport such as walking and cycling and public transport is a key element of the Welsh Government’s policy approach.
• The Welsh Government’s Active Travel (Wales) Act 2013 came into force in September 2014. It requires local authorities to map and continuously improve routes and facilities for cycling and walking. This is being supported by an investment of £60 million over three years from 2018 to create new active travel routes across Wales. It will make active modes of transport safer and more attractive prospects and will thereby encourage people to choose these instead of private cars.
• The new Wales and Borders rail franchise, awarded by the Welsh Government in 2018, will deliver a £2 billion investment to introduce new, cleaner, rolling stock, modernise all 247 stations and provide new, additional services, bringing about a 65% increase in capacity and greatly increasing the attractiveness of rail travel.
• The new South Wales Metro and plans for other Metro schemes in Wales will bring about a step change in the integration and frequency of public transport services to offer a compelling alternative to car journeys. These wider measures will all contribute to an overall reduction in emissions across Wales, including at the sites identified as not being compliant with NO2 limits.
• The Welsh Government will engage with stakeholders as we develop further policies and proposals which will contribute towards Wales meeting its current and future air quality legal obligations, carbon budgets and targets. This will encompass all transport modes, and will include measures to help promote the uptake of low emission vehicles in Wales. The Welsh Government will consider the feasibility of introducing a car scrappage scheme and have already committed to providing £2 million to help secure a network of electric vehicle charging points throughout Wales. In partnership with the Welsh Automotive Forum the Welsh Government continues
EN 25 EN
to identify companies and academia with the potential to play a part in the transition to ULEV and work with incumbent companies to transition into new supply chains
• The Welsh Government have also set out a bold ambition to reduce the carbon footprint of buses and taxis in Wales to zero by 2028 with a consequent significant reduction in emissions. Through this action the Welsh Government will bring about significant improvements to air quality in our
• Towns and cities and show leadership in the drive to low carbon and low emission transport.
• The Welsh Government will continue to advise local authorities, bus operators and other businesses on bidding for UK Government funding that extends to Wales, including the Low Emission Bus Fund and Workplace Charging Scheme.
• Between 25 April and 19 June, the Welsh Government consulted on a Clean Air Zone Framework for Wales. This provides guidance to local authorities 96 who are considering options to address local air quality issues. It describes what a clean air zone is, under what circumstances it may be applied and the key considerations for local authorities who wish to establish one. The reasons for reducing airborne pollution, through a clean air zone, may be to address the need to reduce emissions to within legal limits, but most importantly, to bring about improvements in the environment and to deliver better health for all. The final version of the Framework will be published, and issued to local authorities in early 2019.
• The Welsh Government’s ability to take action in relation to air quality is limited to taking steps that fall within the scope of the matters within the devolved competence of the Welsh Ministers and the National Assembly for Wales. The Welsh Government engages with the United Kingdom Government on relevant matters that are outside its devolved competence, such as regulation of the construction and equipment of motor vehicles and trailers, including vehicle specification standards, vehicle excise duty and fuel duty. However, the Welsh Government will take any opportunity within devolved competence, where it is possible to bring about behavioural or other changes that will contribute towards improved air quality in these areas. The investment in electric vehicle charging infrastructure and the carbon footprint reduction targets for buses and taxis being examples of this.

EN 26 EN
In Northern Ireland:
• The Programme for Government includes indicators for greater use of sustainable modes and the Department for Infrastructure is working with Translink, the rail provider in the area, to deliver this. Translink’s Vision ‘To be Your First Choice for Travel in Northern Ireland’ drives the modal shift away from the private car and on to public transport (bus and rail).
• The Programme for Government’s outcomes are also a key input to the new Transport Plans which will seek to produce increased use of sustainable modes – these plans are being prepared by the Department for Infrastructure in conjunction with local Councils’ land-use development plans.
• Translink is currently progressing a number of air quality initiatives related to reducing vehicle idling for both bus and rail vehicles.
• Local councils are responsible for local air quality management, and have put in place Air Quality Action Plans with appropriate transport-related measures in conjunction with the Department for Infrastructure.
Domestic Combustion Approximately 38% of UK primary particulate matter emissions come from burning wood and coal in domestic open fires and solid fuel stove. Proposals for tackling emissions from this source in England are outlined in the Clean Air Strategy. Wales is similar with emissions from domestic burning estimated to have increased in recent years and now accounting for around 44% of the total PM2.5, compared to industrial combustion (14%) and transport sources (11%). Work on domestic combustion policy is therefore an integral part of the Welsh Government’s Clean Air Programme, established to consider evidence and develop and implement actions across all Welsh Government Departments to deliver clean air improvements.

EN 27 EN
2.3.2 Responsibilities attributed to national, regional and local authorities
The Welsh Government recognises action to reduce levels of PM2.5 from domestic burning sources must take a multifaceted approach; developing measures which in the future ensure the use of only the cleanest domestic burning fuels and appliances, as well as the ongoing maintenance requirements of such appliances. Additionally, as with other forms of domestic pollution, significant improvements in this area can only be achieved by raising awareness of the issue so as to change how and what people burn. As such, alongside other direct measures, we will be considering how to package such communications and behavioural changes messages to have the biggest impact. Firstly, the Welsh Government is developing an evidence base to understand the specific circumstances in Wales with respect to domestic solid fuel combustion; recognising the need to better understand the specific position in Wales with respect to the types of appliances used, fuels burnt and the potential impact of introducing future product standards. This, and other evidence, will inform the most effective behaviours and interventions. Public engagement work is already well underway; a Task and Finish group made up of all relevant stakeholders including HETAS, Woodsure, the Stove Industry Alliance, local authorities and Public Health Wales is currently being convened with a view to underpinning the work in this important area. Finally, the Welsh Government will work closely with the UK Government to consider co-ordinated action on domestic combustion where appropriate, such as that set out in the UK Clean Air Strategy, where evidence supports such benefits will be realised in Wales. The Welsh Government will consider opportunities and requirements for introducing additional measures through primary legislation.

EN 28 EN
List the relevant authorities(M):
Describe the type of authority (e.g. environmental inspectorate, regional environment agency, municipality) (M): Where appropriate, name of authority (e.g. Ministry of XXX, National Agency for XXX, Regional office for XXX):
Describe the attributed responsibilities in the areas of air quality and air pollution (M): Select from the following as appropriate:
• Policy making roles • Implementation roles • Enforcement roles (including where relevant
inspections and permitting) • Reporting and monitoring roles • Coordinating roles • Other roles, please specify:
Source sectors under the responsibility of the authority (O):
National authorities (M):
Department for Environment, Food & Rural Affairs (Defra)
Policy making role Coordinating role
Scottish Government (SG) Policy making role
Welsh Government (WG) Policy making role Implementation role
Department of Agriculture, Environment and Rural Affairs Northern Ireland (DAERA)
Policy making role
Department for Business, Energy and Industrial Strategy (BEIS) Policy making role
Department for Transport (DfT) Policy making role
Regional authorities (M): Environment Agency (EA)
Implementation role Enforcement role Reporting and monitoring role

EN 29 EN
Scottish Environment Protection Agency (SEPA)
Implementation role Enforcement role Reporting and monitoring role
Natural Resources Wales (NRW) Implementation role Enforcement role Reporting and monitoring role
Northern Ireland Environment Agency (NIEA)
Implementation role Enforcement role Reporting and monitoring role
Local authorities (M):
Local authorities in England, Scotland, Wales & Northern Ireland (LAs)
Implementation role Enforcement role Reporting and monitoring role
Add more rows as appropriate
2.4 Progress made by current policies and measures (PaMs) in reducing emissions and improving air quality, and the degree of compliance with national and Union obligations, compared to 2005
2.4.1 Progress made by current PaMs in reducing emissions, and the degree of compliance with national and Union emission reduction obligations
Describe progress made by current PaMs in reducing emissions, and the degree of compliance with national and Union emission reduction legislation (M):
Emissions in 2016 were:
• 48% lower than in the 2005 base year for NOX • 77% lower than in the 2005 base year for SOX • 33% lower than in the 2005 base year for NMVOC • 15% lower than in the 2005 base year for PM2.5

EN 30 EN
• 3% lower than in the 2005 base year for NH3:
The UK has been compliant with emission ceilings for 2010-2019 set under the NECD for all pollutants and years between 2010 and 2016, taking into account the approved adjustment for NOX in 2010.
Provide complete references (chapter and page) to publically available supporting datasets (e.g. historic emission inventory reporting) (M):
Information on the UK inventory, including methodology reports and emissions data including for the historic inventory can be found at http://naei.beis.gov.uk/.
Include graphics illustrating the emission reductions per pollutant and/or per main sectors (O):
2.4.2 Progress made by current PaMs in improving air quality, and the degree of compliance with national and Union air quality obligations
Describe progress made by current PaMs in improving air quality, and the degree of compliance with national and Union air quality obligations by, as a minimum, specifying the number of air quality zones, out of the total air quality zones, that are (non)compliant with EU air quality objectives for NO2, PM10, PM2.5 and O3, and any other pollutant(s) for which there are exceedances (M):
For the purposes of air quality monitoring and assessment of compliance with the Ambient Air Quality Directive (AAQD) and 4th Daughter Directive (2004/107/EC) (4DD), the UK is divided into 43 zones. The 2017 results are summarised below: The UK met the limit value for hourly mean nitrogen dioxide (NO2) in all but two zones. Six zones were compliant with the limit value for annual mean NO2. The remaining 37 zones exceeded this limit value. In 36 of these zones the exceedance of the limit value decreased compared to 2016. Modelling done for the 2017 UK Plan for Tackling Roadside Nitrogen Dioxide Concentrations indicated that improvements in zone compliance would begin to be seen only in 2019 once the time necessary to put measures in place was factored in.

EN 31 EN
Three zones exceeded the target value for benzo[a]pyrene. All zones met the target values for arsenic, cadmium and nickel. All zones met both the target values for ozone; the target value based on the maximum daily eight-hour mean, and the target value based on the AOT40 statistic. Nine zones were compliant with the long-term objective for ozone, set for the protection of human health. This is based on the maximum daily eight-hour mean. The other 34 zones exceeded this long-term objective. All zones complied with the critical level for annual mean NOx concentration, set for protection of vegetation. All zones met the limit values for daily and annual mean concentrations of PM10, without the need for subtraction of the contribution from natural sources. All zones met Stage 1 limit value for annual mean concentrations of PM2.5 which came into force on the 1st January 2015. Further, all zones met the Stage 2 limit value which must be met by 2020 and all zones met the running year Average Exposure Indicator target for 2020.
Provide complete references (chapter and page) to publically available supporting datasets (e.g. air quality plans, source apportionment) (M):
1. 2017 UK Plan for tackling Roadside Nitrogen Dioxide Concentrations https://www.gov.uk/government/publications/air-quality-plan-for-nitrogen-dioxide-no2-in-uk-2017 2. 2017 Air Pollution in the UK report (published September 2018): https://uk-air.defra.gov.uk/library/annualreport/viewonline?year=2017_issue_1#report_pdf 1. Air Quality Monitoring data (UK-Air website): https://uk-air.defra.gov.uk/data/

EN 32 EN
Maps or histograms illustrating the current ambient air concentrations (for at least NO2, PM10, PM2.5 and O3, and any other pollutant(s) that present(s) a problem) and which show, for instance, the number of zones, out of the total air quality zones, that are (non)compliant in the base year and in the reporting year (O):
Where problems are identified in (an) air quality zone(s), describe how progress was made in reducing the maximum concentrations reported (O):
2.4.3 Current transboundary impact of national emission sources Where relevant, describe the current transboundary impact of domestic emission sources (M): Progress can be reported in quantitative or qualitative terms. If no issues were identified, then state that conclusion.
The key data source for transboundary impacts of UK domestic emissions is the work undertaken through the UNECE European Monitoring and Evaluation Programme (EMEP), specifically by the Meteorological Synthesizing Centre, West (MSC-W, http://emep.int/mscw/index_mscw.html). Transboundary fluxes, transboundary concentrations of ozone and transboundary concentrations of particulate matter were modelled using EMEP, combined with meteorological and emissions data for the year 2016. Reductions in exposure to ozone, exposure to PM2.5 and nitrogen deposition were modelled using the UK Integrated Assessment Model (UK-IAM), combined with population distribution data from the International Institute for Applied Systems Analysis (IIASA). The modelling runs indicate that the benefits from further UK emission reductions will be mainly be accrued in the UK, with much smaller, although still significant, benefits accruing to other European countries.

EN 33 EN
At long distances, the change in individual exposure to air pollution is minute, but such changes are not negligible when accumulated over large populations and when considered in parallel with the effects of emissions reductions in other countries as well. Due to prevailing wind patterns, the non-UK benefits of UK emission reduction are focused on those countries immediately to the East and South, in particular France, Germany and The Netherlands. There are also some benefits for the Republic of Ireland although this tends to be much lower despite it being the only other EU member state to share a land border with the UK.
In case quantitative data is used to describe the results of the assessment, specify data and methodologies used to conduct the above assessment (O):
2.5 Projected further evolution assuming no change to already adopted policies and measures
2.5.1 Projected emissions and emission reductions (WM scenario) Pollutants (M):
Total emissions (kt), consistent with inventories for year x-2 or x-3 (year to be specified) (M):
Projected % emission reduction achieved compared with 2005 (M):
National emission reduction commitment for 2020-2029 (%) (M):
National emission reduction commitment from 2030 (%) (M):
2005
bas
e ye
ar :
2020
:
2025
:
2030
:
2020
:
2025
:
2030
: SO2: 773 126 110 97 84% 86% 87% 59% 88%
NOx: 1,714 735 628 558 57% 63% 67% 55% 73%

EN 34 EN
NMVOC: 1,042 686 699 719 34% 33% 31% 32% 39%
NH3: 288 279 276 277 3% 4% 4% 8% 16%
PM2.5: 127 104 102 99 19% 20% 22% 30% 46%
Outline the associated uncertainties for the WM projections to meet the emission reduction commitments for 2020, 2025 and 2030 onwards (O):
Note that due to data concerns, emissions from anaerobic digestion have been excluded from the ammonia base year and projections
Date of emission projections (M): March 2018 Where the projected evolution demonstrates non-attainment of the emission reduction commitments under the WM scenario, section 2.6 shall outline the additional PaMs considered in order to achieve compliance.
2.5.2 Projected impact on improving air quality (WM scenario), including the projected degree of compliance
2.5.2.1 Qualitative description of projected improvement in air quality (M) Provide a qualitative description of the projected improvements in air quality and projected further evolution of degree of compliance (WM scenario) with EU air quality objectives for NO2, PM10, PM2.5 and O3 values, and any other pollutant(s) that present(s) a problem by 2020, 2025 and 2030 (M): Provide complete references (chapter and page) to publically available supporting datasets (e.g. air quality plans, source apportionment) describing the projected improvements and further evolution of degree of compliance (M):
The UK is compliant with the concentration limit values set out in EU legislation, except for NO2 where we face a significant challenge along with many other EU countries. Therefore, in July 2017 the UK Government published the Air Quality Plan for NO2 and subsequently published the Supplement to the UK plan for tackling roadside nitrogen dioxide concentrations in October 2018. These documents outline a range of measures that enable Local Authorities to meet NO2 limit values in the shortest possible time.

EN 35 EN
2.5.2.2 Quantitative description of projected improvement of air quality (O) AAQD values:
Projected number of non-compliant air quality zones:
Projected number of compliant air quality zones:
Total number of air quality zones:
Spec
ify b
ase
year
:
2020
:
2025
:
2030
:
Spec
ify b
ase
year
:
2020
:
2025
:
2030
:
Spec
ify b
ase
year
:
2020
:
2025
:
2030
:
PM2.5 (1 yr):
NO2 (1 yr):
PM10 (1 yr):
O3 (max 8 hr mean):
Other (please specify):
2.6 Policy options considered in order to comply with the emission reduction commitments for 2020, and 2030, intermediate emission levels for 2025 The information required under this section shall be reported using the 'Policies and Measures Tool' ('PaM tool') provided for that purpose by the EEA.
2.6.1 Details concerning the PaMs considered in order to comply with the emission reduction commitments (reporting at PaM level) :

EN 36 EN
Name and brief description of individual PaM or package of PaMs (M):
Affected pollutant(s), select as appropriate :
SO2, NOx, NMVOC, NH3, PM2.5, (M); BC as a component of PM2.5, other (e.g. Hg, dioxins, GHG) (O) please specify:
Objectives of individual PaM or package of PaMs* (M):
Type(s) of PaM(s)ᶺ (M):
Primary, and where appropriate, additional sector(s) affected† (M):
Implementation period (M for measures selected for implementation):
Authorit(y)(ies) responsible for implementation (M for measures selected for implementation):
Refer to those listed in table 2.3.2 as appropriate.
Details of the methodologies used for analysis (e.g. specific models or methods, underlying data) (M):
Quantified expected emission reductions (for individual PaM or for packages of PaMs, as appropriate) (kt, per annum or as a range, compared to WM scenario) (M):
Qualitative description of uncertainties (M, where available):
Start Finish Type Name 2020 2025 2030
Road transport package
Road to Zero for cars & LGVs
Influencing modal shifts in urban areas
Impact on NOx, SO2, NMVOCs, PM2.5 and NH3 all assessed
Efficiency improvements of vehicles
Modal shift to public transport or non-motorised transport
Alternative fuels for vehicles (including electric)
Improved behaviour
Improved transport infrastructure
Fiscal instruments:
Voluntary/negotiated agreements;
Information;
Regulatory;
Education
Research;
Planning;
Transport 2019
Beyond 2030
Policy maker
Local Authorities
DfT, BEIS, WG (for modal shift)
LAs
Underlying projections data as per the 2016 NAEI.
Abatement analysis using least-cost optimisation model, based on low, medium and high feasibility scenarios, with measures prioritised by health impacts relative to costs
NOx: 0 to 0.7
NOx: 1.2 to 8.3
NOx: 2.1 to 15.6
Ranges indicate lower and upper scenarios for abatement, based on expected uptake of measures by 2020 and 2030
SO2: 0 SO2: 0 SO2: 0 to 0.1
NMVOCs: 0
NMVOCs: 0.1 to 0.5
NMVOCs: 0.2 to 1.4
PM2.5: 0
PM2.5: 0.1 to 0.6
PM2.5: 0.1 to 0.7
NH3: 0 NH3: 0 to 0.2
NH3: 0.1 to 0.7

EN 37 EN
Shipping package
Changes to domestic regulations
Extending ECAs to all UK coastal waters
Major port AQ plans
Impact on NOx, SO2, NMVOCs, PM2.5 and NH3 all assessed
Deployment of pollution abatement technologies on vessels
Alternative fuels for vessels
Improved transport infrastructure
Improved behaviour
Information
Support for innovation
Regulatory
Transport 2019 Beyond 2030
Policy maker
DfT
Underlying projections data as per the 2016 NAEI.
Abatement analysis using least-cost optimisation model, based on low, medium and high feasibility scenarios, with measures prioritised by health impacts relative to costs
NOx: 0 NOx: 10.8 to 44.6
NOx: 19 to 50.1
Ranges indicate lower and upper scenarios for abatement, based on expected uptake of measures by 2020 and 2030
SO2: 0 SO2: 1.4 to 3
SO2: 2.8 to 4
NMVOCs: 0
NMVOCs: 0 to 0.1
NMVOCs: 0
PM2.5: 0
PM2.5: 0 to 0.5
PM2.5: 0 to 0.7
NH3: 0 NH3: 0 NH3: 0
Other transport package
Aviation AQ strategy
Action to reduce rail emissions
Action on NRMM via publicly funded infrastructure projects
Impact on NOx, SO2, NMVOCs, PM2.5 and NH3 all assessed
Alternative fuels for vehicles and aircraft (including electric)
Improved behaviour
Improved transport infrastructure
Other transport.
Voluntary/negotiated agreements
Information
Regulatory
Education
Research
Transport
Cross-cutting
2019
Beyond 2030
Policy maker
Local Authorities
Defra, DfT, WG
LAs
Underlying projections data as per the 2016 NAEI.
Abatement analysis using least-cost optimisation model, based on low, medium and high feasibility scenarios for each sector, with measures prioritised by health impacts relative to costs
NOx: 0 NOx: 4.7 to 13.9
NOx: 6.2 to 15.1
Ranges indicate lower and upper scenarios for abatement, based on expected uptake of measures by 2020 and 2030
SO2: 0 SO2: 0.3 to 0.5
SO2: 0.3 to 0.5
NMVOCs: 0
NMVOCs: 0.4 to 0.9
NMVOCs: 0.4 to 1.5
PM2.5: 0
PM2.5: 1.5 to 1.7
PM2.5: 1.3 to 1.7
NH3: 0 NH3: 0 NH3: 0

EN 38 EN
Domestic package
Legislate to prohibit sale of the most polluting fuels
LA enforcement
Impact on NOx, SO2, NMVOCs, PM2.5 and NH3 all assessed
Other energy supply
Regulatory
Source based pollution control
Energy supply 2019
Provisional Implementation dates for the measures above:
Finalising of policy 2019
Implementation: 2020
Beyond 2030
Policy maker
Local Authorities
Defra, DAERA, SG, WG
LAs
Underlying projections data as per the 2016 NAEI.
Analysis of abatement using least-cost optimisation model, based on: estimated difference in emissions between burning wet & dry wood; estimated difference in emissions between burning coal and SSF; estimated reduction in emissions from implementation of eco-design
NOx: 4.3
NOx: 5.1 to 5.4
NOx: 5.2 to 5.8
Ranges indicate lower and upper scenarios for abatement, based on expected uptake of measures by 2020 and 2030
SO2: 0.6
SO2: 0.7 to 1
SO2: 0.7 to 1.3
NMVOCs: 18.9
NMVOCs: 21.7 to 23.2
NMVOCs: 22.1 to 25
PM2.5: 12.4
PM2.5: 13.9 to 15.5
PM2.5: 13.6 to 16.1
NH3: 0 NH3: 0 to 0.1
NH3: 0 to 0.2

EN 39 EN
Agriculture package
Funding for low-emission equipment
Regulation to reduce urea-based fertiliser emissions & regulation to reduce emissions from fertiliser use
Requiring covers on slurry & digestate, stores and requiring spreading by trailing hose, trailing shoe or injection
Incorporation of manures within 12 hours
Mandatory standards for livestock housing
NH3 6.
Low-emission application of fertilizer/manure on cropland and grassland
Improved livestock management and rearing installations
Improved animal waste management systems
Economic
Information
Regulatory
Agriculture
Waste
2019
2027
Policy maker
Defra, DAERA, SG, WG
Underlying projections data as per the 2016 NAEI, excluding anaerobic digestion due to data concerns.
Abatement analysis based on uptake rates of low, medium and high feasibility scenarios, with measures prioritised by marginal cost of abatement.
NH3: 0 to 26.3
NH3: 0 to 44.1
NH3: 0 to 61.8
Ranges indicate lower and upper scenarios for abatement, based on expected uptake of measures by 2020 and 2030

EN 40 EN
Environmental Permitting for dairy & intensive beef units

EN 41 EN
Industry package
Implementation of MCPD, HNG and other IED measures
Industrial roadmaps
Closing the regulatory gap & regulation for smaller sites
Challenging industry on VOCs
Installation of abatement technologies
Improved control of fugitive emissions from industrial processes
Other industrial processes
Source-based pollution control
Voluntary/negotiated agreements
Regulatory
Support for innovation
Energy supply
Industrial processes
2019
Beyond 2030
Policy maker
Enforcement role
Defra, DAERA, SG, WG
EA, SEPA, NRW, NIEA
Underlying projections data as per the 2016
Abatement analysis using least-cost optimisation model, based on low, medium and high feasibility scenarios for each sector, with measures prioritised by health impacts relative to costs
NOx: 5.2
NOx: 28.2 to 37.8
NOx: 42.7 to 51.7
Ranges indicate lower and upper scenarios for abatement, based on expected uptake of measures by 2020 and 2030
SO2: 2.9
SO2: 18.2 to 31
SO2: 32.3 to 42.4
NMVOCs: 0.1
NMVOCs: 18.9 to 54.7
NMVOCs: 27.3 to 54.7
PM2.5: 1.8
PM2.5: 6.6 to 10.7
PM2.5: 10.6 to 14.6
NH3: 0 NH3: 0 NH3: 0
Total for all policy packages
Impact on NOx, SO2, NMVOCs, PM2.5 and NH3 all assessed
All of the above
All of the above
All of the above
2019 Beyond 2030
Policy maker
Enforcement role
Defra, DfT, BEIS, DAERA, SG, WG
EA, SEPA, NRW, NIEA, LAs
Underlying projections data as per the 2016 NAEI, excluding anaerobic digestion due to data concerns.
Abatement analysis using least-cost optimisation model, based on low, medium and high
NOx: 10
NOx: 54 to 121
NOx: 82 to 152
Ranges indicate lower and upper scenarios for abatement, based on expected uptake of measures by 2020 and 2030
SO2: 3 SO2: 24 to 43
SO2: 41 to 57
NMVOCs: 19
NMVOCs: 44 to 89
NMVOCs: 55 to 93
PM2.5: 15
PM2.5: 24 to 32
PM2.5: 28 to 39
NH3: 0 to 26
NH3: 0 to 44
NH3: 0 to 63

EN 42 EN
feasibility scenarios for each sector, with measures prioritised by health impacts relative to costs
Total for all policy packages if Clean Air Strategy policies (or equivalents) relating to devolved powers are applied to England only
Impact on NOx, SO2, NMVOCs, PM2.5 and NH3 all assessed
All of the above
All of the above
All of the above
2019 Beyond 2030
Policy maker
Enforcement role
Defra, DfT, BEIS
EA, LAs
Underlying projections data as per the 2016 NAEI, excluding anaerobic digestion due to data concerns.
Abatement analysis using least-cost optimisation model, based on low, medium and high feasibility scenarios for each sector, with measures prioritised by health impacts relative to costs
NOx: 10
NOx: 50 to 110
NOx: 75 to 138
Ranges indicate lower and upper scenarios for abatement, based on expected uptake of measures by 2020 and 2030
SO2: 3 SO2: 21 to 36
SO2: 36 to 48
NMVOCs: 19
NMVOCs: 41 to 79
NMVOCs: 50 to 83
PM2.5: 14
PM2.5: 22 to 29
PM2.5: 26 to 34
NH3: 0 to 26
NH3: 0 to 44
NH3: 0 to 63

EN 43 EN
Measures not taken forward
Moving away from large scale biomass combustion to CCGTs. This has small AQ benefits but potentially large GHG impacts
The use of oil spraying and/or scrubbers to reduce PM emissions from the agriculture livestock sector. There is a large degree of uncertainty as to the efficacy of these measures, which coupled with limited population exposure associated with these sources
Underlying projections data as per the 2016 NAEI.
Abatement analysis based on low, medium and high feasibility scenarios for each sector, with measures deprioritised if they have disproportionate costs and/or conflict with GHG policies
NOx: 0 NOx: 0.1 to 0.4
NOx: 0.2 to 0.5
Ranges indicate lower and upper scenarios for abatement, based on expected uptake of measures by 2020 and 2030
SO2: 0 SO2: 0 SO2: 0
NMVOCs: 0
NMVOCs: 0
NMVOCs: 0
PM2.5: 0
PM2.5: 0.1 to 0.2
PM2.5: 0.2 to 0.3
NH3: 0 NH3: 0 NH3: 0

EN 44 EN
meant they were excluded
The responses to the field indicated with (*), (ᶺ) and (†) shall be filled in by using pre-defined reply options which are consistent with the reporting obligations under Regulation (EU) 525/2013 on a mechanism for monitoring and reporting greenhouse gas emissions and Commission Implementing Regulation (EU) 749/2014.
The responses to the field indicated with (*) shall be filled in by using the following pre-defined reply options, to be selected as appropriate (more than one objective can be selected, additional objectives could be added and specified under ‘other’) (M):
1. Energy supply: • increase in renewable energy;
• switch to less carbon-intensive fuels;
• enhanced non-renewable low carbon generation (nuclear);
• reduction of losses;
• efficiency improvement in the energy and transformation sector;
• installation of abatement technologies;
• other energy supply. 2. Energy consumption:
• efficiency improvements of buildings;
• efficiency improvement of appliances;
• efficiency improvement in services/tertiary sector;
• efficiency improvement in industrial end-use sectors;

EN 45 EN
• demand management/reduction;
• other energy consumption. 3. Transport:
• deployment of pollution abatement technologies on vehicles, vessels and aircraft;
• efficiency improvements of vehicles, vessels and aircaft;
• modal shift to public transport or non-motorised transport;
• alternative fuels for vehicles, vessels and aircraft (including electric);
• demand management/reduction;
• improved behaviour;
• improved transport infrastructure;
• other transport. 4. Industrial processes:
• installation of abatement technologies;
• improved control of fugitive emissions from industrial processes;
• other industrial processes. 5. Waste management/waste:
• demand management/reduction; The Welsh Government have a Waste Prevention Programme (published in 2013) that includes waste prevention targets (not mandatory) for each major waste stream. We have funded the Love Food Hate Waste campaign that has seen household food waste levels drop by 10% between 2009 and 2015. Northern Ireland published a Waste Prevention Programme (published in 2014). This contained a number of initiatives to prevent and minimise waste from households and industry. Funding has been provided for communications campaigns and waste prevention and reuse projects. Local authority collected municipal waste arising for 2017/18 are 7.8% below the 2007/08 figures despite increases to the population and business activity.

EN 46 EN
• enhanced recycling; The Welsh Government have set a target of a minimum of 70% recycling for all waste streams by 2025. We have set statutory recycling targets for Local Authorities, with 70% set for 2025. The current recycling rate is 63%. Recycling reduces global emissions to air by reducing the emissions associated with the extraction and processing of primary raw materials. 99% of Welsh households have a separate weekly food waste collection service. Most of this food waste goes to anaerobic digestion facilities, whose air emissions are regulated under the Environmental Permitting Regulations. Northern Ireland published a Waste Prevention Programme (published in 2014). This contained a number of initiatives to prevent and minimise waste from households and industry. Funding has been provided for communications campaigns and waste prevention and reuse projects. Local authority collected municipal waste arising for 2017/18 are 7.8% below the 2007/08 figures despite increases to the population and business activity.
• improved treatment technologies; Emissions to air are regulated under the Environmental Permitting Regulations. Waste facilities will be required to meet Best Available Techniques (BAT) set out in the Waste Treatment BREF document.
• improved landfill management; Emissions to air are regulated under the Environmental Permitting Regulations which incorporate Landfill Directive requirements.
• waste incineration with energy use; Emissions to air are regulated under the Environmental Permitting Regulations, waste incinerators are required to meet Best Available Techniques (BAT
• improved wastewater management systems; Water companies in Wales aim to: • Review the way they manage the construction and operation of their assets and align with the circular economy approach; • Adopt proven emerging technologies and efficient control systems to minimise energy consumption and CO2 emissions; • Expand their renewable generation portfolio
• reduced landfilling;

EN 47 EN
Our Waste Strategy, Towards Zero Waste, sets landfill targets of <10% by 2020 and <5% by 2025. The current rate of landfill for Local Authority municipal waste is 9%. We have substantially reduced the landfilling of biodegradable municipal waste, which will have reduced emissions to air. The Northern Ireland Waste Management Strategy ‘Delivering Resource Efficiency’ has targets for landfill diversion. The Northern Ireland Landfill Allowance Scheme set the maximum amount of biodegradable municipal waste (BMW) that can be landfilled by local councils annually. The amount of BMW landfilled has decreased by just over 66% between 2007/08 and 2017/18. Over the same period landfilling of local authority collected municipal waste has decreased from 70.6% to 32.6%. The diversion of waste from landfill has been assisted by the introduction of the Food Waste Regulations (Northern Ireland) 2015 (explained in the’ enhanced recycling’ point above).
• other waste. Local Authorities in Wales continually strive to optimise waste collection services, reducing vehicle mileage and transport emissions. The Welsh Government will encourage local authorities to use low emission vehicle fleets, including the use of natural gas, hydrogen fuelled or electric powered vehicles.
6. Agriculture • low-emission application of fertilizer/manure on cropland and grassland;
• other activities improving cropland management;
• improved livestock management and rearing installations;
• improved animal waste management systems;
• other agriculture. 7. Cross-cutting:
• framework policy;
• multi-sectoral policy;
• other cross-cutting. 8. Other:
• Member States must provide a brief description of the objective.

EN 48 EN
The responses to the field indicated with (ᶺ) shall be filled in by using the following pre-defined reply options, to be selected as appropriate (more than one type of PaMs can be selected, additional types of PaMs could be added and specified under ‘other’) (M):
• Source-based pollution control;
• Economic instruments;
• Fiscal instruments:
• Voluntary/negotiated agreements;
• Information;
• Regulatory;
• Education;
• Research;
• Planning;
• Other, please specify.
The responses to the field indicated with (†) shall be filled in by using the following pre-defined reply options, to be selected as appropriate (more than one sector can be selected, additional sectors could be added and specified under ‘other’) (M):
• energy supply (comprising extraction, transmission, distribution and storage of fuels as well as energy and electricity production);
• energy consumption (comprising consumption of fuels and electricity by end users such as households, services, industry and agriculture);
• transport;
• industrial processes (comprising industrial activities that chemically or physically transform materials leading to greenhouse gas emissions, use of greenhouse gases in products and non-energy uses of fossil fuel carbon);
• agriculture;
EN 49 EN
• waste management/waste;
• cross-cutting;
• other sectors; please specify.
2.6.2 Impacts on air quality and the environment of individual PaMs or packages of PaMs considered in order to comply with the emission reduction commitments (M, where available)
Where available, impacts on air quality (reference can also be made to recommended air quality objectives by the WHO) and environment:
The UK sets air quality goals, informed by evidence from a range of sources. These include the World Health Organisation (WHO) 2008 guidelines, recognised as the international benchmark for setting air quality standards. The UK’s current objectives on PM2.5 stem from EU legislation. We already meet the EU limit value of 25 μg/m3 and are on track to meet the second stage limit of 20 μg/m3 by 2020. The WHO guidelines recommend an ultimate goal for concentrations of PM2.5 of 10 μg/m3. This is half of the 2020 EU limit and the WHO recognises that this represents a significant challenge. 92% of the global population currently live in areas that exceed this goal. The WHO therefore recommend a step-by-step approach to achieve progressive reductions. Reflecting this, we have set a bold new goal to progressively cut public exposure to particulate matter pollution, as suggested by the WHO. We will reduce PM2.5 levels in order to halve the number of people living in locations where concentrations of particulate matter are above 10 μg/m3 by 2025. The policies and measures put in place for tackling PM2.5 emissions will also reduce black carbon emissions as combustion from industrial and domestic sources as well as brake and tyre wear make up the

EN 50 EN
majority of emissions for this pollutant. The Scottish Government adopted the WHO guideline value in domestic legislation as an air quality objective for local authorities in 2016. The UK will monitor the impacts of air pollution on natural habitats and report through the NECD Article 9 requirements on this so that we can chart progress as we reduce the harm air pollution does to the environment. Along with the comprehensive action to control ammonia emissions from agriculture we propose a target to reduce damaging deposition of reactive forms of nitrogen, which will allow emissions reductions to be targeted to areas where they will deliver the greatest environmental benefit. These measures are expected to protect an additional 200,000 hectares of natural habitat from excessive nitrogen deposition by 2030. The UK is further committed to significant further action in order to meet the 25 Year Environment Plan goals for protecting and recovering nature (to return 75% of protected sites to favourable condition) by 2042, through the future Environmental Land Management (ELM) scheme and regulation of key source sectors. The Welsh Government is considering options in relation to adopting World Health Organisation guideline targets for air. Guideline values recommended by WHO acknowledge when formulating policy targets, governments should consider their own local circumstances carefully before adopting the guidelines directly as legally based standards. As there is no safe threshold for airborne particulate matter, the WHO recognises it is unlikely that any standard or guideline value will lead to complete protection for every individual against all possible adverse health effects of particulate matter. Rather, the standard-

EN 51 EN
setting process needs to aim at achieving the lowest concentrations possible in the context of local constraints, capabilities and public health priorities. Any future targets need to be underpinned by evidence in the context of Wales to ensure they deliver the most effective change, supporting the delivery of our well-being goals. The Welsh Government is considering the WHO guideline levels along with existing evidence across Wales to assess the practical aspects of achieving improvements in ambient concentrations.
2.6.3 Estimation of costs and benefits of the individual PaM or package of PaMs considered in order to comply with the emission reduction commitments (O)
Name and brief description of
individual PaM or package of PaMs:
Costs in EUR per tonne of
abated pollutant:
Absolute costs per year in EUR:
Absolute benefits per
year:
Cost/benefit ratio:
Price year: Qualitative description of the cost and benefit estimates:
Add more rows as appropriate
2.6.4 Additional details concerning the measures from Annex III Part 2 to Directive (EU) 2016/2284 targeting the agricultural sector to comply with the emission reduction commitments
Is the PaM included in the national air
If yes, - indicate section/page
Has the PaM been applied exactly? Yes/No (M):

EN 52 EN
pollution control programme? Yes/No (M):
number in programme: (M):
If no, describe the modifications that have been made (M):
A. Measures to control ammonia emissions (M):
1. Member States shall establish a national advisory code of good agricultural practice to control ammonia emissions, taking into account the UNECE Framework Code for Good Agricultural Practice for Reducing Ammonia Emissions of 2014, covering at least the following items : a) nitrogen management, taking into account the whole
nitrogen cycle; b) livestock feeding strategies; c) low-emission manure spreading techniques; d) low-emission manure storage systems; e) low-emission animal housing systems; f) possibilities for limiting ammonia emissions from the use of
mineral fertilisers.
Yes Table 2.3.1 Yes – in England Yes – in Wales. The Welsh Government will publish guidance by 31March 2019. Yes – in Northern Ireland. The Department of Agriculture, Environment and Rural Affairs are currently developing a Code for Good Agricultural Practice.
2. Member States may establish a national nitrogen budget to monitor the changes in overall losses of reactive nitrogen from agriculture, including ammonia, nitrous oxide, ammonium, nitrates and nitrites, based on the principles set out in the UNECE Guidance Document on Nitrogen Budgets :
No

EN 53 EN
3. Member States shall prohibit the use of ammonium carbonate fertilisers and may reduce ammonia emissions from inorganic fertilisers by using the following approaches: a) replacing urea-based fertilisers by ammonium nitrate-based
fertilisers; b) where urea-based fertilisers continue to be applied, using
methods that have been shown to reduce ammonia emissions by at least 30 % compared with the use of the reference method, as specified in the Ammonia Guidance Document;
c) promoting the replacement of inorganic fertilisers by organic fertilisers and, where inorganic fertilisers continue to be applied, spreading them in line with the foreseeable requirements of the receiving crop or grassland with respect to nitrogen and phosphorus, also taking into account the existing nutrient content in the soil and nutrients from other fertilisers.
Yes.
Table 2.6.1 Ammonium carbonate fertilisers are not used in the UK. The sale and use of ammonium carbonate fertilisers is not enabled in the UK either through the Fertilisers Regulations 1991 (in England, Wales and Scotland), the Fertilisers Regulations (Northern Ireland) 1992 (in Northern Ireland), or the EU Fertilisers Regulation (Regulation (EC) No. 2003/2003 of the European Parliament and of the Council relating to fertilisers). The Welsh Government provides advice to farmers on Nutrient

EN 54 EN
Management Planning through Farming Connect to reduce the amount of fertiliser used. In Northern Ireland, free training in nitrates and nutrient management planning is provided to farmers through the College of Agriculture, Food and Rural Enterprise.
4. Member States may reduce ammonia emissions from livestock manure by using the following approaches:
a) reducing emissions from slurry and solid manure application to arable land and grassland, by using methods that reduce emissions by at least 30 % compared with the reference method described in the Ammonia Guidance Document and on the following conditions:
i. only spreading manures and slurries in line with the foreseeable nutrient requirement of the receiving crop or grassland with respect to nitrogen and phosphorous, also taking into account the existing nutrient content in the soil and the nutrients from other fertilisers;
Yes Table 2.6.1 Welsh Government 4a: • NMP via Farming
Connect/Glastir • Cross
compliance • RDP funding to
purchase/use low trajectory slurry applicators.

EN 55 EN
ii. not spreading manures and slurries when the receiving land is water saturated, flooded, frozen or snow covered;
iii. applying slurries spread to grassland using a trailing hose, trailing shoe or through shallow or deep injection;
iv. incorporating manures and slurries spread to arable land within the soil within four hours of spreading;
b) reducing emissions from manure storage outside of animal houses, by using the following approaches:
i. for slurry stores constructed after 1 January 2022, using low emission storage systems or techniques which have been shown to reduce ammonia emissions by at least 60 % compared with the reference method described in the Ammonia Guidance Document, and for existing slurry stores at least 40 %;
ii. covering stores for solid manure; iii. ensuring farms have sufficient manure storage capacity
to spread manure only during periods that are suitable for crop growth:
c) reducing emissions from animal housing, by using systems which have been shown to reduce ammonia emissions by at least 20 % compared with the reference method described in the Ammonia Guidance Document;
d) reducing emissions from manure, by using low protein feeding strategies which have been shown to reduce ammonia emissions by at least 10 % compared with the reference method described in the Ammonia Guidance Document.
4b: • RDP funding for
covered manure stores
4a and b are potential delivery mechanisms for the delivery of improved air quality public goods and are therefore candidate actions to be included in the proposed public goods scheme.
Northern Ireland has provided RDP funding for a range of ammonia reduction technologies including low emission slurry spreading and covers for slurry stores.

EN 56 EN
B. Emission reduction measures to control emissions of fine particulate matter (PM2.5) and black carbon (M)
1. Without prejudice to Annex II on cross-compliance of Regulation (EU) No 1306/2013 of the European Parliament and of the Council (1), Member States may ban open field burning of agricultural harvest residue and waste and forest residue. Member States shall monitor and enforce the implementation of any ban implemented in accordance with the first subparagraph. Any exemptions to such a ban shall be limited to preventive programmes to avoid uncontrolled wildfires, to control pest or to protect biodiversity.
Yes Table 2.3.1
2. Member States may establish a national advisory code of good agricultural practices for the proper management of harvest residue, on the basis of the following approaches:
a) improvement of soil structure through incorporation of harvest residue;
b) improved techniques for incorporation of harvest residue; c) alternative use of harvest residue; d) improvement of the nutrient status and soil structure
through incorporation of manure as required for optimal plant growth, thereby avoiding burning of manure (farmyard manure, deep-straw bedding).
No
C. Preventing impacts on small farms (M)
In taking the measures outlined in Sections A and B, Member States shall ensure that impacts on small and micro farms are fully taken into account. Member States may, for instance, exempt small
Yes A full impact assessment will be carried out prior to implementing all

EN 57 EN
and micro farms from those measures where possible and appropriate in view of the applicable reduction commitments (M):
regulatory policies and the impacts on small and micro farms will be considered as part of this assessment.

EN 58 EN
2.7 The policies selected for adoption by sector, including a timetable for their adoption, implementation and review and the competent authorities responsible
2.7.1 Individual PaMs or package of PaMs selected for adoption and the competent authorities responsible Name and brief description of individual PaM or package of PaMs (M): Refer to those listed in table 2.6.1 as appropriate.
Currently planned year of adoption (M):
Relevant comments arising from consultation(s) in relation to the individual PaM or package of PaMs (O):
Currently planned timetable for implementation (M)
Interim targets and indicators selected to monitor progress in implementation of the selected PaMs (O):
Currently planned timetable for review (in case different from general update of the national air pollution control programme every four years) (M):
Competent authorities responsible for the individual PaM or
package of PaMs (M): Refer to those listed in table 2.3.2 as appropriate.
Start
year End year
Interim Targets
Indicators
Road transport package
2019 2019 Beyond 2030
No different from general update
DfT, BEIS, WG, LAs
Shipping package
2019 2019 Beyond 2030
No different from general update
DfT
Other transport package
2019 2019 Beyond 2030
No different from general update
DfT, Defra, LAs
Domestic package
2019 2019 Beyond 2030
No different from general update
Defra, DAERA, SG, WG, LAs

EN 59 EN
Agriculture package
2019 2019 2027 No different from general update
Defra, DAERA, SG, WG,
Industry package
2019 2019 Beyond 2030
No different from general update
Defra, DAERA, SG, WG, EA, SEPA, NRW, NIEA
Insert more rows as appropriate

EN 60 EN
2.7.2 Explanation of the choice of selected measures and an assessment of how selected PaMs ensure coherence with plans and programmes set up in other relevant policy areas
An explanation of the choice made among the measures considered under 2.6.1 to determine the final set of selected measures (O)
Coherence of the selected PaMs with air quality objectives at national level and, where appropriate, in neighbouring Member States (M):
As discussed in table 2.6.2, our package of measures will lead the way in reducing exposure to particulate matter for the UK population and we will halve the number of people living in locations where concentrations of particulate matter are above 10 μg/m3 by 2025.
Coherence of the selected PaMs with other relevant plans and programmes established by virtue of the requirements set out in national or Union legislation (e.g. national energy and climate plans) (M):
The packages selected for inclusion in the UK’s NAPCP have been analysed both in terms of pollution and GHG abatement, to ensure that these two key policy objectives are tackled together. Analysis indicates that our selected PaMs will reduce GHG emissions by between 2.2 and 2.9 Mt CO2e per annum by 2030. More widely, we will work across government to realise the opportunities for mitigating climate change and improving air quality. For example, the Renewable Heat Incentive (RHI) is a government subsidy scheme for eligible renewable heating technology, including biomass. The RHI has air quality requirements that participants using biomass are required to meet before they can claim support under the scheme. These include: limits on the emissions of particulate matter (PM) and oxides of nitrogen (NOX), a requirement to use sustainable fuel that is listed on the emissions certificate of the accredited boiler, and an annual obligation to submit relevant permits and exemptions to evidence compliance

EN 61 EN
with all local and national environmental regulations, including those relating to air quality impacts. As outlined in the Clean Air Strategy, Defra and BEIS have worked together closely on a cross-departmental review into the role of biomass for heat and power, establishing a framework of principles and processes to ensure air quality is considered at the outset of policy development, and that appropriate tools and evidence are used to assess the impact on public health. Building on the framework established for bioenergy, we seek to strengthen the collaboration between Defra and BEIS, so that we fairly and objectively articulate the trade-offs between energy and public health when developing strategies to meet air quality and carbon targets. Similarly, the UK Department for Transport has committed to end the sale of conventional petrol and diesel cars and vans by 2040, and this is factored into our NAPCP analysis.
2.8 Projected combined impacts of PaMs ('With Additional Measures' - WAM) on emission reductions, air quality and the environment and the associated uncertainties (where applicable)
2.8.1 Projected attainment of emission reduction commitments (WAM) Numbers in square brackets assume that where Clean Air Strategy polices relate to devolved powers they are applied in England only
Total emissions (kt), consistent with inventories for year x-2 or x-3 , please specify the year (M):
% emission reduction achieved compared with 2005 (M)
National emission reduction commitment for 2020-2029 (%) (M):
National emission reduction commitment from 2030 (%) (M):

EN 62 EN
Pollutants (M)
2005
bas
e ye
ar
2020
2025
2030
2020
2025
2030
SO2: 773 123
[123]
67 to 86
[74 to 89]
40 to 55
[48 to 61]
84%
[84%]
89% to 91%
[88% to 90%]
93% to 95%
[92% to 94%] 59% 88%
NOx: 1,714 725 to 726
[725 to 726]
507 to 574
[518 to 578]
405 to 476
[419 to 482]
58%
[58%]
67% to 70%
[66% to 70%]
72% to 76%
[72% to 76%] 55% 73%
NMVOC: 1,042
667
[667]
609 to 654
[619 to 657]
626 to 664
[636 to 669]
36%
[36%]
37% to 42%
[37% to 41%]
36% to 40%
[36% to 39%] 32% 39%
NH3: 288 253 to 279
[253 to 279]
231 to 276
[231 to 276]
214 to 277
[214 to 277]
3% to 12%
[3% to 12%]
4% to 20%
[4% to 20%]
4% to 26%
[4% to 26%] 8% 16%
PM2.5: 127 89
[89]
69 to 78
[73 to 80]
61 to 71
[66 to 74]
30%
[30%]
39% to 46%
[38% to 43%]
44% to 52%
[42% to 48%] 30% 46%
Date of emission projections (M): March 2018
2.8.2 Non-linear emission reduction trajectory Where a non-linear emission reduction trajectory is followed, demonstrate that it is technically or economically more efficient (alternative measures would involve entailing disproportionate costs), will not compromise the achievement of any reduction commitment in 2030, and that the trajectory will converge on the linear trajectory from 2025 onwards (M, where relevant): Refer to costs listed in table 2.6.3 as appropriate.
The UK trajectories between 2020 and 2030 tend to be linear, except for NMVOCs. In this case a linear trajectory is not appropriate as a significant proportion of NMVOC emissions proposed for abatement are from household products. The abatement of those products will therefore be driven in part by population growth and therefore increases in use (activity) of those products.

EN 63 EN
The trajectory proposed reflects the fact that although the abatement is economically efficient, the abatement and underlying activity growth will counteract each other due to population growth. It is therefore a more realistic trajectory than assuming a linear relationship. Emission abatement will be steeper in the years 2019-2025, and less steep in the years 2025-2030. This non-linear trajectory will not compromise the achievement of any reduction commitment in 2030.
2.8.3 Flexibilities Where flexibilities are used, provide an account of their use (M):
n/a
2.8.4 Projected improvement in air quality (WAM) A. Projected number of non-compliant and compliant air quality zones (O)
AAQD values:
Projected number of non-compliant air quality zones:
Projected number of compliant air quality zones:
Total number of air quality zones:
Spec
ify
base
yea
r:
2020
:
2025
:
2030
:
Spec
ify
base
yea
r:
2020
:
2025
:
2030
:
Spec
ify
base
yea
r:
2020
:
2025
:
2030
:
PM2.5 (1 yr):

EN 64 EN
NO2 (1 yr):
PM10 (1 yr):
O3 (max 8 hr mean):
Other (please specify):
B. Maximum exceedances of air quality limit values and average exposure indicators (O):
AAQD values:
Projected maximum exceedances of air quality limit values across all zones:
Projected average exposure indicator (only for PM2.5 (1 year):
Spec
ify
base
ye
ar:
2020
:
2025
:
2030
:
Spec
ify
base
ye
ar:
2020
:
2025
:
2030
:
PM2.5 (1 yr):
NO2 (1 yr):
NO2 (1 hr):
PM10 (1 yr):
PM10 (24 hrs):
O3 (max 8 hr mean):
Other (please specify):

EN 65 EN
C. Illustrations demonstrating the projected improvement in air quality and degree of compliance (O)
Maps or histograms illustrating the projected evolution of ambient air concentrations (for at least NO2, PM10, PM2.5 and O3, and any other pollutant(s) that present(s) a problem) and which show, for instance, the number of zones, out of the total air quality zones, that will be (non)compliant by 2020, 2025 and 2030, the projected maximum national exceedances, and the projected average exposure indicator:
D. Qualitative projected improvement in air quality and degree of compliance (WAM) (in case no quantitative data is provided in the tables above) (O)
Qualitative projected improvement in air quality and degree of compliance (WAM):
For annual limit values, projections should be reported against the maximum concentrations across all zones. For daily and hourly limit values, projections should be reported against the maximum number of exceedances registered across all zones.
2.8.5 Projected impacts on the environment (WAM) (O)
Base year used to assess environmental impacts (please specify:
2020: 2025: 2030: Description:
Member State territory exposed to acidification in exceedance of the critical load threshold (%):

EN 66 EN
Member State territory exposed to eutrophication in exceedance of the critical load threshold (%):
Member State territory exposed to ozone in exceedance of the critical level threshold (%):
Indicators should be aligned with those used under the Convention on Long Range Transboundary Air Pollution on exposure of ecosystems to acidification, eutrophication and ozone1.
1 https://www.rivm.nl/media/documenten/cce/manual/Manual_UBA_Texte.pdf