Air Lease CorporationAnnual Report 2013 · consult with OEMs as they develop the next generation of...
78
Air Lease Corporation Annual Report 2013
Transcript of Air Lease CorporationAnnual Report 2013 · consult with OEMs as they develop the next generation of...

Air Lease Corporation Annual Report 2013

On the Leading Edge of Aviation

ALC is a leading
aircraft leasing company based in
Los Angeles, California. ALC and its team of dedicated
and experienced professionals are principally engaged in purchasing
new commercial aircraft delivering from its direct orders with Boeing, Airbus, Embraer,
and ATR, and leasing them to its airline customers worldwide through customized aircraft leasing and
financing solutions. The mission of ALC is to work with these airlines to modernize and grow their fleets,
consult with OEMs as they develop the next generation of fuel-efficient and environmentally friendly aircraft, and
continue to explore strategic business solutions for our clients to support their growth and success. Beyond lease expertise,
ALC offers route and schedule analysis, fleet optimization and planning, aircraft and engine purchasing consulting, aircraft procurement
services, aircraft financing support, aircraft investment analysis and recommendations, and can act as global servicer and manager
for aircraft lease portfolios.

t w o
february 5th
$400 Million of Unsecured Senior
Notes Issued
march 11th
$77 Million of Notes Issued
and Guaranteed by the
Export-Import Bank of the
United States
may 7th
Closed a $1.7 Billion
4 Year Unsecured
Revolving Bank Facility
may 9th
Kroll Bond Rating Agency
Initiated a Corporate Credit
Rating of A- for ALC
expanding access to capital

A TIMELINE Of OuR MAjOR AChIEvEMENTs
As an investment grade company, we have significantly expanded the
breadth and depth of financing sources available to us. Unsecured funding
grew by $2.7 billion primarily through capital markets transactions and our
agented bank revolver.
t h r e e
auGust 26th
Standard and Poor’s Rating
Agency Initiated a Corporate
Credit Rating of BBB- for ALC
NOVember 19th
$700 Million of Unsecured Senior
Notes Issued with Investment
Grade Ratings
NOVember 4th
Upsized the Unsecured Revolving
Bank Facility to $2 Billion
Rolls-Royce’s Trent 1000 is the launch engine for the Boeing 787 Dreamliner family of aircraft
OctOber 1st
$185 Million Private Placement of
Unsecured Senior Notes Issued
with an NAIC 1 Rating

balance sheet strength
f o u r
2.3 to 1
$5.9b $2.5b
Debt to equity
Outlook
credit ratings
Agency Rating
stablestandard & Poor’s ratings services bbb-
stableKroll bond rating agency a-
secured Debt to total assets SECURED DEBT ToTAL ASSETS
34.5%2011
23.8%2012
16.7%2013

Proven Performance
f i v e
revenue and Pretax Income
REvENUE
PRETAx INCoME
PRETAx MARGIN
2013
34.2%
$293m
$859m
31.1%
$656m
24.6%
20122011
$491m
$654m
cash flow from Operations
$267m2011
2012
2013
contracted minimum future rentals on existing fleet at year end
2011
$2.3b
2012
$5.0b
2013
$6.2b
$337m
$83m
$204m

TOTAL AIRCRAfT ON ORdER ThROugh 2023
327
As A LEAdINg CusTOMER Of BOEINg ANd AIRBus,
we now control one of the largest order books in the aircraft leasing industry. our pipeline of aircraft deliveries over the next decade ensures that we will have the most modern and in-demand narrowbody and widebody aircraft in our fleet.
Our Pipeline for continued Growth
2014 2015
13
135
4
6
20
8
1
s i x

s e v e n
2016 2017 2018
153
2
1112
1
15
7
1
8
OuR dELIvERy PIPELINE ThROugh 2023
Aircraft Type Total
AIRBUS A321-200 19
AIRBUS A320/321NEo 50
AIRBUS A350 xWB 30
BoEING 737-800 59
BoEING 737-8/9 MAx 104
BoEING 777-300ER 15
BoEING 787-9/10 45
ATR 72-600 5
TOTAL 327
TOTAL fORwARd ORdER BOOk ThROugh 2023
$27.3B

boeing 787 Dreamliner
e i g h t
Adding to our existing order base of 787-9 aircraft, ALC became a launch customer of Boeing’s 787-10 when
the company committed to an order of 30 of the newest high capacity version Dreamliner in June. These
aircraft possess the characteristics airlines desire by offering the ideal size, capabilities and economical
operating costs for their medium to long-haul markets. According to Boeing, the 787-10 delivers higher profit
on high-demand core markets, generating leading economics in the sky. With a range of up to 7,000 nautical
miles and seating for up to 330 passengers, the 787-10 combines enhanced technology, improved passenger
experience, and strong operational metrics that customers have come to expect from ALC’s fleet of high
performance aircraft.

n i n e
airbus a350In February ALC contributed to one of the most successful commercial launches in the aircraft industry by
committing to 30 Airbus A350 xWB (xtra-Wide Body) Family aircraft. The A350 xWB Family is becoming
a leader in efficiency in the long haul segment. The A350 xWB is an all-new mid-size long range product
line comprising three versions and seating between 270 and 350 passengers in typical three-class layouts.
Airbus reports that the new family will bring a step change in efficiency compared with an earlier generation
aircraft in this size category, using 25 percent less fuel and providing an equivalent reduction in Co2 emis-
sions. These aircraft will help airlines grow their businesses while simultaneously reducing their operating
costs and emissions. The A350 xWB is an excellent addition to the ALC fleet as the company continues to
supply customers with the technologically advanced, fuel-efficient aircraft demanded by the market.

t e n
ALC AddEd 13 NEw AIRLINE CusTOMERs IN 2013,
bringing our count to 79 airlines across 47 countries at the end of the year. We
maintain a globally diversified portfolio of customers, balancing exposures by
country, region, and individual airline in our efforts to create the strongest
credit profile for an aircraft lessor.
a Global Network of customers
eurOPe
asIa PacIfIc
LatIN amerIca
NOrth amerIca
afrIca & mIDDLe east

e l e v e n
aNtIGua aND barbuDa LIAT
austraLIa QAnTAs
VIetNam Vietnam Airlines
beLarus Belavia
brazIL Azul, Gol Airlines, Passaredo Linhas Aereas, TrIP Linhas Aereas
buLGarIa Bulgaria Air
caNaDa Air Canada, sunwing Airlines, WestJet
cOLOmbIa Avianca
czech rePubLIc Travel service
DeNmarK Jet Time
eL saLVaDOr TACA
eNGLaND Thomas Cook
ethIOPIa Ethiopian Airlines
fraNce Air Austral, Air France
GeOrGIa Georgian Airways
GermaNy airberlin
hONG KONG Cathay Pacific Airways
INDIa spiceJet
INDONesIa Garuda Indonesia, Kalstar Aviation
ItaLy Alitalia
JaPaN skymark Airlines
KazaKhstaN Air Astana
KeNya Kenya Airways
maLaysIa AirAsia
maLDIVes Maldivian
mexIcO Aeromar, Aeromexico, Interjet, Volaris
mONGOLIa MIAT Mongolian Airlines
NetherLaNDs KLM, transavia.com
New zeaLaND Air new Zealand
NOrway norwegian Air shuttle
PaKIstaN airblue
POLaND Bingo Airways
russIa s7 Airlines, Transaero Airlines
sauDI arabIa nAs air
sOuth afrIca south African Airways
sOuth KOrea Asiana Airlines, Jeju Air, Korean Air
sPaIN Vueling
srI LaNKa Mihin Lanka, sriLankan Airlines
sweDeN TUIFly nordic
swItzerLaND sWIss
thaILaND Orient Thai Airlines
trINIDaD aND tObaGO Caribbean Airlines
turKey Corendon Airlines, sunExpress
uae Emirates, Etihad Airways
usa Hawaiian Airlines, spirit Airlines, sun Country, southwest Airlines, United Airlines
mOzambIque LAM Mozambique Airlines
Air China, Air Macau, China Eastern Airlines, China Eastern Yunnan, China southern Airlines, China United,Dalian Airlines, Hainan Airlines, shanghai Airlines, sichuan Airlines, spring Airlines, Xiamen Airlines
chINa

t w e l v e
s t e v e n f. u D vA r - h Á Z Y
C h A i r M A n & C h i e f e x e C u t i v e o f f i C e r
J o h n l . P l u e g e r
P r e s i D e n t & C h i e f o P e r At i n g o f f i C e r

t h i r t e e n
TO OuR fELLOw shAREhOLdERs
2013 was a year of continued dynamic growth in our business. we expanded our global
airline customer base, increased our future contracted aircraft delivery stream, and
broadened our financing sources. AlC grew all of its key operating metrics in 2013 and
punctuated the year by achieving the company’s highest pretax operating profit margin to
date of 37.3% in the fourth quarter.
we added 13 new airline customers to finish the year with 79 airline clients across 47
countries. our fleet remains very young with long leases to a globally diversified group of
airlines, which strongly enhances the company’s credit profile. All of the aircraft in our
fleet are leased with a stable overall portfolio lease rate factor. we’ve concluded all air-
craft placements scheduled for delivery in 2014 and 2015 at profitable levels and we are
now focused on 2016 and beyond.
Another year of global passenger traffic growth over 5% has generated strong demand
for our future aircraft deliveries and positions the company very well to continue to help
airlines modernize aging aircraft fleets. while the global economy has continued to work
through a recovery from the financial crisis, the airline industry has been resilient. efforts
to restructure or merge have allowed airlines to cut costs, rationalize capacity, and mod-
ernize their fleets over the last few years and we see this trend continuing. As a result, in
2013 airline operating performances were generally improved. our seasoned manage-
ment team is highly experienced in bringing fleet and other solutions to help mitigate the
economic, political, currency, and operating challenges faced by our customers and work
with them to build healthy airlines better able to withstand future headwinds.
we have responded to the needs of our airline customers by continuing to deliver new
aircraft from our pipeline, consistent with our long-term fleet growth plan. in february, we
concluded an order for 25 firm A350 xwB family aircraft, consisting of 20 A350-900s and
five A350-1000s, and options for five additional A350-1000s. Also in february, we placed
an order for 10 additional Boeing 777-300ers adding to five previously ordered aircraft,
all 15 of which have been placed on long-term leases. At the le Bourget Airshow in June,
we announced our launch order for 30 Boeing 787-10 and three additional B787-9 aircraft.
we now have 327 aircraft on order through 2023, which further secures a consistent
stream of aircraft delivery positions that our customers demand. these aircraft are the
most modern narrowbody and widebody aircraft manufactured by Boeing and Airbus that
will dominate the skies for the coming decades. we control one of the largest order books
in the aircraft leasing industry and are pleased with the volume pricing that we have
obtained as one of the largest customers for Boeing and Airbus. when combined with
favorable funding costs and a strong balance sheet, we are able to deliver competitive
lease terms to our airline customers and generate solid returns for our shareholders.
Consistent with our view of the healthy, long-term prospects for air travel, in 2013 we saw
the global banking industry return to a favorable view of the airline sector. Additionally,
this year the capital markets have allowed a wide array of companies in our industry to
access the markets. we view this positively as a broadening universe of investors under-
stand the desirability and value in aircraft leasing and aircraft assets. these new sources
are helping to fill the funding gap that exists between the capital base of current lessors
and the amount of capital required to finance the leased aircraft in the global fleet.

f o u r t e e n
2013 provided two significant developments to our financial profile, when we received a
BBB- corporate credit rating from standard and Poor’s and an A- corporate credit rating
from Kroll Bond rating Agency. As an investment grade company, we have significantly
expanded the breadth and depth of financing sources available to us. one of the strategic
goals of AlC remains to finance the company primarily through unsecured debt issuances.
we believe that to achieve superior results, an investment grade profile is necessary for
the best access to capital through cycles and optimal positioning when opportunities
present themselves. in our industry, AlC has generated excellent credit metrics, based on
a globally diversified portfolio of aircraft and airline customers, conservative balance
sheet, young fleet, long leases and leading financial performance. we believe these met-
rics will allow for ratings upgrades in the future.
owing to the financial success of the company since inception four years ago, in 2013 our
Board instituted a quarterly dividend on our outstanding common stock and increased the
amount of the dividend during the year. the dividend helps to enhance shareholder returns
and broadens our investor base, yet allows for the continued strong growth of the company.
we are grateful to our dedicated team of experienced professionals at AlC, our loyal air-
line customers, and our bankers and investors who have shared our vision to build the
best aircraft leasing company in the world.
respectfully yours,
s t e v e n f . u D v A r - h Á Z Y
C h A i r M A n & C h i e f e x e C u t i v e o f f i C e r
J o h n l . P l u e g e r
P r e s i D e n t & C h i e f o P e r A t i n g o f f i C e r

1 5
Financial Review
2013 Review 16
Report of Independent Registered Public Accounting Firm 43
Consolidated Balance Sheets 44
Consolidated Statements of Income 45
Consolidated Statements of Shareholders’ Equity 46
Consolidated Statements of Cash Flows 47
Notes to Consolidated Financial Statements 49
Selected Financial Data 70
Leadership Team 74
Table of Contents
f i f t e e n
2013 Review
S i X t e e n
BUSINESSOverview
Air Lease Corporation (the “Company,” “ALC,” “we,” “our” or “us”), is a leading aircraft leasing company that was founded by aircraft leasing industry pioneer, Steven f. Udvar-Házy. We are principally engaged in purchasing new commercial jet transport aircraft directly from the manufacturers, such as the Boeing Company (“Boeing”) and Airbus S.A.S. (“Airbus”), and leasing those aircraft to airlines throughout the world to generate attractive returns on equity. in addition to our leasing activities, we sell aircraft from our operating lease portfolio to third parties, including other leas-ing companies, financial services companies and airlines. We also provide fleet management services to investors and owners of aircraft portfolios for a management fee.
We currently have relationships with over 200 airlines across 70 countries. We operate our business on a global basis, providing aircraft to airline customers in every major geographical region, including markets such as Asia, the Pacific Rim, Latin America, the Middle east and eastern europe. Many of these markets are experiencing increased demand for passenger airline travel and have lower market saturation than more mature markets such as north America and Western europe. We expect that these markets will also present significant replacement opportunities in upcoming years as some airlines in these markets look to replace aging aircraft with new, modern technology, fuel-efficient jet aircraft. An important focus of our strategy is meeting the needs of this replacement market. Airlines in some of these markets have fewer financing alternatives, enabling us to command relatively higher lease rates compared to those in more mature markets.
We mitigate the risks of owning and leasing aircraft through careful management and diversification of our leases and lessees by geography, lease term, and aircraft age and type. We believe that diversification of our operating lease portfolio reduces the risks associated with individual lessee defaults and adverse geopolitical and regional economic events. We mitigate the risks associated with cyclical variations in the airline industry by managing customer concen-trations and lease maturities in our operating lease portfolio to minimize periods of concentrated lease expirations. in order to maximize residual values and minimize the risk of obsolescence, our strategy is to own an aircraft during the first third of its 25-year useful life.
As of December 31, 2013, we owned 193 aircraft in our operating lease portfolio and we leased the aircraft to a glob-ally diversified customer base comprised of 79 airlines in 47 countries. the weighted-average lease term remaining of our operating lease portfolio was 7.1 years and the weighted-average age of our fleet was 3.7 years. During 2013 we entered into commitments to purchase up to 73 additional aircraft from Airbus and Boeing. from Airbus, we agreed to purchase up to 30 A350 XWB family aircraft, five of which are subject to reconfirmation. from Boeing, we agreed to purchase an additional 10 Boeing 777-300eR aircraft, 30 787-10 aircraft and three additional 787-9 aircraft. At December 31, 2013, we had, in the aggregate, 327 aircraft on order with Boeing, Airbus and Avions de transport Régional (“AtR”) for delivery through 2023, with an estimated aggregate purchase price of $27.3 billion, making us one of the largest customers of Boeing and Airbus.
As of December 31, 2013, all of our 193 aircraft were leased and our airline customers are obligated to make $6.2 bil-lion in minimum future rental payments over the non-cancelable lease term. in addition, we have signed lease agree-ments for 98 aircraft that we ordered from the manufacturers for delivery through 2023, and our airline customers are contractually obligated to make $7.2 billion in minimum future rental payments over the non-cancelable lease term. in the aggregate, between aircraft we own in our operating lease portfolio and those that we have leased from our orderbook, our customers are contractually obligated to make $13.4 billion in minimum future rental payments.

S e V e n t e e n
We finance the purchase of aircraft and our business with available cash balances, internally generated funds, includ-ing aircraft sales and trading activity, and debt financings. Our debt financing strategy is focused on raising unsecured debt in the global bank and capital markets, with a limited utilization of export credit financing. in 2013, the Company received two corporate credit ratings lowering our cost of funds and broadening our access to attractively priced capital. Since our inception in 2010, we have developed a 43-member, globally diversified banking group, which has provided us in excess of $4.4 billion in financing, and we have raised $3.3 billion in financing in the capital markets. We ended 2013 with total debt outstanding of $5.9 billion, of which 62.0% was at a fixed rate and 73.5% of which was unsecured, with a composite cost of funds of 3.60%.
in 2013, we had total revenues of $858.7 million, representing an increase of $202.9 million or 30.9% compared to 2012. this is comprised of rental revenues on our operating lease portfolio of $836.5 million and aircraft sales, trading and other revenue of $22.2 million. Our composite cost of funds as of December 31, 2013 decreased by 0.34% com-pared to the prior year. We recorded earnings before income taxes of $293.4 million in 2013, an increase of $89.5 million or 43.9% compared to 2012, for a pretax profit margin of 34.2%. Our operating performance is principally driven by the growth of our fleet, the terms of our leases and the interest rates on our indebtedness, supplemented by the gains of our aircraft sales and trading activities.
Operations to Date
Current FleetOur fleet is principally comprised of fuel-efficient and newer technology aircraft, consisting of narrowbody aircraft, such as the Boeing 737-700/800, the Airbus A320/321 and the embraer e190, select widebody aircraft, such as the Boeing 777-300eR and the Airbus A330-200/300, and the AtR 72-600 turboprop aircraft. As of December 31, 2013, we owned 193 aircraft, comprised of 146 narrowbody jet aircraft, 31 widebody jet aircraft and 16 turboprop aircraft, with a weighted-average age of 3.7 years. As of December 31, 2012, we owned 155 aircraft, comprised of 118 narrowbody jet aircraft, 27 widebody jet aircraft and 10 turboprop aircraft, with a weighted-average age of 3.5 years.
Geographic DiversificationOver 90% of our aircraft are operated internationally. the following table sets forth the dollar amount and percentage of our rental of flight equipment revenues attributable to the respective geographical regions based on each airline’s principal place of business:
Year ended December 31, 2013
Year ended December 31, 2012
Year ended December 31, 2011
Region
Amount of Rental
Revenue% of total
Amount of Rental
Revenue% of total
Amount of Rental
Revenue% of total
(dollars in thousands)
Asia/Pacific $314,908 37.6% $215,537 33.4% $ 93,237 28.0%europe 300,761 35.9% 253,376 39.2% 151,566 45.6%Central America, South America and Mexico 107,857 12.9% 84,341 13.1% 30,714 9.2%U.S. and Canada 57,366 6.9% 53,201 8.2% 39,350 11.8%the Middle east and Africa 55,624 6.7% 39,398 6.1% 17,852 5.4%
total $836,516 100.0% $645,853 100.0% $332,719 100.0%

e i G H t e e n
the following table sets forth the regional concentration of our aircraft portfolio based on net book value as of December 31, 2013, 2012 and 2011:
December 31, 2013 December 31, 2012 December 31, 2011
Regionnet Book
Value% of total
net Book Value
% of total
net Book Value
% of total
(dollars in thousands)
Asia/Pacific $3,317,118 43.6% $2,245,002 35.9% $1,355,432 32.0%europe 2,656,816 34.9% 2,398,531 38.4% 1,782,949 42.1%Central America, South America and Mexico 829,930 10.9% 788,189 12.6% 515,145 12.2%U.S. and Canada 436,653 5.7% 457,546 7.3% 386,101 9.1%the Middle east and Africa 372,618 4.9% 362,595 5.8% 197,789 4.6%
total $7,613,135 100.0% $6,251,863 100.0% $4,237,416 100.0%
At December 31, 2013, 2012 and 2011, we leased aircraft to customers in the following regions:
December 31, 2013 December 31, 2012 December 31, 2011
Regionnumber of
Customers(1)
% of total
number of Customers(1)
% of total
number of Customers(1)
% of total
Asia/Pacific 31 39.2% 28 40.6% 22 40.0%europe 21 26.6% 17 24.6% 13 23.6%Central America, South America and Mexico 12 15.2% 9 13.0% 8 14.6%U.S. and Canada 8 10.1% 8 11.6% 7 12.7%the Middle east and Africa 7 8.9% 7 10.2% 5 9.1%
total 79 100.0% 69 100.0% 55 100.0%
(1) A customer is an airline with its own operating certificate.
in 2013, one country represented at least 10% of our rental of flight equipment revenue. for the year ended December 31, 2013, China attributed for $129.8 million or 15.5% of our rental of flight equipment revenue. in 2012, three countries represented at least 10% of our rental of flight equipment revenue. for the year ended December 31, 2012, China attributed for $75.5 million or 11.7% of our rental of flight equipment revenue, italy attributed for $71.0 million or 11.0% of our rental of flight equipment revenue and france attributed for $67.4 million or 10.4% of our rental of flight equip-ment revenue. in 2011, two countries represented at least 10% of our rental of flight equipment revenue. for the year ended December 31, 2011, China attributed for $39.6 million or 11.9% of our rental of flight equipment revenue and france attributed for $62.2 million or 18.7% of our rental of flight equipment revenue.
in 2013, no individual airline represented at least 10% of our rental of flight equipment revenue. in 2012, one airline represented at least 10% of our rental of flight equipment revenue. for the year ended December 31, 2012, Alitalia attributed for $71.0 million or 11.0% of our rental of flight equipment revenue. in 2011, one airline represented at least 10% of our rental of flight equipment revenue. for the year ended December 31, 2011, Air france attributed for $45.4 million or 13.7% of our rental of flight equipment revenue.

n i n e t e e n
Aircraft Acquisition Strategy
We operate our business on a global basis, leasing aircraft to airline customers in every major geographical region of the world. Our primary strategy is to order new aircraft in bulk directly from the manufacturers to minimize the acquisi-tion price. We seek to acquire the most highly in demand and widely distributed, modern technology, fuel-efficient narrowbody and widebody commercial jet transport aircraft. When placing new aircraft orders with the manufactur-ers, we strategically target the replacement of aging aircraft with modern technology aircraft. Additionally, we look to supplement our order pipeline with opportunistic purchases of aircraft in the secondary market and participate in sale-leaseback transactions with airlines.
Prior to ordering aircraft, we evaluate the market for specific types of aircraft. We consider the overall demand for the aircraft in the marketplace based on our deep knowledge of the aviation industry and our customer relationships. it is important to assess the airplane’s economic viability, the operating performance characteristics, engine variant options, intended utilization by our customers, and which aircraft types it will replace or compete with in the global market. Additionally, we study the effects of global airline passenger traffic growth in order to determine the likely demand for our new aircraft.
for new aircraft deliveries, we source many components separately, which include seats, safety equipment, avionics, galleys, cabin finishes, engines and other equipment. Oftentimes we are able to achieve lower pricing through direct bulk purchase contracts with the component manufacturers than would be achievable if the airframe manufacturers sourced the components for the airplane. Manufacturers such as Boeing and Airbus install this buyer-furnished equip-ment in our aircraft during the final assembly process at their facilities. With this purchasing strategy, we are able to meet specific customer configuration requirements and lower the total acquisition cost of the aircraft.
Aircraft Leasing Strategy
the airline industry is a complex industry with constantly evolving competition, code shares (where two or more air-lines share the same flight), alliances and passenger traffic patterns. this requires frequent updating and flexibility within an airline’s fleet. the operating lease allows airlines to effectively adapt and manage their fleets through varying market conditions without bearing the full financial risk associated with these capital-intensive assets with a 25-year useful life. this fleet flexibility enables airlines to more effectively compete in their respective markets. We work closely with our airline customers throughout the world to help optimize their long-term aircraft fleet strategies.
We work to mitigate the risks of owning and leasing aircraft through careful management of our fleet, including man-aging customer concentrations by geography and region, staggering lease maturities, balancing aircraft type expo-sures and maintaining a young fleet age. We believe that diversification of our operating lease portfolio reduces the risks associated with individual customer defaults and the impact of adverse geopolitical and regional economic events. We work to mitigate the risks associated with cyclical variations in the airline industry by entering into long-term leases and staggering our lease maturities. in order to maximize residual values and minimize the risk of obsolescence, our strategy is to own aircraft for the first third of its 25-year useful life.

t W e n t Y
Our management team identifies prospective customers based upon industry knowledge and long-standing relation-ships. Prior to leasing an aircraft, we evaluate the competitive positioning of the airline, the strength and quality of the management team, and the financial performance of the airline. Management obtains and reviews relevant business materials from all prospective customers before entering into a lease agreement. Under certain circumstances, the customer may be required to obtain guarantees or other financial support from a financial institution. We work closely with our existing customers and potential lessees to develop customized lease structures that address their specific needs. We typically enter into a lease agreement 18 to 36 months in advance of the delivery of a new aircraft from our order pipeline. Once the aircraft has been delivered and operated by the airline, we look to remarket the aircraft and sign a follow-on lease six to 12 months ahead of the scheduled expiry of the initial lease term. Our leases typically contain the following key provisions:
• our leases are primarily structured as operating leases, whereby we retain the residual rights to the aircraft;
• our leases are triple net leases, whereby the lessee is responsible for all operating costs including taxes, insurance and aircraft maintenance;
• our leases typically require all payments be made in U.S. dollars;
• our leases are typically for fixed rates and terms;
• our leases typically require cash security deposits and maintenance reserve payments; and
• our leases contain provisions which require payment whether or not the aircraft is operated, irrespective of the circumstances.
the lessee is responsible for compliance with applicable laws and regulations with respect to the aircraft. We require our lessees to comply with the standards of either the U.S. federal Aviation Administration (“fAA”) or its equivalent in foreign jurisdictions. As a function of these laws and the provisions in our lease contracts, the lessees are responsible to perform all maintenance of the aircraft and return the aircraft and its components in a specified return condition. Generally, we receive a cash deposit and maintenance reserves as security for the lessee’s performance of obligations under the lease and the condition of the aircraft upon return. in addition, most leases contain extensive provisions regarding our remedies and rights in the event of a default by a lessee. the lessee generally is required to continue to make lease payments under all circumstances, including periods during which the aircraft is not in operation due to maintenance or grounding.
Some foreign countries have currency and exchange laws regulating the international transfer of currencies. When necessary, we may require, as a condition to any foreign transaction, that the lessee or purchaser in a foreign country obtain the necessary approvals of the appropriate government agency, finance ministry or central bank for the remit-tance of all funds contractually owed in U.S. dollars. We attempt to minimize our currency and exchange risks by negotiating the designated payment currency in our leases to be U.S. dollars. to meet the needs of certain of our airline customers, we have agreed to accept certain of our lease payments in a foreign currency. After we agree to the rental payment currency with an airline, the negotiated currency typically remains for the term of the lease. We may enter into contracts to mitigate our foreign currency risk, but we expect that the economic risk arising from foreign currency denominated leases will be insignificant to us.
We may, in connection with the lease of used aircraft, agree to contribute specific additional amounts to the cost of certain first major overhauls or modifications, which usually reflect the usage of the aircraft prior to the commence-ment of the lease, and which are covered by the prior operator’s usage fees. We may be obligated under the leases to make reimbursements of maintenance reserves previously received to lessees for expenses incurred for certain planned major maintenance. We also, on occasion, may contribute towards aircraft modifications and recover any such costs over the life of the lease.

t W e n t Y- O n e
MonitoringDuring the lease term we closely follow the operating and financial performance of our lessees. We maintain a high level of communication with the lessee and frequently evaluate the state of the market in which the lessee operates, including the impact of changes in passenger air travel and preferences, emerging competition, new government regulations, regional catastrophes and other unforeseen shocks that are relevant to the airline’s market. this enables us to identify lessees that may be experiencing operating and financial difficulties. this identification assists us in assessing the lessee’s ability to fulfill its obligations under the lease. this monitoring also identifies candidates, where appropriate, to restructure the lease prior to the lessee’s insolvency or the initiation of bankruptcy or similar proceed-ings. Once an insolvency or bankruptcy occurs we typically have less control over, and would most likely incur greater costs in connection with, the restructuring of the lease or the repossession of the aircraft.
During the life of the lease, situations may lead us to restructure leases with our lessees. When we repossess an air-craft leased in a foreign country, we generally expect to export the aircraft from the lessee’s jurisdiction. in some very limited situations, the lessees may not fully cooperate in returning the aircraft. in those cases, we will take legal action in the appropriate jurisdictions, a process that could ultimately delay the return and export of the aircraft. in addition, in connection with the repossession of an aircraft, we may be required to pay outstanding mechanics’ liens, airport charges, and navigation fees and other amounts secured by liens on the repossessed aircraft. these charges could relate to other aircraft that we do not own but were operated by the lessee.
RemarketingOur lease agreements are generally structured to require lessees to notify us nine to 12 months in advance of the lease’s expiration if a lessee desires to renew or extend the lease. Requiring lessees to provide us with such advance notice provides our management team with an extended period of time to consider a broad set of alternatives with respect to the aircraft, including assessing general market and competitive conditions and preparing to remarket or sell the aircraft. if a lessee fails to provide us with notice, the lease will automatically expire at the end of the term, and the lessee will be required to return the aircraft pursuant to the conditions in the lease. Our leases contain detailed provisions regarding the required condition of the aircraft and its components upon redelivery at the end of the lease term.
Aircraft Sales & Trading Strategy
Our strategy is to maintain a portfolio of young aircraft with a widely diversified customer base. in order to achieve this profile, we primarily order new planes directly from the manufacturers, place them on long-term leases, and sell the aircraft when they near the end of the first third of their 25-year economic useful lives. We typically sell aircraft that are currently operated by an airline with multiple years of lease term remaining on the contract, in order to achieve the maximum disposition value of the aircraft. Buyers of the aircraft may include leasing companies, financial institutions and airlines. We also buy and sell aircraft on an opportunistic basis for trading profits. Additionally, we may provide management services of the aircraft asset to the buyer for a fee.
Financing Strategy
We finance the purchase of aircraft and our business with available cash balances, internally generated funds, includ-ing aircraft sales and trading activity, and debt financings. from our inception in 2010, we have structured the Company to be an investment grade company and our debt financing strategy has focused on funding our business on an unse-cured basis. Unsecured financing provides us with operational flexibility when selling or transitioning aircraft from one airline to another. We may, to a limited extent, utilize export credit financing in support of our new aircraft deliveries.

t W e n t Y- t W O
the Company received a corporate credit rating of A− from Kroll Bond Ratings in May 2013, followed by a second investment grade corporate credit rating of BBB− from S&P in August 2013. Our investment grade credit ratings fur-ther lowered our cost of funds and broadened our access to attractively priced capital. it also strengthened our ability to achieve our long-term debt financing strategy of continuing to raise unsecured debt in the global bank and capital markets to further increase our unsecured debt as a percentage of total debt.
Insurance
We require our lessees to carry those types of insurance that are customary in the air transportation industry, includ-ing comprehensive liability insurance, aircraft all-risk hull insurance and war-risk insurance covering risks such as hijacking, terrorism (but excluding coverage for weapons of mass destruction and nuclear events), confiscation, expropriation, seizure and nationalization. We generally require a certificate of insurance from the lessee’s insurance broker prior to delivery of an aircraft. Generally, all certificates of insurance contain a breach of warranty endorsement so that our interests are not prejudiced by any act or omission of the lessee. Lease agreements generally require hull and liability limits to be in U.S. dollars, which are shown on the certificate of insurance.
insurance premiums are to be paid by the lessee, with coverage acknowledged by the broker or carrier. the territorial coverage, in each case, should be suitable for the lessee’s area of operations. We generally require that the certifi-cates of insurance contain, among other provisions, a provision prohibiting cancellation or material change without at least 30 days’ advance written notice to the insurance broker (who would be obligated to give us prompt notice), except in the case of hull war insurance policies, which customarily only provide seven days’ advance written notice for cancellation and may be subject to shorter notice under certain market conditions. furthermore, the insurance is primary and not contributory, and we require that all insurance carriers be required to waive rights of subrogation against us.
the stipulated loss value schedule under aircraft hull insurance policies is on an agreed-value basis acceptable to us and usually exceeds the book value of the aircraft. in cases where we believe that the agreed value stated in the lease is not sufficient, we make arrangements to cover such deficiency, which would include the purchase of additional “total Loss Only” coverage for the deficiency.
Aircraft hull policies generally contain standard clauses covering aircraft engines. the lessee is required to pay all deductibles. furthermore, the hull war policies generally contain full war-risk endorsements, including, but not limited to, confiscation (where available), seizure, hijacking and similar forms of retention or terrorist acts.
the comprehensive liability insurance listed on certificates of insurance generally include provisions for bodily injury, property damage, passenger liability, cargo liability and such other provisions reasonably necessary in commercial passenger and cargo airline operations. We expect that such certificates of insurance list combined comprehensive single liability limits of not less than $500.0 million for Airbus and Boeing aircraft and $200.0 million for embraer S.A. (“embraer”) and AtR aircraft. As a standard in the industry, airline operator’s policies contain a sublimit for third-party war-risk liability in the amount of $50.0 million. We require each lessee to purchase higher limits of third-party war-risk liability or obtain an indemnity from its respective government.
in late 2005, the international aviation insurance market unilaterally introduced exclusions for physical damage to air-craft hulls caused by dirty bombs, bio-hazardous materials and electromagnetic pulsing. exclusions for the same type of perils could be introduced into liability policies.
Separately, we purchase contingent liability insurance and contingent hull insurance on all aircraft in our fleet and maintain other insurance covering the specific needs of our business operations. We believe our insurance is adequate both as to coverages and amounts.

t W e n t Y- t H R e e
We cannot assure investors that our lessees will be adequately insured against all risks, that lessees will at all times comply with their obligations to maintain insurance, that any particular claim will be paid, or that lessees will be able to obtain adequate insurance coverage at commercially reasonable rates in the future.
We maintain key man life insurance policies on our Chairman and CeO and our President and Chief Operating Officer. each policy is in the amount of $2.0 million, with the proceeds payable to us and permitted to be used for general corporate purposes.
Competition
the leasing, remarketing and sale of aircraft is highly competitive. We face competition from aircraft manufacturers, banks, financial institutions, other leasing companies, aircraft brokers and airlines. Some of our competitors may have greater operating and financial resources and access to lower capital costs than we have. Competition for leasing transactions is based on a number of factors, including delivery dates, lease rates, lease terms, other lease provisions, aircraft condition and the availability in the marketplace of the types of aircraft required to meet the needs of airline customers. Competition in the purchase and sale of used aircraft is based principally on the availability of used aircraft, price, the terms of the lease to which an aircraft is subject and the creditworthiness of the lessee, if any.
Government Regulation
the air transportation industry is highly regulated. We do not operate commercial aircraft, and thus may not be directly subject to many industry laws and regulations, such as regulations of the U.S. Department of State (the “DOS”), the U.S. Department of transportation, or their counterpart organizations in foreign countries regarding the operation of aircraft for public transportation of passengers and property. As discussed below, however, we are sub-ject to government regulation in a number of respects. in addition, our lessees are subject to extensive regulation under the laws of the jurisdictions in which they are registered or operate. these laws govern, among other things, the registration, operation, maintenance and condition of the aircraft.
We are required to register our aircraft with an aviation authority mutually agreed upon with our lessee. each aircraft registered to fly must have a Certificate of Airworthiness, which is a certificate demonstrating the aircraft’s compliance with applicable government rules and regulations and that the aircraft is considered airworthy. each airline we lease to must have a valid operation certificate to operate our aircraft. Our lessees are obligated to maintain the Certificates of Airworthiness for the aircraft they lease.
Our involvement with the civil aviation authorities of foreign jurisdictions consists largely of requests to register and deregister our aircraft on those countries’ registries.
We are also subject to the regulatory authority of the DOS and the U.S. Department of Commerce (the “DOC”) to the extent such authority relates to the export of aircraft for lease and sale to foreign entities and the export of parts to be installed on our aircraft. We may be required to obtain export licenses for parts installed in aircraft exported to foreign countries. the DOC and the U.S. Department of the treasury (through its Office of foreign Assets Control) impose restrictions on the operation of U.S.-made goods, such as aircraft and engines, in sanctioned countries, as well as on the ability of U.S. companies to conduct business with entities in those countries. the U.S. Patriot Act of 2001 (the “Patriot Act”) prohibits financial transactions by U.S. persons, including U.S. individuals, entities and charitable orga-nizations, with individuals and organizations designated as terrorists and terrorist supporters by the U.S. Secretary of State or the U.S. Secretary of the treasury. the U.S. Customs and Border Protection, a law enforcement agency of the U.S. Department of Homeland Security, enforces regulations related to the import of aircraft into the United States for maintenance or lease and the importation of parts into the U.S. for installation.

t W e n t Y- f O U R
Jurisdictions in which aircraft are registered as well as jurisdictions in which they operate may impose regulations relating to noise and emission standards. in addition, most countries’ aviation laws require aircraft to be maintained under an approved maintenance program with defined procedures and intervals for inspection, maintenance and repair. to the extent that aircraft are not subject to a lease or a lessee is not in compliance, we are required to comply with such requirements, possibly at our own expense.
Employees
As of December 31, 2013, we had 63 full-time employees. On average, our senior management team has approxi-mately 23 years of experience in the aviation industry. none of our employees are represented by a union or collective bargaining agreements.
Access to Our Information
We file annual, quarterly, current reports, proxy statements and other information with the Securities and exchange Commission (the “SeC”). We make our public SeC filings available, at no cost, through our website at www.airleasecorp.com as soon as reasonably practicable after the report is electronically filed with, or furnished to, the SeC. the information contained on or connected to our website is not incorporated by reference into this Annual Report and should not be considered part of this or any other report filed with the SeC. We will also provide these reports in electronic or paper format free of charge upon written request made to investor Relations at 2000 Avenue of the Stars, Suite 1000n, Los Angeles, California 90067. Our SeC filings are also available free of charge on the SeC’s website at www.sec.gov. the public may also read and copy any document we file with the SeC at the SeC’s public reference room located at 100 f Street ne, Washington, DC 20549. Please call the SeC at 1-800-SeC-0330 for further information on the operation of the public reference room.

t W e n t Y- f i V e
MARKET FOR REGISTRANT’S COMMON EQUITY, RELATED STOCKHOLDER MATTERS AND ISSUER PURCHASES OF EQUITY SECURITIES
Market Information
Our Class A Common Stock has been quoted on the new York Stock exchange (the “nYSe”) under the symbol “AL” since April 19, 2011. Prior to that time, there was no public market for our stock. As of December 31, 2013, there were 101,822,676 shares of Class A Common Stock outstanding held by approximately 187 holders of record.
On february 26, 2014 the closing price of our Class A Common Stock was $35.14 per share as reported by the nYSe. the table below sets forth for the indicated periods the high and low sales prices for our Class A Common Stock as reported on the nYSe.
fiscal Year 2013 Quarters ended: High Low
March 31, 2013 $29.36 $21.89June 30, 2013 $30.58 $26.18September 30, 2013 $28.67 $25.80December 31, 2013 $33.29 $27.73
fiscal Year 2012 Quarters ended: High Low
March 31, 2012 $26.47 $23.10June 30, 2012 $25.00 $18.66September 30, 2012 $22.79 $18.45December 31, 2012 $23.17 $20.13
Dividends
in february 2013, our Board of Directors adopted a cash dividend policy pursuant to which we intended to pay quar-terly cash dividends of $0.025 per share on our outstanding common stock. in november 2013, the Company raised its quarterly cash dividend by 20% to $0.03 per share on our outstanding common stock. there were no dividends declared or paid during 2012 or 2011.
While the Board of Directors currently expects to continue paying a quarterly cash dividend of $0.03 per share for the foreseeable future, the cash dividend policy can be changed at any time at the discretion of the Board of Directors.

t W e n t Y- S i X
Stock Authorized for Issuance Under Equity Compensation Plans
Set forth below is certain information about the Class A Common Stock authorized for issuance under the Company’s equity compensation plan.
Plan Category
number of Securities to be issued
Upon exercise of Outstanding Options, Warrants and Rights
Weighted-Average exercise Price of
Outstanding Options, Warrants and Rights
number of Securities Remaining Available for future issuance Under equity Compensation
Plans (excluding securities reflected
in column (a))
(a) (b) (c)
equity compensation plans approved by security holders 3,625,783 $20.36 1,574,767equity compensation plans not approved by security holders — — —total 3,625,783 $20.36 1,574,767
Performance Graph
the graph below compares the cumulative return since April 19, 2011 of the Company’s Class A Common Stock, the S&P Midcap index, the Russell 2000 index and a customized peer group. the peer group consists of three compa-nies: Aircastle Limited (nYSe: AYR), AerCap Holdings nV (nYSe: AeR) and fLY Leasing Limited (nYSe: fLY). the peer group investment is weighted by market capitalization as of April 19, 2011, and is adjusted monthly. An invest-ment of $100, with reinvestment of all dividends, is assumed to have been made in our Class A Common Stock, in the peer group and in the S&P Midcap index and in the Russell 2000 index on April 19, 2011, and the relative performance of each is tracked through December 31, 2013. the stock price performance shown in the graph is not necessarily indicative of future stock price performance.
COMPARiSOn Of 32-MOntH CUMULAtiVe tOtAL RetURn
Assumes initial investment of $100 December 31, 2013
$250
200
150
100
50
4/19
/201
1
6/30
/201
1
9/30
/201
1
12/3
1/20
11
3/31
/201
2
6/30
/201
2
9/30
/201
2
12/3
1/20
12
3/31
/201
3
6/30
/201
3
9/30
/201
3
12/3
1/20
13
Air Lease Corporation S&P Midcap 400 Index Russell 2000 Index Peer Group
Company Purchases of Stock
the Company did not purchase any shares of its Class A Common Stock during 2013.

t W e n t Y- S e V e n
MANAGEMENT’S DISCUSSION AND ANALYSIS OF FINANCIAL CONDITION AND RESULTS OF OPERATIONSOverview
Air Lease Corporation is a leading aircraft leasing company that was founded by aircraft leasing industry pioneer Steven f. Udvar-Házy. We are principally engaged in purchasing new commercial jet transport aircraft directly from the manufacturers, such as Boeing and Airbus, and leasing those aircraft to airlines throughout the world to generate attractive returns on equity. in addition to our leasing activities, we sell aircraft from our operating lease portfolio to third parties, including other leasing companies, financial services companies and airlines. We also provide fleet man-agement services to investors and owners of aircraft portfolios for a management fee. Our operating performance is driven by the growth of our fleet, the terms of our leases, the interest rates on our indebtedness and the terms of our aircraft sales and trading activities.
We ended 2013 with 193 aircraft in our operating lease portfolio and an additional 327 aircraft on order with Boeing, Airbus and AtR. Our operating lease portfolio of 193 aircraft as of December 31, 2013 is comprised of 146 single-aisle narrowbody jet aircraft, 31 twin-aisle widebody jet aircraft and 16 turboprop aircraft, with a weighted-average age of 3.7 years. We ended 2012 with 155 aircraft, comprised of 118 single-aisle jet aircraft, 27 twin-aisle widebody aircraft and 10 turboprop aircraft, with a weighted-average age of 3.5 years. Our fleet grew by 20.6% based on net book value to $7.6 billion as of December 31, 2013 compared to $6.3 billion as of December 31, 2012.
the acquisition and lease of 40 additional aircraft aggregating $1.7 billion led to an increase of $190.6 million or 30% in our rental revenue to $836.5 million for the year ended December 31, 2013, compared to $645.9 million for the year ended December 31, 2012. Due to the timing of aircraft deliveries the full impact on rental revenue for aircraft acquired during a given period will be reflected in subsequent periods.
We recorded earnings before income taxes of $293.4 million for the year ended December 31, 2013 compared to $204.0 million for the year ended December 31, 2012, an increase of $89.4 million or 43.8%. Our profitability increased year over year as our pretax profit margin increased to 34.2% for the year ended December 31, 2013, compared to 31.1% for the year ended December 31, 2012. Our earnings per share also increased as we recorded diluted earnings per share of $1.80 for the year ended December 31, 2013, compared to $1.28 for the year ended December 31, 2012, an increase of 40.6%.
As of December 31, 2013, all of our 193 aircraft were leased and our airline customers are obligated to make $6.2 billion in minimum future rental payments over the non-cancelable lease term. in addition, we have signed lease agreements for 98 aircraft that we ordered from the manufacturers for delivery through 2023, and our airline customers are con-tractually obligated to make $7.2 billion in minimum future rental payments over the non-cancelable lease term. in the aggregate, between aircraft we own in our operating lease portfolio and those that we have leased from our orderbook, our customers are contractually obligated to make $13.4 billion in minimum future rental payments.
During 2013, the Company entered into commitments to acquire up to 78 additional aircraft from Airbus, Boeing and AtR. from Airbus, we agreed to purchase up to 30 A350-900/1000 family aircraft, five of which are subject to recon-firmation. from Boeing, we agreed to purchase an additional 10 Boeing 777-300eR aircraft, 30 787-10 aircraft and three additional 787-9 aircraft. from AtR, we agreed to purchase five additional AtR 72-600 aircraft. Deliveries of these aircraft are scheduled to commence in 2014 and continue through 2023.

t W e n t Y- e i G H t
During 2013, the Company received two investment grade corporate credit ratings, which reduced our financing costs and further broadened our access to attractively priced capital. Our financing plans remain focused on raising unse-cured debt in the global bank and capital markets, reinvesting cash flow from operations and, to a limited extent, export credit financing. During 2013, we entered into additional unsecured debt facilities aggregating $2.4 billion. the Company’s unsecured debt as a percentage of total debt increased to 73.5% as of December 31, 2013 from 60.2% as of December 31, 2012. the Company’s fixed-rate debt as a percentage of total debt increased to 62.0% as of December 31, 2013 from 53.9% as of December 31, 2012. in addition, we reduced our composite cost of funds to 3.60% as of December 31, 2013 from 3.94% as of December 31, 2012.
Our Fleet
We have continued to build one of the world’s youngest operating lease portfolios, comprised of the most fuel-efficient commercial jet transport aircraft. During the year ended December 31, 2013, we took delivery of 34 aircraft from our new order pipeline supplemented by six deliveries of used aircraft acquired in the secondary market, we sold an aircraft and we had an insured loss of one aircraft, ending the year with a total of 193 aircraft. Our weighted-average fleet age and weighted-average remaining lease term as of December 31, 2013 were 3.7 years and 7.1 years, respectively. We also managed four aircraft as of December 31, 2013.
Portfolio metrics of our fleet as of December 31, 2013 and 2012 are as follows:
December 31, 2013 December 31, 2012
(dollars in thousands)
fleet size 193 155Weighted-average fleet age(1) 3.7 years 3.5 yearsWeighted-average remaining lease term(1) 7.1 years 6.8 yearsAggregate net book value $7,613,135 $6,251,863
(1) Weighted-average fleet age and remaining lease term calculated based on net book value.
the following table sets forth the net book value and percentage of the net book value of our aircraft portfolio operating in the indicated regions as of December 31, 2013 and 2012:
December 31, 2013 December 31, 2012
Regionnet Book
Value% of total
net Book Value
% of total
(dollars in thousands)
Asia/Pacific $3,317,118 43.6% $2,245,002 35.9%europe 2,656,816 34.9% 2,398,531 38.4%Central America, South America and Mexico 829,930 10.9% 788,189 12.6%U.S. and Canada 436,653 5.7% 457,546 7.3%the Middle east and Africa 372,618 4.9% 362,595 5.8%
total $7,613,135 100.0% $6,251,863 100.0%

t W e n t Y- n i n e
the following table sets forth the number of aircraft we leased by aircraft type as of December 31, 2013 and 2012:
December 31, 2013 December 31, 2012
number of Aircraft
% of total
number of Aircraft
% of total
Airbus A319-100 6 3.1% 7 4.5%Airbus A320-200 42 21.8% 29 18.7%Airbus A321-200 7 3.6% 5 3.2%Airbus A330-200 16 8.3% 14 9.0%Airbus A330-300 5 2.6% 3 1.9%Boeing 737-700 10 5.2% 8 5.2%Boeing 737-800 50 25.9% 38 24.5%Boeing 767-300eR 3 1.6% 3 1.9%Boeing 777-200eR 1 0.5% 1 0.7%Boeing 777-300eR 6 3.1% 6 3.9%embraer e175 8 4.1% 8 5.2%embraer e190 23 11.9% 23 14.8%AtR 72-600 16 8.3% 10 6.5%
total 193 100.0% 155 100.0%
As of December 31, 2013, we had contracted to buy 327 new aircraft for delivery through 2023, with an estimated aggregate purchase price (including adjustments for inflation) of $27.3 billion, for delivery as follows:
Aircraft type 2014 2015 2016 2017 2018 thereafter total
Airbus A321-200(1) 13 6 — — — — 19Airbus A320/321 neO — — 3 12 15 20 50Airbus A350 XWB(2) — — — — 1 29 30Boeing 737-800 13 20 15 11 — — 59Boeing 737-8/9 MAX(3) — — — — 8 96 104Boeing 777-300eR 5 8 2 — — — 15Boeing 787-9/10 — — — 1 7 37 45AtR 72-600 4 1 — — — — 5
total 35 35 20 24 31 182 327
(1) All of our Airbus A321-200 aircraft will be equipped with sharklets.(2) As of December 31, 2013, five of the Airbus A350-1000 aircraft were subject to reconfirmation.(3) As of December 31, 2013, 20 of the Boeing 737-8 MAX aircraft were subject to reconfirmation.

t H i R t Y
Our lease placements are progressing in line with expectations. As of December 31, 2013, we have entered into contracts for the lease of new aircraft scheduled to be delivered as follows:
Delivery Yearnumber of
Aircraftnumber Leased
% Leased
2014 35 35 100.0%2015 35 35 100.0%2016 20 12 60.0%2017 24 9 37.5%2018 31 7 22.6%thereafter 182 — —
total 327 98
Aircraft Industry and Sources of Revenues
Our revenues are principally derived from operating leases with scheduled and charter airlines. As of December 31, 2013, 2012 and 2011, we derived more than 90% of our revenues from airlines domiciled outside of the U.S., and we anticipate that most of our revenues in the future will be generated from foreign customers. the airline industry is cyclical, economically sensitive and highly competitive. Airlines and related companies are affected by fuel price vola-tility and fuel shortages, political and economic instability, currency volatility, natural disasters, terrorist activities, changes in national policy, competitive pressures, labor actions, pilot shortages, insurance costs, recessions, health concerns and other political or economic events adversely affecting world or regional trading markets. Our airline customers’ ability to react to, and cope with, the volatile competitive environment in which they operate, as well as our own competitive environment, will affect our revenues and income.
Demand for air travel has consistently grown in terms of both the number of aircraft and passenger traffic. According to the international Air transport Association (“iAtA”), passenger traffic demand grew 5.2% in 2013 over the prior year, which is aligned with the annual growth rate over the past 30 years. Additionally, the number of leased aircraft in the global fleet has increased over that same time period. the industry has remained resilient over time, while enduring the effects of both business cycle downturns and external events. today, air travel has penetrated most world regions, with the highest growth now coming from emerging markets and economies. While growth rates are lower in more mature markets, there is a substantial need in those markets to replace aircraft reaching the end of their economic useful lives. Long-term passenger traffic growth is positive as iAtA indicated that airlines expect to see a 5.4% com-pound annual growth rate between 2013 and 2017. the long-term outlook for aircraft demand remains robust due to increased passenger traffic and the need to replace aging planes.
the airline industry is cyclical and generally grows along with the economy. Historically, there has been a strong posi-tive correlation between changes in world Gross Domestic Product (“GDP”), measured in U.S. dollars, and changes in passenger traffic (as indicated by revenue passenger kilometers (“RPK”), an industry-standard measure of passengers flown where each RPK represents one kilometer traveled by a paying customer).
the business cycle effects are such that RPK declines or softens within recessionary periods. However, aircraft inventory has trended upward consistently, regardless of the economic cycle, as many aircraft are delivered during downturns despite reduced passenger travel. the success of the commercial airline industry is intricately linked to the strength of global economic development, which may be negatively impacted by macroeconomic conditions, geopolitical and policy risks and instability in the Middle east.
Despite industry cyclicality and current economic stresses, we remain optimistic about the long-term growth prospects for air transportation. We see a growing demand for aircraft leasing in the broader industry and a role for ALC in helping airlines modernize their fleets to support the growth of the airline industry.

t H i R t Y- O n e
Liquidity and Capital Resources
Overview
We finance the purchase of aircraft and our business with available cash balances, internally generated funds, includ-ing aircraft sales and trading activity, and debt financings. from our inception in 2010, we have structured the Company to be an investment grade company and our debt financing strategy has focused on funding our business on an unse-cured basis. Unsecured financing provides us with operational flexibility when selling or transitioning aircraft from one airline to another. We may, to a limited extent, utilize export credit financing in support of our new aircraft deliveries.
in 2013, the Company received two corporate credit ratings. Our investment grade credit ratings further lowered our cost of funds and broadened our access to attractively priced capital. Our long-term debt financing strategy will be focused on continuing to raise unsecured debt in the global bank and capital markets.
During the year ended December 31, 2013, we incurred additional debt financing aggregating $2.6 billion, which included $1.3 billion in senior unsecured notes, the addition of $957.0 million in capacity to our Syndicated Unsecured Revolving Credit facility which now totals $2.0 billion and additional debt facilities aggregating $364.0 million. We ended 2013 with total debt outstanding of $5.9 billion compared to $4.4 billion in 2012. As of December 31, 2013 we had developed a 43-member, globally diversified banking group, which has provided us in excess of $4.4 billion in financing and we have raised $3.3 billion in financing in the capital markets. We ended 2013 with total unsecured debt outstanding of $4.3 billion compared to $2.6 billion in 2012, increasing the Company’s unsecured debt as a percent-age of total debt to 73.5% as of December 31, 2013 compared to 60.2% as of December 31, 2012. the Company’s fixed-rate debt as a percentage of total debt increased to 62.0% as of December 31, 2013 from 53.9% as of December 31, 2012. in addition, we reduced our composite cost of funds to 3.60% as of December 31, 2013 from 3.94% as of December 31, 2012.
We increased our cash flows from operations by 33.2% or $163.2 million to $654.2 million in 2013 as compared to $491.0 million in 2012. Our cash flows from operations contributed significantly to our liquidity position. We ended 2013 with available liquidity of $1.8 billion which is comprised of unrestricted cash of $270.2 million and undrawn bal-ances under our warehouse facilities and unsecured revolving credit facilities of $1.56 billion. We believe that we have sufficient liquidity to satisfy the operating requirements of our business through the next twelve months.
Our financing plan for 2014 is focused on funding the purchase of aircraft and our business with available cash bal-ances, internally generated funds, including aircraft sales and trading activity, and debt financings. Our debt financing plan will remain focused on continuing to raise unsecured debt in the global bank and capital markets. in addition, we may utilize, to a limited extent, export credit financing in support of our new aircraft deliveries.
Our liquidity plans are subject to a number of risks and uncertainties, including those described in “item 1A. Risk factors” in our Annual Report on form 10-K, filed with the Securities and exchange Commission on february 27, 2014.

t H i R t Y- t W O
Debt
Our debt financing was comprised of the following at December 31, 2013 and 2012:
December 31, 2013 December 31, 2012
(dollars in thousands)
UnSeCUReD Senior notes $3,055,620 $1,775,000 Revolving credit facilities 808,000 420,000 term financings 247,722 248,916 Convertible senior notes 200,000 200,000
4,311,342 2,643,916SeCUReD Warehouse facilities 828,418 1,061,838 term financings 654,369 688,601 export credit financing 71,539 —
1,554,326 1,750,439 total secured and unsecured debt financing 5,865,668 4,394,355 Less: Debt discount (12,351) (9,623)
total debt $5,853,317 $4,384,732SeLeCteD inteReSt RAteS AnD RAtiOS: Composite interest rate(1) 3.60% 3.94% Composite interest rate on fixed debt(1) 4.56% 5.06% Percentage of total debt at fixed-rate 61.98% 53.88%
(1) this rate does not include the effect of upfront fees, undrawn fees or issuance cost amortization.
Senior unsecured notesDuring the year ended December 31, 2013, the Company issued $1.3 billion in aggregate principal amount of senior unsecured notes.
On february 5, 2013, the Company issued $400.0 million in aggregate principal amount of senior unsecured notes due 2020 that bear interest at a rate of 4.75% per annum.
On June 26, 2013, the Company concluded its offer to exchange up to $151.6 million aggregate principal amount of new notes for any and all of its outstanding 7.375% senior unsecured notes due January 30, 2019 and issued $132.0 million aggregate principal amount of its 5.625% senior notes due 2017 in exchange for $125.4 million aggregate principal amount of the old notes.
On August 26, 2013, the Company received an investment grade corporate credit rating of BBB− from S&P with a stable outlook. the BBB− rating was also assigned to the Company’s $2.0 billion senior unsecured notes due 2016, 2017 and 2020. effective August 26, 2013, the additional interest of 0.50% per annum assessed on the senior unsecured notes due 2017 was eliminated due to the rating of the notes by S&P.
On October 1, 2013, the Company issued $185.0 million in aggregate principal amount of senior unsecured notes in a private placement to institutional investors. the notes are comprised of $53.0 million of 3.64% senior unsecured notes due 2016 and $132.0 million of 4.49% senior unsecured notes due 2019.

t H i R t Y- t H R e e
On november 19, 2013, the Company issued $700.0 million in aggregate principal amount of senior unsecured notes due 2019 that bear interest at a rate of 3.375% per annum.
As of December 31, 2013, the Company had $3.1 billion in senior unsecured notes outstanding. As of December 31, 2012, the Company had $1.8 billion in senior unsecured notes outstanding.
Unsecured revolving credit facilitiesWe have in place a senior unsecured revolving credit facility (the “Syndicated Unsecured Revolving Credit facility”), dated May 7, 2013, as amended, which provides us with financing of up to $2.0 billion. the Syndicated Unsecured Revolving Credit facility accrues interest at a rate of LiBOR plus 1.25% on drawn balances and includes a 0.25% facility fee. the facility will mature in May 2017.
During 2013, the Company increased the aggregate principal amount for which it can borrow under its Syndicated Unsecured Revolving Credit facility by $957.0 million to $2.0 billion and executed an amendment to the facility which extended the availability period from 3 years to 4 years and reduced the pricing from LiBOR plus a margin of 1.75% with no LiBOR floor and an undrawn fee of 0.375% to LiBOR plus 1.45% with no LiBOR floor and a 0.30% facility fee.
effective August 26, 2013, the pricing of our Syndicated Unsecured Revolving Credit facility has been further reduced to LiBOR plus 1.25% with no LiBOR floor and a 0.25% facility fee as a result of the investment grade corporate credit rating of BBB− obtained from S&P.
the total amount outstanding under our unsecured revolving credit facilities was $808.0 million and $420.0 million as of December 31, 2013 and December 31, 2012, respectively.
Warehouse facilitiesWe have a revolving credit facility (the “2010 Warehouse facility”), dated June 21, 2013, as amended, which provides us with financing of up to $1.0 billion. We amended the 2010 Warehouse facility in June 2013. Pursuant to the amend-ment we reduced the facility size to $1.0 billion from $1.25 billion, extended the period for which we can draw on the facility to June 2015 from June 2014 and extended the subsequent term out option through 2018. the interest rate on the 2010 Warehouse facility was reduced to LiBOR plus 2.25% from LiBOR plus 2.50% on drawn balances and to 0.50% from 0.75% on undrawn balances and provided a 10% unsecured guarantee on the 2010 Warehouse facility.
As of December 31, 2013, the Company had borrowed $828.4 million under our warehouse facilities and pledged 32 aircraft as collateral with a net book value of $1.2 billion. As of December 31, 2012, the Company had borrowed $1.1 billion under our warehouse facilities and pledged 38 aircraft as collateral with a net book value of $1.6 billion. the Company had pledged cash collateral and lessee deposits of $73.1 million and $104.3 million at December 31, 2013 and December 31, 2012, respectively.
Export credit financingsin March 2013, the Company issued $76.5 million in secured notes due 2024 guaranteed by the ex-im Bank. the notes will mature on August 15, 2024 and will bear interest at a rate of 1.617% per annum. the Company used the proceeds of the offering to refinance a portion of the purchase price of two Boeing 737-800 aircraft and the related premium charged by ex-im Bank for its guarantee of the notes.

t H i R t Y- f O U R
Credit Ratingsin May 2013, the Company received a corporate credit rating of A− from Kroll Bond Ratings, followed by a second investment grade corporate credit rating of BBB− from S&P in August 2013.
the following table summarizes our current credit ratings:
Rating AgencyLong-term
DebtCorporate
Rating OutlookDate of Last
Ratings Action
S&P BBB− BBB− Stable Outlook August 26, 2013Kroll Bond Ratings A− A− Stable Outlook May 9, 2013
While a ratings downgrade would not result in a default under any of our debt agreements, it could adversely affect our ability to issue debt and obtain new financings, or renew existing financings, and it would increase the cost of our financings.
Results of OperationsYear ended
December 31, 2013Year ended
December 31, 2012Year ended
December 31, 2011
(in thousands)
ReVenUeS Rental of flight equipment $ 836,516 $645,853 $332,719 Aircraft sales, trading and other 22,159 9,893 4,022
total revenues 858,675 655,746 336,741eXPenSeS interest 168,743 130,419 44,862 Amortization of discounts and deferred debt issue costs 23,627 16,994 9,481 extinguishment of debt — — 3,349
interest expense 192,370 147,413 57,692 Depreciation of flight equipment 280,037 216,219 112,307 Selling, general and administrative 71,212 56,453 44,559 Stock-based compensation 21,614 31,688 39,342
total expenses 565,233 451,773 253,900
income before taxes 293,442 203,973 82,841 income tax expense (103,031) (72,054) (29,609)
net income $ 190,411 $131,919 $ 53,232
OtHeR finAnCiAL DAtA: Adjusted net income(1) $ 219,767 $163,404 $ 87,954 Adjusted eBitDA(2) $ 785,981 $596,451 $290,168
(1) Adjusted net income is a measure of financial and operational performance that is not defined by GAAP. See note 1 in “Selected financial Data” elsewhere in this Annual Report for a discussion of adjusted net income as a non-GAAP measure and a reconciliation of this measure to net income and cash flows from operations.
(2) Adjusted eBitDA is a measure of financial and operational performance that is not defined by GAAP. See note 2 in “Selected financial Data” elsewhere in this Annual Report for a discussion of adjusted eBitDA as a non-GAAP measure and a reconciliation of this measure to net income and cash flows from operations.
t H i R t Y- f i V e
2013 Compared to 2012
Rental revenueAs of December 31, 2013, we had acquired 193 aircraft at a total cost of $8.2 billion and recorded $836.5 million in rental revenue for the year then ended, which included overhaul revenue of $34.4 million. in the prior year, as of December 31, 2012, we had acquired 155 aircraft at a total cost of $6.6 billion and recorded $645.9 million in rental revenue for the year ended December 31, 2012, which included overhaul revenue of $25.0 million. the increase in rental revenue was attributable to the acquisition and lease of additional aircraft. the full impact on rental revenue for aircraft acquired during the period will be reflected in subsequent periods.
All of the aircraft in our fleet were leased as of December 31, 2013. All of the aircraft in our fleet were leased as of December 31, 2012, except for one aircraft with respect to which we had entered into a non-binding lease commitment but for which delivery had not yet occurred.
Aircraft sales, trading and other revenueAircraft sales, trading and other revenue totaled $22.2 million for the year ended December 31, 2013 compared to $9.9 million for the year ended December 31, 2012. During the year ended December 31, 2013, the Company sold one aircraft from our operating lease portfolio and traded 11 737-300 aircraft, two spare engines and a corporate aircraft, recording gains on aircraft sales and trading activity of $18.9 million. During the year ended December 31, 2012, the Company sold one aircraft from our operating lease portfolio and traded two 737-300 aircraft and one spare engine, recording gains on aircraft sales and trading activity of $3.9 million.
Interest expenseinterest expense totaled $192.4 million for the year ended December 31, 2013 compared to $147.4 million for the year ended December 31, 2012. the change was primarily due to an increase in our average outstanding debt balances, partially offset by a decrease in our composite cost of funds, resulting in a $38.3 million increase in interest and a $6.6 million increase in amortization of our discounts and deferred debt issue costs. We expect that our interest expense will increase as our average debt balance outstanding continues to increase. interest expense will also be impacted by changes in our composite cost of funds.
Depreciation expenseWe recorded $280.0 million in depreciation expense of flight equipment for the year ended December 31, 2013 com-pared to $216.2 million for the year ended December 31, 2012. the increase in depreciation expense for 2013, com-pared to 2012, was attributable to the acquisition of 40 additional aircraft aggregating $1.7 billion. the full impact on depreciation expense for aircraft added during the year will be reflected in subsequent periods.
Selling, general and administrative expensesWe recorded selling, general and administrative expenses of $71.2 million for the year ended December 31, 2013 com-pared to $56.5 million for the year ended December 31, 2012. Selling, general and administrative expense as a per-centage of revenue decreased to 8.3% for the year ended December 31, 2013 compared to 8.6% for the year ended December 31, 2012. As we continue to add new aircraft to our portfolio, we expect selling, general and administrative expense to decrease as a percentage of our revenue.

t H i R t Y- S i X
Stock-based compensation expenseStock-based compensation expense totaled $21.6 million for the year ended December 31, 2013 compared to $31.7 million for the year ended December 31, 2012. this decrease is primarily a result of the effects of the expense recognition pattern related to our book-value RSUs, which is calculated based on a tranche by tranche vesting sched-ule. Additionally, as of June 30, 2013, all of the Company’s outstanding employee stock options had fully vested, further contributing to the decrease in stock-based compensation expense. See note 11 of “notes to Consolidated financial Statements” elsewhere in this Annual Report for additional information on stock-based compensation.
Taxesthe effective tax rate for the year ended December 31, 2013 was 35.1% compared to 35.3% for the year ended December 31, 2012. the change in effective tax rate for the respective periods is due to the effect of changes in permanent differences.
Net incomefor the year ended December 31, 2013, the Company reported consolidated net income of $190.4 million, or $1.80 per diluted share, compared to a consolidated net income of $131.9 million, or $1.28 per diluted share, for the year ended December 31, 2012. the increase in net income for 2013, compared to 2012, was primarily attributable to the acquisi-tion and lease of additional aircraft, an increase in aircraft sales, trading and other revenue and lower interest rates on our indebtedness.
Adjusted net incomeWe recorded adjusted net income of $219.8 million for the year ended December 31, 2013 compared to $163.4 million for the year ended December 31, 2012. the change in adjusted net income for 2013, compared to 2012, was primarily attributable to the acquisition and lease of additional aircraft, an increase in aircraft sales, trading and other revenue and lower interest rates on our indebtedness.
Adjusted net income is a measure of financial and operational performance that is not defined by GAAP. See note 1 in “Selected financial Data” elsewhere in this Annual Report for a discussion of adjusted net income as a non-GAAP measure and a reconciliation of this measure to net income and cash flows from operations.
Adjusted EBITDAWe recorded adjusted eBitDA of $786.0 million for the year ended December 31, 2013 compared to $596.5 million for the year ended December 31, 2012. the change in adjusted eBitDA for 2013, compared to 2012, was primarily attrib-utable to the acquisition and lease of additional aircraft and an increase in aircraft sales, trading and other revenue and lower interest rates on our indebtedness.
Adjusted eBitDA is a measure of financial and operational performance that is not defined by GAAP. See note 2 in “Selected financial Data” elsewhere in this Annual Report for a discussion of adjusted eBitDA as a non-GAAP mea-sure and a reconciliation of this measure to net income and cash flows from operations.
2012 Compared to 2011
Rental revenueAs of December 31, 2012, we had acquired 155 aircraft at a total cost of $6.6 billion and recorded $645.9 million in rental revenue for the year then ended, which included overhaul revenue of $25.0 million. in the prior year, as of December 31, 2011, we had acquired 102 aircraft at a total cost of $4.4 billion and recorded $332.7 million in rental revenue for the year ended December 31, 2011, which included overhaul revenue of $11.0 million. the increase in rental revenue was attributable to the acquisition and lease of additional aircraft. the full impact on rental revenue for aircraft acquired during the period will be reflected in subsequent periods.

t H i R t Y- S e V e n
All of the aircraft in our fleet were leased as of December 31, 2012, except for one aircraft with respect to which we had entered into a non-binding lease commitment but for which delivery had not yet occurred. All of the aircraft in our fleet were leased as of December 31, 2011.
Interest expenseinterest expense totaled $147.4 million for the year ended December 31, 2012 compared to $57.7 million for the year ended December 31, 2011. the change was primarily due to an increase in our average outstanding debt balances resulting in a $85.6 million increase in interest, an increase of $7.5 million in amortization of our deferred debt issue costs, offset by a $3.3 million charge for the extinguishment of debt recorded during the second quarter of 2011. We expect that our interest expense will increase as our average debt balance outstanding continues to increase. interest expense will also be impacted by our composite cost of funds.
Depreciation expenseWe recorded $216.2 million in depreciation expense of flight equipment for the year ended December 31, 2012 com-pared to $112.3 million for the year ended December 31, 2011. the increase in depreciation expense for 2012, com-pared to 2011, was attributable to the acquisition of 53 additional aircraft aggregating $2.2 billion. the full impact on depreciation expense for aircraft added during the year will be reflected in subsequent periods.
Selling, general and administrative expensesWe recorded selling, general and administrative expenses of $56.5 million for the year ended December 31, 2012 com-pared to $44.6 million for the year ended December 31, 2011. Selling, general and administrative expense as a per-centage of revenue decreased to 8.6% for the year ended December 31, 2012 compared to 13.2% for the year ended December 31, 2011. As we continue to add new aircraft to our portfolio, we expect selling, general and administrative expense to decrease as a percentage of our revenue.
Stock-based compensation expenseStock-based compensation expense totaled $31.7 million for the year ended December 31, 2012 compared to $39.3 million for the year ended December 31, 2011. this decrease is primarily a result of the effects of the expense recognition pattern related to our book-value RSUs, which is calculated based on an accelerated vesting schedule. the decrease was partially offset by grants made in 2012, as the full impact on stock-based compensation expense for the 2012 grants will be reflected in the subsequent periods. See note 11 of “notes to Consolidated financial Statements” elsewhere in this Annual Report for additional information on stock-based compensation.
Taxesthe effective tax rate for the year ended December 31, 2012 was 35.3% compared to 35.7% for the year ended December 31, 2011. the change in effective tax rate for the respective periods is due to the effect of changes in permanent differences as well as the effect of discrete tax items related to stock-based compensation.
Net incomefor the year ended December 31, 2012, the Company reported consolidated net income of $131.9 million, or $1.28 per diluted share, compared to a consolidated net income of $53.2 million, or $0.59 per diluted share, for the year ended December 31, 2011. the increase in net income for 2012, compared to 2011, was primarily attributable to the acquisition and lease of additional aircraft.
Adjusted net incomeWe recorded adjusted net income of $163.4 million for the year ended December 31, 2012 compared to $88.0 million for the year ended December 31, 2011. the change in adjusted net income for 2012, compared to 2011, was primarily attributable to the acquisition and lease of additional aircraft.

t H i R t Y- e i G H t
Adjusted net income is a measure of financial and operational performance that is not defined by GAAP. See note 1 in “Selected financial Data” elsewhere in this Annual Report for a discussion of adjusted net income as a non-GAAP measure and a reconciliation of this measure to net income and cash flows from operations.
Adjusted EBITDAWe recorded adjusted eBitDA of $596.5 million for the year ended December 31, 2012 compared to $290.2 million for the year ended December 31, 2011. the change in adjusted eBitDA for 2012, compared to 2011, was primarily attributable to the acquisition and lease of additional aircraft.
Adjusted eBitDA is a measure of financial and operational performance that is not defined by GAAP. See note 2 in “Selected financial Data” elsewhere in this Annual Report for a discussion of adjusted eBitDA as a non-GAAP measure and a reconciliation of this measure to net income and cash flows from operations.
Contractual Obligations
Our contractual obligations as of December 31, 2013 and through february 27, 2014 for purchase commitments are as follows:
2014 2015 2016 2017 2018 thereafter total
(dollars in thousands)
Long-term debt obligations(1)(2) $ 214,095 $ 264,004 $ 943,637 $ 2,210,251 $ 709,246 $ 1,524,435 $ 5,865,668interest payments on debt outstanding(3) 190,646 206,834 194,706 124,535 81,866 60,201 858,788Purchase commitments 2,321,392 2,190,517 1,357,736 1,615,789 2,781,520 17,226,533 27,493,487Operating leases 2,024 2,083 2,129 2,181 2,580 15,387 26,384
total $ 2,728,157 $ 2,663,438 $ 2,498,208 $ 3,952,756 $ 3,575,212 $ 18,826,556 $ 34,244,327
(1) As of December 31, 2013, the Company had $656.8 million of debt outstanding under the 2010 Warehouse facility. the Company is able to draw on the facility during an availability period that ends in June 2015 with a subsequent term out option through 2018, which is the maturity in the contractual obligations schedule above.
(2) As of December 31, 2013, the Company had $808.0 million of debt outstanding under our revolving unsecured credit facilities. the outstanding drawn balances may be rolled until the maturity date of each respective facility and have been presented as such in the contractual obligation schedule above.
(3) future interest payments on floating-rate debt are estimated using floating rates in effect at December 31, 2013.
Off-balance Sheet Arrangements
We have not established any unconsolidated entities for the purpose of facilitating off-balance sheet arrangements or for other contractually narrow or limited purposes. We have, however, from time to time established subsidiaries and created partnership arrangements or trusts for the purpose of leasing aircraft or facilitating borrowing arrangements, all of which are consolidated.

t H i R t Y- n i n e
Critical Accounting Policies
We believe the following critical accounting policies can have a significant impact on our results of operations, financial position and financial statement disclosures, and may require subjective and complex estimates and judgments.
Lease revenueWe lease flight equipment principally under operating leases and report rental income ratably over the life of each lease. Rentals received, but unearned, under the lease agreements are recorded in “Rentals received in advance” on our Consolidated Balance Sheet until earned. the difference between the rental income recorded and the cash received under the provisions of the lease is included in “Lease receivables,” as a component of “Other assets” on our Consolidated Balance Sheet. An allowance for doubtful accounts will be recognized for past-due rentals based on management’s assessment of collectability. Our management team monitors all lessees with past due lease payments (if any) and discusses relevant operational and financial issues facing those lessees with our marketing executives in order to determine an appropriate allowance for doubtful accounts. in addition, if collection is not reasonably assured, we will not recognize rental income for amounts due under our lease contracts and will recognize revenue for such lessees on a cash basis. Should a lessee’s credit quality deteriorate, we may be required to record an allowance for doubtful accounts and/or stop recognizing revenue until cash is received, both of which could have a material impact on our results of operations and financial condition.
Our aircraft lease agreements typically contain provisions which require the lessee to make additional contingent rental payments based on either the usage of the aircraft, measured on the basis of hours or cycles flown per month (a cycle is one take-off and landing), or calendar-based time (“Maintenance Reserves”). these payments represent contributions to the cost of major future maintenance events (“Qualifying events”) associated with the aircraft and typically cover major airframe structural checks, engine overhauls, the replacement of life limited parts contained in each engine, landing gear overhauls and overhauls of the auxiliary power unit. these Maintenance Reserves are generally collected monthly based on reports of usage by the lessee or collected as fixed monthly rates.
in accordance with our lease agreements, Maintenance Reserves are subject to reimbursement to the lessee upon the occurrence of a Qualifying event. the reimbursable amount is capped by the amount of Maintenance Reserves received by the Company, net of previous reimbursements. the Company is only required to reimburse for Qualifying events during the lease term. the Company is not required to reimburse for routine maintenance or additional mainte-nance costs incurred during a Qualifying event. All amounts of Maintenance Reserves unclaimed by the lessee at the end of the lease term are retained by the Company.
We record as rental revenue the portion of Maintenance Reserves that we are virtually certain we will not reimburse to the lessee as a component of “Rental of flight equipment” in our Consolidated Statement of income. Maintenance Reserves which we may be required to reimburse to the lessee are reflected in our overhaul reserve liability, as a component of “Security deposits and maintenance reserves on flight equipment leases” in our Consolidated Balance Sheet.

f O R t Y
estimating when we are virtually certain that Maintenance Reserves payments will not be reimbursed requires judgments to be made as to the timing and cost of future maintenance events. in order to determine virtual certainty with respect to this contingency, our technical Asset Management department analyzes the terms of the lease, utilizes available cost estimates published by the equipment manufacturers, and thoroughly evaluates an airline’s Maintenance Planning Document (“MPD”). the MPD describes the required inspections and the frequency of those inspections. Our technical Asset Management department utilizes this information, combined with their cumulative industry expe-rience, to determine when major Qualifying events are expected to occur for each relevant component of the aircraft, and translates this information into a determination of how much we will ultimately be required to reimburse to the lessee. We record Maintenance Reserves revenue as the aircraft is operated when we determine that a Qualifying event will occur outside the non-cancelable lease term or after we have collected Maintenance Reserves equal to the amount that we expect to reimburse to the lessee as the aircraft is operated.
Should such estimates be inaccurate, we may be required to reverse revenue previously recognized. in addition, if we can no longer make accurate estimates with respect to a particular lease, we will stop recognizing any Maintenance Reserves revenue until the end of such lease.
All of our lease agreements are triple net leases whereby the lessee is responsible for all taxes, insurance, and aircraft maintenance. in the future, we may incur repair and maintenance expenses for off-lease aircraft. We recognize repair and maintenance in our Consolidated Statements of income for all such expenditures.
Lessee specific modifications such as those related to modifications of the aircraft cabin are expected to be capital-ized as initial direct costs and amortized over the term of the lease into rental revenue in our Consolidated Statements of income.
Flight equipmentflight equipment under operating lease is stated at cost less accumulated depreciation. Purchases, major additions and modifications, and interest on deposits during the construction phase are capitalized. We generally depreciate passenger aircraft on a straight-line basis over a 25-year life from the date of manufacture to a 15% residual value. Changes in the assumption of useful lives or residual values for aircraft could have a significant impact on our results of operations and financial condition. At the time flight equipment is retired or sold, the cost and accumulated depreciation are removed from the related accounts and the difference, net of proceeds, is recorded as a gain or loss.
Our management team evaluates on a quarterly basis the need to perform an impairment test whenever facts or cir-cumstances indicate a potential impairment has occurred. An assessment is performed whenever events or changes in circumstances indicate that the carrying amount of an aircraft may not be recoverable. Recoverability of an air-craft’s carrying amount is measured by comparing the carrying amount of the aircraft to future undiscounted net cash flows expected to be generated by the aircraft. the undiscounted cash flows consist of cash flows from currently contracted leases, future projected lease rates and estimated residual or scrap values for each aircraft. We develop assumptions used in the recoverability analysis based on our knowledge of active lease contracts, current and future expectations of the global demand for a particular aircraft type, and historical experience in the aircraft leasing market and aviation industry, as well as information received from third-party industry sources. the factors considered in estimating the undiscounted cash flows are affected by changes in future periods due to changes in contracted lease rates, economic conditions, technology and airline demand for a particular aircraft type. in the event that an aircraft does not meet the recoverability test, the aircraft will be recorded at fair value in accordance with our fair Value Policy, resulting in an impairment charge. Deterioration of future lease rates and the residual values of our aircraft could result in impairment charges which could have a significant impact on our results of operations and financial condition. to date, we have not recorded any impairment charges.

f O R t Y- O n e
We record flight equipment at fair value if we determine the carrying value may not be recoverable. We principally use the income approach to measure the fair value of aircraft. the income approach is based on the present value of cash flows from contractual lease agreements and projected future lease payments, including contingent rentals, net of expenses, which extend to the end of the aircraft’s economic life in its highest and best use configuration, as well as a disposition value based on expectations of market participants. these valuations are considered Level 3 valuations, as the valuations contain significant non-observable inputs.
Stock-based compensationto compensate and incentivize our employees and directors, we grant stock-based compensation awards. to date, we have granted stock options (“Stock Options”) and restricted stock units (“RSUs”). All share-based payment awards granted have been equity classified awards. We account for Stock Options by estimating the grant date fair value of the award as calculated by the Black-Scholes-Merton (“BSM”) option-pricing model and amortizing that value on a straight-line basis over the requisite service period less any anticipated forfeitures. the fair value of book-value RSUs is determined based on the closing market price of the Company’s Class A Common Stock on the date of grant, while the fair value of total Shareholder Return (“tSR”) RSUs is determined at the grant date using a Monte Carlo simulation model. included in the Monte Carlo simulation model are certain assumptions regarding a number of highly complex and subjective variables, such as expected volatility, risk-free interest rate and expected dividends. to appropriately value the award, the risk-free interest rate is estimated for the time period from the valuation date until the vesting date and the historical volatilities are estimated based on a historical timeframe equal to the time from the valuation date until the end date of the performance period. Due to our limited stock history since the completion of our initial public offering on April 25, 2011, historical volatility was estimated based on all available information including peer group volatility.
the estimation of the fair value of share-based awards requires considerable judgment. for future awards, we will be required to continue to make such judgments, and while we intend to continue to use the approach discussed above to make key estimates, there can be no assurance that changes in such estimates will not have a significant impact to our results of operations in the future.
Income taxesWe use the asset and liability method of accounting for income taxes. Under the asset and liability method, deferred income taxes are recognized for the tax consequences of “temporary differences” by applying enacted statutory tax rates applicable to future years to differences between the financial statement carrying amounts and the tax basis of existing assets and liabilities. the effect on deferred taxes of a change in the tax rates is recognized in income in the period that includes the enactment date. We record a valuation allowance for deferred tax assets when the probability of realization of the full value of the asset is less than 50%. Based on the timing of reversal of deferred tax liabilities, future anticipated taxable income based on lease and debt arrangements in place at the balance sheet date and tax planning strategies available to us, our management considers the deferred tax asset recoverable. Should events occur in the future that make the likelihood of recovery of deferred tax assets less than 50%, a deferred tax valuation allowance will be required that could have a significant impact on our results of operations and financial condition.
We recognize the impact of a tax position, if that position has a probability of greater than 50% that it would be sus-tained on audit, based on the technical merits of the position. Recognized income tax positions are measured at the largest amount that has a probability of more than 50% of being realized. Changes in recognition or measurement are reflected in the period in which the change in judgment occurs. As our business develops, we may take tax positions that have a probability of less than 50% of being sustained on audit which will require us to reserve for such positions. if these tax positions are audited by a taxing authority, there can be no assurance that the ultimate resolution of such tax positions will not result in further losses. Such losses could have a significant impact on our results of operations and financial condition.

f O R t Y- t W O
QUANTITATIVE AND QUALITATIVE DISCLOSURES ABOUT MARKET RISKMarket risk represents the risk of changes in value of a financial instrument, caused by fluctuations in interest rates and foreign exchange rates. Changes in these factors could cause fluctuations in our results of operations and cash flows. We are exposed to the market risks described below.
Interest Rate Risk
the nature of our business exposes us to market risk arising from changes in interest rates. Changes, both increases and decreases, in our cost of borrowing, as reflected in our composite interest rate, directly impact our net income. Our lease rental stream is generally fixed over the life of our leases, whereas we have used floating-rate debt to finance a significant portion of our aircraft acquisitions. As of December 31, 2013, we had $2.23 billion in floating-rate debt. As of December 31, 2012, we had $2.03 billion in floating-rate debt. if interest rates increase, we would be obli-gated to make higher interest payments to our lenders. if we incur significant fixed-rate debt in the future, increased interest rates prevailing in the market at the time of the incurrence of such debt would also increase our interest expense. if our composite rate were to increase by 1.0%, we would expect to incur additional interest expense on our existing indebtedness as of December 31, 2013 and December 31, 2012 of approximately $22.3 million and $20.3 million, each on an annualized basis, which would put downward pressure on our operating margins. the increase in additional interest expense the Company would incur is primarily due to an increase in the floating-rate debt outstanding as of December 31, 2013 compared to December 31, 2012.
We also have interest rate risk on our forward lease placements. this is caused by us setting a fixed lease rate in advance of the delivery date of an aircraft. the delivery date is when a majority of the financing for an aircraft is arranged. We partially mitigate the risk of an increasing interest rate environment between the lease signing date and the delivery date of the aircraft, by having interest rate adjusters in a majority of our forward lease contracts which would adjust the final lease rate upward if certain benchmark interest rates are higher at the time of delivery of the aircraft than at the lease signing date.
Foreign Exchange Rate Risk
the Company attempts to minimize currency and exchange risks by entering into aircraft purchase agreements and a majority of lease agreements and debt agreements with U.S. dollars as the designated payment currency. thus, most of our revenue and expenses are denominated in U.S. dollars. As of December 31, 2013 and December 31, 2012, 1.6% and 2.5%, respectively, of our lease revenues were denominated in euros. As our principal currency is the U.S. dollar, fluctuations in the U.S. dollar as compared to other major currencies should not have a significant impact on our future operating results.
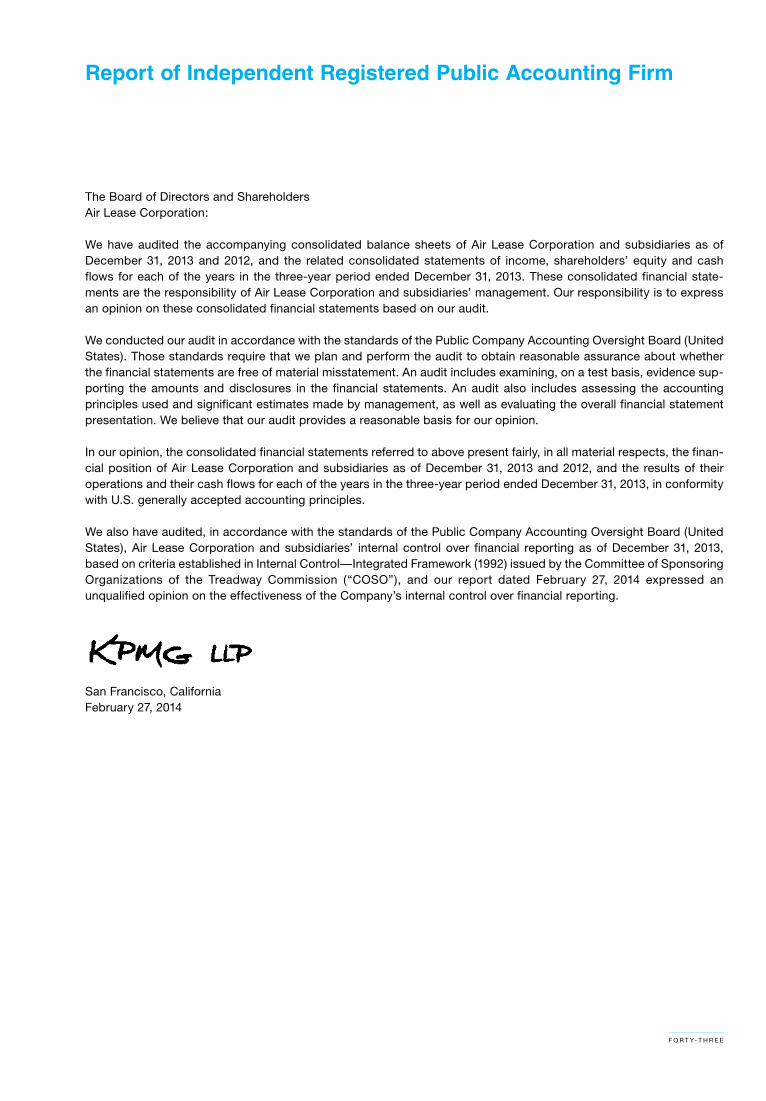
f O R t Y- t H R e e
the Board of Directors and ShareholdersAir Lease Corporation:
We have audited the accompanying consolidated balance sheets of Air Lease Corporation and subsidiaries as of December 31, 2013 and 2012, and the related consolidated statements of income, shareholders’ equity and cash flows for each of the years in the three-year period ended December 31, 2013. these consolidated financial state-ments are the responsibility of Air Lease Corporation and subsidiaries’ management. Our responsibility is to express an opinion on these consolidated financial statements based on our audit.
We conducted our audit in accordance with the standards of the Public Company Accounting Oversight Board (United States). those standards require that we plan and perform the audit to obtain reasonable assurance about whether the financial statements are free of material misstatement. An audit includes examining, on a test basis, evidence sup-porting the amounts and disclosures in the financial statements. An audit also includes assessing the accounting principles used and significant estimates made by management, as well as evaluating the overall financial statement presentation. We believe that our audit provides a reasonable basis for our opinion.
in our opinion, the consolidated financial statements referred to above present fairly, in all material respects, the finan-cial position of Air Lease Corporation and subsidiaries as of December 31, 2013 and 2012, and the results of their operations and their cash flows for each of the years in the three-year period ended December 31, 2013, in conformity with U.S. generally accepted accounting principles.
We also have audited, in accordance with the standards of the Public Company Accounting Oversight Board (United States), Air Lease Corporation and subsidiaries’ internal control over financial reporting as of December 31, 2013, based on criteria established in internal Control—integrated framework (1992) issued by the Committee of Sponsoring Organizations of the treadway Commission (“COSO”), and our report dated february 27, 2014 expressed an unqualified opinion on the effectiveness of the Company’s internal control over financial reporting.
San francisco, Californiafebruary 27, 2014
Report of Independent Registered Public Accounting Firm

f O R t Y- f O U R
December 31, 2013 December 31, 2012
(in thousands, except share data)
ASSETSCash and cash equivalents $ 270,173 $ 230,089Restricted cash 87,308 106,307flight equipment subject to operating leases 8,234,315 6,598,898 Less accumulated depreciation (621,180) (347,035)
7,613,135 6,251,863Deposits on flight equipment purchases 1,075,023 564,718Deferred debt issue costs—less accumulated amortization of $51,578 and $32,288 as of December 31, 2013 and December 31, 2012, respectively 90,249 74,219Other assets 196,716 126,428
total assets $9,332,604 $7,353,624
LIABILITIES AND SHAREHOLDERS’ EQUITYAccrued interest and other payables $ 131,223 $ $90,169Debt financing 5,853,317 4,384,732Security deposits and maintenance reserves on flight equipment leases 569,847 412,223Rentals received in advance 61,520 41,137Deferred tax liability 193,263 92,742
total liabilities $6,809,170 $5,021,003
Shareholders’ equityPreferred Stock, $0.01 par value; 50,000,000 shares authorized; no shares issued or outstanding — —Class A Common Stock, $0.01 par value; authorized 500,000,000 shares; issued and outstanding 101,822,676 and 99,417,998 shares at December 31, 2013 and December 31, 2012, respectively 1,009 991Class B non-Voting Common Stock, $0.01 par value; authorized 10,000,000 shares; issued and outstanding 0 and 1,829,339 shares at December 31, 2013 and December 31, 2012, respectively — 18Paid-in capital 2,209,566 2,198,501Retained earnings 312,859 133,111
total shareholders’ equity $2,523,434 $2,332,621
total liabilities and shareholders’ equity $9,332,604 $7,353,624
See notes to Consolidated financial Statements.
Consolidated Balance Sheets

f O R t Y- f i V e
Year ended December 31, 2013
Year ended December 31, 2012
Year ended December 31, 2011
(in thousands, except share data)
REVENUES Rental of flight equipment $ 836,516 $ 645,853 $332,719 Aircraft sales, trading and other 22,159 9,893 4,022
total revenues 858,675 655,746 336,741ExPENSES interest 168,743 130,419 44,862 Amortization of discounts and deferred debt issue costs 23,627 16,994 9,481 extinguishment of debt — — 3,349
interest expense 192,370 147,413 57,692 Depreciation of flight equipment 280,037 216,219 112,307 Selling, general and administrative 71,212 56,453 44,559 Stock-based compensation 21,614 31,688 39,342
total expenses 565,233 451,773 253,900
income before taxes 293,442 203,973 82,841 income tax expense (103,031) (72,054) (29,609)
net income $ 190,411 $ 131,919 $ 53,232
net income per share of Class A and Class B Common Stock: Basic $ 1.88 $ 1.31 $ 0.59 Diluted $ 1.80 $ 1.28 $ 0.59Weighted-average shares outstanding: Basic 101,529,137 100,991,871 89,592,945 Diluted 108,963,550 107,656,463 90,416,346
See notes to Consolidated financial Statements.
Consolidated Statements of Income

f O R t Y- S i X
Consolidated Statements of Shareholders’ Equity
Preferred Stock
Class A Common Stock
Class B non-Voting Common Stock
Paid-in Capital
Retained earnings totalShares Amount Shares Amount Shares Amount
(in thousands, except share data)
Balance at December 31, 2010 — — 63,563,810 $ 636 1,829,339 $ 18 $1,276,321 $ (52,040) $1,224,935Class A Common Stock issuance — — 34,825,470 348 — — 866,882 — 867,230issuance of restricted stock units — — 843,975 — — — — — —tax withholdings on stock-based compensation — — (348,124) — — — (8,456) — (8,456)Stock-based compensation — — — — — — 39,342 — 39,342net income — — — — — — — 53,232 53,232
Balance at December 31, 2011 — — 98,885,131 $ 984 1,829,339 $ 18 $2,174,089 $ 1,192 $2,176,283
Class A Common Stock issuance — — — — — — (97) — (97)exercise of incentive stock options — — 7,000 7 — — 133 — 140issuance of restricted stock units — — 890,110 — — — — — —tax withholdings on stock-based compensation — — (364,243) — — — (7,312) — (7,312)Stock-based compensation — — — — — — 31,688 — 31,688net income — — — — — — — 131,919 131,919
Balance at December 31, 2012 — — 99,417,998 $ 991 1,829,339 $ 18 $2,198,501 $133,111 $2,332,621
exercise of incentive stock options — — 167 — — — — — —exercise of warrants — — 63,481 — — — — — —issuance of restricted stock units — — 959,873 — — — — — —Common stock exchanged — — 1,829,339 18 (1,829,339) (18) — — —Cash dividends declared ($0.105 per share) — — — — — — — (10,663) (10,663)tax benefits from stock-based compensation arrangements — — — — — — 2,115 — 2,115tax withholdings on stock-based compensation — — (448,182) — — — (12,664) — (12,664)Stock-based compensation — — — — — — 21,614 — 21,614net income — — — — — — — 190,411 190,411
Balance at December 31, 2013 — — 101,822,676 $ 1,009 — — $2,209,566 $312,859 $2,523,434
See notes to Consolidated financial Statements.

f O R t Y- S e V e n
Year ended
December 31, 2013
Year ended
December 31, 2012
Year ended
December 31, 2011
(dollars in thousands)
OPERATING ACTIVITIES net income $ 190,411 $ 131,919 $ 53,232 Adjustments to reconcile net income to net cash provided by operating activities: Depreciation of flight equipment 280,037 216,219 112,307 Stock-based compensation 21,614 31,688 39,342 Deferred taxes 102,636 72,050 29,567 tax benefits from stock-based compensation arrangements (2,115) — — Amortization of discounts and deferred debt issue costs 23,627 16,994 9,481 extinguishment of debt — — 3,349 Changes in operating assets and liabilities: Other assets (21,887) (18,758) (17,438) Accrued interest and other payables 39,507 25,797 19,347 Rentals received in advance 20,383 15,120 17,979
net cash provided by operating activities 654,213 491,029 267,166
INVESTING ACTIVITIES Acquisition of flight equipment under operating lease (1,329,619) (1,899,231) (2,529,901) Payments for deposits on flight equipment purchases (828,839) (418,278) (360,587) Proceeds from aircraft sales and trading 97,748 47,490 — Acquisition of furnishings, equipment and other assets (125,184) (74,905) (86,668)
net cash used in investing activities (2,185,894) (2,344,924) (2,977,156)
FINANCING ACTIVITIES issuance of common stock and warrants — 43 867,230 Cash dividends paid (7,608) — — tax withholdings on stock-based compensation (12,664) (7,312) (8,456) tax benefits from stock-based compensation arrangements 2,115 issuance of convertible notes — — 193,000 net change in unsecured revolving facilities 388,000 62,000 238,000 Proceeds from debt financings 1,608,854 2,115,607 1,344,530 Payments in reduction of debt financings (531,831) (432,129) (84,796) Restricted cash 18,999 (10,150) (47,481) Debt issue costs (37,535) (42,149) (13,933) Security deposits and maintenance reserve receipts 172,662 142,541 180,862 Security deposits and maintenance reserve disbursements (29,227) (26,272) (5,982)
net cash provided by financing activities 1,571,765 1,802,179 2,662,974
net increase (decrease) in cash 40,084 (51,716) (47,016)Cash and cash equivalents at beginning of period 230,089 281,805 328,821
Cash and cash equivalents at end of period $ 270,173 $ 230,089 $ 281,805
SUPPLEMENTAL DISCLOSURE OF CASH FLOw INFORMATION Cash paid during the period for interest, including capitalized interest
of $32,659, $19,388 and $10,390 for the years ended December 31, 2013, 2012 and 2011, respectively $ 188,464 $ 124,731 $ 51,986
SUPPLEMENTAL DISCLOSURE OF NONCASH ACTIVITIES Buyer-furnished equipment, capitalized interest and deposits on flight
equipment purchases applied to acquisition of flight equipment under operating leases and other assets $ 410,441 $ 377,892 $ 190,013
Cash dividends declared, not yet paid $ 3,055 — — net book value of flight equipment under operating leases that was
transferred to other assets to record proceeds receivable for the sale of one aircraft and the insured total loss of another aircraft from our operating lease portfolio $ 48,991 — —
See notes to Consolidated financial Statements.
Consolidated Statements of Cash Flows

f O R t Y- e i G H t

Notes to Consolidated Financial Statements
f O R t Y- n i n e
NOTE 1. SUMMARY OF SIGNIFICANT ACCOUNTING POLICIESOrganizationAir Lease Corporation is a leading aircraft leasing company that was founded by aircraft leasing industry pioneer, Steven f. Udvar-Házy. We are principally engaged in purchasing new commercial jet transport aircraft from Boeing and Airbus. We lease these aircraft to airlines throughout the world to generate attractive returns on equity. As of December 31, 2013 we owned a fleet of 193 aircraft and had 327 aircraft on order with the manufacturers. in addition to our leasing activities, we sell aircraft from our fleet to other leasing companies, financial services companies and airlines. We also provide fleet management services to investors and owners of aircraft portfolios for a management fee.
Principles of consolidationthe Company consolidates financial statements of all entities in which we have a controlling financial interest, includ-ing the account of any Variable interest entity in which we have a controlling financial interest and for which we are the primary beneficiary. All material intercompany balances are eliminated in consolidation.
Rental of flight equipmentthe Company leases flight equipment principally under operating leases and reports rental income ratably over the life of each lease. Rentals received, but unearned, under the lease agreements are recorded in Rentals received in advance on the Company’s Consolidated Balance Sheet until earned. the difference between the rental income recorded and the cash received under the provisions of the lease is included in Lease receivables, as a component of Other assets on the Company’s Consolidated Balance Sheet. An allowance for doubtful accounts will be recognized for past-due rentals based on management’s assessment of collectability. Management monitors all lessees with past due lease payments and discusses relevant operational and financial issues facing those lessees in order to determine an appropriate allowance for doubtful accounts. in addition, if collection is not reasonably assured, the Company will not recognize rental income for amounts due under the Company’s lease contracts and will recognize revenue for such lessees on a cash basis. As of December 31, 2013 and 2012, the Company had no such allowance, and no leases were on a cash basis.
All of the Company’s lease agreements are triple net leases whereby the lessee is responsible for all taxes, insurance, and aircraft maintenance. in the future, we may incur repair and maintenance expenses for off-lease aircraft. We rec-ognize repair and maintenance expense in our Consolidated Statements of income for all such expenditures. in many operating lease contracts, the lessee is obligated to make periodic payments, which are calculated with reference to the utilization of the airframe, engines and other major life-limited components during the lease. in these leases, we will make a payment to the lessee to compensate the lessee for the cost of the Qualifying event incurred, up to the maximum of the amount of Maintenance Reserves made by the lessee during the lease term, net of previous reim-bursements. these payments are made upon the lessee’s presentation of invoices evidencing the completion of such Qualifying event. the Company records as “Rental of flight equipment” revenue, the portion of Maintenance Reserves that is virtually certain will not be reimbursed to the lessee. Maintenance Reserves payments which we may be required to reimburse to the lessee are reflected in our overhaul reserve liability, as a component of “Security deposits and overhaul reserves on flight equipment leases” in our Consolidated Balance Sheet.
Lessee-specific modifications are capitalized as initial direct costs and amortized over the term of the lease into rental revenue in our Consolidated Statements of income.
Initial direct coststhe Company records as period costs those internal and other costs incurred in connection with identifying, negotiat-ing and delivering aircraft to the Company’s lessees. Amounts paid by us to lessees, or other parties, in connection with the lease transactions are capitalized and amortized as a reduction to lease revenue over the lease term.

f i f t Y
Cash and cash equivalentsthe Company considers cash and cash equivalents to be cash on hand and highly liquid investments with original maturity dates of 90 days or less.
Restricted cashRestricted cash consists of pledged security deposits, maintenance reserves, and rental payments related to secured aircraft financing arrangements.
Flight equipmentflight equipment under operating lease is stated at cost less accumulated depreciation. Purchases, major additions and modifications, and interest on deposits during the construction phase are capitalized. the Company generally depreciates passenger aircraft on a straight-line basis over a 25-year life from the date of manufacture to a 15% residual value. Changes in the assumption of useful lives or residual values for aircraft could have a significant impact on the Company’s results of operations and financial condition.
At the time flight equipment is retired or sold, the cost and accumulated depreciation are removed from the related accounts and the difference, net of proceeds, is recorded as a gain or loss in our Consolidated Statements of income.
Management evaluates on a quarterly basis the need to perform an impairment test whenever facts or circumstances indicate a potential impairment has occurred. An assessment is performed whenever events or changes in circum-stances indicate that the carrying amount of an aircraft may not be recoverable. Recoverability of an aircraft’s carrying amount is measured by comparing the carrying amount of the aircraft to future undiscounted net cash flows expected to be generated by the aircraft. the undiscounted cash flows consist of cash flows from currently contracted leases, future projected lease rates and estimated residual or scrap values for each aircraft. We develop assumptions used in the recoverability analysis based on our knowledge of active lease contracts, current and future expectations of the global demand for a particular aircraft type, and historical experience in the aircraft leasing market and aviation indus-try, as well as information received from third-party industry sources. the factors considered in estimating the undis-counted cash flows are affected by changes in future periods due to changes in contracted lease rates, economic conditions, technology and airline demand for a particular aircraft type. in the event that an aircraft does not meet the recoverability test, the aircraft will be recorded at fair value in accordance with the Company’s fair Value Policy, result-ing in an impairment charge. Our fair Value Policy is described below under “fair Value Measurements.” As of December 31, 2013 and 2012, no impairment charges have been incurred to date.
Capitalized interestthe Company may borrow funds to finance deposits on new flight equipment purchases. the Company capitalizes interest expense on such borrowings. the capitalized amount is calculated using our composite borrowing rate and is recorded as an increase to the cost of the flight equipment on our Consolidated Balance Sheet.
Fair value measurementsfair value is the amount that would be received to sell an asset or paid to transfer a liability in an orderly transaction between market participants at the measurement date. the Company measures the fair value of certain assets on a non-recurring basis, principally our flight equipment, when Generally Accepted Accounting Principles (“GAAP”) requires the application of fair value, including events or changes in circumstances that indicate that the carrying amounts of assets may not be recoverable.

f i f t Y- O n e
the Company records flight equipment at fair value when we determine the carrying value may not be recoverable. the Company principally uses the income approach to measure the fair value of flight equipment. the income approach is based on the present value of cash flows from contractual lease agreements and projected future lease payments, including contingent rentals, net of expenses, which extend to the end of the aircraft’s economic life in its highest and best use configuration, as well as a disposition value based on expectations of market participants. these valuations are considered Level 3 valuations, as the valuations contain significant non-observable inputs.
Income taxesthe Company uses the asset and liability method of accounting for income taxes. Under the asset and liability method, deferred income taxes are recognized for the tax consequences of “temporary differences” by applying enacted statutory tax rates applicable to future years to differences between the financial statement carrying amounts and the tax basis of existing assets and liabilities. the effect on deferred taxes of a change in the tax rates is recognized in income in the period that includes the enactment date. the Company records a valuation allowance for deferred tax assets when the probability of realization of the full value of the asset is less than 50%. the Company recognizes the impact of a tax position, if that position is more than 50% likely to be sustained on audit, based on the technical merits of the position. Recognized income tax positions are measured at the largest amount that is greater than 50% likely to be realized. Changes in recognition or measurement are reflected in the period in which the change in judgment occurs.
the Company recognizes interest and penalties for uncertain tax positions in income tax expense.
Deferred coststhe Company incurs debt issue costs in connection with debt financings. those costs are deferred and amortized over the life of the specific loan using the effective interest method and charged to interest expense. the Company also incurs costs in connection with equity offerings. Such costs are deferred until the equity offering is completed and either netted against the equity raised, or expensed if the equity offering is abandoned.
Stock-based compensationStock-based compensation cost is measured at the grant date based on the fair value of the award. the Company recognizes compensation costs for shares that are expected to vest, on a straight-line basis, over the requisite service period of the award.
Use of estimatesthe preparation of financial statements in conformity with GAAP requires management to make estimates and assumptions that affect the amounts reported in the financial statements and accompanying notes. Actual results could differ from those estimates.

f i f t Y- t W O
NOTE 2. DEBT FINANCINGthe Company’s consolidated debt as of December 31, 2013 and 2012 is summarized below:
December 31, 2013 December 31, 2012
(dollars in thousands)
UnSeCUReD Senior notes $3,055,620 $1,775,000 Revolving credit facilities 808,000 420,000 term financings 247,722 248,916 Convertible senior notes 200,000 200,000
4,311,342 2,643,916SeCUReD Warehouse facilities 828,418 1,061,838 term financings 654,369 688,601 export credit financing 71,539 —
1,554,326 1,750,439 total secured and unsecured debt financing 5,865,668 4,394,355 Less: Debt discount (12,351) (9,623)
total debt $5,853,317 $4,384,732
At December 31, 2013, we were in compliance in all material respects with the covenants in our debt agreements, including our financial covenants concerning debt-to-equity, tangible net equity and interest coverage ratios.
the Company’s secured obligations as of December 31, 2013 and 2012 are summarized below:
December 31, 2013 December 31, 2012
(dollars in thousands)
nonrecourse $ 847,684 $1,085,941Recourse 706,642 664,498
total $1,554,326 $1,750,439number of aircraft pledged as collateral 52 55net book value of aircraft pledged as collateral $2,454,350 $2,728,636
Senior unsecured notesAs of December 31, 2013, the Company had $3.1 billion in senior unsecured notes outstanding. As of December 31, 2012, the Company had $1.8 billion in senior unsecured notes outstanding.
During the year ended December 31, 2013, the Company issued $1.3 billion in aggregate principal amount of senior unsecured notes.
On february 5, 2013, the Company issued $400.0 million in aggregate principal amount of senior unsecured notes due 2020 that bear interest at a rate of 4.75% per annum.
On June 26, 2013, the Company concluded its offer to exchange up to $151.6 million aggregate principal amount of new notes for any and all of its outstanding 7.375% senior unsecured notes due January 30, 2019 and issued $132.0 million aggregate principal amount of its 5.625% senior notes due 2017 in exchange for $125.4 million aggregate principal amount of the old notes.

f i f t Y- t H R e e
effective August 26, 2013, the additional interest of 0.50% per annum assessed on the senior unsecured notes due 2017 was eliminated due to the investment grade rating of the notes by S&P.
On October 1, 2013, the Company issued $185.0 million in aggregate principal amount of senior unsecured notes in a private placement to institutional investors. the notes are comprised of $53.0 million of 3.64% senior unsecured notes due 2016 and $132.0 million of 4.49% senior unsecured notes due 2019.
On november 19, 2013, the Company issued $700.0 million in aggregate principal amount of senior unsecured notes due 2019 that bear interest at a rate of 3.375% per annum.
Unsecured revolving credit facilitiesthe total amount outstanding under our unsecured revolving credit facilities was $808.0 million and $420.0 million as of December 31, 2013 and December 31, 2012, respectively.
the Company has in place a senior unsecured revolving credit facility (the “Syndicated Unsecured Revolving Credit facility”), dated May 7, 2013, as amended, which provides us with financing of up to $2.0 billion. the Syndicated Unsecured Revolving Credit facility accrues interest at a rate of LiBOR plus 1.25% on drawn balances and includes a 0.25% facility fee. the facility will mature in May 2017.
in May 2013, the Company amended its Syndicated Unsecured Revolving Credit facility. Pursuant to the amendment, we increased the maximum amount we can borrow by $657.0 million to $1.7 billion, extended the availability period from 3 years to 4 years to May 2017, and reduced the pricing from LiBOR plus a margin of 1.75% with no LiBOR floor and an undrawn fee of 0.375% to LiBOR plus 1.45% with no LiBOR floor and a 0.30% facility fee.
in november 2013, the Company increased the maximum amount it can borrow under its Syndicated Unsecured Revolving Credit facility by an additional $300.0 million to $2.0 billion.
effective August 26, 2013, the pricing of our Syndicated Unsecured Revolving Credit facility has been further reduced to LiBOR plus 1.25% with no LiBOR floor and a 0.25% facility fee as a result of the investment grade corporate credit rating obtained from S&P.
Unsecured term financingsfrom time to time, the Company enters into unsecured term facilities. During 2013, the Company entered into four additional unsecured term facilities aggregating $131.0 million with terms ranging from four to five years and with three of them bearing interest at fixed rates ranging from 3.10% to 3.50% per annum and the fourth bearing interest at a floating rate of LiBOR plus a margin of 1.25% per annum. the outstanding balance on our unsecured term facilities as of December 31, 2013 and December 31, 2012 was $247.7 million and $248.9 million, respectively.
Convertible senior notesin november 2011, the Company issued $200.0 million in aggregate principal amount of 3.875% convertible senior notes due 2018 (the “Convertible notes”) in an offering exempt from registration under the Securities Act. the Convertible notes were sold to Qualified institutional Buyers in reliance upon Rule 144A under the Securities Act. the Convertible notes are senior unsecured obligations of the Company and bear interest at a rate of 3.875% per annum, payable semi-annually in arrears on June 1 and December 1 of each year, commencing on June 1, 2012. the Convertible notes are convertible at the option of the holder into shares of our Class A Common Stock at a price of $30.23 per share.

f i f t Y- f O U R
Warehouse facilitiesWe have a revolving credit facility (the “2010 Warehouse facility”), dated June 21, 2013, as amended. the 2010 Warehouse facility, as amended, provides the Company with financing of up to $1.0 billion, modified from the previ-ous facility size of $1.25 billion. the interest rate on the 2010 Warehouse facility was reduced from LiBOR plus 2.50% to LiBOR plus 2.25% on drawn balances and from 0.75% to 0.50% per annum on undrawn balances and provided a 10% unsecured guarantee on the 2010 Warehouse facility. the Company is able to draw on the 2010 Warehouse facility during an availability period that was extended from June 2013 to June 2015. the outstanding drawn balance at the end of the availability period may be converted at our option to an amortizing term loan with a subsequent term out option through 2018, with an interest rate of LiBOR plus 3.00% during the initial three years of the term and margin step-ups during the remaining six months that increase the interest rate to LiBOR plus 4.50%.
As of December 31, 2013, the Company had borrowed $656.8 million under the 2010 Warehouse facility and pledged 24 aircraft as collateral with a net book value of $985.2 million. As of December 31, 2012, the Company had borrowed $877.7 million under the 2010 Warehouse facility and pledged 30 aircraft as collateral with a net book value of $1.3 billion. the Company had pledged cash collateral and lessee deposits of $65.4 million and $98.6 million under the 2010 Warehouse facility as of December 31, 2013 and December 31, 2012, respectively.
in March 2012, we entered into a non-recourse $192.8 million senior secured warehouse facility (the “2012 Warehouse facility”) to refinance a pool of eight aircraft previously financed under the Company’s 2010 Warehouse facility.
As of December 31, 2013, the Company had borrowed $171.6 million under the 2012 Warehouse facility and pledged eight aircraft as collateral with a net book value of $245.7 million. the Company had pledged cash collateral and les-see deposits of $7.6 million under the 2012 Warehouse facility as of December 31, 2013. As of December 31, 2012, the Company had borrowed $184.1 million under the 2012 Warehouse facility and pledged eight aircraft as collateral with a net book value of $256.6 million. the Company had pledged cash collateral and lessee deposits of $5.8 million under the 2012 Warehouse facility as of December 31, 2012.
Secured term financingthe Company funds some aircraft purchases through secured term financings. Wholly-owned subsidiaries of the Company will borrow through secured bank facilities to purchase an aircraft. the aircraft are then leased by the wholly-owned subsidiaries to airlines. the Company may guarantee the obligations of the wholly-owned subsidiaries under the loan agreements. the loans may be secured by a pledge of the shares of the subsidiary, the aircraft, the lease receivables, security deposits, maintenance reserves or a combination thereof.
During the year ended December 31, 2013, the Company entered into three additional secured term facilities aggre-gating $135.0 million with terms ranging from six to seven years and with two of them bearing interest at floating rates ranging from LiBOR plus a margin of 2.15% to 2.85% per annum and the third bearing interest at a fixed-rate of 4.25% per annum.
in September 2013, the Company amended an existing portfolio of six secured term loans aggregating $168.3 million with one of its lenders. Pursuant to the amendments, we reduced the composite interest rate of the loans by 40 basis points, extended certain loan maturities and improved the principal amortization profiles of the loans.
As of December 31, 2013, the outstanding balance on our secured term facilities was $654.4 million and we had pledged 18 aircraft as collateral with a net book value of $1.14 billion. the outstanding balance under our secured term facilities as of December 31, 2013 was comprised of $153.9 million fixed-rate debt and $505.5 million floating-rate debt, with interest rates ranging from 4.25% to 5.36% and LiBOR plus 1.5% to LiBOR plus 3.0%, respectively.

f i f t Y- f i V e
As of December 31, 2012, the outstanding balance on our secured term facilities was $688.6 million and we had pledged 17 aircraft as collateral with a net book value of $1.15 billion. the outstanding balance under our secured term facilities as of December 31, 2012 was comprised of $159.1 million fixed-rate debt and $529.5 million floating-rate debt, with interest rates ranging from 4.28% to 5.36% and LiBOR plus 1.50% to LiBOR plus 3.59%, respectively.
Export credit financingsin March 2013, the Company issued $76.5 million in secured notes due 2024 guaranteed by the ex-im Bank. the notes will mature on August 15, 2024 and will bear interest at a rate of 1.617% per annum. the Company used the proceeds of the offering to refinance a portion of the purchase price of two Boeing 737-800 aircraft and the related premium charged by ex-im Bank for its guarantee of the notes.
MaturitiesMaturities of debt outstanding as of December 31, 2013 are as follows:
(dollars in thousands)
Years ending December 31,
2014 $ 214,0952015 264,0042016 943,6372017 2,210,2512018 709,246thereafter 1,524,435
total(1)(2) $5,865,668
(1) As of December 31, 2013, the Company had $656.8 million of debt outstanding under the 2010 Warehouse facility. the Company is able to draw on the facility during an availability period that ends in June 2015 with a subsequent term out option, through 2018 which is the maturity in the schedule above.
(2) As of December 31, 2013, the Company had $808.0 million of debt outstanding under our revolv-ing credit facilities. the outstanding drawn balances may be rolled until the maturity date of each respective facility and have been presented as such in the maturity schedule above.
NOTE 3. INTEREST ExPENSEthe following table shows the components of interest for the years ended December 31, 2013, 2012 and 2011:
Year ended December 31, 2013
Year ended December 31, 2012
Year ended December 31, 2011
(dollars in thousands)
interest on borrowings $ 201,402 $ 149,807 $ 55,252Less capitalized interest (32,659) (19,388) (10,390)
interest 168,743 130,419 44,862Amortization of discounts and deferred debt issue costs 23,627 16,994 9,481extinguishment of debt — — 3,349
interest expense $ 192,370 $ 147,413 $ 57,692

f i f t Y- S i X
NOTE 4. SHAREHOLDERS’ EQUITYin 2010, the Company authorized 500,000,000 shares of Class A Common Stock, $0.01 par value per share, of which 101,822,676 and 99,417,998 shares were issued and outstanding as of December 31, 2013 and 2012, respectively. As of December 31, 2013 and 2012, the Company had authorized 10,000,000 shares of Class B non-Voting Common Stock, $0.01 par value per share, of which no shares were outstanding as of December 31, 2013 and 1,829,339 of which were outstanding as of December 31, 2012.
each share of Class B non-Voting Common Stock is convertible into one share of Class A Common Stock at the option of the holder, and is automatically converted at the time it is transferred to a third-party unaffiliated with such initial holder, subject to the transfer restrictions.
On October 15, 2013, the Company entered into an exchange agreement with an existing security holder of the Company, pursuant to which the Company agreed to issue 1,829,339 shares of its Class A Common Stock to such security holder in exchange for an equal number of shares of the Company’s Class B non-Voting Common Stock in a transaction (the “exchange”) exempt from registration pursuant to Section 3(a)(9) of the Securities Act of 1933, as amended. following the satisfaction of certain closing conditions, the exchange closed on October 17, 2013. no com-mission or other remuneration was paid or given directly or indirectly for solicitation of the exchange, and no cash consideration was paid for the shares of Class A Common Stock issued in the exchange. As a result of the exchange, the total number of outstanding shares of Class A Common Stock increased by 1,829,339 shares, and no shares of Class B non-Voting Common Stock are issued or outstanding. the exchange did not increase the total number of outstanding shares of the Company’s common stock used to compute basic and diluted net income per share.
On June 4, 2010, the Company issued 482,625 warrants to two institutional investors (the “Committed investors”). the warrants have a seven-year term and an exercise price of $20 per share. the Company used the BSM option pricing model to determine the fair value of warrants. the fair value of warrants was calculated on the date of grant by an option pricing model using a number of complex and subjective variables. these variables include expected stock price volatility over the term of the warrant, projected exercise behavior, a risk-free interest rate and expected divi-dends. the warrants had a fair value at the grant date of $5.6 million. the warrants are classified as an equity instru-ment and the proceeds from the issuance of common stock to the Committed investors was split between the warrants and the stock-based on fair value of the warrants and recorded as an increase to Paid-in capital on the Consolidated Balance Sheet. On October 21, 2013, one of the Committed investors performed a cashless exercise of all of its 214,500 warrants, resulting in the issuance of 63,481 shares of Class A Common Stock. As of December 31, 2013, the Company had 268,125 warrants remaining outstanding.
As of December 31, 2013 and 2012 the Company had authorized 50,000,000 shares of preferred stock, $0.01 par value per share, of which no shares were issued or outstanding.

f i f t Y- S e V e n
NOTE 5. RENTAL INCOMEAt December 31, 2013 minimum future rentals on non-cancelable operating leases of flight equipment in our fleet, which have been delivered as of December 31, 2013, are as follows:
(dollars in thousands)
Years ending December 31,
2014 $ 883,3062015 840,4092016 792,9182017 739,1192018 696,675thereafter 2,253,533
total $6,205,960
the Company earned $34.4 million, $25.0 million and $11.0 million in maintenance reserve revenue based on our les-sees’ usage of the aircraft for the years ended December 31, 2013, 2012 and 2011, respectively.
the following table shows the scheduled lease terminations (for the minimum non-cancelable period which does not include contracted unexercised lease extension options) by aircraft type for our operating lease portfolio as of february 27, 2014:
Aircraft type 2014 2015 2016 2017 2018 thereafter total
Airbus A319-100 — 2 — 2 2 — 6Airbus A320-200 — 3 2 2 2 33 42Airbus A321-200 — — 1 — 1 5 7Airbus A330-200 — — — 1 — 15 16Airbus A330-300 — — — — — 5 5Boeing 737-700 — — 3 — 2 5 10Boeing 737-800 — 11 5 5 4 25 50Boeing 767-300eR(1) — 1 2 — — — 3Boeing 777-200eR — — — — — 1 1Boeing 777-300eR — — — 1 — 5 6embraer e175-200 — — — — — 8 8embraer e190-100 — — — 1 — 22 23AtR 72-600 — — — — — 16 16
total — 17 13 12 11 140 193
(1) As of february 27, 2014, the Company had entered into a binding agreement for the sale of one Boeing 767-300eR aircraft with a scheduled lease termination in 2015.

f i f t Y- e i G H t
NOTE 6. CONCENTRATION OF RISKGeographical and credit risksAs of December 31, 2013, all of the Company’s rental of flight equipment revenues were generated by leasing flight equipment to foreign and domestic airlines, and the Company leased aircraft to 79 lessees in 47 countries as of December 31, 2013 compared to 69 lessees in 40 countries as of December 31, 2012.
Over 90% of our aircraft are operated internationally. the following table sets forth the regional concentration of our aircraft portfolio based on net book value as of December 31, 2013 and 2012:
December 31, 2013 December 31, 2012
Regionnet Book
Value% of total
net Book Value
% of total
(dollars in thousands)
Asia/Pacific $3,317,118 43.6% $2,245,002 35.9%europe 2,656,816 34.9% 2,398,531 38.4%Central America, South America and Mexico 829,930 10.9% 788,189 12.6%U.S. and Canada 436,653 5.7% 457,546 7.3%the Middle east and Africa 372,618 4.9% 362,595 5.8%
total $7,613,135 100.0% $6,251,863 100.0%
At December 31, 2013 and 2012, we leased aircraft to customers in the following regions:
December 31, 2013 December 31, 2012
Regionnumber of
Customers(1)
% of total
number of Customers(1)
% of total
Asia/Pacific 31 39.2% 28 40.6%europe 21 26.6% 17 24.6%Central America, South America and Mexico 12 15.2% 9 13.0%U.S. and Canada 8 10.1% 8 11.6%the Middle east and Africa 7 8.9% 7 10.2%
total 79 100.0% 69 100.0%
(1) A customer is an airline with its own operating certificate.

f i f t Y- n i n e
the following table sets forth the dollar amount and percentage of our rental of flight equipment revenues attributable to the indicated regions based on each airline’s principal place of business:
Year ended December 31, 2013
Year ended December 31, 2012
Year ended December 31, 2011
Region
Amount of Rental
Revenue% of total
Amount of Rental
Revenue% of total
Amount of Rental
Revenue% of total
(dollars in thousands)
Asia/Pacific $314,908 37.6% $215,537 33.4% $ 93,237 28.0%europe 300,761 35.9% 253,376 39.2% 151,566 45.6%Central America, South America and Mexico 107,857 12.9% 84,341 13.1% 30,714 9.2%U.S. and Canada 57,366 6.9% 53,201 8.2% 39,350 11.8%the Middle east and Africa 55,624 6.7% 39,398 6.1% 17,852 5.4%
total $836,516 100.0% $645,853 100.0% $332,719 100.0%
Based on our lease placements of future new aircraft deliveries, we anticipate that a growing percentage of our air-craft will be located in the Asia/Pacific, the Central America, South America and Mexico, and the Middle east and Africa regions.
in 2013, one country represented at least 10% of our rental of flight equipment revenue. for the year ended December 31, 2013, China attributed for $129.8 million or 15.5% of our rental of flight equipment revenue. in 2012, three countries represented at least 10% of our rental of flight equipment revenue. for the year ended December 31, 2012, China attributed for $75.5 million or 11.7% of our rental of flight equipment revenue, italy attributed for $71.0 million or 11.0% of our rental of flight equipment revenue and france attributed for $67.4 million or 10.4% of our rental of flight equip-ment revenue. in 2011, two countries represented at least 10% of our rental of flight equipment revenue. for the year ended December 31, 2011 China attributed for $39.6 million or 11.9% of our rental of flight equipment revenue and france attributed for $62.2 million or 18.7% of our rental of flight equipment revenue.
in 2013, no individual airline represented at least 10% of our rental of flight equipment revenue. in 2012, one airline represented at least 10% of our rental of flight equipment revenue. for the year ended December 31, 2012, Alitalia attributed for $71.0 million or 11.0% of our rental of flight equipment revenue. in 2011, one airline represented at least 10% of our rental of flight equipment revenue. for the year ended December 31, 2011 Air france attributed for $45.4 million or 13.7% of our rental of flight equipment revenue.
Currency riskthe Company attempts to minimize currency and exchange risks by entering into aircraft purchase agreements and a majority of lease agreements and debt agreements with U.S. dollars as the designated payment currency.

S i X t Y
NOTE 7. INCOME TAxESthe provision for income taxes consists of the following:
Year ended December 31, 2013
Year ended December 31, 2012
Year ended December 31, 2011
(dollars in thousands)
Current: federal — — — State — — — foreign $ 71 $ 4 $ 49Deferred: federal 102,887 71,932 29,102 State 147 118 458 foreign — — —
income tax expense $ 103,105 $72,054 $29,609
Differences between the provision for income taxes and income taxes at the statutory federal income tax rate are as follows:
Year ended December 31, 2013
Year ended December 31, 2012
Year ended December 31, 2011
Amount Percent Amount Percent Amount Percent
(dollars in thousands)
income taxes at statutory federal rate $102,705 35.0% $71,390 35.0% $28,997 35.0%State income taxes, net of federal income tax effect 95 0.1% 75 0.1% 298 0.3%Other 305 0.1% 589 0.2% 314 0.4%
$103,105 35.2% $72,054 35.3% $29,609 35.7%
the Company’s net deferred tax assets (liabilities) are as follows:Year ended
December 31, 2013Year ended
December 31, 2012
(dollars in thousands)
Assets (Liabilities) equity compensation $ 20,808 $ 20,521 net operating losses 36,786 43,676 Rents received in advance 21,575 14,436 Accrued bonus 3,578 2,457 Other 11,686 6,546 Aircraft depreciation (287,696) (180,378)
total (liabilities) assets $ (193,263) $ (92,742)
the Company has net operating loss carryforwards (nOLs) for federal income tax purposes of $108.7 million and $128.4 million as of December 31, 2013 and 2012, respectively, which are available to offset future taxable income in future periods and begin to expire in 2031. the Company has nOLs for state income tax purposes of $52.6 million and $49.9 million as of December 31, 2013 and 2012, respectively, which are available to offset future taxable income in future periods and begin to expire in 2030. the Company utilized $19.5 million of nOLs for federal income tax pur-poses for the year ended December 31, 2013. the Company recognizes tax benefits associated with stock-based compensation directly to stockholders’ equity only when realized. Accordingly, deferred tax assets are not recognized for net operating loss carryforwards resulting from windfall tax benefits. A windfall tax benefit occurs when the actual

S i X t Y- O n e
tax benefit realized upon an employee’s disposition of a share-based award exceeds the tax effect of the cumulative book compensation charge associated with the award. As of December 31, 2013 and 2012, the Company has windfall tax benefits of $3.7 million and $3.7 million, respectively, included in its U.S. net operating loss carry forward, but not reflected in deferred tax assets. the Company uses a tax law ordering approach to determine if the excess tax deductions’ associated compensation costs have reduced income taxes payable.
the Company has not recorded a deferred tax valuation allowance as of December 31, 2013 and 2012 as realization of the deferred tax asset is considered more likely than not. in assessing the realizability of the deferred tax assets man-agement considered whether future taxable income will be sufficient during the periods in which those temporary dif-ferences are deductible before nOLs expire. Management considers the scheduled reversal of deferred tax liabilities, projected taxable income and tax planning strategies in making this assessment. Management anticipates the timing differences on aircraft depreciation will reverse and be available for offsetting the reversal of deferred tax assets. As of December 31, 2013 and 2012 the Company has not recorded any liability for unrecognized tax benefits.
the Company files income tax returns in the U.S. and various state and foreign jurisdictions. the Company is subject to examinations by the major tax jurisdictions for the 2010 tax year and forward.
NOTE 8. COMMITMENTS AND CONTINGENCIESAircraft acquisitionAs of December 31, 2013, we had commitments to acquire a total of 327 new aircraft for delivery through 2023 as follows:
Aircraft type 2014 2015 2016 2017 2018 thereafter total
Airbus A321-200(1) 13 6 — — — — 19Airbus A320/321 neO — — 3 12 15 20 50Airbus A350 XWB(2) — — — — 1 29 30Boeing 737-800 13 20 15 11 — — 59Boeing 737-8/9 MAX(3) — — — — 8 96 104Boeing 777-300eR 5 8 2 — — — 15Boeing 787-9/10 — — — 1 7 37 45AtR 72-600 4 1 — — — — 5
total 35 35 20 24 31 182 327
(1) All of our Airbus A321-200 aircraft will be equipped with sharklets.(2) As of December 31, 2013, five of the Airbus A350-1000 aircraft were subject to reconfirmation.(3) As of December 31, 2013, 20 of the Boeing 737-8 MAX aircraft were subject to reconfirmation.

S i X t Y- t W O
Commitments for the acquisition of these aircraft and other equipment at an estimated aggregate purchase price (including adjustments for inflation) of approximately $27.5 billion as of December 31, 2013 are as follows:
(dollars in thousands)
Years ending December 31,
2014 $ 2,321,3922015 2,190,5172016 1,357,7362017 1,615,7892018 2,781,520thereafter 17,226,533
total $27,493,487
We have made non-refundable deposits on the aircraft for which we have commitments to purchase of $1.1 billion and $564.7 million as of December 31, 2013 and December 31, 2012, respectively, which are subject to manufacturer per-formance commitments. if we are unable to satisfy our purchase commitments, we may be forced to forfeit our deposits. further, we would be exposed to breach of contract claims by our lessees and manufacturers.
Office leasethe Company’s lease for office space provides for step rentals over the term of the lease. those rentals are consid-ered in the evaluation of recording rent expense on a straight-line basis over the term of the lease. tenant improve-ment allowances received from the lessor are deferred and amortized in selling, general and administrative expenses against rent expense. the Company recorded office lease expense of $2.1 million, $2.5 million and $2.1 million for the years ended December 31, 2013, 2012 and 2011, respectively.
Commitments for minimum rentals under the non-cancelable lease term at December 31, 2013 are as follows:
(dollars in thousands)
Years ending December 31,
2014 $ 2,0242015 2,0832016 2,1292017 2,1812018 2,580thereafter 15,387
total $26,384

S i X t Y- t H R e e
NOTE 9. NET EARNINGS PER SHAREBasic net earnings per share is computed by dividing net income by the weighted-average number of common shares outstanding for the period. Diluted earnings per share reflects the potential dilution that would occur if securities or other contracts to issue common stock were exercised or converted into common stock; however, potential common equivalent shares are excluded if the effect of including these shares would be anti-dilutive. the Company’s two classes of common stock, Class A and Class B non-Voting, have equal rights to dividends and income, and therefore, basic and diluted earnings per share are the same for each class of common stock.
Diluted net earnings per share takes into account the potential conversion of stock options, restricted stock units, and warrants using the treasury stock method and convertible notes using the if-converted method. for the year ended December 31, 2013, the Company excluded 150,000 shares related to stock options which are potentially dilutive secu-rities from the computation of diluted earnings per share because including these shares would be anti-dilutive. for the year ended December 31, 2012, the Company excluded 3,358,408 shares related to stock options which are potentially dilutive securities from the computation of diluted earnings per share because including these shares would be anti- dilutive. for the year ended December 31, 2011, the Company excluded 3,375,908 shares related to stock options which are potentially dilutive securities from the computation of diluted earnings per share because they were anti-dilutive. in addition, the Company excluded 1,569,005; 2,117,510 and 2,613,539 shares related to restricted stock units for which the performance metric had yet to be achieved as of December 31, 2013, 2012 and 2011, respectively.
the following table sets forth the reconciliation of basic and diluted net income per share:
Year ended December 31,
2013
Year ended December 31,
2012
Year ended December 31,
2011
(in thousands, except share data)
Basic net income per share: numerator net income $ 190,411 $ 131,919 $ 53,232 Denominator Weighted-average common shares outstanding 101,529,137 100,991,871 89,592,945Basic net income per share $ 1.88 $ 1.31 $ 0.59Diluted net income per share: numerator net income $ 190,411 $ 131,919 $ 53,232 interest on convertible senior notes 5,783 5,627 560
net income plus assumed conversions $ 196,194 $ 137,546 $ 53,792 Denominator number of shares used in basic computation 101,529,137 100,991,871 89,592,945 Weighted-average effect of dilutive securities 7,434,413 6,664,592 823,401
number of shares used in per share computation 108,963,550 107,656,463 90,416,346Diluted net income per share $ 1.80 $ 1.28 $ 0.59

S i X t Y- f O U R
NOTE 10. FAIR VALUE MEASUREMENTSAssets and liabilities measured at fair value on a recurring and non-recurring basisthe Company had no assets or liabilities which were measured at fair value on a recurring or non recurring basis as of December 31, 2013 or 2012.
Financial instruments not measured at fair valuesthe fair value of debt financing is estimated based on the quoted market prices for the same or similar issues, or on the current rates offered to the Company for debt of the same remaining maturities, which would be categorized as a Level 2 measurement in the fair value hierarchy. the estimated fair value of debt financing as of December 31, 2013 was $6,113.6 million compared to a book value of $5,853.3 million. the estimated fair value of debt financing as of December 31, 2012 was $4,517.6 million compared to a book value of $4,384.7 million.
the following financial instruments are not measured at fair value on the Company’s consolidated balance sheet at December 31, 2013, but require disclosure of their fair values: cash and cash equivalents and restricted cash. the estimated fair value of such instruments at December 31, 2013 and 2012 approximates their carrying value as reported on the consolidated balance sheet. the fair value of all these instruments would be categorized as Level 1 of the fair value hierarchy.
NOTE 11. STOCK-BASED COMPENSATIONin accordance with the Amended and Restated Air Lease Corporation 2010 equity incentive Plan (“Plan”), the number of stock options (“Stock Options”) and restricted stock units (“RSUs”) authorized under the Plan is approximately 8,193,088 as of December 31, 2013. Options are generally granted for a term of 10 years and generally vest over a three-year period. the Company has issued RSUs with two different vesting criteria: those RSUs that vest based on the attainment of book value goals and those RSUs that vest based on the attainment of total Shareholder Return (“tSR”) goals. the book-value RSUs generally vest ratably over three to four years, if the performance condition has been met. Book-value RSUs for which the performance metric has not been met are forfeited. the tSR RSUs vest at the end of a three-year period. the number of tSR RSUs that will ultimately vest is based upon the percentile ranking of the Company’s tSR among a peer group. the number of shares that will ultimately vest will range from 0% to 200% of the RSUs initially granted depending on the extent to which the tSR metric is achieved. As of December 31, 2013, the Company had 1,569,005 unvested RSUs outstanding of which 390,511 are tSR RSUs.
the Company recorded $21.6 million, $31.7 million and $39.3 million of stock-based compensation expense for the years ended December 31, 2013, 2012 and 2011, respectively.
Stock optionsthe Company uses the BSM option-pricing model to determine the fair value of stock options. the fair value of stock-based payment awards on the date of grant is determined by an option-pricing model using a number of complex and subjective variables. these variables include expected stock price volatility over the term of the awards, a risk-free interest rate and expected dividends.
estimated volatility of the Company’s common stock for new grants is determined by using historical volatility of the Company’s peer group. Due to our limited operating history at the time of grant, there was no historical exercise data to provide a reasonable basis which the Company could use to estimate expected terms. Accordingly, the Company used the “simplified method” as permitted under Staff Accounting Bulletin no. 110. the risk-free interest rate used in the option valuation model was derived from U.S. treasury zero-coupon issues with remaining terms similar to the expected term on the options. in accordance with ASC topic 718, Compensation—Stock Compensation, the Company

S i X t Y- f i V e
estimated forfeitures at the time of grant and revises those estimates in subsequent periods if actual forfeitures differ from those estimates. During the year ended December 31, 2013 and 2012, the Company did not grant any Stock Options. the average assumptions used to value stock-based payments during the year ended December 31, 2011 are as follows:
Year ended December 31, 2011
Dividend yield noneexpected term 5.9 yearsRisk free interest rate 2.4%Volatility 50.2%
A summary of stock option activity in accordance with the Company’s stock option plan for the year ended December 31, 2013 follows:
Sharesexercise
Price
Remaining Contractual
term (in years)
Aggregate intrinsic Value
(in thousands)(1)
Balance at December 31, 2010 3,225,908 $20.00 9.50 $ — Granted 150,000 $28.80 9.30 — exercised — — — 5 forfeited/canceled — — — 3
Balance at December 31, 2011 3,375,908 $20.39 8.50 $11,968 Granted — — — — exercised (7,000) $20.00 7.50 18 forfeited/canceled (10,500) $20.00 — —
Balance at December 31, 2012 3,358,408 $20.39 7.49 $ 4,813 Granted — — — — exercised (500) $20.00 6.54 5 forfeited/canceled (250) $20.00 — 3
Balance at December 31, 2013 3,357,658 $20.39 6.49 35,883Vested and exercisable as of December 31, 2013 3,357,658 $20.39 6.49 35,883(1) the aggregate intrinsic value is calculated as the difference between the exercise price of the underlying awards and the closing stock price of our
Class A Common Stock as of the respective date.
As of December 31, 2013, all of the Company’s outstanding employee stock options had fully vested and there were no unrecognized compensation costs related to outstanding employee stock options. Stock-based compensation expense related to employee stock options for the years ended December 31, 2013, 2012 and 2011, totaled $5.4 million, $11.8 million and $12.0 million, respectively.

S i X t Y- S i X
the following table summarizes additional information regarding outstanding, exercisable and vested stock options at December 31, 2013:
Options Outstanding
Options exercisable and Vested
Range of exercise Pricesnumber of
Shares
Weighted Average
Remaining Life (in years)
number of Shares
Weighted Average
Remaining Life (in years)
$20.00 3,207,658 6.46 3,207,658 6.46$28.80 150,000 7.32 150,000 7.32
$20.00–$28.80 3,357,658 6.49 3,357,658 6.49
Restricted stock unitsCompensation cost for stock awards is measured at the grant date based on fair value and recognized over the vest-ing period. the fair value of book-value RSUs is determined based on the closing market price of the Company’s Class A Common Stock on the date of grant, while the fair value of tSR RSUs is determined at the grant date using a Monte Carlo simulation model. included in the Monte Carlo simulation model were certain assumptions regarding a number of highly complex and subjective variables, such as expected volatility, risk-free interest rate and expected dividends. to appropriately value the award, the risk-free interest rate is estimated for the time period from the valu-ation date until the vesting date and the historical volatilities were estimated based on a historical timeframe equal to the time from the valuation date until the end date of the performance period. Due to our limited stock history since the completion of our initial public offering on April 25, 2011, historical volatility was estimated based on all available stock history information.
During the year ended December 31, 2013, the Company granted 422,366 RSUs of which 201,058 are tSR RSUs. the following table summarizes the activities for our unvested RSUs for the year ended December 31, 2013:
Unvested Restricted Stock Units
number of Shares
Weighted-Average Grant-Date fair Value
Unvested at December 31, 2012 2,117,510 $21.40 Granted 422,366 $31.96 Vested (959,873) $20.91 forfeited/canceled (10,998) $28.66
Unvested at December 31, 2013 1,569,005 $24.50
expected to vest after December 31, 2013(1) 1,557,046 $24.49
(1) RSUs expected to vest reflect an estimated forfeiture rate.
At December 31, 2013, the outstanding RSUs are expected to vest as follows: 2014—922,485; 2015—273,220; and 2016—88,209. the Company recorded $16.2 million, $19.9 million and $27.3 million of stock-based compensation expense related to RSUs for the years ended December 31, 2013, 2012 and 2011, respectively.
As of December 31, 2013, there was $12.4 million of unrecognized compensation cost, adjusted for estimated forfei-tures, related to unvested stock-based payments granted to employees. total unrecognized compensation cost will be adjusted for future changes in estimated forfeitures and is expected to be recognized over a weighted-average remaining period of 1.1 years.

S i X t Y- S e V e n
NOTE 12. LITIGATIONOn April 24, 2012, the Company was named as a defendant in a complaint filed in Superior Court of the State of California for the County of Los Angeles by American international Group, inc. and iLfC (the “AiG/iLfC Complaint”). the complaint also names as defendants certain executive officers and employees of the Company. American international Group withdrew as a plaintiff on all but one cause of action that is not asserted against the Company.
Among other things, the complaint, as amended, alleges breach of fiduciary duty, misappropriation of trade secrets, the wrongful recruitment of iLfC employees, and the wrongful diversion of potential iLfC leasing opportunities. the complaint seeks an unspecified amount of damages and injunctive relief. the Company believes that it has meritori-ous defenses to these claims and intends to defend this matter vigorously. the amount or range of loss, if any, is not estimable at this time.
On August 15, 2013, the Company filed a cross-complaint against iLfC and AiG. the cross-complaint, as amended, alleges breach of contract for the sale of goods in connection with an agreement entered into by AiG, acting on behalf of iLfC, in January 2010 to sell 25 aircraft to the entity that became Air Lease Corporation. the cross-complaint seeks compensatory damages in excess of $500 million.
NOTE 13. RELATED PARTY TRANSACTIONSin March 2011, we entered into a Servicing Agreement with Commonwealth Bank of Australia and one of its subsidiar-ies. Commonwealth Bank beneficially owns more than 5% of our Class A Common Stock, and one of our directors, ian M. Saines, was Group executive of the institutional Banking and Markets division of Commonwealth Bank through December 2013. Pursuant to the Servicing Agreement, we agreed to arrange the acquisition of an Airbus A320 aircraft on behalf of the subsidiary, to manage the lease of the aircraft to a third-party and subsequent lessees, and if requested by the subsidiary, to remarket the aircraft for subsequent leases or for sale. in connection with this transac-tion, Commonwealth Bank paid us fees for acquiring the aircraft and for collecting the first rent payment under the lease, and will pay us a percentage of the contracted rent and the rent actually paid by the lessee each month. We may earn up to an aggregate of approximately $650,000 in fees under the Servicing Agreement in connection with the acquisition of the aircraft and management of the current lease.
in March 2011, Commonwealth Bank of Australia provided the Company with a three-year unsecured revolving loan of $25.0 million at a rate of LiBOR plus 2.00%.
in March 2011, Commonwealth Bank of Australia provided the Company with a five-year unsecured term loan of $12.0 million at a rate of 4.05%.
in October 2011, Commonwealth Bank of Australia provided the Company with a five-year unsecured term loan of $13.0 million at a rate of 3.48%.
in December 2011, the Company, through a limited liability company of which it is the sole member, entered into a purchase agreement to acquire a corporate aircraft in 2012. the right to purchase the corporate aircraft was formerly held by an unrelated entity controlled by Mr. Udvar-Házy, our Chairman and CeO. the parties conducted this trans-action on an arm’s-length basis. the Company believes, based on independent expert advice, that at the time the Company entered into the purchase agreement, the purchase price of the aircraft was significantly below the then-current fair market value for such aircraft. no financial payment was made, and no financial benefit was received, by Mr. Udvar-Házy.

S i X t Y- e i G H t
in March 2012, we entered into a Syndicated Unsecured Revolving Credit facility under which Commonwealth Bank is a lender. See note 3 of notes to Consolidated financial Statements.
in April 2012, we entered into a Servicing Agreement with Commonwealth Bank of Australia and one of its subsidiaries at terms no more favorable than would be to an unrelated third-party. Pursuant to the Servicing Agreement, we agreed to arrange the acquisition of a Boeing 777 aircraft on behalf of a subsidiary, to manage the lease of the aircraft to a third-party, and if requested by the subsidiary, to remarket the aircraft for subsequent leases or for sale. in connection with this transaction, Commonwealth Bank of Australia paid us fees for acquiring the aircraft and for collecting the first rent payment under the lease, and will pay us a percentage of the contracted rent and the rent actually paid by the lessee each month. We may earn up to an aggregate of approximately $2.7 million in fees under the Servicing Agreement in connection with the acquisition of the aircraft and management of the current lease.
in December 2012, we entered into an agreement with Commonwealth Bank of Australia and one of its subsidiaries for the sale of an Airbus A320-200 at terms no more favorable than would be to an unrelated third-party. in addition, the Company entered into a Servicing Agreement with Commonwealth Bank of Australia to manage the lease of the air-craft to a third-party and subsequent lessees, and if requested by the subsidiary, to remarket the aircraft for subse-quent leases or for sale. in connection with this transaction, Commonwealth Bank of Australia paid us for the aircraft and for collecting the first rent payment under the lease subsequent to the sale, and will pay us a percentage of the contracted rent and the rent actually paid by the lessee each month. We recorded a gain of $1.9 million on the sale of the aircraft and may earn up to an aggregate of approximately $980,000 in fees under the Servicing Agreement in connection with the management of the current lease.
in June 2013, the Company completed a marketed secondary public offering of 8,000,000 shares of its Class A Common Stock held by affiliates of Ares Management LLC, Leonard Green & Partners, L.P. and WL Ross & Co. LLC. the shares of Class A Common Stock were offered to the public at $26.75 per share. the Company did not issue any additional shares of Class A Common Stock and did not receive any proceeds in this transaction. the total number of shares of the Company’s Class A Common Stock outstanding did not change as a result of this offering.
in September 2013, the Company, through a limited liability company of which it is the sole member, entered into a purchase agreement to acquire a corporate aircraft. the right to purchase the corporate aircraft was formerly held by an entity controlled by Mr. Udvar-Házy, our Chairman and CeO, and not affiliated with the Company. the parties con-ducted this transaction on an arm’s-length basis. the Company believes, based on independent expert advice, that at the time the Company entered into the purchase agreement, the purchase price of the aircraft was significantly below the then-current fair market value for such aircraft. the Company reimbursed Mr. Udvar-Házy $6.8 million for deposits he paid to the manufacturer plus interest at a rate of 3.90% per annum.
in november 2013, the Company completed a marketed secondary public offering of up to 10,138,888 shares of its Class A Common Stock held by affiliates of Ares Management LLC, Leonard Green & Partners, L.P. and WL Ross & Co. LLC. the shares of Class A Common Stock were offered to the public at $31.50 per share. the Company did not issue any additional shares of Class A Common Stock and did not receive any proceeds in this transaction. the total number of shares of the Company’s Class A Common Stock outstanding did not change as a result of this offering.

S i X t Y- n i n e
NOTE 14. QUARTERLY FINANCIAL DATA (UNAUDITED)the following table presents our unaudited quarterly results of operations for the two-year period ended December 31, 2013.
Quarter ended
Mar 31, 2012
Jun 30, 2012
Sep 30, 2012
Dec 31, 2012
Mar 31, 2013
Jun 30, 2013
Sep 30, 2013
Dec 31, 2013
(in thousands, except share data)
Revenues $132,553 $158,173 $174,925 $190,095 $191,997 $207,872 $215,905 $242,901income before taxes 41,610 43,884 57,193 61,286 61,672 66,311 74,888 90,571net income 26,927 28,172 37,011 39,809 39,996 42,990 48,578 58,847net income per share: Basic $ 0.27 $ 0.28 $ 0.37 $ 0.39 $ 0.39 $ 0.42 $ 0.48 $ 0.58 Diluted $ 0.26 $ 0.28 $ 0.36 $ 0.38 $ 0.38 $ 0.41 $ 0.46 $ 0.55
the sum of quarterly earnings per share amounts may not equal the annual amount reported since per share amounts are computed independently for each period presented.
NOTE 15. SUBSEQUENT EVENTSOn february 26, 2014, our Board of Directors approved our fifth consecutive quarterly cash dividend of $0.03 per share on our outstanding common stock. the dividend will be paid on April 7, 2014 to holders of record of our common stock as of March 20, 2014.
in february 2014, the Company received full insurance proceeds with respect to the total loss of an aircraft that occurred during 2013.
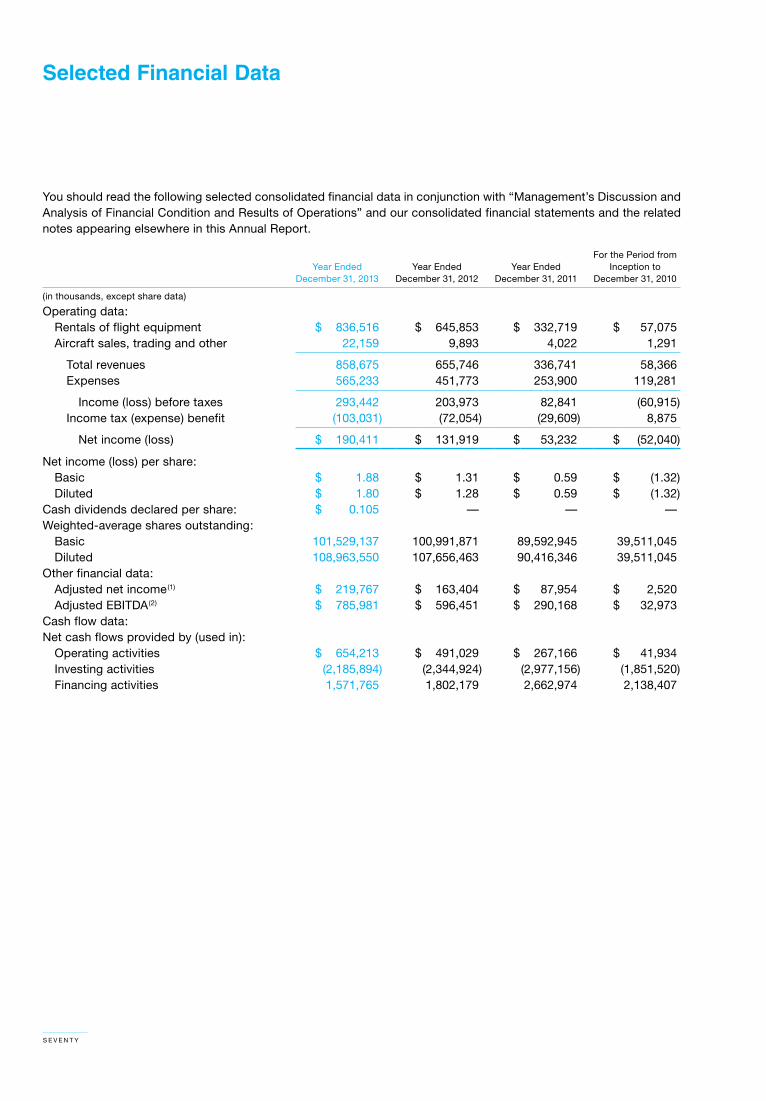
S e V e n t Y
Selected Financial Data
You should read the following selected consolidated financial data in conjunction with “Management’s Discussion and Analysis of financial Condition and Results of Operations” and our consolidated financial statements and the related notes appearing elsewhere in this Annual Report.
Year ended December 31, 2013
Year ended December 31, 2012
Year ended December 31, 2011
for the Period from inception to
December 31, 2010
(in thousands, except share data)
Operating data: Rentals of flight equipment $ 836,516 $ 645,853 $ 332,719 $ 57,075 Aircraft sales, trading and other 22,159 9,893 4,022 1,291
total revenues 858,675 655,746 336,741 58,366 expenses 565,233 451,773 253,900 119,281
income (loss) before taxes 293,442 203,973 82,841 (60,915) income tax (expense) benefit (103,031) (72,054) (29,609) 8,875
net income (loss) $ 190,411 $ 131,919 $ 53,232 $ (52,040)
net income (loss) per share: Basic $ 1.88 $ 1.31 $ 0.59 $ (1.32) Diluted $ 1.80 $ 1.28 $ 0.59 $ (1.32)Cash dividends declared per share: $ 0.105 — — —Weighted-average shares outstanding: Basic 101,529,137 100,991,871 89,592,945 39,511,045 Diluted 108,963,550 107,656,463 90,416,346 39,511,045Other financial data: Adjusted net income(1) $ 219,767 $ 163,404 $ 87,954 $ 2,520 Adjusted eBitDA(2) $ 785,981 $ 596,451 $ 290,168 $ 32,973Cash flow data:net cash flows provided by (used in): Operating activities $ 654,213 $ 491,029 $ 267,166 $ 41,934 investing activities (2,185,894) (2,344,924) (2,977,156) (1,851,520) financing activities 1,571,765 1,802,179 2,662,974 2,138,407

S e V e n t Y- O n e
As of December 31,
2013 2012 2011 2010
(in thousands, except share and aircraft data)
Balance sheet data:flight equipment subject to operating leases (net of accumulated depreciation) $7,613,135 $6,251,863 $4,237,416 $1,629,809total assets 9,332,604 7,353,624 5,164,593 2,276,282total debt 5,853,317 4,384,732 2,602,799 911,981total liabilities 6,809,170 5,021,003 2,988,310 1,051,347Shareholders’ equity 2,523,434 2,332,621 2,176,283 1,224,935Other operating data:Aircraft lease portfolio at period end: Owned 193 155 102 40 Managed 4 4 2 —
(1) Adjusted net income (defined as net income (loss) before stock-based compensation expense and non-cash interest expense, which includes the amortization of debt issuance costs, extinguishment of debt and convertible debt discounts) is a measure of both operating performance and liquidity that is not defined by United States generally accepted accounting principles (“GAAP”) and should not be considered as an alternative to net income, income from operations or any other performance measures derived in accordance with GAAP. Adjusted net income is presented as a supplemental disclosure because management believes that it may be a useful performance measure that is used within our industry. We believe adjusted net income provides useful information on our earnings from ongoing operations, our ability to service our long-term debt and other fixed obligations, and our ability to fund our expected growth with internally generated funds. Set forth below is additional detail as to how we use adjusted net income as a measure of both operating performance and liquidity, as well as a discussion of the limitations of adjusted net income as an analytical tool and a reconciliation of adjusted net income to our GAAP net income and cash flow from operating activities.
Operating Performance: Management and our Board of Directors use adjusted net income in a number of ways to assess our consolidated finan-cial and operating performance, and we believe this measure is helpful in identifying trends in our performance. We use adjusted net income as a measure of our consolidated operating performance exclusive of income and expenses that relate to the financing, income taxes, and capitaliza-tion of the business. Also, adjusted net income assists us in comparing our operating performance on a consistent basis as it removes the impact of our capital structure (primarily one-time amortization of convertible debt discounts) and stock-based compensation expense from our operating results. in addition, adjusted net income helps management identify controllable expenses and make decisions designed to help us meet our cur-rent financial goals and optimize our financial performance. Accordingly, we believe this metric measures our financial performance based on operational factors that we can influence in the short term, namely the cost structure and expenses of the organization.
Liquidity: in addition to the uses described above, management and our Board of Directors use adjusted net income as an indicator of the amount of cash flow we have available to service our debt obligations, and we believe this measure can serve the same purpose for our investors.
Limitations: Adjusted net income has limitations as an analytical tool, and you should not consider it in isolation, or as a substitute for analysis of our operating results or cash flows as reported under GAAP. Some of these limitations are as follows:
• adjusted net income does not reflect (i) our cash expenditures or future requirements for capital expenditures or contractual commitments, or (ii) changes in or cash requirements for our working capital needs; and
• our calculation of adjusted net income may differ from the adjusted net income or analogous calculations of other companies in our industry, limiting its usefulness as a comparative measure.

S e V e n t Y- t W O
the following tables show the reconciliation of net income (loss) and cash flows from operating activities, the most directly comparable GAAP measures of performance and liquidity, to adjusted net income.
Year ended
December 31, 2013
Year ended
December 31, 2012
Year ended
December 31, 2011
for the Period from
inception to
December 31, 2010
(in thousands)
Reconciliation of cash flows from operating activities to adjusted net income: net cash provided by operating activities $ 654,213 $ 491,029 $ 267,166 $ 41,934 Depreciation of flight equipment (280,037) (216,219) (112,307) (19,262) Stock-based compensation (21,614) (31,688) (39,342) (24,044) Deferred taxes (102,636) (72,050) (29,567) 8,875 tax benefits from stock-based compensation arrangements 2,115 — — — Amortization of discounts and deferred debt issue costs (23,627) (16,994) (9,481) (4,883) extinguishment of debt — — (3,349) — Amortization of convertible debt discounts — — — (35,798) Changes in operating assets and liabilities (38,003) (22,159) (19,888) (18,862)
net income (loss) 190,411 131,919 53,232 (52,040) Amortization of discounts and deferred debt issue costs 23,627 16,994 9,481 4,883 extinguishment of debt — — 3,349 — Amortization of convertible debt discounts — — — 35,798 Stock-based compensation 21,614 31,688 39,342 24,044 tax effect (15,885) (17,197) (17,450) (10,165)
Adjusted net income $ 219,767 $ 163,404 $ 87,954 $ 2,520
Year ended
December 31, 2013
Year ended
December 31, 2012
Year ended
December 31, 2011
for the Period from
inception to
December 31, 2010
(in thousands)
Reconciliation of net income (loss) to adjusted net income: net income (loss) $190,411 $131,919 $ 53,232 $(52,040) Amortization of discounts and deferred debt issue costs 23,627 16,994 9,481 4,883 extinguishment of debt — — 3,349 — Amortization of convertible debt discounts — — — 35,798 Stock-based compensation 21,614 31,688 39,342 24,044 tax effect (15,885) (17,197) (17,450) (10,165)
Adjusted net income $219,767 $163,404 $ 87,954 $ 2,520
(2) Adjusted eBitDA (defined as net income (loss) before net interest expense, stock-based compensation expense, income tax expense, and depreciation and amortization expense) is a measure of both operating performance and liquidity that is not defined by GAAP and should not be considered as an alternative to net income, income from operations or any other performance measures derived in accordance with GAAP. Adjusted eBitDA is presented as a supplemental disclosure because management believes that it may be a useful performance measure that is used within our industry. We believe adjusted eBitDA provides useful information on our earnings from ongoing operations, our ability to service our long-term debt and other fixed obligations, and our ability to fund our expected growth with internally generated funds. Set forth below is additional detail as to how we use adjusted eBitDA as a measure of both operating performance and liquidity, as well as a discussion of the limitations of adjusted eBitDA as an analytical tool and a reconciliation of adjusted eBitDA to our GAAP net income (loss) and cash flow from operating activities.
Operating Performance: Management and our Board of Directors use adjusted eBitDA in a number of ways to assess our consolidated finan-cial and operating performance, and we believe this measure is helpful in identifying trends in our performance. We use adjusted eBitDA as a measure of our consolidated operating performance exclusive of income and expenses that relate to the financing, income taxes, and capital-ization of the business. Also, adjusted eBitDA assists us in comparing our operating performance on a consistent basis as it removes the impact of our capital structure (primarily one-time amortization of convertible debt discounts) and stock-based compensation expense from our operating results. in addition, adjusted eBitDA helps management identify controllable expenses and make decisions designed to help us meet our current financial goals and optimize our financial performance. Accordingly, we believe this metric measures our financial performance based on operational factors that we can influence in the short term, namely the cost structure and expenses of the organization.

S e V e n t Y- t H R e e
Liquidity: in addition to the uses described above, management and our Board of Directors use adjusted eBitDA as an indicator of the amount of cash flow we have available to service our debt obligations, and we believe this measure can serve the same purpose for our investors.
Limitations: Adjusted eBitDA has limitations as an analytical tool, and you should not consider it in isolation, or as a substitute for analysis of our operating results or cash flows as reported under GAAP. Some of these limitations are as follows: • adjusted eBitDA does not reflect our cash expenditures or future requirements for capital expenditures or contractual commitments; • adjusted eBitDA does not reflect changes in or cash requirements for our working capital needs; • adjusted eBitDA does not reflect interest expense or cash requirements necessary to service interest or principal payments on our debt; and • other companies in our industry may calculate these measures differently from how we calculate these measures, limiting their usefulness as
comparative measures.
the following tables show the reconciliation of net income (loss) and cash flows from operating activities, the most directly comparable GAAP measures of performance and liquidity, to adjusted eBitDA.
Year ended
December 31, 2013
Year ended
December 31, 2012
Year ended
December 31, 2011
for the Period from
inception to
December 31, 2010
(in thousands)
Reconciliation of cash flows from operating activities to adjusted eBitDA: net cash provided by operating activities $ 654,213 $ 491,029 $267,166 $ 41,934 Depreciation of flight equipment (280,037) (216,219) (112,307) (19,262) Stock-based compensation (21,614) (31,688) (39,342) (24,044) Deferred taxes (102,636) (72,050) (29,567) 8,875 tax benefits from stock-based compensation arrangements 2,115 — — — Amortization of discounts and deferred debt issue costs (23,627) (16,994) (9,481) (4,883) extinguishment of debt — — (3,349) — Amortization of convertible debt discounts — — — (35,798) Changes in operating assets and liabilities (38,003) (22,159) (19,888) (18,862)
net income (loss) 190,411 131,919 53,232 (52,040) net interest expense 190,888 144,571 55,678 50,582 income taxes 103,031 72,054 29,609 (8,875) Depreciation 280,037 216,219 112,307 19,262 Stock-based compensation 21,614 31,688 39,342 24,044
Adjusted eBitDA $ 785,981 $ 596,451 $290,168 $ 32,973
Year ended
December 31, 2013
Year ended
December 31, 2012
Year ended
December 31, 2011
for the Period from
inception to
December 31, 2010
(in thousands)
Reconciliation of net income (loss) to adjusted eBitDA: net income (loss) $190,411 $131,919 $ 53,232 $(52,040) net interest expense 190,888 144,571 55,678 50,582 income taxes 103,031 72,054 29,609 (8,875) Depreciation 280,037 216,219 112,307 19,262 Stock-based compensation 21,614 31,688 39,342 24,044
Adjusted eBitDA $785,981 $596,451 $290,168 $ 32,973

S e V e n t Y- f O U R
Leadership Team
ExEcutivE LEadErship
Steven f. Udvar-Házy Chairman and Chief Executive Officer
John L. Plueger President and Chief Operating Officer
MarkEting and coMMErciaL affairs
Marc Baer Executive Vice President
Jie Chen Executive Vice President
Alex A. Khatibi Executive Vice President
Grant Levy Executive Vice President
Kishore Korde Senior Vice President
Michael Bai Vice President
Chi Yan Vice President
LEgaL
Carol forsyte Executive Vice President, General Counsel, Corporate Secretary, and Chief Compliance Officer
toby MacCary Senior Vice President and Corporate Counsel
Robert C. Mcnitt, Jr. Senior Vice President and Corporate Counsel
Jenny Van Le Vice President and Corporate Counsel
Czar Vigil Vice President and Corporate Counsel
financE and accounting
Gregory B. Willis Senior Vice President and Chief Financial Officer
Ardy Ghanbar Vice President and Controller
Sabrina Lemmens Assistant Vice President and Assistant Controller
stratEgic pLanning & invEstor rELations
Ryan McKenna Vice President
tEchnicaL assEt ManagEMEnt
Pierce Chang Vice President
eric Hoogenkamp Assistant Vice President
aircraft procurEMEnt and spEcification
John Poerschke Senior Vice President
Ozzie Chraibi Vice President
Lance Pekala Assistant Vice President
coMMErciaL contracts
Sara evans Vice President
Stephanie Brimmer Assistant Vice President
huMan rEsourcEs & officE ManagEMEnt
Courtney McKeown Assistant Vice President
Board of dirEctors
Steven f. Udvar-Házy Chairman and Chief Executive Officer
John L. Plueger President and Chief Operating Officer
Robert A. Milton Lead Independent Director; Chairman, Governance Committee; Audit Committee; Compensation Committee
Matthew J. Hart Chairman, Audit Committee; Governance Committee
Ronald D. Sugar Chairman, Compensation Committee; Governance Committee
Cheryl Gordon Krongard Compensation Committee
ian M. Saines Audit Committee

Transfer agenT
American Stock Transfer & Trust Company, LLC 6201 15th Avenue Brooklyn, NY 11219 877.833.6643 www.amstock.com
IndependenT regIsTered publIc accounTIng fIrm
KPMG LLP 55 Second Street, Suite 1400 San Francisco, California 94105 415.963.5100 www.kpmg.com
annual meeTIng
May 7, 2014 7:30 AM Pacific Time Century Plaza Towers 2029 Century Park East Los Angeles, California 90067 Concourse Level, Conference Room A
corporaTe HeadquarTers
Air Lease Corporation 2000 Avenue of the Stars Suite 1000N Los Angeles, California 90067 310.553.0555
Please visit www.airleasecorp.com to view or download a PDF of this annual report.
sTock excHange lIsTIng
New York Stock Exchange (Symbol: AL)
form 10-k and oTHer reporTs
Shareholders may receive a copy of the 2013 Form 10-K and other reports we file with the Securities and Exchange Commission, without charge by writing to:
Air Lease Corporation 2000 Avenue of the Stars Suite 1000N Los Angeles, California 90067
Or by E-mail to: [email protected]
Corporate Information

2000 Avenue of the Stars
Suite 1000N
Los Angeles, CA 90067 USA
www.airleasecorp.com